INTRODUCTION
Sugarcane is an important forage resource in sub-tropical and tropical areas, as it is used during the winter or dry season when the growth rate of pastures is significantly reduced (Preston Reference Preston1977). Previous studies found that supplemented steers fed with sugarcane tops had higher intake (26 v. 17 g/kg liveweight (LW)) and weight gain (839 v. 605 g/head/day) than steers fed with the stalks of sugarcane (Ferreiro & Preston Reference Ferreiro and Preston1976). However, these early studies were conducted with steers of only one age group, and the canes were separated into only two vertical sections (tops and stalks). Considering that there may be a gradual change in forage quality, such as fibre and energy content, from top to bottom of the canes, it is likely that intake and animal performance follow the same pattern of change as found for other forage crops (Aoki et al. Reference Aoki, Oshita, Namekawa, Nemoto and Aoki2013). Since older animals can apply a greater bite force than young animals (Benvenutti et al. Reference Benvenutti, Gordon, Poppi, Crowther and Spinks2008), it is likely that the reduction of intake and animals’ performance from top to bottom of the sugarcane may be more pronounced in younger animals due to the presence of tougher material at the bottom of the plant. Therefore, there is a need to study in more detail the effect of sugarcane vertical differentiation on the ingestive behaviour and forage intake by cattle of different age groups.
Recent studies have shown that it is possible to graze fully grown sugarcane with satisfactory animal performance and without affecting the persistence of the plantations (Benvenutti et al. Reference Benvenutti, Pavetti and Moreno2005; Benvenutti & Pavetti Reference Benvenutti and Pavetti2010). These studies found that there was no significant difference in weight gain between steers grazing sugarcane and steers consuming chopped sugarcane from troughs in pens. However, this weight gain was achieved with moderate levels of forage utilization in the fields, i.e. approximately 54% utilization of the whole crop. Considering the typical high yield of sugarcane, this level of utilization leaves a large amount of unutilized residue. While a higher level of utilization of sugar cane would be beneficial in terms of stocking rate and animal production per hectare, the potential effect on forage intake and thus on individual animal performance is currently unknown. Studies conducted with tropical pastures found an asymptotic relationship between pasture utilization and daily forage intake or intake rate in rotational grazing systems (Silva Reference Silva2004; Da Silva & Carvalho Reference Da Silva, Carvalho and McGilloway2005; Fonseca Reference Fonseca2012; Benvenutti et al. Reference Benvenutti, Pavetti, Poppi, Gordon and Cangiano2016). This relationship is the result of the grazing behaviour response of cattle to the change of sward structure as defoliation progresses. Despite the decrease in bite mass with declining pasture height, the animals are able to compensate by increasing grazing time and, therefore, maintaining daily intake at lower levels of utilization; this compensatory mechanism is reduced at higher levels of pasture utilization, resulting in lower intake and animal performance.
The aim of the current research study was to assess the effect of four vertical sections of sugarcane in a pen trial, and the level of sugarcane utilization in a grazing trial, on the ingestive behaviour and forage intake of two age groups of steers.
MATERIALS AND METHODS
Experimental procedure
This research was conducted at INTA Cerro Azul Experimental Station in Argentina on an ultisol soil (27°37′N; 55°26′E, 287 m asl). The average annual rainfall and temperature of this location are 2067 mm and 20·8 °C, respectively. The study consisted of one pen trial and one grazing trial conducted during winter using fully grown sugarcane, variety TUC7742.
Experimental design
Pen study
Two groups of four Brahman cross steers of 219 ± 5·6 kg (1 year old) and 342 ± 6·4 kg (2 years old) were used. The steers were kept in individual pens and fed chopped mature sugarcane ad libitum in feeding troughs in the morning. The particle size of the chopped sugarcane was approximately 30 cm. The steers were supplemented with 900 g (as-fed) of soybean meal before the sugarcane was offered in the morning.
The experiment consisted of two simultaneous 4 × 4 balanced Latin square designs (one for each age group of animals) of four feeding treatments, four periods and four animals. The feeding treatments consisted of four equal vertical sections of sugarcane. Each vertical section will be referred to as bottom, lower middle, upper middle and top vertical sections. To achieve these treatments, the sugarcane was freshly harvested each morning from the field and each cane was manually cut into four vertical sections. The height to the ligule of the top fully expanded leaf was used as the length reference to cut each cane into the four sections. Each of the four periods consisted of 10 days. Forage intake and ingestive behaviour were measured during the last 4 days of each period as described below to allow the animals to adapt to the current diet. In order to adapt the steers to sugarcane diets, the animals were fed chopped mature sugarcane ad libitum supplemented with 900 g (as-fed) of soybean meal per animal per day for 3 weeks prior to the start of the pen study. All procedures involving animals were conducted in accordance with the guide for the care and use of animals in agricultural research and teaching (FASS 2010) approved by the Federation of Animal Science Societies Committee.
A Latin square design was used as it is an accepted design for forage intake studies in confinement (Burns et al. Reference Burns, Pond, Fisher and Fahey1994). The potential issue with this design is the potential carry-over effects between periods; therefore, a balanced design was chosen so that carry-over effects could be tested for (Morris Reference Morris and Morris1999). These tests were possible because in the balanced design each treatment followed every other treatment in subsequent experimental periods. To avoid carry-over effects, the adaption periods needs to be long enough to achieve stable intake, which may take 10–15 days if the animals are not familiar with the feed (Blaxter et al. Reference Blaxter, Wainman and Wilson1961). However, the adaption period can be reduced for forage intake studies when the animals are already well adapted to the type of feed (Baumont et al. Reference Baumont, Chenost, Demarquilly and Penning2004). In the current study, as indicated above, the animals were adapted to sugarcane diets for 3 weeks before the start of the experiment. Therefore, since the animals were already well adapted to sugarcane diets before the experiment started, 6 days were used for the animals to further adjust to each feeding treatment within each experimental period. This was thought to be adequate in the context of this particular study (see also Discussion).
Additionally, due to the variability in forage intake typically observed between days, the length of the intake measurement period may affect the error of the measurement. Blaxter et al. (Reference Blaxter, Wainman and Wilson1961) found that measurement periods of 10–15 days resulted in measurement errors of about ±2%. However, the results may not be of great value if during these periods significant changes occur in chemical composition, stage of growth and digestibility of herbage (Baumont et al. Reference Baumont, Chenost, Demarquilly and Penning2004). Therefore, since fresh sugarcane was used for the current study, periods of 4 days were chosen to measure forage intake and avoid significant changes in the composition of sugarcane during the study. Again, this was thought to be adequate in the context of this particular study (see also Discussion).
Grazing study
Three plots (6 × 24 m) of fully grown sugarcane were grazed down for 9 days by Brahman cross steers of 217 ± 5·3 kg (1 year old) and 339 ± 6·1 kg (2 years old). Each paddock was grazed by eight steers, four animals from each age group. The steers were individually supplemented with 900 g (as-fed) of soybean expeller in the morning.
Forage intake and defoliation dynamics
Pen study
Dry matter (DM), neutral detergent fibre (NDF) and acid detergent fibre (ADF) intake were determined as the difference between the feed offered and refused. The ingredients offered and refused were sampled daily and later bulked per experimental period for subsequent laboratory analysis.
In order to explain possible differences in forage intake and mastication efficiency between age groups of steers, the occlusal surface area of molars was measured using dental plaster following the method described by Perez-Barberia & Gordon (Reference Perez-Barberia and Gordon1998). Mastication efficiency was calculated as g DM intake (DMI) per hour of total chewing time and cm2 of occlusal surface area.
Grazing study
Herbage mass was measured six times during the grazing-down period, i.e. pre-grazing and then every 2 days from the second day after the animals entered the paddocks. Daily forage intake across all individuals and age classes in a paddock was calculated as the difference in herbage mass on consecutive assessment days (Penning Reference Penning and Penning2004) divided by the number of animals and days between assessments.
Herbage mass was measured using a double sampling method (Penning Reference Penning and Penning2004) adapted from Benvenutti et al. (Reference Benvenutti, Pavetti, Poppi, Gordon and Cangiano2016) that follows a three-step procedure:
Step 1, Initial pre-grazing herbage mass: before the animals entered the grazing area, a total of nine 2 m lineal plots of canes were measured in each paddock. The height to the ligule of the top fully expanded leaf and the diameter, measured at half way from the top, of all canes within the plots were recorded and used to calculate cane volume (cm3 per cane). Equations (1) and (2) from step 2 were then used to estimate initial herbage mass for each paddock from their average cane volume and population.
Step 2, Calibration equations: a total of 54 canes (18 per paddock), representing the full range of cane heights measured in step 1, were cut at ground level and then further cut into four equal vertical sections to determine the vertical distribution of DM. Each vertical section was then dried and ground as indicated below. Prior to cutting, the height and diameter of each cane were measured as indicated in step 1 and later used to calculate the volume of each cane. Linear regressions, relating cane volume and herbage mass per cane were then calculated as:
 $$\eqalign{&{\rm Herbage}\;{\rm mass}({\rm g}\;{\rm DM}\;{\rm per}\;{\rm cane}) \, {\rm =} \, a \cr & \quad \times {\rm cane}\;{\rm volume(cm}^{\rm 3} \;{\rm per}\;{\rm cane)} + b}$$
where a and b were the coefficients of the linear model.
Cane volume was used in Eqn (1) because it provided more accurate estimates of herbage mass per cane than cane height. Herbage mass per hectare was then calculated as:
 $$\eqalign{{\rm Herbage} & \;{\rm mass(kg}\;{\rm DM/ha)} = {\rm no}{\rm.} \;{\rm canes}\;{\rm per}\;{\rm ha} \cr & \quad {\rm \times \,\,herbage}\;{\rm mass}\;{\rm per}\;{\rm cane(kg}\;{\rm DM)}} $$
Herbage mass and height of each of the four vertical sections were used to determine the relative vertical distribution of herbage mass within the canopy. Quadratic regressions were calculated to relate cane height (CH; as a proportion of average cane height) and vertical accumulated herbage mass from the base of the plant (VAHM; as a proportion of total herbage mass):
 $${\rm VAHM} = a \times {\rm CH}^2 + b \times {\rm CH} + c$$
where a, b and c were the coefficients of the quadratic model.
Equation (3) was later used to determine herbage mass during the progressive defoliation of the pasture as explained below in step 3.
Step 3, Residual herbage mass during the grazing process: a total of 300 canes (100 per paddock), representing the full range of cane heights measured in step 1, were tagged. Before grazing, the height, diameter and volume of each cane were recorded. During the defoliation process, the residual height of these canes was measured every 2 days from the second day of the trial. Residual sugarcane height for each paddock was then calculated as the average cane height. The VAHM (as a proportion of total herbage mass) was calculated based on the residual sugarcane height using Eqn (3). The residual herbage mass during the defoliation process for each paddock was then calculated based on the initial forage herbage mass from step 1 and VAHM.
Defoliation dynamics were monitored by calculating the vertical and horizontal utilization of grazing strata. The grazing stratum was defined as the vertical section of the canes grazed by the animals. The top grazing stratum was then the vertical section of the canes that was grazed for the first time. A new grazing stratum was formed every time the animals re-graze the same canes, leading to multiple superimposed grazing strata. Therefore, each grazing stratum had a vertical dimension, which was its depth, but also a horizontal dimension, which was its progressive utilization across the area of the paddock. Grazing strata should not be confounded with the four vertical section cuts to establish the vertical distribution of the herbage mass in step 2. As per the definition, grazing strata were created by the animals as they grazed down the sugarcane. For example, if the animals grazed the top 90 cm of the canes in the first grazing event then the depth of the top grazing stratum was 90 cm. The depth of each grazing stratum was calculated as the difference in cane height before and after the stratum was grazed from step 3. The level of the horizontal utilization of each grazing stratum (as a proportion of the paddock area) was calculated from the proportion of grazed canes in relation to the total number of canes assessed in step 3.
Ingestive behaviour
Pen and grazing trials
Grazing and ruminating time were measured using the acoustic method described by Benvenutti et al. (Reference Benvenutti, Pavetti, Poppi, Gordon and Cangiano2016) and validated by Da Trindade et al. (Reference Da Trindade, Carvalho, Neves, Pinto, Gonda, Nadin and Correia2011). A voice recorder (Philips voice tracer 620), attached to a halter, was used on each animal. An external microphone connected to the recorder was placed inside a waterproof capsule, which was in direct contact with the left side of the lower jaw of the animal. Every morning the recording data were retrieved and later digitalized using Cool Edit Pro version 2 software (Syntrillium Software Corporation 2002). As indicated by Da Trindade et al. (Reference Da Trindade, Carvalho, Neves, Pinto, Gonda, Nadin and Correia2011) and Benvenutti et al. (Reference Benvenutti, Pavetti, Poppi, Gordon and Cangiano2016), grazing and rumination sound patterns were clearly distinctive. The regular chewing pattern of rumination resulted in regular sound peaks of low intensity, with short periods of silence between deglutition and regurgitation of boluses. The sound of handling, tugging and/or chewing the plant material during feeding or grazing resulted in irregular peaks of high intensity. Visualization of the digitalized acoustic signal allowed for the identification and measurement of daily ingesting or grazing and rumination time.
Chemical analysis
Pen and grazing trials
The samples of feed offered and refused were dried in a forced draft oven at 60 °C for 48 h before weighing and then grinding through a 1 mm sieve. This temperature was used as required for the chemical analysis of the plant material and constant weight had been achieved. Crude protein (CP) concentration was determined using the Kjeldahl method by AOAC (1998). Neutral detergent fibre and ADF content of the samples were determined using the method by Van Soest et al. (Reference Van Soest, Robertson and Lewis1991). Water-soluble carbohydrates and DM digestibility were determined using the methods of Hall et al. (Reference Hall, Hoover, Jennings and Webster1999) and Tilley & Terry (Reference Tilley and Terry1963), respectively.
Statistical analysis
All variables were analysed in GenStat (2016), using analysis of variance followed by protected least-significant difference testing between the treatment means. The pen study was analysed under a balanced Latin square design, with the animal pen as the experimental unit. Preliminary analyses tested for carry-over effects of treatments, but as these were not significant they were omitted from the final model. This indicates that the periods used in the current trial were sufficiently long to avoid carry-over effects between periods.
For the grazing trial, the herd paddock was the experimental unit, with some variables being measured across time. Residual sugarcane height declined over time. Regressions over time were fitted for the response variables, primarily with residual sugarcane height as the explanatory (X) variable. For each response variable, the form of the regression model was chosen by considering both the degree of fit and the biological expectation. Quadratic, split-line, logistic and exponential models were used, as appropriate.
RESULTS
Forage quality
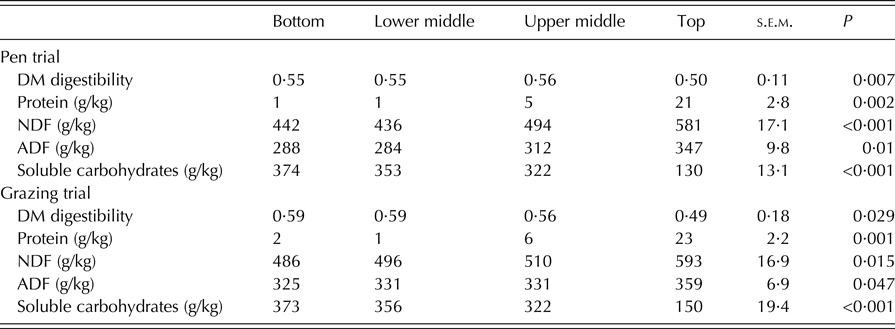
There was a significant difference in the nutritive value between the vertical sections of the sugarcane for all forage quality variables in both trials (P ⩽ 0·05) (Table 1). The digestibility and content of soluble carbohydrates of the top section was the lowest of all sections (P ⩽ 0·05). Consistently, the NDF and ADF contents of the top section, which included the leaf, were the highest of all sections (P ⩽ 0·05). Crude protein was low for all sections; therefore, the protein meal provided most of the protein required to cover the animals’ requirements.
Forage quality of four vertical sections of equal length of sugarcane in pen and grazing trials. Mean of four periods in the pen study and three individual paddocks in the grazing trial

DM, dry matter; NDF, neutral detergent fibre; ADF, acid detergent fibre.
Forage intake, ingestive behaviour and defoliation dynamics
Pen trial
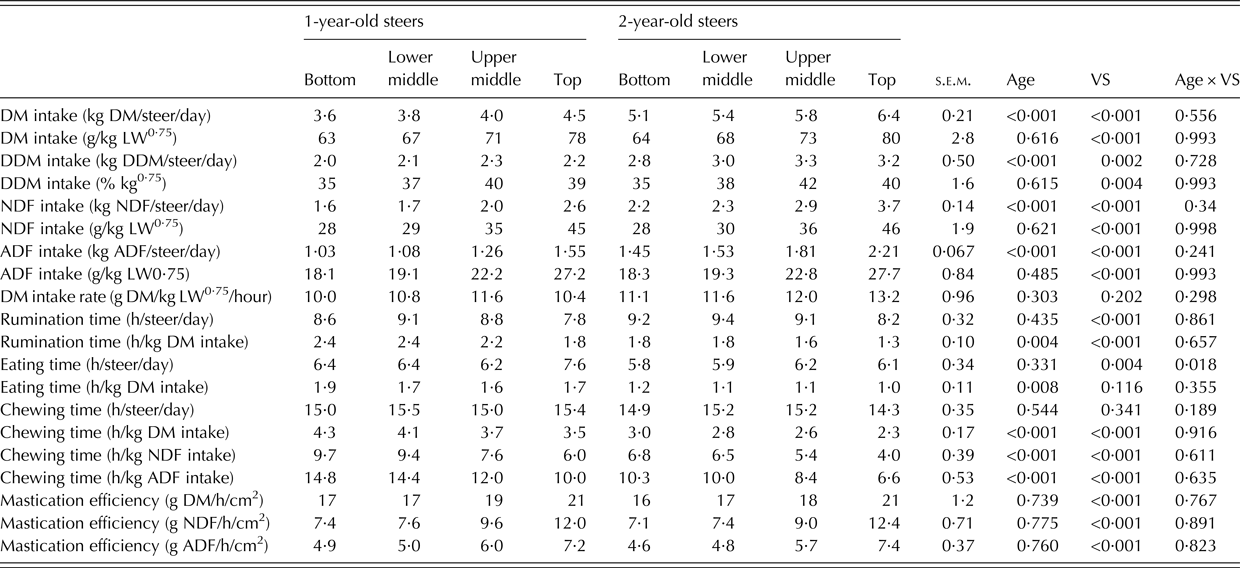
Forage intake and ingestive behaviour variables are presented in Table 2. There was no significant age × feeding treatment interaction for any of the ingestive behaviour or forage intake variables (Table 2), except eating time (hours/steer/day) (P = 0·020), indicating that in general the response to changes in the vertical sections of the sugarcane was similar for both age groups of steers. As expected, mature steers consumed larger amounts of DM per day than young steers (P ⩽ 0·001), but there was no significant difference in DM or digestible DM (DDM) intake per kilogram of metabolic weight between age groups of animals.
The effect of four sugarcane vertical sections (VS) on the ingestive behaviour and forage intake of steers of two age groups in the pen trial
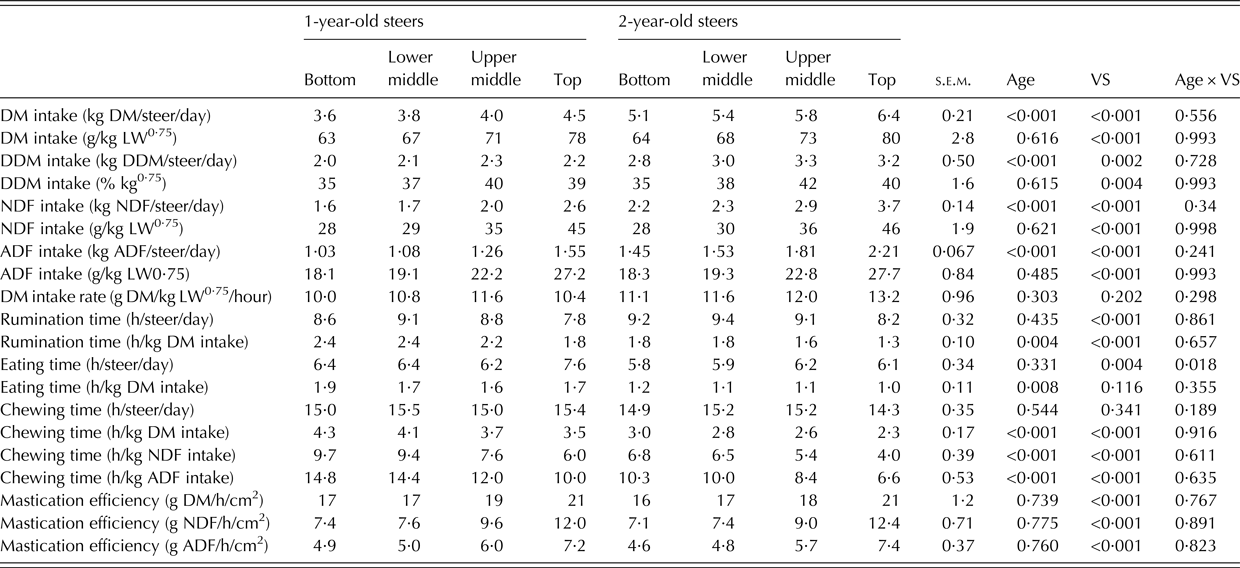
DM, dry matter; LW, liveweight; DDM, digestible dry matter; NDF, neutral detergent fibre; ADF, acid detergent fibre.
Dry matter intake and DDM intake per animal or per kilogram of metabolic weight decreased significantly from top to bottom of the sugarcane in both age groups (P ⩽ 0·001) (Table 2). This decline in forage intake was not explained by the intake of NDF (as a proportion of LW) as this variable also decreased from top to bottom of the sugarcane (P ⩽ 0·001). The average NDF intake, across age groups, for the bottom and top sections were 6·8 and 11·3 g/kg LW.
There were no significant differences in total chewing time per day (eating + rumination time) between sugarcane vertical sections for either age group. Steers spent about 15 h total chewing time irrespective of age group or feeding treatment. However, total chewing time per kilogram of DM, NDF or ADF increased significantly from top to bottom of the sugarcane in both age groups (P ⩽ 0·001). It took approximately three additional hours of total chewing time per kilogram of NDF for the bottom section in comparison to the top section for both groups of animals.
Despite the young animals spending more total chewing time per kilogram of DM, NDF or ADF than the mature steers, there was no significant difference in mastication efficiency between groups. Indeed, both young and mature steers processed the same amount of DM of each vertical section of sugarcane per hour of total chewing time and per unit of molar occlusal surface area. However, mastication efficiency declined strongly from top to bottom of the sugarcane for both age groups (P ⩽ 0·001).
Grazing trial
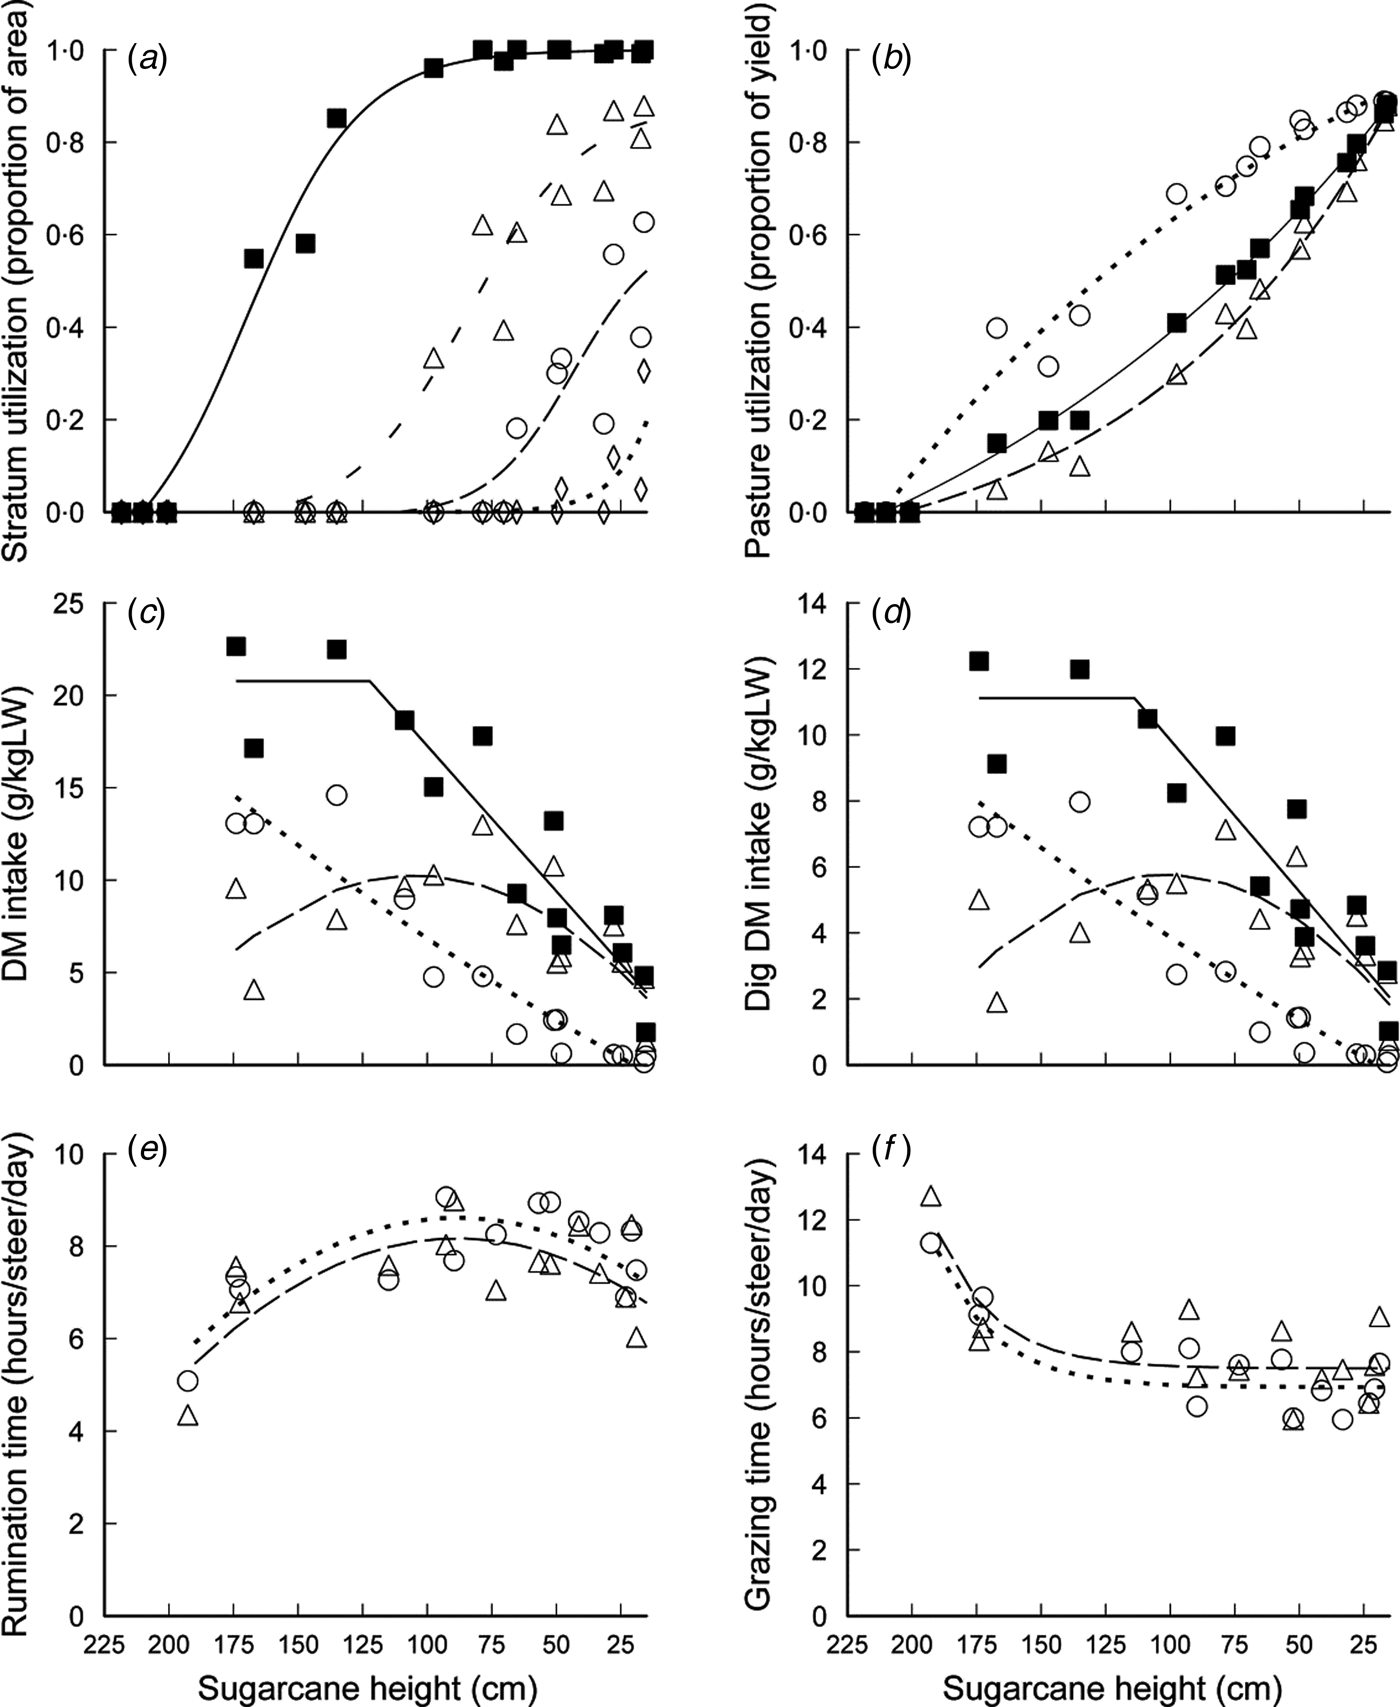
The steers grazed up to four distinctive superimposed grazing strata (Fig. 1(a), Tables 3 and 4). The lower strata were grazed only when the top grazing stratum became heavily depleted. The depth of the grazing strata decreased from top to bottom of the sugarcane. The average depths of the first (top), second, third and fourth grazing strata were 94, 65, 42 and 23 cm, respectively.
Utilization of grazing strata (as a proportion of the total paddock area), dry matter (DM) utilization, DM and digestible DM (DDM) intake, rumination time and grazing time during progressive defoliation of sugarcane. Symbols: (a) grazing strata numbered 1–4 from top to bottom of the sugarcane: stratum 1 (top grazing stratum) (■, solid line), stratum 2 (∆, short dashed line), stratum 3 (○, long dashed line) and stratum 4 (◊, dotted line); (b), (c) and (d) total DM utilization or intake (■, solid lines), utilization or intake of canes with diameters smaller (○, dotted lines) or larger (∆, long dashed lines) than 16 mm; (e) and (f) rumination or grazing time of 1-year-old (∆, dotted lines) and 2-year-old steers (○, long dashed lines). See equations in Tables 3 and 4.

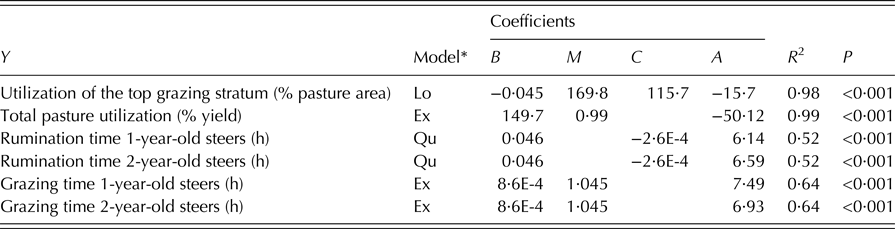
Non-linear regressions between variables for the grazing trial and residual sugarcane height (RSH)

* Qu: quadratic, y = A + B × RSH + C × RSH2; Ex: exponential, y = A + B × M RSH; Lo: logistic, y = A + C/(1 + exp−B × (RSH−M)).
Split-line regressions between forage intake and residual sugarcane height (RSH) (cm) during the grazing trial of curves shown in Fig. 1. Lines to the left and right of the breakpoint

DM, dry matter; LW, liveweight; DDM, digestible liveweight.
* y = A + B × RSH.
The average diameter of sugarcanes was 16 mm and varied between 11 and 25 mm. The steers seemed to prefer thinner canes. At low levels of sugarcane utilization, steers consumed a larger mass of thin canes (<16 mm in diameter) and a lower mass of thick canes (>16 mm in diameter) (Figs 1(b), (c) and (d)). Steers consumed a larger mass of thick canes only when thin canes become heavily depleted.
There was a significant split-line relationship (P < 0·001) between residual sugarcane height measured over the grazing period and average DMI and DDM intake across all individuals and age classes in a paddock (Figs 1(c) and (d)). The breakpoints of DMI and DDM intake, where they started to decline, occurred when the residual sugarcane height was 122 and 113 cm, respectively. The breakpoint for decline in DDM intake occurred when the top grazing stratum was removed in 0·92 of the paddock area (Fig. 1(a)) and 0·33 of the total DM was utilized (Fig. 1(b)).
The average total chewing time per day was approximately 15 h for both groups of animals over the grazing down period. Rumination time per day increased significantly as defoliation progressed (P < 0·001) (Fig. 1(e)). Longer rumination time occurred at high levels of pasture utilization, when steers were consuming lower grazing strata. There was a significant decline of grazing time as defoliation progressed (P < 0·001) (Fig. 1(f)). While there were no significant differences between the ages in these relationships, ages are shown in Fig. 1 separately for full information.
DISCUSSION
Feed nutritive value
The top section of sugarcane had lower digestibility and lower content of soluble carbohydrate but higher content of CP, NDF and ADF in comparison to the rest of the vertical sections in both trials. These results are consistent with those of previous studies where sugarcane tops had more CP (56 v. 32 g/kg), more crude fibre (320 v. 260 g/kg) (McDowell et al. Reference McDowell, Conrad, Thomas and Harris1974), less sugar (72 v. 152 Brixs g/kg in juice) and less digestibility (0·55 v. 0·62) (Ferreiro et al. Reference Ferreiro, Preston and Sutherland1977) than the stalks of sugarcane. Crude protein was low for all sections; therefore, the protein meal provided most of the protein required to cover the requirements of the animals.
Forage intake, feeding behaviour and defoliation dynamics
Pen trial
The higher DMI for the top section of the sugarcane observed for both groups of animals in the pen trial is consistent with the results from previous studies. Ferreiro & Preston (Reference Ferreiro and Preston1976) found that intake of sugarcane tops which include the leaves was higher than stalks (26 v. 17 g DM/kg LW). This difference in forage intake between vertical sections was not explained by the intake of NDF (as a proportion of LW), as this variable also decreased from top to bottom of the sugarcane (P ⩽ 0·001). On average, the daily NDF intake of the bottom section was 40% lower than the top section (6·8 v. 11·3 g/kg LW for the bottom and top sections, respectively), suggesting that fibre content was not the only factor regulating DMI. Instead it is likely that the toughness of the plant material played a major role in limiting intake.
The observed difference in DMI between vertical sections could be explained by the possible lower retention time in the rumen of the top leafier sections in comparison to the more lignified, ‘stalkier’ bottom sections of sugarcane. Poppi et al. (Reference Poppi, Minson and Ternouth1981a , Reference Poppi, Minson and Ternouth b ) found that higher intake of leaves in comparison to stems was associated with lower retention time of leaves in the rumen. This higher retention time of stems is probably partially due to the longer chewing time required to reduce the particle size of stems to the critical size to pass from the rumen and make way for new material to be ingested, limiting intake (Illius & Gordon Reference Illius and Gordon1991). In the present pen study, the bottom section of sugarcane required approximately three additional hours of total chewing time per kilogram of NDF in comparison with the top section, for both groups of animals. These results strongly suggest a much longer retention time for the bottom sections, which probably led to their lower intake. The results also indicate that it is the characteristics of NDF, i.e. fragility or toughness, rather than its quantity, that played a major role in regulating differences in DMI between vertical sections. Feeding these plant parts in pens eliminated harvesting constraints under grazing as a factor regulating intake (Poppi et al. Reference Poppi, Hughes, L'Huillier and Nicol1987), which was examined as a separate issue in the grazing experiment.
The steers did not increase their daily total chewing time when consuming bottom sections of the sugarcane, where they had a lower efficiency of masticating and therefore could not minimize the difference in DMI between the vertical sections. Both young and mature steers spent about 15 h per day chewing time for all vertical sections, suggesting this is an upper limit for their chewing. Because the bottom sections required more processing time per kilogram of plant material, then DMI for these sections was lower.
The response to treatments was the same for both age groups of animals. There were no significant differences in DMI or DDM intake per kilogram of metabolic weight between groups of animals. Moreover, the interaction between age groups and feeding treatments was not significant for any intake variables. This indicates that the reduction of intake from top to bottom of sugarcane was similar for both age groups. Therefore, the tougher bottom sections of sugarcane did not impose greater intake restriction on young steers than it did for mature steers. A previous study found that younger steers applied lower bite force than mature steers in grazing situations (Benvenutti et al. Reference Benvenutti, Gordon, Poppi, Crowther and Spinks2008), whereas the current results indicated that mastication efficiency did not differ between age groups in the pen trial. No significant difference in mastication efficiency was found between young and mature steers, which could explain this lack of difference in intake between groups of animals.
The observed differences in forage intake between treatments were solely due to the effect of each feeding treatment on intake, as there was no carry-over effect between experimental periods. This indicates that the adaption periods of 6 days used in this trial were sufficiently long to remove carry-over effects between measurement periods. This was achieved because the animals were already well adapted to sugarcane diets before the start of the experiment. Similarly, Baumont et al. (Reference Baumont, Chenost, Demarquilly and Penning2004) found that adaption periods could be reduced to 7 days for forage intake studies when the animals were already well adapted to the grass.
It is likely that the relatively short measurement periods of 4 days may have affected the accuracy of the intake measurements but not the observed trend of intake. Due to the variability in forage intake typically observed between days, the shorter the measurement period the larger the error associated with the measurement is likely to be. For example, Blaxter et al. (Reference Blaxter, Wainman and Wilson1961) found that measurement periods of 10–15 days resulted in measurement errors of about ±2%. As indicated in the Materials and methods section, measurement periods of 4 days were chosen in the current work to avoid significant changes in sugarcane composition during the study; for the same reason Baumont et al. (Reference Baumont, Chenost, Demarquilly and Penning2004) used periods of 6 days. These relatively short periods are likely to result in measurement errors >2%. Longer measurement periods may have resulted in lower errors for the current study, but it is highly unlikely that the observed trend in forage intake would have been different. Therefore, it is highly likely that the observed trend of decline in forage intake from top to bottom of the sugarcane would have been also observed with a longer measurement period.
Grazing trial
The steers grazed up to four distinctive superimposed grazing strata. The lower strata were grazed only when the top grazing stratum became heavily depleted. The top grazing stratum was deeper than the bottom grazing strata and its mean depth was 0·45 of the initial pre-grazing sward height. A similar pattern of defoliation was observed by Benvenutti et al. (Reference Benvenutti, Pavetti, Poppi, Gordon and Cangiano2016) with steers grazing pastures of Axonopus catarinensis. Despite the fact that A. catarinensis is shorter than sugarcane, Benvenutti et al. (Reference Benvenutti, Pavetti, Poppi, Gordon and Cangiano2016) also showed that the top grazing stratum was deeper than the bottom ones and steers heavily depleted this stratum horizontally before utilizing a significant area of the bottom strata. Previous studies, on vegetative pastures, found that bite depth was approximately 0·50 of sward height (Laca et al. Reference Laca, Ungar, Seligman and Demment1992; Flores et al. Reference Flores, Laca, Griggs and Demment1993; Cangiano et al. Reference Cangiano, Galli, Pece, Dichio and Rozsypalek2002). However, this fraction was measured to be as deep as 0·68 in pastures with deep leafy top strata (Benvenutti et al. Reference Benvenutti, Gordon, Poppi, Crowther, Spinks and Moreno2009). The top grazing stratum in the study by Benvenutti et al. (Reference Benvenutti, Pavetti, Poppi, Gordon and Cangiano2016) was 0·65–0·86 of the initial pre-grazing sward height. These large differences in bite or top grazing stratum depth between studies could be explained by the vertical structure of the pastures. Pastures with deep top leafy strata resulted in deep bites (Benvenutti et al. Reference Benvenutti, Gordon, Poppi, Crowther, Spinks and Moreno2009) or deep top grazing stratum (Benvenutti et al. Reference Benvenutti, Pavetti, Poppi, Gordon and Cangiano2016). However, the presence of tough stems at the bottom of swards have been shown to act as a vertical barrier to defoliation and resulted in shallower bites (Benvenutti et al. Reference Benvenutti, Gordon and Poppi2006). The longer chewing time per kilogram of DM or NDF required for the bottom sections of the sugarcane, measured in the current pen study, indicates that these sections were tougher and probably also represented a vertical barrier to defoliation in the grazing trial. This explains why the top grazing stratum was not deeper in the sugarcane grazing trial.
Both daily intake and intake rate decreased with progressive defoliation. Previous studies also found that daily intake or intake rate declined with increasing levels of pasture utilization (Chacon & Stobbs Reference Chacon and Stobbs1976; Hendricksen & Minson Reference Hendricksen and Minson1980; Fonseca Reference Fonseca2012; Benvenutti et al. Reference Benvenutti, Pavetti, Poppi, Gordon and Cangiano2016). Both digestive and ingestive constraints are likely to be responsible for this decline in intake (Poppi et al. Reference Poppi, Hughes, L'Huillier and Nicol1987). The pen study in the current work, where intake was unlikely to be limited by ingestive constraints, showed that DMI declined from material taken from the top to the bottom of the sugarcane plant. Therefore, while it seems that digestive constraints were partially responsible for the decline of DMI observed in the grazing trial, it is highly likely that ingestive constrains played a major role as well. Indeed, the DMI from the bottom half of the sugarcane in the grazing trial (i.e. residual sugarcane height lower than 1 m) was much lower than the combined bottom two sections of the sugarcane in the pen trial (i.e. 38 v. 65 g/kg LW0·75). Moreover, while intake rate was the same for all vertical sections in the pen trial, there was a significant decline in intake rate in the grazing trial. This was possibly due to the increasing difficulties of prehending the tougher bottom sections of the sugarcane, resulting in a decreasing amount of plant material consumed per hour of grazing time and the observed decline of daily intake. Previous studies also found that tough stems located at the bottom of the swards can form a vertical barrier to bite formation, resulting in a decrease in bite dimensions, bite mass and intake rate (Benvenutti et al. Reference Benvenutti, Gordon and Poppi2006, Reference Benvenutti, Gordon, Poppi, Crowther and Spinks2008).
There was a split-line relationship between daily intake and intake rate and residual sugarcane height. This asymptotic relationship was also observed in previous grazing studies (Fonseca Reference Fonseca2012; Benvenutti et al. Reference Benvenutti, Pavetti, Poppi, Gordon and Cangiano2016) and it was due to the combined decline of intake rate and grazing time with progressive defoliation. In contrast, previous studies found that cattle (Chacon & Stobbs Reference Chacon and Stobbs1976; Hendricksen & Minson Reference Hendricksen and Minson1980; Benvenutti et al. Reference Benvenutti, Pavetti, Poppi, Gordon and Cangiano2016) and sheep (Roguet et al. Reference Roguet, Prache and Petit1998) increased grazing time during initial defoliation of pastures. The total daily time allocated to chewing/processing (grazing + rumination time) offers an explanation for the observed decline of grazing time in the current sugarcane grazing trial. Indeed, as in the pen trial, the steers spent on average around 15 h of total chewing time per day. The results suggest that, since rumination time increased with defoliation, steers decreased grazing time in order to maintain the maximum 15 h of total chewing time they were willing to spend per day.
The breakpoint of DMI and DDM intake occurred when the top grazing stratum, as a proportion of the paddock area, became heavily depleted. Digestible DMI was highest at low levels of utilization of the top grazing stratum but declined sharply once this stratum was utilized in 0·92 of the pasture area. These results indicate that steers were able to achieve high-intake rate only while consuming the top grazing stratum. The animals utilized a significant amount of the bottom grazing stratum only when the top grazing stratum had become heavily depleted, which resulted in the observed decline in intake rate and daily intake. Benvenutti et al. (Reference Benvenutti, Pavetti, Poppi, Gordon and Cangiano2016) found similar results where daily intake of steers grazing pastures of A. catarinensis significantly decreased when the top grazing stratum was removed in approximately 0·93 of the pasture area.
These results have significant practical implications for the management of sugarcane in grazing systems. Since DDM intake decreased when the top grazing stratum was depleted in 0·92 of the pasture area, this is equivalent to 0·08 of the area of the paddock remaining un-grazed. Consequently, this is the optimal post-grazing residual un-grazed area if the objective is to maximize daily intake. Therefore, as also found by Benvenutti et al. (Reference Benvenutti, Pavetti, Poppi, Gordon and Cangiano2016) in pastures of A. catarinensis, this sward attribute can be used to make grazing management decisions to control intake during progressive defoliation of pastures. However, the low intake, and presumably resultant low LW gain, when a higher degree of utilization of the whole crop is used means that the value of sugarcane to be grazed is limited.
CONCLUSION
In the pen study, there was a significant difference in voluntary forage intake between the different vertical sections of sugarcane with a gradual increase of intake from bottom to top of the canes. This difference in intake was associated with a lower chewing time per kilogram of DM and NDF of the top section of the sugarcanes. There was no significant difference in DMI or DDM intake per kilogram of metabolic weight between groups of animals for any of the sugarcane vertical sections. This was probably due to the similar mastication efficiency between age groups. Indeed, young and mature steers were able to process the same amount of plant material per hour and unit of molar surface area. The results confirm the advantage of feeding cattle the top half of the sugarcane due to its higher DDM intake for both young and mature steers.
In the grazing study, steers grazed up to four distinctive superimposed grazing strata. The depth and intake rate of the top grazing stratum were higher than the lower strata. Consequently, DDM intake was maintained during low levels of defoliation but significantly decreased when the top grazing stratum was removed in 0·92 of the paddock area. This is equivalent to 0·08 of the area of the paddock remaining un-grazed. Consequently, this is the optimal post-grazing residual un-grazed area if the objective is to maximize daily intake, greater levels of utilization will result in a lower intake and therefore animal performance. It is concluded that the residual un-grazed area of the paddock can be used as a grazing management strategy to control daily intake in progressive defoliation grazing systems of sugarcane.
Oscar Radke, Rosalino Lopez, Pablo Nuñez Croattini, Cristian Sarubbi and Miguel Da Luz helped with the conduction of the study and data collection. Katherine Delaney edited the figure.