Introduction
Long-term Pleistocene climate change is characterized by the mid-Pleistocene transition (MPT, ~1.2 − 0.7 Ma) and mid-Brunhes event (MBE, ~0.43 Ma). The MPT is a progressive transition of glacial–interglacial climatic cycles from the lower-amplitude 41 kyr forcing to the higher-amplitude 100 kyr forcing (e.g. Clark et al. Reference Clark, Archer, Pollard, Blum, Rial, Brovkin, Mix, Pisias and Roy2006; Crundwell et al. Reference Crundwell, Scott, Naish and Carter2008; Elderfield et al. Reference Elderfield, Ferretti, Greaves, Crowhurst, McCave, Hodell and Piotrowski2012). The MBE during the warm Marine Isotope Stage (MIS) 11 marks the final pulse of this transition (e.g., Lisiecki and Raymo Reference Lisiecki and Raymo2007; Cronin Reference Cronin2009; Elderfield et al. Reference Elderfield, Ferretti, Greaves, Crowhurst, McCave, Hodell and Piotrowski2012). Both the MPT and MBE may have considerably affected deep-sea ecosystems. Crustacean ostracods and protozoan foraminifera, due to their high abundance in deep-sea sediment cores, are excellent proxies to reconstruct the detailed history of deep-sea biotic responses to climatic changes. It has been recently revealed that in the Arctic Ocean, deep-sea benthic foraminifera and ostracods underwent significant faunal turnover in association with encroaching perennial sea-ice cover during the MPT and MBE (Polyak et al. Reference Polyak, Best, Crawford, Council and St-Onge2013; Cronin et al. Reference Cronin, DeNinno, Polyak, Caverly, Poore, Brenner, Rodriguez-Lazaro and Marzen2014, Reference Cronin, Dwyer, Caverly, Farmer, DeNinno, Rodriguez-Lazaro and Gemery2017; DeNinno et al. Reference DeNinno, Cronin, Rodriguez-Lazaro and Brenner2015; Lazar and Polyak Reference Lazar and Polyak2016). During the MPT, a globally synchronized extinction event decimated deep-sea foraminifera with uniserial and multiserial elongate morphologies and specialized apertures (Kawagata et al. Reference Kawagata, Hayward, Grenfell and Sabaa2005, Reference Kawagata, Hayward and Gupta2006, Reference Kawagata, Hayward and Kuhnt2007; Hayward et al. Reference Hayward, Kawagata, Grenfell, Droxler and Shearer2006, Reference Hayward, Kawagata, Grenfell, Sabaa and O'Neill2007, Reference Hayward, Sabaa, Kawagata and Grenfell2009). However, this event only affected a specific subset of foraminifera, while the broader deep-sea benthic community's response to the MPT and MBE is known only in the Arctic Ocean. Deep-sea biotic responses to secular paleoclimatic trends including the MPT and MBE remain poorly understood in comparison to those of the orbital scale (e.g., Cronin et al. Reference Cronin, Raymo and Kyle1996; Cronin and Raymo Reference Cronin and Raymo1997; Wollenburg et al. Reference Wollenburg, Mackensen and Kuhnt2007; Yasuhara et al. Reference Yasuhara, Cronin, Demenocal, Okahashi and Linsley2008, Reference Yasuhara, Hunt, Cronin and Okahashi2009, Reference Yasuhara, Okahashi, Cronin, Rasmussen and Hunt2014).
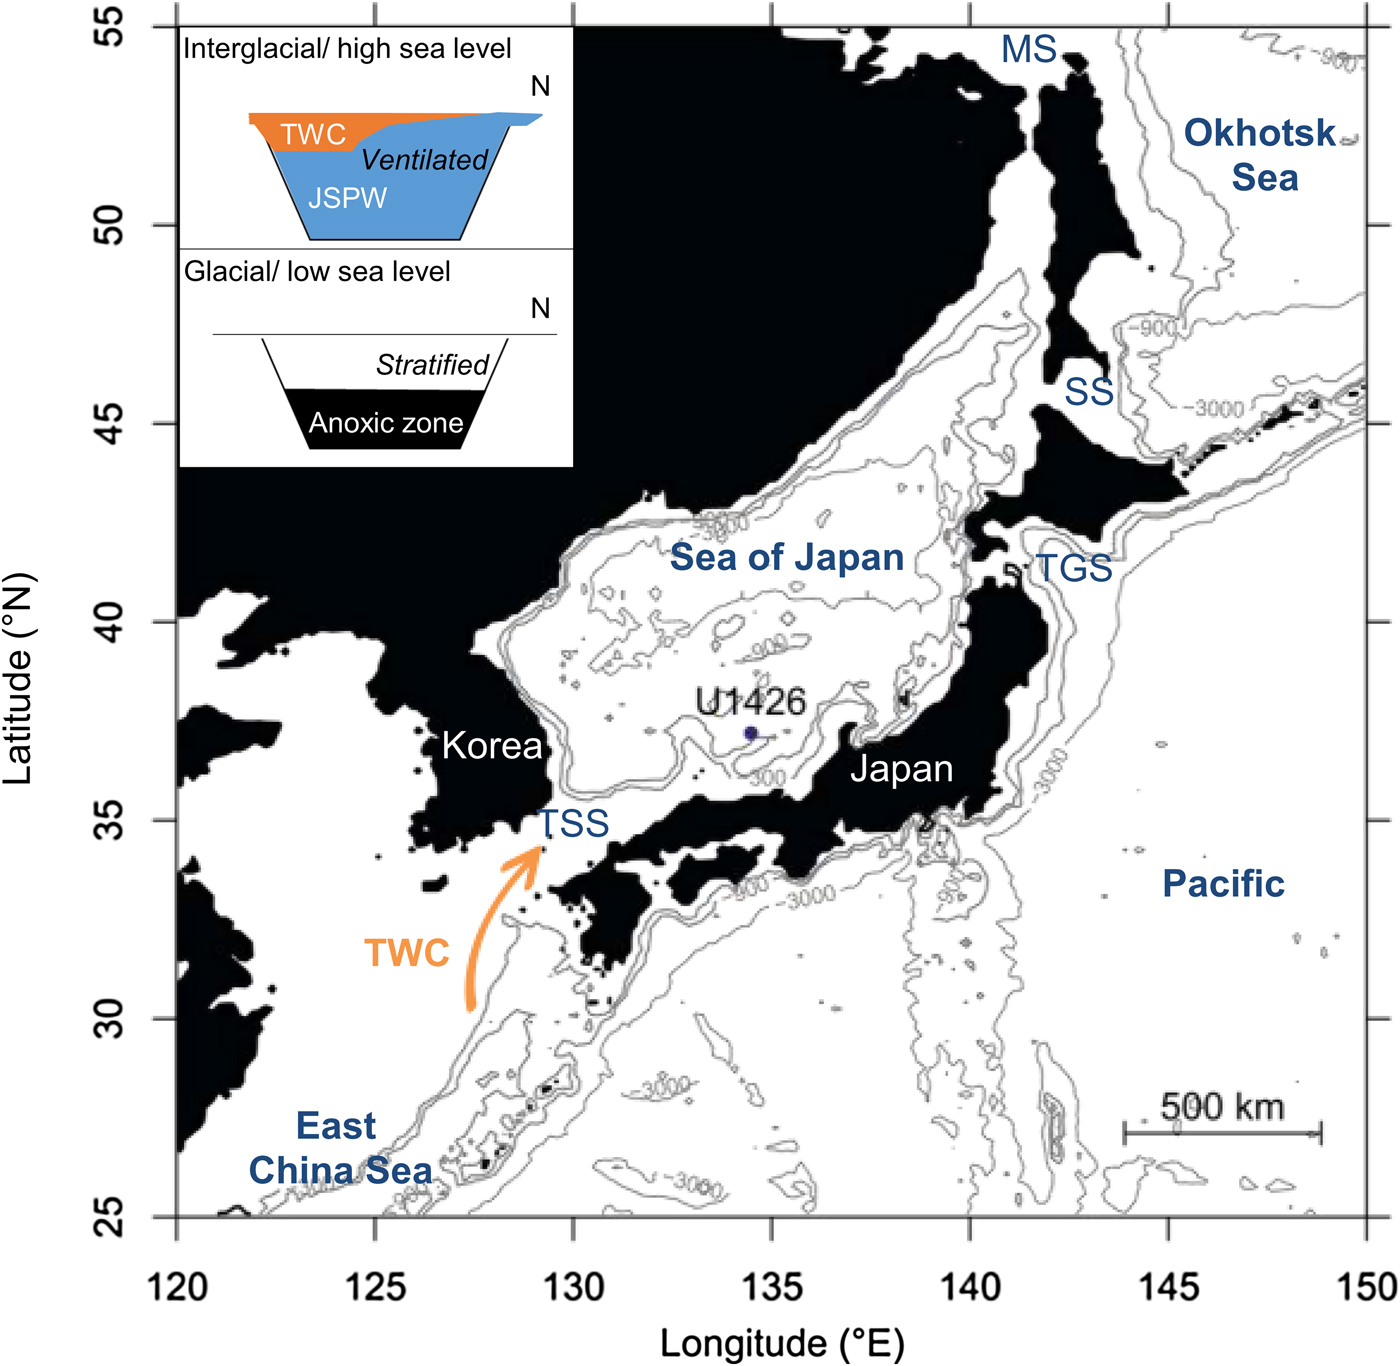
The Sea of Japan constitutes an ideal test bed to examine Pleistocene deep-sea biotic responses to orbital- and secular-scale climatic changes, due to its climatic sensitivity and the availability of long, continuous sediment cores with high recovery from Integrated Ocean Drilling Program (IODP) Expedition 346 (Tada et al. Reference Tada, Murray and Alvarez Zarikian2015; Yamaguchi et al. Reference Yamaguchi, Kuroki, Yamada, Itaki, Niino and Motoyama2017). The Sea of Japan is a semi-enclosed, marginal sea known to be sensitive to climatic change on various timescales (Fig. 1) (e.g., Itaki et al. Reference Itaki, Komatsu and Motoyama2007; Tada et al. Reference Tada, Murray and Alvarez Zarikian2015; Irino et al. Reference Irino, Tada, Ikehara, Sagawa, Karasuda, Kurokawa, Seki and Lu2018; Sagawa et al. Reference Sagawa, Nagahashi, Satoguchi, Holbourn, Itaki, Gallagher, Saavedra-Pellitero, Ikehara, Irino and Tada2018). Since the initial inflow of the Tsushima Warm Current (TWC) at ~1.7 Ma, the Sea of Japan has undergone abrupt oxygen-level fluctuations related to orbital-scale climatic and sea-level changes (Tada et al. Reference Tada, Koizumi, Cramp, Rahman, Pisciotto, Ingle, von Breymann and Barron1992, Reference Tada, Murray and Alvarez Zarikian2015; Kido et al. Reference Kido, Minami, Tada, Fujine, Irino, Ikehara and Chun2007; Watanabe et al. Reference Watanabe, Tada, Ikehara, Fujine and Kido.2007; Khim et al. Reference Khim, Tada, Park, Bahk, Kido, Itaki and Ikehara2009; Itaki Reference Itaki2016). The TWC is a mixture of a Kuroshio Current branch and waters of the East China Sea and is the only major influx of saline water into the Sea of Japan (Talley et al. Reference Talley, Min, Lobanov, Luchin, Ponomarev, Salyuk, Shcherbina, Tishchenko and Zhabin2006; Gallagher et al. Reference Gallagher, Kitamura, Iryu, Itaki, Koizumi and Hoiles2015; Itaki Reference Itaki2016). Because of surrounding shallow straits (deepest 130 m), during sea-level lows there was a weaker TWC influx and the marginal sea could become completely isolated (Tada et al. Reference Tada, Koizumi, Cramp, Rahman, Pisciotto, Ingle, von Breymann and Barron1992; Itaki Reference Itaki2016; Yamaguchi et al. Reference Yamaguchi, Kuroki, Yamada, Itaki, Niino and Motoyama2017). The MBE amplified the scale of sea-level fluctuations and their influence on the paleoceanographic changes of the marginal sea. During glacial periods, coastal and upper-shelf areas experienced significant drops in temperature and salinity due to a decrease in TWC influx and an increase in freshwater input. Deeper regions of the Japan Sea may have suffered oxygen depletion, because the TWC was unable to ventilate and convey oxygen down to its greatest depths (Tada Reference Tada1994; Itaki et al. Reference Itaki, Komatsu and Motoyama2007). During these periods, dark-colored sediments or “dark layers” lacking bioturbation were deposited and constitute key beds that allow us to correlate Quaternary Sea of Japan sediments (e.g., Ikehara Reference Ikehara2015). Sea-level fluctuations, TWC alteration, and associated environmental changes related to orbital-scale cycles have been investigated for the Holocene and latest Pleistocene (up to ~220,000 years) and are known to have significantly impacted radiolarian faunal turnovers (Itaki et al. Reference Itaki, Ikehara, Motoyama and Hasegawa2004, Reference Itaki, Komatsu and Motoyama2007; Ikehara and Itaki Reference Ikehara and Itaki2007). Multiple faunal proxies from the Yabuta Formation suggest that the Sea of Japan experienced glacial sea-level reductions of up to 50–60 m during 2.7–2.3 Ma (Cronin et al. Reference Cronin, Kitamura, Ikeya, Watanabe and Kamiya1994). Sea-level studies from the Omma Formation suggest that the magnitude of glacial sea-level reductions was larger (~20–30 m lower) during MIS 22 (0.9–0.86 Ma), 26 (0.97–0.96 Ma), and 34 (1.14–1.11 Ma) than in any other glacial periods during 1.6–0.85 Ma (Kitamura and Kawagoe Reference Kitamura and Kawagoe2006; Kitamura Reference Kitamura2016). Beyond the orbital scale, compilation records of the Omma-Manganji molluscan faunas suggest a substantial extinction around 0.9–0.8 Ma in the Sea of Japan (Amano Reference Amano2007). Ozawa and Kamiya (Reference Ozawa and Kamiya2005b) discussed the extinction of some shallow-water ostracods that had only narrow salinity tolerance during several low-salinity episodes between ~0.85 and 0.4 Ma. However, due to the paucity of continuous, high time-resolution deep-sea fossil records, detailed biotic responses to the MPT and MBE are not well understood.
Bathymetric map and schematic model of glacial/interglacial water masses in the Sea of Japan: Integrated Ocean Drilling Program Site U1426 (37°2.00′N, 134°48.00′E) is located in the southeastern Sea of Japan. During interglacial stages, the TWC ventilates at Vladivostok and sinks to form the JSPW. During glacial stages, the water masses become stratified. Abbreviations: JSPW, Japan Sea Proper Water; MS, Mamiya Strait; SS, Soya Strait; TGS, Tsugaru Strait; TSS, Tsushima Strait; TWC, Tsushima Warm Current. The map was produced with the ‘marmap’ package in R software v. 3.3.3 (Pante and Simon-Bouhet Reference Pante and Simon-Bouhet2013; R Core Team 2017).

Here we present a high-resolution deep-sea benthic ostracod faunal record for the last 2 Myr at IODP Site U1426. Ostracoda, a class of Crustacea, are one of the most diverse and successful deep-sea groups. Their incomparable fossil record renders them the best representative of deep-sea crustaceans. Our results show clear biotic responses to the MBE, orbital-scale climatic cycles, and TWC fluctuations.
Materials and Methods
Study Site and Ostracod Analysis
IODP Site U1426 is located 903 m below sea level, ~150 km off Honshu Island, Japan, and beneath the path of the TWC (Fig. 1). It was drilled close to Ocean Drilling Program (ODP) Site 798, where well-preserved calcareous microfossils were found (Kheradyar Reference Kheradyar, Pisciotto, Ingle, von Breymann and Barron1992; Tada et al. Reference Tada, Murray and Alvarez Zarikian2015). Site U1426 was also the deepest Expedition 346 site where calcareous microfossil studies were possible because of the relatively shallow carbonate compensation depth (~2000 m) in the Sea of Japan (Tada et al. Reference Tada, Murray and Alvarez Zarikian2015; Itaki Reference Itaki2016). The age model for U1426 was rigorously reconstructed by Tada et al. (Reference Tada, Murray and Alvarez Zarikian2015, Reference Tada, Irino, Ikehara, Karasuda, Sugisaki, Xuan, Sagawa, Itaki, Kubota, Lu, Seki, Murray, Alvarez-Zarikian, Anderson, Bassetti, Brace, Clemens, da Costa Gurgel, Dickens, Dunlea, Gallagher, Giosan, Henderson, Holbourn, Kinsley, Lee, Lee, Lofi, Lopes, Saavedra-Pellitero, Peterson, Singh, Toucanne, Wan, Zheng and Ziegler2018), Irino et al. (Reference Irino, Tada, Ikehara, Sagawa, Karasuda, Kurokawa, Seki and Lu2018), and Sagawa et al. (Reference Sagawa, Nagahashi, Satoguchi, Holbourn, Itaki, Gallagher, Saavedra-Pellitero, Ikehara, Irino and Tada2018), using a multidisciplinary approach with dark-layer sediment events, tephrostratigraphy, and magnetostratigraphy (Supplementary Table 1). The Expedition 346 Sea of Japan age models are available from Tada et al. (Reference Tada, Irino, Ikehara, Karasuda, Sugisaki, Xuan, Sagawa, Itaki, Kubota, Lu, Seki, Murray, Alvarez-Zarikian, Anderson, Bassetti, Brace, Clemens, da Costa Gurgel, Dickens, Dunlea, Gallagher, Giosan, Henderson, Holbourn, Kinsley, Lee, Lee, Lofi, Lopes, Saavedra-Pellitero, Peterson, Singh, Toucanne, Wan, Zheng and Ziegler2018).
A total of 498 samples were studied to reconstruct the ostracod record at Site U1426 (Supplementary Table 2). We collected 270 standardized 2-cm-thick samples covering the last ~1.3 Myr at ~4 kyr resolution from IODP Holes U1426A, C, and D for this study. Each sample was freeze-dried, wet-sieved through a 63 µm mesh, and finally dried under ~35°C for microfossil extraction. Ostracod valves and carapaces (i.e., 2 valves) were then fully picked and identified to species level from the >150 µm fraction for census and statistical analyses. The ostracod data older than ~1.3 Ma are from Yamada et al. (Reference Yamada, Kuroki, Yamaguchi, Tada, Murray and Alvarez Zarikian2017). The generic name assignments of Yamada et al. (Reference Yamada, Kuroki, Yamaguchi, Tada, Murray and Alvarez Zarikian2017) are slightly revised here. First, we consider that Hirsutocythere? hanaii is better assigned to Legitimocythere, following Yasuhara et al. (Reference Yasuhara, Hunt, Okahashi and Brandão2015), and thus call it Legitimocythere hanaii. Second, we consider Kobayashiina a junior synonym of Cytheropteron, following Yasuhara and Okahashi (Reference Yasuhara and Okahashi2015) and Horne and Whittaker (Reference Horne and Whittaker1988).
The ostracod data were treated and selected for statistical analyses. A coarser time-binning scheme was adopted to achieve higher numbers of specimens per sample for robust statistical analyses: Samples that are within the same 10 kyr age window are combined (Supplementary Table 3). Eventually, 40 combined samples that have at least six specimens and relative abundance (%) of taxa were used in all multivariate analyses in this study (Supplementary Table 4).
Analytical Approaches
We hypothesized that the onset of the TWC, the MPT, and the MBE played an underlying role in ostracod faunal changes and that the orbital-scale climate variability came into play thereafter. A cascade multivariate-regression tree (CMRT) was used to evaluate potential drivers of faunal changes by constraining the assemblage variation by explanatory data sets. We used R software package ‘MVPARTwrap’ to perform the CMRT analysis (Ouellette and Legendre, Reference Ouellette and Legendre2013; Supplementary Text 1). CMRT is a variant of the multivariate-regression tree, which is similar to other clustering methods but differs by dividing data sets based on certain thresholds (Borcard et al. Reference Borcard, Gillet and Legendre2011; Ouellette et al. Reference Ouellette, Legendre and Borcard2012). CMRT is also flexible in terms of chronological parameters (Ouellette et al. Reference Ouellette, Legendre and Borcard2012). Therefore, we chose CMRT to identify stratigraphic thresholds related to the secular-scale climate transitions and ecological thresholds related to the distinct dark/light rhythm of sediment layers. The explanatory data sets, including chronological sequence (i.e., age) as primary and orbital-scale oxygen variability (i.e., dark/light-colored layers) as secondary, were applied under the preliminary hypothesis.
Grayscale color reflectance (L*), a continuous physical property, was used in the secondary explanatory parameter in the CMRT. The L* is a nondestructive measurement, ranging from 0 (black) to 100 (white). It has been widely recognized as a proxy of deep-sea oxygen conditions closely related to glacial–interglacial cycles and sea-level change in the Sea of Japan (e.g., Tada et al. Reference Tada, Irino and Koizumi1999, Reference Tada, Murray and Alvarez Zarikian2015; Kido et al. Reference Kido, Minami, Tada, Fujine, Irino, Ikehara and Chun2007; Watanabe et al. Reference Watanabe, Tada, Ikehara, Fujine and Kido.2007; Irino et al. Reference Irino, Tada, Ikehara, Sagawa, Karasuda, Kurokawa, Seki and Lu2018). Dark and finely laminated sediment layers correspond to sea-level lows, deep-sea anoxia, and stratification during glacial maxima, while light-colored layers are formed under bioturbated, oxygenic conditions (e.g., Stax and Stein Reference Stax and Stein1994; Kido et al. Reference Kido, Minami, Tada, Fujine, Irino, Ikehara and Chun2007; Tada et al. Reference Tada, Murray and Alvarez Zarikian2015). L* data collected on Expedition 346 are available from the LIMS database of IODP (Reference Tada, Murray and Alvarez ZarikianTada et al. Reference Tada, Murray and Alvarez Zarikian2015).
Results and Discussion
Ostracod Assemblage Transitions through the TWC Onset, MPT, and MBE
We found 27 taxa in total from the genera Krithe, Robertsonites, Acanthocythereis, Cytheropteron, Falsobuntonia, Propontocypris, Argilloecia, Loxoconchidea, Palmoconcha, Legitimocythere, Rimacytheropteron, Paradoxostoma?, Semicytherura?, and Munseyella (Yamada et al. Reference Yamada, Kuroki, Yamaguchi, Tada, Murray and Alvarez Zarikian2017) (Supplementary Table 2). Krithe, Robertsonites, and Acanthocythereis are the most abundant genera, accounting for 43.7, 20.3, and 14.6% of the total number of ostracod specimens, respectively.
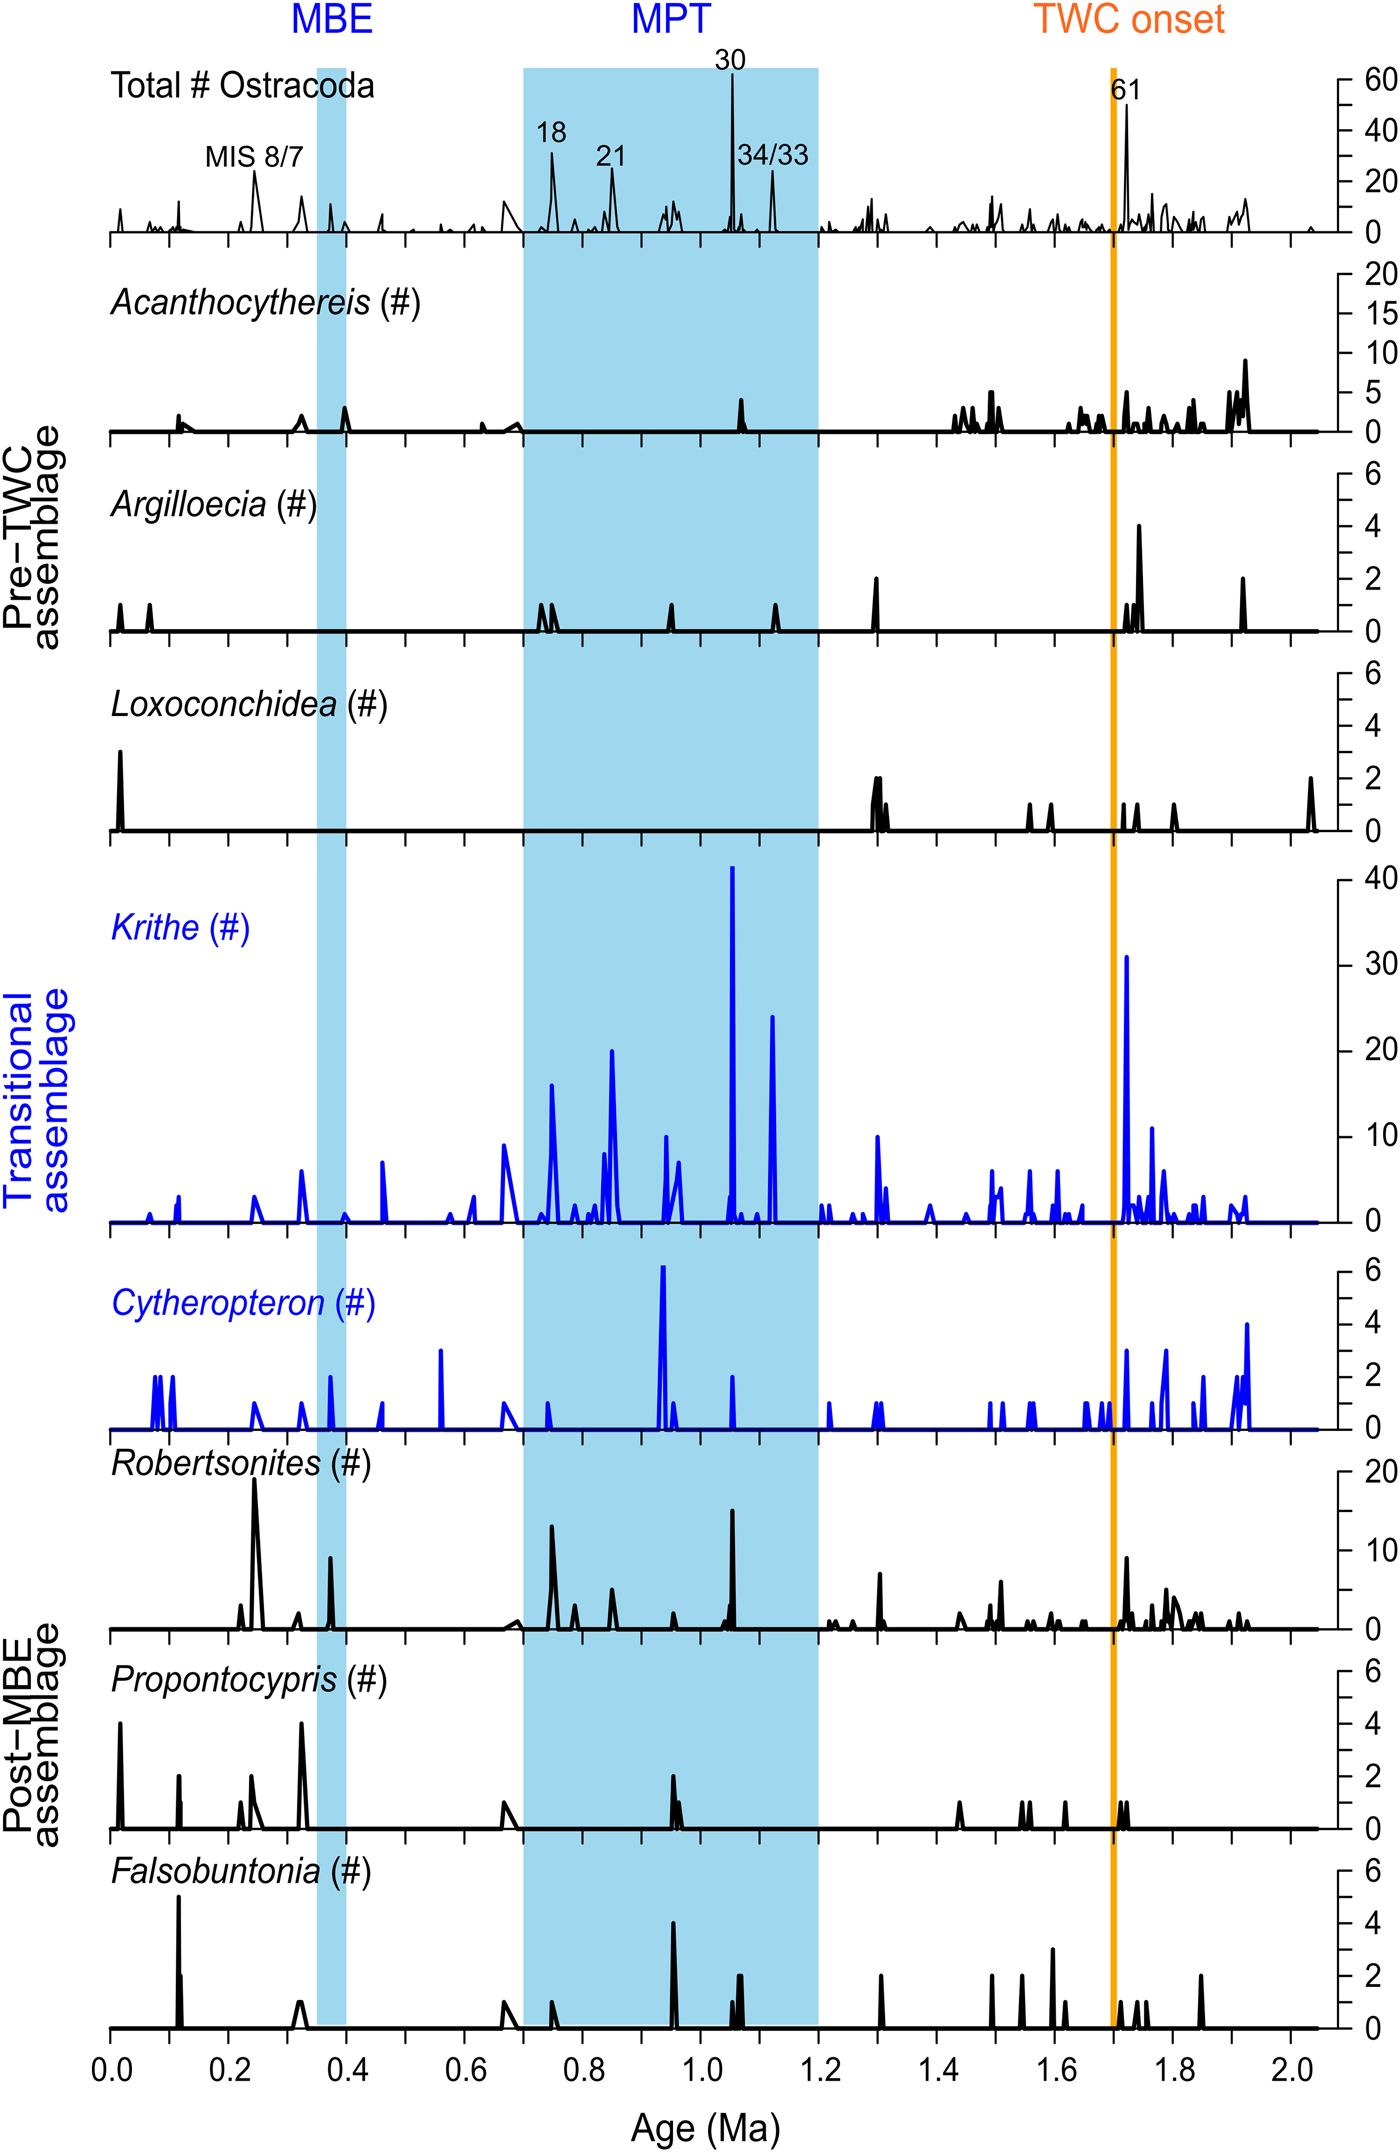
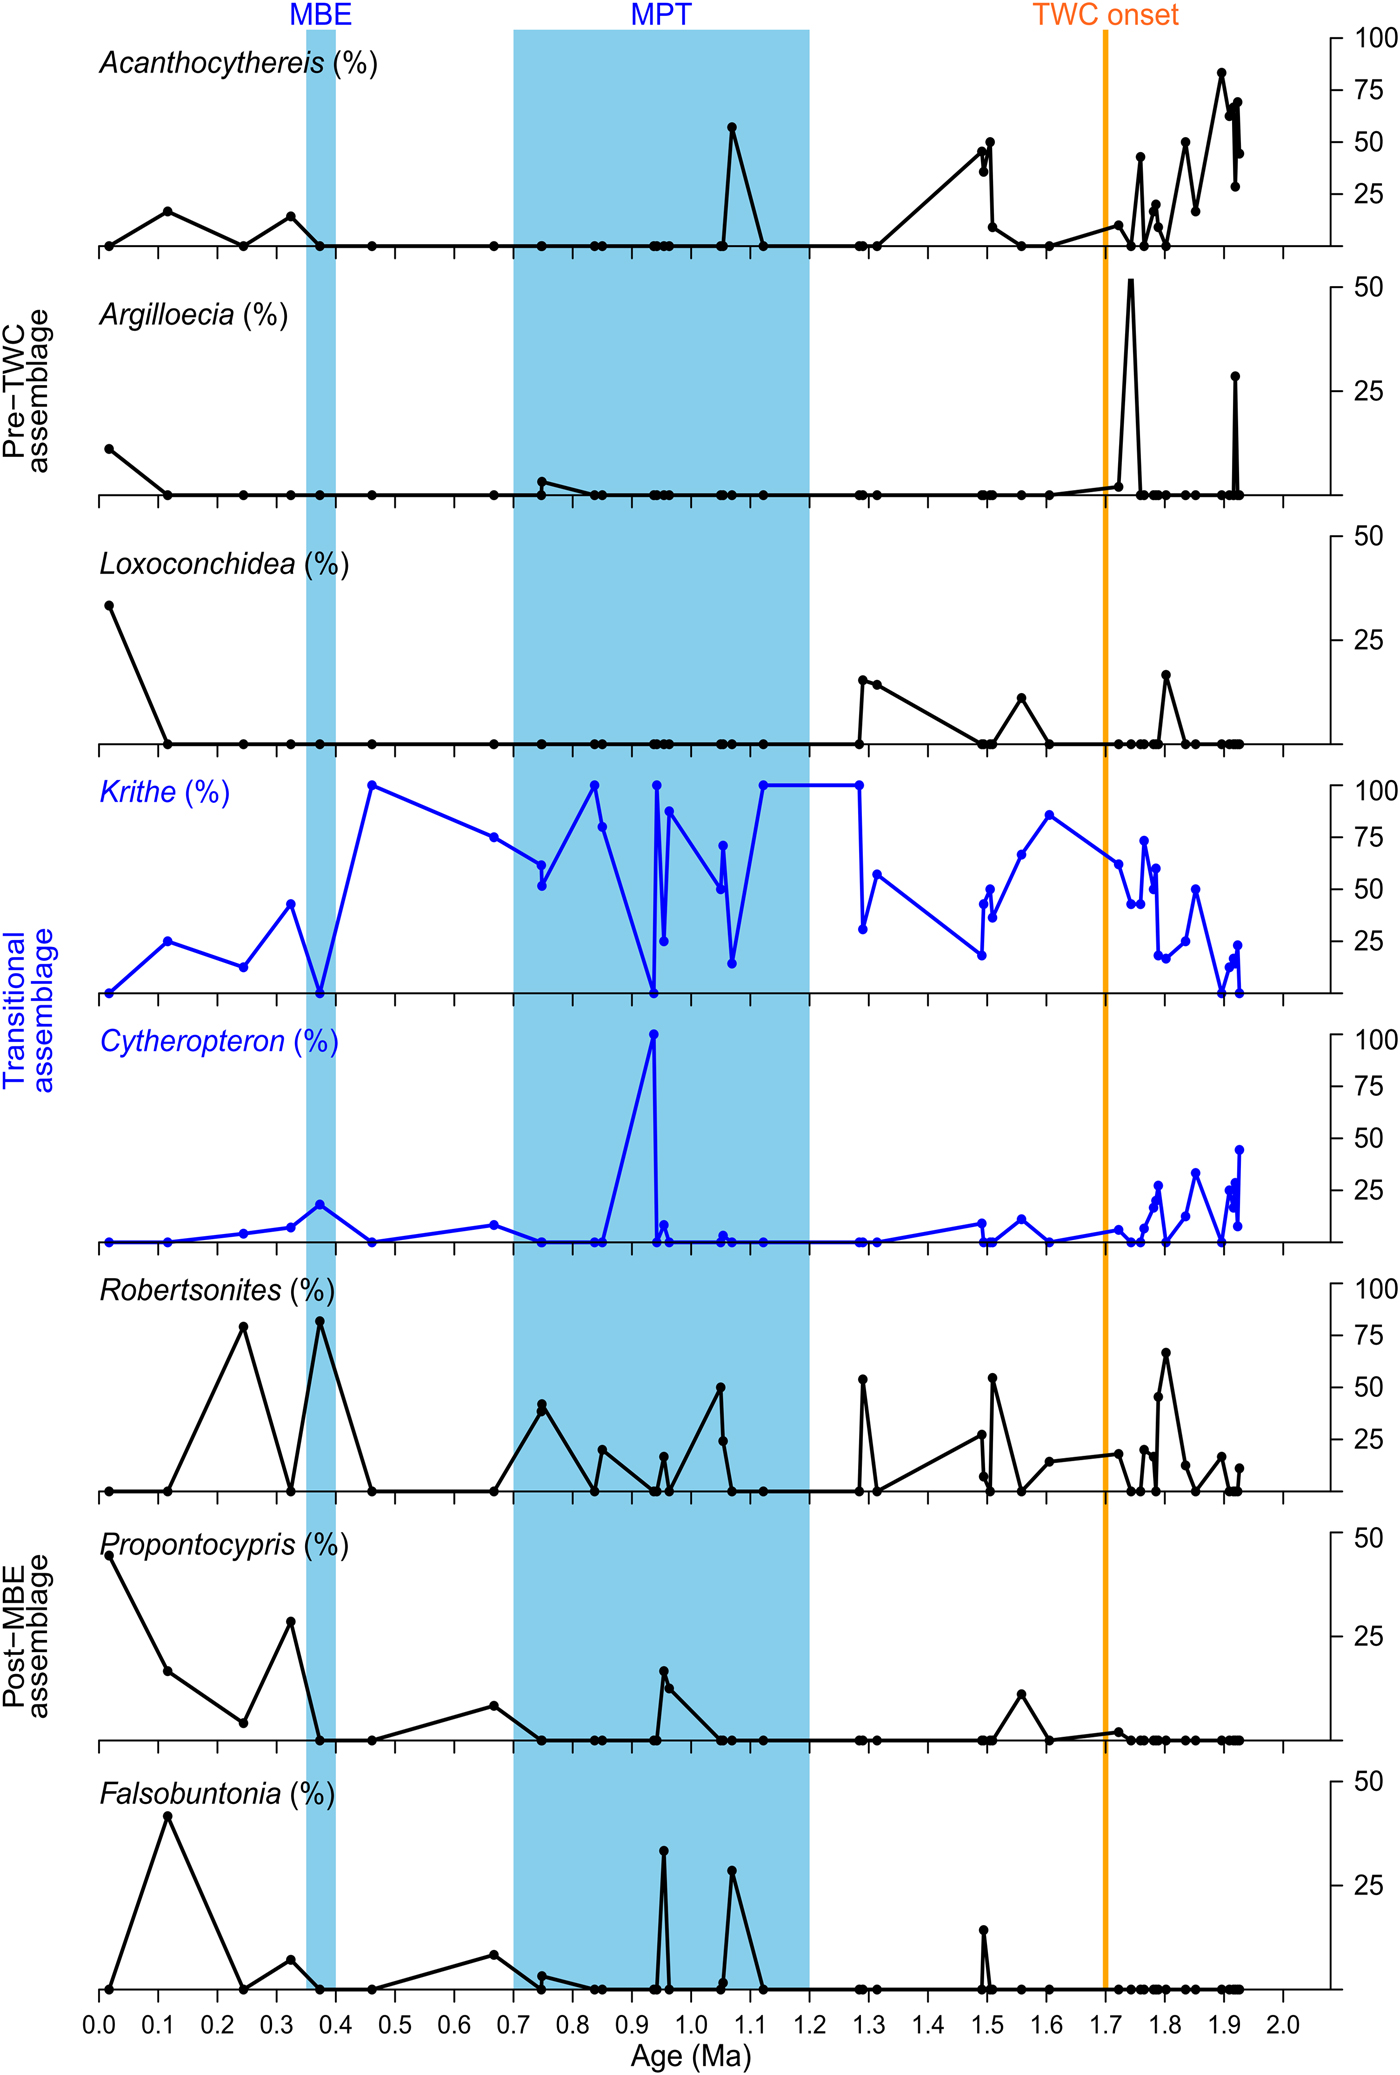
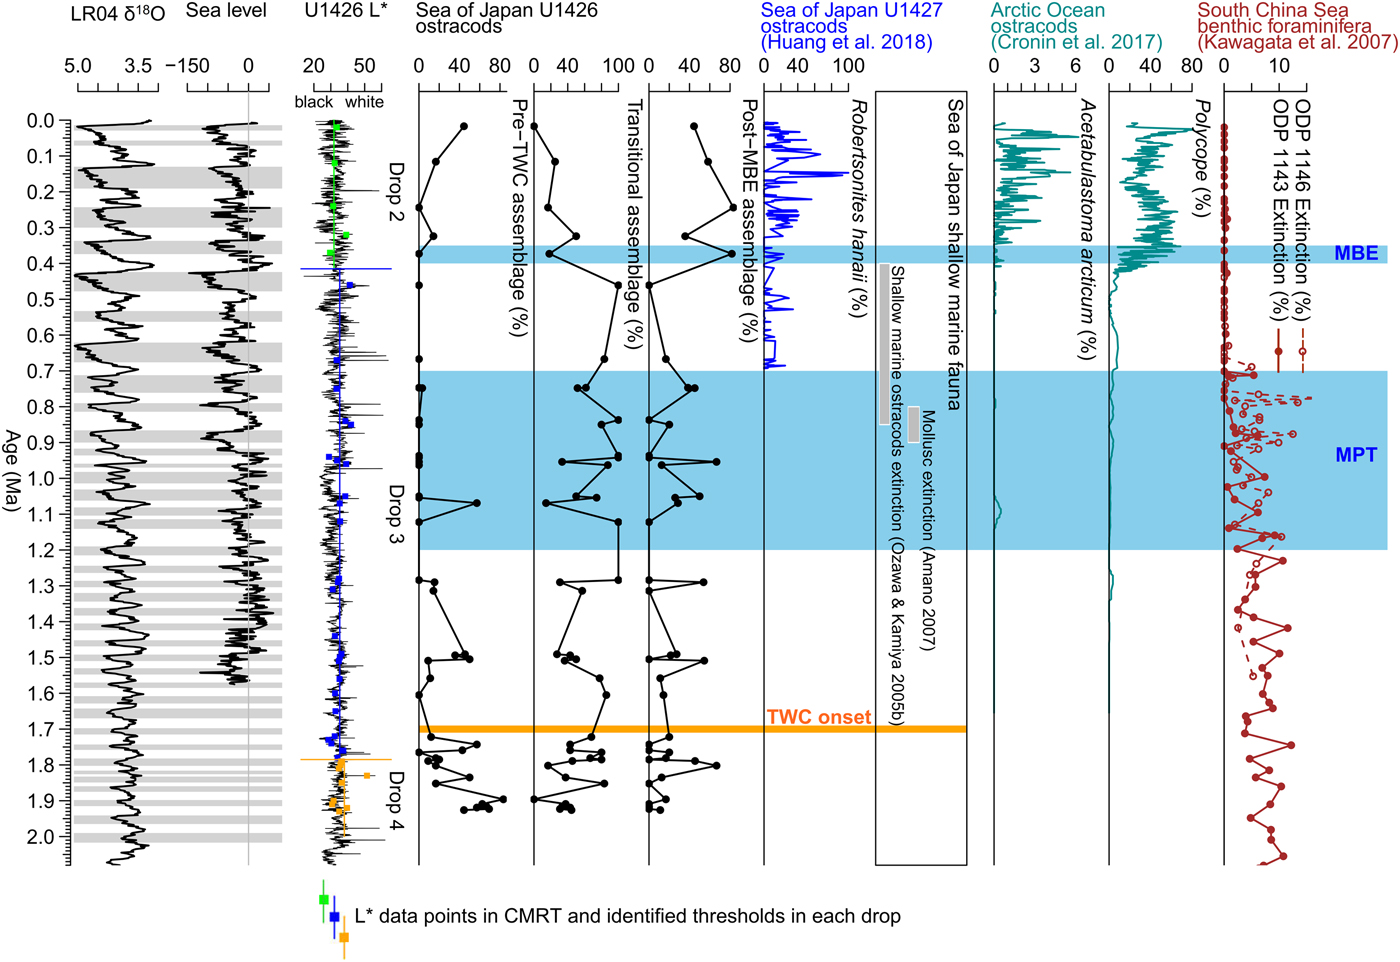
The ostracods indicate two long-term faunal transitions through ~1.7 Ma and ~0.4 Ma that correspond to the TWC onset and the MBE (Figs. 2–4). Observing their abundant periods, we identified pre-TWC, transitional, and post-MBE assemblages (Figs. 2, 3). The pre-TWC and post-MBE assemblages seem to reflect the influence of TWC development, whereas the transitional stage is marked by a substantial increase in cosmopolitan deep-sea Krithe spp. The pre-TWC assemblage is characterized by abundant Acanthocythereis dunelmensis and Acanthocythereis spp. Acanthocythereis dunelmensis is a circumpolar species preferring cold water (0 − 5°C) (Cronin and Ikeya Reference Cronin and Ikeya1987; Irizuki et al. Reference Irizuki, Yamada, Maruyama and Ito2004; Ozawa et al. Reference Ozawa, Nagamori and Tanabe2008) and shows a declining trend after the Tsushima Strait subsidence and an increase in the TWC influx at ~1.7 Ma (Itaki Reference Itaki2016). During the middle Pleistocene transitional stage, A. dunelmensis is outnumbered by Krithe spp. but exhibits a minor increasing trend later in the post-MBE assemblage. The transitional assemblage is dominated by the genera Krithe and Cytheropteron, both considered opportunistic, dominating during climatic transitions (Didié et al. Reference Didié, Bauch and Helmke2002; Alverez Zarikian et al. Reference Alvarez Zarikian, Stepanova and Grützner2009). Krithe are known for their tolerance of moderate oxygen depletion (McKenzie et al. Reference McKenzie, Majoran, Emami and Reyment1989; Whatley and Zhao Reference Whatley and Zhao1993; Majoran and Agrenius Reference Majoran and Agrenius1995; Zhao and Whatley Reference Zhao and Whatley1997). The transitional Krithe dominance rapidly diminishes at the MBE, and the Krithe/Robertsonites ratio reverses after the MBE. In the post-MBE assemblage, Robertsonites hanaii and Propontocypris spp. show higher abundance under the strong influence of the TWC and high-amplitude climate changes after the MBE. Robertsonites hanaii is considered endemic to the Sea of Japan, commonly found in cool water (2 − 5°C) on the outer shelf to bathyal depths (Ishizaki and Irizuki Reference Ishizaki and Irizuki1990; Ikeya and Suzuki Reference Ikeya and Suzuki1992; Yamada Reference Yamada2003; Ozawa and Kamiya Reference Ozawa and Kamiya2005a; Ozawa Reference Ozawa2016). The active swimmer Propontocypris spp. may have resisted rapid paleoceanographic fluctuations by relying on its wide distribution and migratory abilities (Maddocks Reference Maddocks1969) to escape anoxic zones and seek more suitable habitats. The emergence of Robertsonites dominance at the MBE was also observed at the shallower IODP Site U1427 in the Sea of Japan (Fig. 4) (Huang et al. Reference Huang, Yasuhara, Iwatani, Alvarez Zarikian, Bassetti and Sagawa2018).
Total ostracod abundance and abundance of pre-TWC, transitional, and post-MBE characteristic genera (number of specimens per sample). Note that the y-axes are in different scales. In the total plot, specific Marine Isotope Stages (MIS) are marked where abundance peaks occur. The MBE (~0.43 Ma), the MPT (~1.2 − 0.7 Ma), and the onset of the TWC influx (~1.7 Ma) are shown by shading in the background. Abbreviations: MBE, mid-Brunhes event; MPT, mid-Pleistocene transition; TWC, Tsushima Warm Current.

Relative abundance (%) of characteristic genera. Only samples with more than 5 specimens are shown. Abbreviations: MBE, mid-Brunhes event; MPT, mid-Pleistocene transition; TWC, Tsushima Warm Current.

Compiled plots of relevant proxy records: LR04 δ18O (data from Lisiecki and Raymo Reference Lisiecki and Raymo2007); a relative sea-level stack (Elderfield et al. Reference Elderfield, Ferretti, Greaves, Crowhurst, McCave, Hodell and Piotrowski2012); U1426 L* (Tada et al. Reference Tada, Murray and Alvarez Zarikian2015); stratigraphic thresholds identified in the CMRT, Sea of Japan U1426 pre-TWC, transitional, and post-MBE ostracod assemblage records (this study); Sea of Japan U1427 MBE-related ostracod record (Robertsonites hanaii, Huang et al. Reference Huang, Yasuhara, Iwatani, Alvarez Zarikian, Bassetti and Sagawa2018); Sea of Japan MPT-related extinction events (ostracods [Ozawa and Kamiya Reference Ozawa and Kamiya2005b]; mollusks [Amano Reference Amano2007]); Arctic Ocean MBE-related ostracod records (Acetabulastoma arcticum and Polycope [Cronin et al. Reference Cronin, Dwyer, Caverly, Farmer, DeNinno, Rodriguez-Lazaro and Gemery2017]); and South China Sea benthic foraminiferal records of the MPT extinction group (Kawagata et al. Reference Kawagata, Hayward and Kuhnt2007). The MBE (~0.43 Ma), the MPT (~1.2 − 0.7 Ma), and the onset of the TWC influx (~1.7 Ma) are shown by shading in the background. Abbreviations: CMRT, cascade multivariate-regression tree; MBE, mid-Brunhes event; MPT, mid-Pleistocene transition; TWC, Tsushima Warm Current.

In the Sea of Japan, shallow-marine extinction is known during the MPT (mollusks between 0.9 and 0.8 Ma [Amano Reference Amano2007] and ostracods between ~0.85 and 0.4 Ma [Ozawa and Kamiya Reference Ozawa and Kamiya2005b]). Deep-sea benthic foraminifera experienced a global extinction during the MPT that was recorded in the Sea of Japan ODP Leg 128, Site 798 (e.g., Kato Reference Kato, Pisciotto, Ingle, von Breymann and Barron1992; Schönfeld Reference Schönfeld, Moguilevsky and Whatley1996; Hayward et al. Reference Hayward, Kawagata, Grenfell, Sabaa and O'Neill2007, Reference Hayward, Kawagata, Sabaa, Grenfell, van Kerckhoven, Lewandowski and Thomas2012) (Fig. 4, examples from the South China Sea are shown because of poor chronology for the Sea of Japan ODP Leg 128 sites). Deep-sea ostracods are dominated by opportunistic taxa long-term during the MPT and undergo a rapid faunal shift at the MBE (Fig. 4). Elsewhere in the Arctic Ocean after the MBE, another relevant biotic shift saw the sea ice–dwelling Acetabulastoma and opportunistic Polycope rapidly develop the modern Arctic ostracod faunas (Fig. 4) (DeNinno et al. Reference DeNinno, Cronin, Rodriguez-Lazaro and Brenner2015; Cronin et al. Reference Cronin, Dwyer, Caverly, Farmer, DeNinno, Rodriguez-Lazaro and Gemery2017). Our results combined with the contemporaneous biotic shifts in other regions clearly depict that the MPT and MBE widely impacted deep-sea ecosystems.
Orbital-Scale Faunal Variability
Decline and recovery ostracod patterns have clearly corresponded with sea-level changes associated with glacial–interglacial cycles since the TWC onset at ~1.7 Ma. Barren intervals dominate glacial sea-level lowstands, whereas abundance peaks frequently occur during sea-level highstands during interglacials (MIS 53, 51, 41, 25, 21, 9, 5e), deglaciations (MIS 50/49, 40/39, 34/33, 8/7), and weak glacial periods (MIS 30, 18) (Fig. 5). This local cycle of glacial mortality and interglacial recovery could be explained by a relationship between ostracods and orbital-scale oxygen variability. During glacial sea-level lows (< −90 m sea level), the Sea of Japan's deeper basin (>900 m water depth) was known to be under euxinic conditions causing the deposition of sulfur-rich dark layers, and intermediate waters were variably oxygen depleted to anoxic (Watanabe et al. Reference Watanabe, Tada, Ikehara, Fujine and Kido.2007). The organic content is relatively low in these glacial dark layers (1–3%) (Kido et al. Reference Kido, Minami, Tada, Fujine, Irino, Ikehara and Chun2007; Black et al. Reference Black, Anderson, Alvarez Zarikian, Tada, Murray and Alvarez Zarikian2018) and the relatively low surface productivity indicated by low organic carbon content may have contributed to the decline of benthic faunas. During interglacial periods, thinner dark layers with relatively high organic carbon content (3–5%) indicate high surface productivity and deep-sea anaerobic conditions (Kido et al. Reference Kido, Minami, Tada, Fujine, Irino, Ikehara and Chun2007; Watanabe et al. Reference Watanabe, Tada, Ikehara, Fujine and Kido.2007; Black et al. Reference Black, Anderson, Alvarez Zarikian, Tada, Murray and Alvarez Zarikian2018). Ostracods are sensitive to oxygen levels, and mortality rates increase as oxygen content decreases (e.g., Braeckman et al. Reference Braeckman, Vanaverbeke, Vincx, van Oevelen and Soetaert2013). During glacial periods when dark layers are deposited, ostracod abundance declines, and we consider this a product of stress during oxygen depletion. Concordantly, high ostracod abundance co-occurs with light-colored sediments deposited during sea-level highstands with well-ventilated seas. With L* as a proxy of bottom-water oxygen conditions (e.g., Tada et al. Reference Tada, Irino and Koizumi1999, Reference Tada, Murray and Alvarez Zarikian2015; Kido et al. Reference Kido, Minami, Tada, Fujine, Irino, Ikehara and Chun2007; Watanabe et al. Reference Watanabe, Tada, Ikehara, Fujine and Kido.2007; Irino et al. Reference Irino, Tada, Ikehara, Sagawa, Karasuda, Kurokawa, Seki and Lu2018), the influence of oxygen levels on species variation is evaluated in the CMRT analyses (see the following section).
Box plot of natural log-transformed total abundance (total number of specimens plus one) by high sea-level (> −90 m) and low sea-level groups (< −90 m). Nonbarren samples concentrate during sea-level highstands, whereas barren samples dominate during sea-level lowstands. This plot only includes ostracod data over the last 1.5 Myr due to the available 1.5 Myr relative sea-level record (Elderfield et al. Reference Elderfield, Ferretti, Greaves, Crowhurst, McCave, Hodell and Piotrowski2012).

CMRT: Evaluating the Potential Controlling Factors
In the CMRT results, primary partitioning (Drop 1) and secondary partitioning (Drops 2 − 4) explain 52.7% of the total faunal variation (Fig. 6). Each drop is an independent multivariate-regression tree analysis (Ouellette et al. Reference Ouellette, Legendre and Borcard2012). R 2, calculated by 1 minus relative error, is the species variation explained by a drop (De'ath Reference De'ath2002), for example, the relative error of Drop 1 is 0.7135, and thus its explained variation (R 2) is 28.65%. The final variation explained by each secondary drop (i.e., 9.2% by Drop 2, 8.4% by Drop 3, and 6.5% by Drop 4) is calculated by multiplying the proportion of unexplained variation in Drop 1 with the R 2 of each secondary drop (Ouellette et al. Reference Ouellette, Legendre and Borcard2012).
Cascade multivariate-regression tree (CMRT) results, including a CMRT and a diagram of explained variations. In the primary partition, Drop 1 divides samples through two stratigraphic thresholds. Subsequently, in the secondary partition, Drops 2–4 divide samples of each group through one or two L* thresholds. In the diagram, the gray areas are proportional to the explained variation. The term “Drop” (i.e., the tree) was coined by the original authors of this method (Ouellette et al. Reference Ouellette, Legendre and Borcard2012). n = number of samples in each group.

Drop 1 identifies two age thresholds, 0.42 and 1.79 Ma, dividing the assemblage data set into Drop 2 (younger than 0.42 Ma), Drop 3 (0.42 to 1.79 Ma), and Drop 4 (older than 1.79 Ma) (Fig. 6). Subsequently, Drops 2 to 4 are the secondary multivariate-regression trees, constraining the species variation by L*. The stratigraphic age thresholds agree with the onset of the TWC at ~1.7 Ma and the MBE at ~0.4 Ma, explaining 28.7% of the faunal variation. Therefore, we consider Drops 2, 3, and 4 representative of the post-MBE, transitional, and pre-TWC assemblages, respectively. As a bottom-water, dissolved oxygen–level proxy (e.g., Tada et al. Reference Tada, Irino and Koizumi1999, Reference Tada, Murray and Alvarez Zarikian2015; Kido et al. Reference Kido, Minami, Tada, Fujine, Irino, Ikehara and Chun2007; Watanabe et al. Reference Watanabe, Tada, Ikehara, Fujine and Kido.2007; Irino et al. Reference Irino, Tada, Ikehara, Sagawa, Karasuda, Kurokawa, Seki and Lu2018), the L* thresholds explain ~6.5, ~8, and ~9% of the faunal variation in the pre-TWC, transitional, and post-MBE assemblages, respectively (Fig. 6).
Conclusions
We reveal the sensitivity and vulnerability of marginal deep-sea ecosystems to both orbital-scale climate changes (i.e., glacial–interglacial cycles) and secular-scale events (i.e., MPT and MBE):
1. Many mortality events related to deep-water anoxia occur in correspondence to glacial lowstands.
2. The faunal shift from Acanthocythereis-characterized pre-TWC assemblage through Krithe-characterized transitional assemblage to Robertsonites-characterized post-MBE assemblage probably resulted from the stronger warm water input by the TWC since the opening of the Tsushima Strait at ~1.7 Ma. After the onset of TWC and during this long-term climatic transition, ostracod faunas are dominated by opportunistic Krithe taxa. After the MBE, the active-swimming Propontocypris may have escaped stressful benthic conditions and migrated to more suitable habitats, thus increasing their abundance during high-amplitude climatic changes.
3. Our Sea of Japan deep-sea ostracod results combined with deep-sea foraminiferal (e.g., Kato Reference Kato, Pisciotto, Ingle, von Breymann and Barron1992; Hayward et al. Reference Hayward, Kawagata, Grenfell, Sabaa and O'Neill2007) and ostracod (Cronin et al. Reference Cronin, Dwyer, Caverly, Farmer, DeNinno, Rodriguez-Lazaro and Gemery2017; Huang et al. Reference Huang, Yasuhara, Iwatani, Alvarez Zarikian, Bassetti and Sagawa2018) records in the Sea of Japan and other regions indicate that the MPT and MBE are major global deep-sea biotic events and that they affect different taxonomic groups to various degrees.
Acknowledgments
The studied samples were collected by IODP Expedition 346. We would like to thank Expedition 346 co–chief scientists R. Tada and R. Murray, staff scientist C. Alvarez Zarikian, and all the expedition participants. We would like to thank the handling editor W. Kiessling and two anonymous reviewers for their constructive comments. We would also like to thank L. Wong and M. Lo for their support in the laboratory. This work was partly supported by the General Research Fund of the Research Grants Council of Hong Kong (project codes: HKU 17311316, HKU 17303115, HKU 17306014) and the Seed Funding Program for Basic Research of the University of Hong Kong (project codes: 201411159017, 201511159075, 201611159053) (to M.Y.).