Implications
Standardized methodology has been developed in the Welfare Quality® project for animal welfare assessment in different farm animal species. Despite the relatively short assessment time for the broiler protocol (3 to 4 h), as compared with the protocols for the other species, stakeholders have indicated that a reduction in the time taken to complete the protocol, and thus costs, and/or integration with existing measures for the purpose of legislation or certification would stimulate the adoption of the protocol by the broiler industry. We identified two possible simplification strategies that could reduce the time required to complete the protocol, but further validation is needed. Adoption of the assessment protocol in practice may result in increased awareness and knowledge of the welfare status of broilers on-farm and contribute to on-farm welfare improvement.
Introduction
Standardized methodologies have been developed in the European Welfare Quality® (WQ) project for welfare assessment for different categories of farm animals, for example, broiler chickens and laying hens, sows, growing pigs, veal calves and dairy cattle (Blokhuis et al., Reference Blokhuis, Veissier, Miele and Jones2010). The protocols contain several measurements in which the outcomes are used in a three-step multi-criteria evaluation model to enable the assignment of farms or flocks to one of four overall welfare categories (not classified, acceptable, enhanced, excellent). For broilers, measurements and aggregation to overall welfare categories have been described in the WQ assessment protocol for poultry (Welfare Quality, 2009). One of the key characteristics of the WQ assessment protocols is emphasis on animal-based measurements (e.g. injuries or behaviour) rather than design or management criteria (e.g. pen size) (Blokhuis et al., Reference Blokhuis, Veissier, Miele and Jones2010).
The welfare assessment protocol for broilers (Welfare Quality®, 2009) describes measurements indicative of broiler welfare on-farm, during transport and at the slaughter plant. The calculations in the aggregation model are only currently available for indicators of broiler welfare on-farm. On average, the on-farm broiler welfare assessment protocol requires 3 to 4 h/flock (Welfare Quality, 2009). In addition, the assessment protocol also includes collection of data from measures made at the slaughter plant that are indicative of on-farm welfare, such as footpad dermatitis (FPD), hock burn (HB), breast blisters and rejections. This requires an additional 1 to 2 h/flock at the slaughter plant in a separate visit (Welfare Quality, 2009). The practical implication also requires good communication with the slaughter plant regarding planning, to ensure that on farm assessments are carried out in the flock which will be assessed at slaughter.
Dutch stakeholders have expressed interest in assessment protocols for different types of farm animals, while at the same time emphasizing that a reduction in the time taken to complete the protocol and thus the cost, and/or integration with existing measures already being made for the purpose of legislation or certification (see also de Vries et al., Reference de Vries, Bokkers, van Schaik, Engel, Dijkstra and de Boer2014) could improve the probability of adoption in practice, and use of the protocols by stakeholders. Although the on-farm broiler welfare assessment protocol can be performed in a reasonably short time of 3 to 4 h (Welfare Quality, 2009) as compared with the WQ protocols for other species (e.g. up to 7 h for dairy cattle, de Vries et al., Reference de Vries, Bokkers, van Schaik, Engel, Dijkstra and de Boer2014; 6 to 7 h for laying hens, Welfare Quality, 2009), it requires an additional slaughter plant visit. It is therefore important to identify potential for a reduction in time required to complete the protocol, without compromising measurement quality.
The aim of the current study was to investigate capacity for simplification of the broiler assessment protocol with a view to reducing the time taken to complete the protocol and integration with existing measures for legislation or certification purposes. Data from 134 flocks collected in 2011 were therefore added to data from 46 flocks collected in 2008. Two possibilities were considered for simplification of the protocol:
-
a. Use of predictors for on-farm measures. If significant and meaningful correlations could be identified between individual animal-based measurements, then one measurement could be predicted by using the value of the other. A simplified assessment protocol could then consist of a limited (reduced) set of predictor measurements. The assessment protocol structure (measurements – criterion scores – principle scores, Welfare Quality, 2009) would remain intact.
-
b. Replacement of on-farm measures with slaughter plant measures. The broiler assessment protocol already allows some measurements to be performed either at the slaughter plant or on-farm (FPD and HB). However, the relationship between measurements taken at the plant with on-farm data remains unknown. If on-farm measurements can be substituted with slaughter plant data, this would reduce on-farm assessment time, but would also create potential to link the assessment with legislation or certification measures. As an example, several countries measure FPD or HB because of the Broiler Directive or country-specific regulations (Butterworth et al., Reference Butterworth, De Jong, Keppler, Stadig and Lambton2015). Similar to (a) the correlations between on-farm and slaughter plant measurements will determine whether or not simplification is possible.
This study resulted in collection of a large amount of data regarding measures used to assess animal welfare in broiler flocks and of the practical issues related to the application of the protocol, and this information will be published in a separate paper (De Jong et al., unpublished data).
Material and methods
Broiler flocks
Data from 180 flocks was analyzed. A flock was defined as being ‘broilers in a single house at a particular farm depopulated on the same date’. Data included;
-
a. Flocks reared in standard rearing systems (i.e. typically broilers housed exclusively indoors and fed diets that allowed them to reach the target weight (2 to 2.5 kg) in <40 days at stocking densities of 39 to 42 kg/m²) (EFSA, 2010), using so-called fast growing breeds; n=140 flocks.
-
b. Flocks reared in systems allowing more space per broiler (~20 to 32 kg/m²), with target weights achieved over longer periods (50 to 81 days), using natural lighting schemes, daylight provision in the house, with outdoor access or a covered outdoor range, enrichment such as straw bales and using slower growing breeds (alternative systems); n=40 flocks (as alternative flocks were less common in the countries included in this study, this number is lower than under (a)).
Data were collated from four different countries: 140 Dutch flocks: (122 assessed in 2011 and 18 assessed in 2008), 10 British flocks (assessed in 2008), 18 Italian flocks (assessed in 2008) and 12 Belgian flocks (assessed in 2011). As several farms had more than one broiler house, more than one flock could be assessed per farm.
Visits
Assessments were performed between March and June 2008 or between March and June 2011. A total of 22 assessors (16 in the Netherlands, three in Italy, two in Belgium and one in United Kingdom), all trained in the theory and practice by the same technical experts, performed the data collection. Where assessors did not meet criteria for agreement, they were re-trained until they did so. Assessment of the flocks was performed during the last 5 days before slaughter (depopulation of the house) as described by the WQ broiler assessment protocol (Welfare Quality, 2009). Additional measurements were performed at the slaughter plant as described by the WQ assessment protocol (Welfare Quality, 2009). A total of 150 flocks were assessed at the slaughter plant. Slaughter plant data could not be collected for every flock because one plant withdrew from the project (n=2 flocks in alternative systems) and there were last-minute changes in planning (n=28 standard flocks).
Measurements
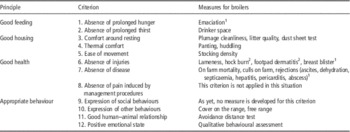
The assessments were in general performed according to the WQ assessment protocol (Table 1; Welfare Quality, 2009) with a few exceptions as described below. Specialized software was designed for data recording using a personal digital assistant. This enabled the assessors to download data into an Access (Microsoft Office®) database immediately after each visit. Data downloads were subsequently checked by another researcher, and missing or incorrect data were supplemented or corrected, after consultation with the assessor and/or the farmer.
The Welfare Quality® approach with principles, criteria and underlying measures (here presented for the broiler assessment protocol)

Welfare Quality (2009).
1 Measure should be collected at the slaughter plant.
2 Measure could be collected either at the slaughter plant or on-farm.
The methodology for the following measures differed from the description in the assessment protocol (Welfare Quality, 2009):
-
a. Percentage of emaciated broilers and percentage of broilers rejected for reason of disease. According to the WQ protocol the percentage of emaciated and dehydrated broilers, and the percentage of broilers with ascites, septicaemia, hepatitis, pericarditis and abscesses should be recorded at slaughter (Welfare Quality, 2009). However, in Dutch slaughterhouses only the total percentage of rejected broilers is recorded, along with the most common reasons for rejection, but a detailed record of the numbers of broilers per pathology is not recorded. Thus, only the total percentage of rejected broilers was available for the entire data set. As birds are rejected for reasons other than disease, such as appearance, the modified measure consisting of total rejection figures does not exclusively reflect welfare issues.
-
b. Number of culled broilers. Many farmers did not record the number of broilers culled separately, but only the total mortality at the time of visit. Thus, for the entire data set, only the total mortality at the time of visit was available.
-
c. Measurement of HB at the slaughter plant. According to the assessment protocol, HB should be scored according to five classes (Welfare Quality, 2009). However, due to the high speed of the slaughter line (up to >200 broilers/min) it was often impossible to differentiate five classes for HB. Therefore, we used two classes according to the current Dutch protocol used in slaughter plants, that is, (light) brown or black spot or various spots <0.5 cm2 (score 0, absence of HB), and brown or black spot or various spots >0.5 cm2 (score 1, presence of HB). In this way we were able to discriminate ‘no’ or ‘mild’ HB with very little or no impact on bird welfare and severe HB, impacting on bird welfare (Allain et al., Reference Allain, Mirabito, Arnould, Colas, Le Bouquin, Lupo and Michel2009). Data collected in 2008 and scored on the five-point scale were translated into the two-point scale, that is, scores 3 and 4 in the data set of 2008 were replaced by a score of 1 in the current study.
Calculations of scores
A score was calculated for each measurement according to the description in the WQ broiler assessment protocol (Welfare Quality, 2009). These scores were then combined to calculate criterion scores, and these criterion scores were combined to calculate principle scores (Table 1) according to the WQ assessment protocol (Welfare Quality, 2009). Finally, each flock was assigned to an overall welfare category according to the principle scores it attained as described in the WQ assessment protocol: a flock was classified ‘excellent’ if it scored >55 on all principles and >80 on two of them; it was ‘enhanced’ if it scored >20 on all principles and >55 on two of them; it was ‘acceptable’ if it scored >10 on all principles and >20 on three of them. Flocks that did not reach these minimum standards were ‘not classified’ (Welfare Quality, 2009). FPD and HB were assessed on-farm and at the slaughter plant, however, overall welfare categories were calculated based on the on-farm assessment of FPD and HB. Flocks without one or more principle scores due to missing measurements were classified as ‘missing’.
Owing to practical constraints and a few errors in the original WQ broiler assessment protocol (Welfare Quality, 2009) the following calculations were modified:
Modified calculation of qualitative behavioural assessment (QBA) coefficients and constant
The published version of the WQ broiler welfare assessment protocol contains an incorrect score sheet for the QBA (Annex B, page 89 in Welfare Quality, 2009) that is, QBA scoring sheet for laying hens. This error was only established after completion of all visits in 2011. In order to avoid differences in terms used for the QBA data collected in 2008 and 2011, after expert consultation new coefficients and a new constant were calculated for broiler flocks scored based on laying hen terminology (Wemelsfelder F., personal communication). These are presented in Supplementary Table S1. Flocks assessed in 2008 were scored with the correct terms and calculations for these flocks were performed according to the WQ broiler assessment protocol (Welfare Quality, 2009).
Modified spline function and Choquet integral for criterion absence of disease (criterion 7)
According to the current model used to summarize on-farm measurements into welfare criteria scores (Botreau et al., Reference Botreau, Buist, Butterworth, Perny and Veissier2009), criterion 7 is determined using six slaughter plant measurements (ascites, dehydration, hepatitis, pericarditis, septicaemia and abscesses), and two measurements of mortality (mortality – death on-farm, and on-farm culls). As explained above, in The Netherlands these slaughter plant measurements were not recorded separately. However, the total number of broilers rejected at the slaughter plant based on pathological condition (i.e. ascites, dehydration, hepatitis, etc.) is available. In addition, the total mortality rate for each flock (% broilers) is available. If the integration model is applied according to current WQ protocol, for Dutch broiler farms at least, it would be impossible to generate scores for criterion 7. Therefore, an alternative calculation method has been developed for criterion 7, based on the available information concerning total rejections and total mortality. In order to use this additional data, an alternative method of summarizing prevalence into a criterion score is required. An appropriate alternative method involves the production of spline functions for each measurement followed by summation of welfare scores based on these splines using a Choquet integral (Botreau et al., Reference Botreau, Buist, Butterworth, Perny and Veissier2009). This required consultation with experts for advice on each measurement and combination in relation to criterion 7. The modified calculation and spline function for criterion 7 are presented in Supplementary Material S1.
Modified spline function for criterion absence of prolonged hunger (criterion 1)
For criterion 1, absence of hunger, the spline function as shown in Botreau et al. (Reference Botreau, Buist, Butterworth, Perny and Veissier2009, figure 1.1), is not correct (data as shown in table 1.2, Botreau et al., Reference Botreau, Buist, Butterworth, Perny and Veissier2009, do not match with figure 1.1 in Botreau et al., Reference Botreau, Buist, Butterworth, Perny and Veissier2009). A new spline function and Choquet integral was therefore calculated based on earlier data (Botreau et al., Reference Botreau, Buist, Butterworth, Perny and Veissier2009) and is presented in Supplementary Material S2. However, because of the lack of specific figures for emaciation, at least for the Dutch data, we did not calculate a score for criterion 1. The score for principle 1 was therefore based on criterion 2 only.
Modified Choquet integral for criterion absence of injuries (criterion 6)
The Choquet integral for criterion 6 presented by Botreau et al. (Reference Botreau, Buist, Butterworth, Perny and Veissier2009) is incorrect, because experts 1, 4 and 5 assigned incorrect scores, that is, scores lower than the minimum score for one or more measures (table 6.4 in Botreau et al., Reference Botreau, Buist, Butterworth, Perny and Veissier2009). A new Choquet integral was calculated and is available in Supplementary Material S3.
Statistical analysis
All statistical analyses were performed using GENSTAT13 (VSN International Limited, 2010). As numbers of flocks per production system were small for a few specific production systems, it was not possible to allow statistical comparisons for these individual systems, and so data were divided based on broiler type (growth rate), as explained above. Thus, the database consisted of 140 fast growing and 40 slow growing flocks. As several of the measured variables were not normally distributed, Spearman rank correlations were used to analyze the relationships between variables for the entire data set, and for each broiler type (fast and slow growing flocks) separately. Correlations where r sp<0.3 were considered ‘low’, 0.3<r sp<0.6 were considered ‘moderate’ and where r sp>0.6 were considered ‘high’.
Simplification of assessment protocol
As the animal-based measurements were by far the most time-consuming measures, for the analysis of correlations we focused on the animal-based measures only and excluded the resource-based or management-based measurements such as litter quality, dust scores and stocking density.
Calculations of Spearman rank correlations (see the ‘Results’ section) resulted in two possible strategies for simplification:
-
1. Prediction of gait score using on-farm HB scores. Reducing on-farm assessment time considerably by assessing HB with the same 100 broilers used for FPD and cleanliness while gait score would usually be assessed on 150 other broilers.
-
2. Prediction of on-farm measurements using slaughter plant assessments, in four steps:
-
a. Prediction of HB on-farm using HB assessed at the slaughter plant.
-
b. Prediction of FPD on-farm using FPD assessed at the slaughter plant.
-
c. Prediction of gait score using HB assessed at the slaughter plant.
-
d. Prediction of cleanliness using HB and FPD assessed at the slaughter plant.
-
Predictions of measure scores for each simplification strategy
A logistic regression analysis was used to predict one measure from the values of other measures according to the simplification strategies as indicated above. This resulted in the following prediction formulas:
-
1. Prediction of gait score using on-farm HB scores:
Logit (p predicted gait score index)=−1.48−0.1258×logist (%HB score 1+2)−0.3457×logist (%HB score 3+4)
-
2. Prediction of on-farm measurements using slaughter plant assessments:
-
a. Prediction of HB on-farm using HB assessed at the slaughter plant:
Logit (p HB index)=0.597−0.4211×logist (%HB 1 at slaughter)
-
b. Prediction of FPD on-farm using FPD assessed at the slaughter plant:
Logit (p FPD index)=−0.92−0.7120×logist (%FPD at slaughter score 1+2)−0.6186×logist (%FPD at slaughter score 3+4)
-
c. Prediction of gait score using HB assessed at the slaughter plant:
Logit (p gait score index)=−1.176−0.3578×logist (%HB 1 at slaughter)
-
d. Prediction of cleanliness using HB and FPD assessed at the slaughter plant:
Logit (p cleanliness index)=−0.2222−0.24189×logist (%HB 1 at slaughter)−0.0635×logist (%FPD at slaughter score 3+4)
-
In order to express the predictions as a prevalence between 0% and 100% (see Welfare Quality, 2009, chapter 5.2), logistic predictions were subsequently transformed as (p) fractions on the original scale according to:
 $$p={1 \over {1{\plus}{\rm e}^{{{\minus}\log {\rm it}(p)}} }}$$
and finally as predictors for measure score:
 $${\rm predicted}\,{\rm measure}\,{\rm score}={\rm 1}00{\times}p$$
Comparison of estimates for overall welfare categories in simplified models compared with the full model
Agreement between the full model and the two simplified models was calculated for the overall welfare categories for a flock (i.e. excellent, enhanced, acceptable and not classified). Comparison of simplification strategy estimates in comparison to the full model were assessed according to:
-
1. %equality=percentage of flocks classified identically;
-
2. %specificity=the percentage of flocks correctly identified as (enhanced+excellent) in the simplified model in relation to the full model;
-
3. %sensitivity=the percentage of flocks correctly identified as (not classified+acceptable) in the simplified model in relation to the full model.
A 90% confidence interval, according to binomial distribution was determined, to indicate any inaccuracy of estimation using the summarized measurements.
Comparison of principle and criteria scores based on the full model with simplification strategies 1 and 2
In addition, agreement between the full model and the two simplified models was calculated for principle and criteria scores affected by the simplification, that is, principle 2 (good housing) and criterion 3 (comfort around resting) and principle 3 (good health) and criterion 6 (absence of injury) (see also Table 1). For principles and criteria, flocks were divided into three groups that corresponded with classification scores at criterion or principle level and used to assign an overall welfare category to a flock (Welfare Quality, 2009) that is: scores ⩽20, 20⩽score⩽55, score⩾55.
Equality, sensitivity and specificity for the simplified models were calculated as described above and Spearman rank correlation coefficients (r sp) were determined between the full model and the simplified strategy for principles and criteria affected by the simplification process.
Results
Relationships between animal-based measurements
Classes of animal-based measures were made according to the calculations as described in the WQ broiler assessment protocol (Welfare Quality, 2009).
Relationships between on-farm measurements
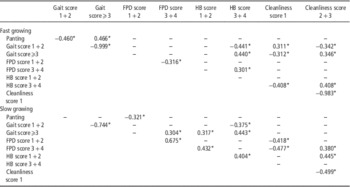
Table 2 shows correlations when r sp>0.3 and for on-farm measures where these correlations were found for fast or slow growing flocks. Correlations for all flocks are presented in Supplementary Table S2. No moderate or strong correlations were found for animal-based measures not included in the table, such as the QBA score. Only a small number of measurement correlations were found for all flocks measured, as well as for fast and slow growing flocks separately. Examples are correlations between moderate gait scores (% broilers with scores 1 and 2) and severe HB scores (% broilers with scores 3 and 4), and correlations between severe gait scores (% broilers with scores 3 and 4) and severe HB scores. Correlations between HB and gait scores were of particular interest with regard to further analysis of possibilities for simplification, as prediction of gait scores from HB scores could considerably reduce assessment time on-farm by 1 to 1.5 h. This simplification strategy was therefore analyzed further (simplification strategy 1).
Spearman rank correlations (r sp) between on-farm measures for flocks with fast growing broilers (upper part of the table) and flocks with slow growing broilers (lower part of the table)
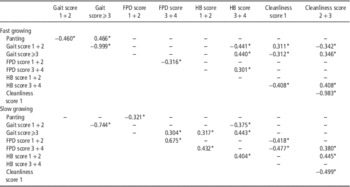
FPD=footpad dermatitis; HB=hock burn; –=weak relationship: r sp<0.3.
Values of the measures in the calculations were the % of broilers affected in a flock.
*Denotes a significance of P<0.05 at least.
Relationships between slaughter plant measurements
The only significant, moderate overall correlation between slaughter plant measurements was found for broilers with severe FPD (% broilers with scores 3 and 4) and severe HB measured at the slaughter plant (r sp=0.544, P<0.001). A moderate correlation between these measurements was also found for fast growing broiler flocks (r sp=0.351, P<0.001). The correlation between these measurements was higher for flocks with slow growing broilers (r sp=0.507, P<0.01).
Relationships between slaughter plant and on-farm measurements
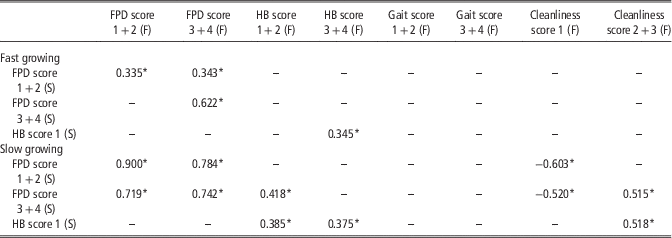
Table 3 summarizes correlation analysis results between the scores made at the slaughter plant and on-farm for fast and slow growing broilers. Correlations for all flocks are shown in Supplementary Table S3. No moderate or high correlations were found with breast blister scores. Moderate to strong correlations were found between severe on-farm FPD and HB and FPD and HB scored at slaughter. Correlations between HB and FPD at the slaughter plant and cleanliness on-farm were only found for slow growing flocks. For both fast and slow growing flocks separately no correlation was found between HB at the plant and gait score on-farm. Correlations between HB and FPD at the plant and cleanliness, HB and FPD on-farm were analyzed further as possible means of simplification (simplification strategy 2). Because of the correlation between on-farm HB and gait score (simplification strategy 1), predicting gait score from HB scores at the plant was also analyzed further as part of simplification strategy 2, despite the low correlations between gait score and HB for fast and slow growing flocks separately.
Spearman rank correlations (r sp) between slaughter plant and on-farm clinical scores, and slaughter plant clinical scores and on-farm gait scores for fast growing broiler flocks (upper part of the table) and flocks with slow growing broilers (lower part of the table) separately

FPD=footpad dermatitis; HB=hock burn; S=measured at the slaughter plant; F=measured on-farm; –=weak relationship: r sp<0.3.
Values of the measures in the calculations were the % of broilers affected in a flock.
*Denotes a significance of P<0.05 at least.
Comparison of simplified models and the full model for overall welfare categories
No overall welfare score could be calculated for 53 flocks because data from one or more measures were lacking. For the remaining 127 flocks the calculations resulted in seven flocks (5.5%) classified as ‘enhanced’, the majority of flocks (104, 81.9%) classified as ‘acceptable’, 16 flocks (12.6%) being ‘not classified’ and no flocks classified as ‘excellent’.
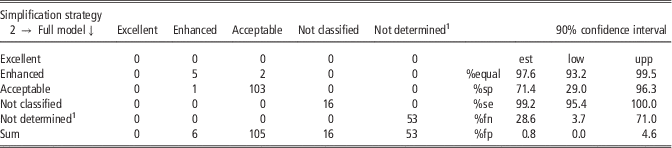
Simplification strategies resulted in similar overall welfare categories to those from the complete WQ assessment protocol (Tables 4 and 5). Although overall welfare categories from simplification strategy 1 were similar to results from the full model, a large confidence interval was found for specificity indicating that the specificity in the current study could be an over-estimation (Table 4), probably due to the unequal distribution of farms across the different welfare categories. In addition, for simplification strategy 2, there was high agreement in welfare categories between the full and simplified model but a large confidence interval for specificity (Table 5).
Comparison of overall welfare categories using the full model or simplification strategy model 1 (predicting gait scores from measures of hock burn on-farm)

The distribution of flocks across overall welfare categories as defined by Welfare Quality® (left side of the tables) and estimates for agreement between methods (Est), and the lower (Low) and upper (Upp) confidence limits within classification groups for equality (%equal), specificity (%sp), sensitivity (%se), % false negatives (fn) and % false positives (fp) of estimation (right side of the tables).
1 Overall welfare category could not be calculated because one or more measures were lacking.
Comparison of overall welfare categories using the full model or simplification strategy model 2 (substitution of on-farm measures by slaughterhouse scores)

The distribution of flocks across overall welfare categories as defined by Welfare Quality® (left side of the tables) and estimates for agreement between methods (Est), and the lower (Low) and upper (Upp) confidence limits within classification groups for equality (%equal), specificity (%sp), sensitivity (%se), % false negatives (fn) and % false positives (fp) of estimation (right side of the tables).
1 Overall welfare category could not be calculated because one or more measures were lacking.
Comparison of simplified models and the full model using principle and criterion scores affected by simplification
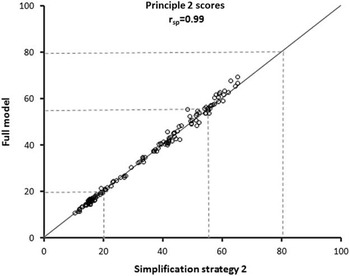
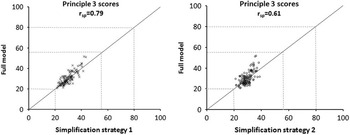
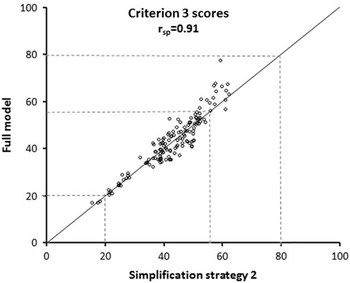
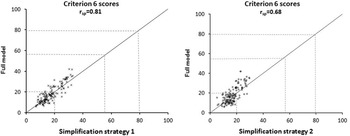
Principle 3 (good health) scores were affected by simplification strategy 1 (predicting gait score from HB scores) and 2 (predicting on-farm scores from slaughterhouse scores). Principle 2 (good housing) was affected by simplification strategy 2 only. Supplementary Table S4 shows the comparison of the simplification strategies with the full model for both principle and criterion scores affected by the simplification strategies. Figures 1 to 4 show the correlation between the scores calculated with the full and the simplified models for the principles and criteria affected by both simplification strategies. A very high correlation was found for principle 2 (good housing) and criterion 3 (comfort around resting) between the full and the simplified model (Figures 1 and 3). Scores for criterion 3 based on the full model and simplification strategy 2 were equal, although the specificity confidence interval for flocks in the category ⩽20 was large (upper=100; lower=36.8) (Supplementary Table S4). This was due to the small number of flocks in this category. For principle 3 (Figure 2) and criterion 6 (Figure 4) correlations between the full and simplified models were lower than for principle 2 and criterion 3. All flocks fell within the same WQ classification category for principle 3 (Figure 2). For criterion 6 the flocks were distributed across only two WQ classification categories (Figure 4).
Principle 2 (good housing) assessment scores based on the full model (y axis) plotted against assessment scores according to simplification strategy 2. The graph shows distribution of flocks over classification groups ⩽20, 20 to 55, ⩾55 and the correlation (Spearman rank correlation; r sp) between the full model and the simplified model.

Principle 3 (good health) assessment scores based on the full model (y axis) plotted against assessment scores according to simplification strategy 1 (graph A) or 2 (graph B). The graphs show distribution of flocks over classification groups ⩽20, 20 to 55, ⩾55 and the correlation (Spearman rank correlation; r sp) between the full model and the simplified models.

Criterion 3 (comfort around resting) assessment scores based on the full model (y axis) plotted against assessment scores according to simplification strategy 2. The graph shows distribution of flocks over classification groups ⩽20, 20 to 55, ⩾55 and the correlation (Spearman rank correlation; r sp) between the full model and the simplified model.

Criterion 6 (absence of injury) assessment scores based on the full model (y axis) plotted against assessment scores according to strategy 1 (graph A) or 2 (graph B). The graphs show distribution of flocks over classification groups ⩽20, 20 to 55, ⩾55 and the correlation (Spearman rank correlation; r sp) between the full model and the simplified models.

Discussion
It was studied whether simplification of the WQ broiler assessment protocol is possible. Analysis of the correlations between the animal-based measures showed encouraging results. Simplification could involve prediction of gait scores from HB measures on-farm, or prediction of clinical scores on-farm (FPD, HB and cleanliness) and gait scores on-farm from slaughter plant measures of FPD and HB, or both. However, before implementing one of these simplified protocols in practice, the proposed simplification strategies should be re-tested in flocks that are more widely distributed across the full range of the different WQ classification categories. In the current study the majority of the flocks converged into a single category (acceptable), which explains the large confidence intervals for specificity found for the different simplification strategies that were tested.
Meaningful correlation between animal-based measurements forms the basis of the proposed simplification strategies. With respect to the methodology used, it should be noted that any correlational analysis, including the calculation of Spearman rank correlations or the use of regression analysis, should be applied with prudence (see e.g. Bland and Altman, Reference Bland and Altman1986 and Finney, Reference Finney1989). Therefore, the association between the full WQ model and a simplified version of this model was not based on correlations alone. Our assessment explicitly considered the extent to which a simplified model was able to provide quantitative outcomes which, in absolute terms, were comparable to those obtained with the full model. This was accomplished by examining the distribution of flocks across classification groups for scores of criteria and principles, according to WQ (i.e. <20 points, between 20 and 55 points, >55 points). In addition, the welfare classification according to the full model was compared with the welfare classification according to a simplified model. Another important point to consider, is that in epidemiological terms, our sample of farms should be seen as a ‘convenience sample’ (Dohoo et al., Reference Dohoo, Martin and Stryhn2009); farmers participated on a voluntary basis, and we cannot be sure that the variations in animal-based measures obtained in our study are fully representative of the general population. Thus, in agreement with the cautionary note expressed by Finney (1989), we are fully aware of the limitations of the present findings. This implicates that although our results are promising, they should be validated based on the use of additional farm data.
On-farm, the highest correlation coefficient was found between severe gait scores and severe HB. HB may develop when broilers sit on their hocks for long periods and the hocks are in contact with litter of suboptimal quality (Haslam et al., Reference Haslam, Knowles, Brown, Wilkins, Kestin, Warriss and Nicol2007; Allain et al., Reference Allain, Mirabito, Arnould, Colas, Le Bouquin, Lupo and Michel2009), and incidence of HB increases with age and weight (Hepworth et al., Reference Hepworth, Nefedov, Muchnik and Morgan2010). Broilers reduce activity levels with age, and a strong decrease has been observed in broilers older than 3 weeks (Newberry and Hall, Reference Newberry and Hall1990; Shields et al., Reference Shields, Garner and Mench2005). Increased age and BW also increases the risk of leg problems resulting in increased (worsening) gait scores (Corr et al., Reference Corr, Gentle, McCorquodale and Bennett2003; Knowles et al., Reference Knowles, Kestin, Haslam, Brown, Green, Butterworth, Pope, Pfeiffer and Nicol2008). Broilers with leg problems are generally less active and consequently spend more time sitting on their hocks, thereby increasing the risk of HB particularly when litter quality is poor. This may explain the correlations between high gait scores and severe HB found in the current study.
However, this finding raises the question of whether this relationship is always valid, as farmers may be able to keep litter in good condition, but at the same time find that their broilers have a high gait (worse) score. The results therefore should be validated with additional farm data. In the current study, litter quality was variable across farms – ranging from very good to very poor (average litter score for all flocks was 2.3 on a scale ranging from 0 (best) to 4 (worst)).
There is a logical explanation for a relationship between the scores for cleanliness, HB and FPD. Poor litter quality that is the most important factor influencing contact dermatitis (Shepherd and Fairchild, Reference Shepherd and Fairchild2010) is also thought to cause an increase in the number of dirty and soiled broilers (de Jong et al., Reference de Jong, Gunnink and van Harn2014).
A high correlation was found between FPD scores at the slaughter plant and on-farm, despite the fact that assessment of FPD on-farm is difficult due to dirty feet and potentially low light intensities in the broiler house (de Jong et al., Reference de Jong, van Harn, Gunnink, Lourens and van Riel2012). In a previous study, no correlation was found between FPD assessment on-farm and at the slaughter plant but that study involved a much lower number of flocks (De Jong et al., Reference de Jong, Reimert, Vanderhasselt, Gerritzen, Gunnink, van Harn, Hindle and Lourens2011). Sample size and the number and location of samples in a house, or the distribution of samples within a flock at slaughter are important aspects of methodology for assessment both on-farm and at the slaughter plant (de Jong et al., Reference de Jong, van Harn, Gunnink, Lourens and van Riel2012).
Both simplification strategies as proposed in the current study are promising in terms of reducing assessment time. Predicting gait scores using HB scoring on-farm reduces the time spent for on-farm assessment by ~1 h, equivalent to a 25% to 33% reduction in time to complete on-farm measurements (Welfare Quality, 2009). Prediction of on-farm FPD, HB, gait and cleanliness scores using slaughter plant measurements is more encouraging in terms of reduction of time to complete the protocol; time for on-farm assessment will be reduced with ~2 h, equivalent to two-thirds of the time required to complete on-farm measurements (Welfare Quality, 2009).
Regular assessment of FPD is performed in some countries (Denmark, Sweden, The Netherlands) because of the country-specific requirement to collect this data under broiler welfare legislation (Broiler Directive 2007/43/EC) (Berg and Algers, Reference Berg and Algers2004; de Jong et al., Reference de Jong, van Harn, Gunnink, Lourens and van Riel2012). In these countries, an assessment procedure is already in place at slaughter plants. HB and breast lesions are also scored on a routine basis in the slaughter plant in many countries (Butterworth et al., Reference Butterworth, De Jong, Keppler, Stadig and Lambton2015). This is of particular interest for the simplification strategy based on the use of slaughter plant measurements, as integration with existing measures may facilitate the use of the welfare assessment protocol in practice. Although slaughter plant measures have some advantages as compared with on-farm measures, such as better visibility of the birds, more standardized conditions (e.g. light intensity) and absence of dirt on the carcasses and feet (after scalding), there are, however, also disadvantages that need to be taken into account. For example, a high line speed may complicate detailed assessment and proper sampling, and for some measures, such as behaviour or gait score, assessment can only be done in live birds.
Both strategies for simplification, that is, predicting gait scores from HB on-farm and substitution of on-farm assessment (gait score, cleanliness, FPD and HB) with slaughter plant assessment scores (FPD and HB), agreed favourably between overall welfare categories and scores for individual principles and criteria. In addition, a high correlation was found between the full model, and simplified strategies for principle and criteria scores.
The degree of agreement between the full model and the simplification strategies is encouraging with regard to potential future use of a simplified assessment protocol for broilers. However, simplification with the current data set is based on flocks in which the majority were placed in the same welfare classification category (i.e. ‘acceptable’) despite a large variation on the level of the individual measures. Large confidence intervals were sometimes found for sensitivity and specificity of the simplified models, this being caused by the relatively small number of farms for certain categories (enhanced, not classified). This indicates a bias and suggests that caution should be taken regarding simplification despite close agreement and high correlations found at the principle and criterion level.
When flocks in the current study were more widely distributed across the different welfare classification categories, smaller confidence intervals were found. Taking this into consideration, the results indicate that simplification of the broiler assessment protocol, using either strategy 1 or 2, is encouraging, but requires further validation using new flocks that are more widely distributed across the different WQ classification categories.
Large between-flock variation in individual measurements was not reflected in variation in the overall welfare categories. In addition, large differences in scores for individual measures were found between flocks from standard and alternative rearing systems but this did also not result in variation in overall welfare categories. One aspect that may play a role in the absence of variation in overall welfare categories is the fact the WQ model does not compensate for low criterion and principle scores (overall welfare categories are not based on average scores). Another possibility is that calculation of overall welfare category scores, according to the broiler assessment protocol, does not sufficiently differentiate welfare levels between flocks. A third possibility is that farmers who ‘volunteer’ to take part in research study visits usually have farms that perform well to moderate, while poorly performing farms may not routinely be asked by poultry companies to participate in research visits.
This was the first time that analysis of scores has been performed on such a large data set for broiler flocks. The WQ model applies rules governing the assignment of an animal unit into a final welfare category, based on data of a limited set of European farms and on value-based and ethical decisions of experts (animals and social scientists) and stakeholders. The final WQ model for calculation of flock scores therefore reflects their assessments and ethical reasoning. Within WQ it was decided (1) to define animal welfare based on 12 criteria and then to aggregate information at the criterion level, (2) that the overall welfare assessment was based on the worse-off animals and not on the average of a flock and (3) that welfare scores could not compensate each other. Finally, for the flock scores, absolute limits were chosen (Veissier et al., Reference Veissier, Jensen, Botreau and Sandøe2011). As the current study showed that despite large inter-flock variation in scores for individual measures the majority of farms finally aggregated into a single welfare category, it is advised that a critical review of the aggregation method from measures to overall welfare category is now carried out based on the expanding information now available and before further consideration for use of the overall welfare categories in practice, as also indicated by Veissier et al. (Reference Veissier, Jensen, Botreau and Sandøe2011).
In conclusion, as a result of the analyses carried out in the current study, two possible simplification strategies for the WQ broiler assessment protocol are proposed. The simplification strategies provide encouraging results, with close agreement to the full model at the overall welfare category, principle and criterion levels and both simplification strategies reduce assessment time, which may be advantageous to adoption and acceptance of these methods for practical use. However, it is strongly advised that the simplification strategies should be validated further, preferably with flocks that are widely distributed across the range of different welfare classification categories.
Acknowledgements
This project was financially supported by the Ministry of Economic Affairs. Special thanks to the assessors and colleagues involved in the project planning: Steve Brown, Roselien Vanderhasselt, Valentina Ferrante, Cindy Hoeks, Annemae Kremer, Judith Lammers, Erik Schuiling, Theo van Hattum, Jan Jochemsen, Jitske Westra, Sander Lourens, Henk Schilder, Guus Nijeboer, Ido Alferink, Monique Mul and Ruud Dekker, to Hans van den Heuvel for his IT support work, to the statisticians of Biometris for their support with the statistical analyses and to the participating farmers and slaughter plants for their cooperation.
Supplementary material
For supplementary material/s referred to in this article, please visit http://dx.doi.org/10.1017/S1751731115001706