1 Introduction
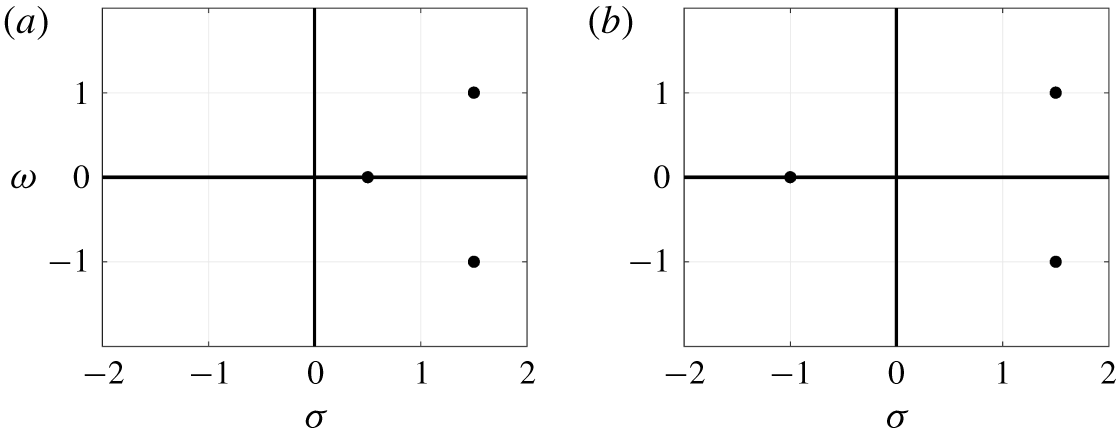
This study advances mean-field modelling for successive symmetry breaking due to Hopf and pitchfork bifurcations. The theoretical framework is applied to the transition of the flow around a cluster of circular cylinders, termed the fluidic pinball for the possibility of controlling the fluid particle by cylinder rotation (Noack & Morzyński Reference Noack and Morzyński2017; Ishar et al. Reference Ishar, Kaiser, Morzynski, Fernex, Semaan, Albers, Meysonnat, Schröder and Noack2019).
Mean-field theory was pioneered by Landau (Reference Landau1944) and Stuart (Reference Stuart1958) and is a singular triumph of nonlinear reduced-order modelling in fluid mechanics. Already the most simple mean-field model for the supercritical Hopf bifurcation reveals deep insights into the coupling between the fluctuations and the mean flow, e.g. the damping mechanism of unstable modes by Reynolds stress. In addition, the Malkus (Reference Malkus1956) principle of marginal stability for time-averaged flows, the square root growth law of fluctuation level with increasing Reynolds number, the cubic damping term from a linear–quadratic dynamics, the energetic explanation of this amplitude dynamics and the slaving principle leading to manifolds driven by the ensemble-averaged Reynolds stress are easily derived. Also, the idea of centre manifold theory and the surprising success of linear parameter-varying models are analytically illustrated. Historically, Landau was the first to derive the normal form of the dynamics with the Krylov–Bogoliubov approximation (an averaging method for spiral phase paths, see e.g. Jordan & Smith Reference Jordan and Smith1999) while Stuart could explain how the cubic damping term arises from the distorted mean flow.
Mean-field models for a supercritical Hopf bifurcation with an unstable oscillatory eigenmode have been applied and validated for numerous configurations. The onset of vortex shedding behind a cylinder wake has been thoroughly investigated (Strykowski & Sreenivasan Reference Strykowski and Sreenivasan1990; Schumm, Berger & Monkewitz Reference Schumm, Berger and Monkewitz1994; Noack et al. Reference Noack, Afanasiev, Morzyński, Tadmor and Thiele2003). Even high Reynolds number turbulent wake flow can display a distinct mean-field manifold modelled by a noise-driven mean-field model (Bourgeois, Noack & Martinuzzi Reference Bourgeois, Noack and Martinuzzi2013).
A supercritical pitchfork bifurcation similarly arises by an unstable eigenmode with a real eigenvalue. The onset of convection rolls in the Rayleigh–Bénard problem is a famous example (Zaitsev & Shliomis Reference Zaitsev and Shliomis1971; Swift & Hohenberg Reference Swift and Hohenberg1977; Cross & Hohenberg Reference Cross and Hohenberg1993). The features of a pitchfork bifurcation are observed for the sidewise symmetry breaking of the time-averaged Ahmed body wake (Grandemange, Cadot & Gohlke Reference Grandemange, Cadot and Gohlke2012; Grandemange, Gohlke & Cadot Reference Grandemange, Gohlke and Cadot2013; Cadot, Evrard & Pastur Reference Cadot, Evrard and Pastur2015; Bonnavion & Cadot Reference Bonnavion and Cadot2018) and more generally in three-dimensional wake flows (Mittal Reference Mittal1999; Gumowski et al. Reference Gumowski, Miedzik, Goujon-Durand, Jenffer and Wesfreid2008; Szaltys et al. Reference Szaltys, Chrust, Przadka, Goujon-Durand, Tuckerman and Wesfreid2012; Grandemange, Gohlke & Cadot Reference Grandemange, Gohlke and Cadot2014; Rigas et al. Reference Rigas, Oxlade, Morgans and Morrison2014). In contrast, the drag crisis of a circular cylinder is associated with a subcritical bifurcation into two asymmetric sheddings with opposite mean lift values (Schewe Reference Schewe1983).
Not surprisingly, numerous generalizations of mean-field models have been proposed. Landau (Reference Landau1944) and Hopf (Reference Hopf1948) have conjectured that high-dimensional fully developed turbulence may be explained by an increasingly rapid succession of Hopf bifurcations. This idea has been discarded as unlikely (see, for instance, Landau & Lifshitz Reference Landau and Lifshitz1987). The seminal paper by Ruelle & Takens (Reference Ruelle and Takens1971) showed that turbulence does not arise as a successive superposition of oscillators, but irregular chaotic behaviour can already appear after a few bifurcations. A second direction is the explanation of nonlinear coupling between two incommensurable shedding frequencies (Luchtenburg et al. Reference Luchtenburg, Günter, Noack, King and Tadmor2009), also referred to as frequency cross-talk in the following. This amplitude coupling over the mean flow has been termed quasi-laminar in Reynolds & Hussain (Reference Reynolds and Hussain1972), pioneering theoretical foundation of the triple decomposition. The advancements also include subcritical bifurcations (Watson Reference Watson1960). More specifically, the case of a codimension two bifurcation, involving both a pitchfork and a Hopf bifurcation, was addressed in Meliga, Chomaz & Sipp (Reference Meliga, Chomaz and Sipp2009), who derived the amplitude equation based on the weakly nonlinear analysis of the wake of a disk. Fabre, Auguste & Magnaudet (Reference Fabre, Auguste and Magnaudet2008) derived the same equation solely based on symmetry arguments for the wake of axisymmetric bodies. A resolvent analysis follows mean-field considerations in decomposing the flow in a time-resolved linear dynamics and a feedback term with the quadratic nonlinearity (Gomez et al. Reference Gomez, Blackburn, Rudman, Sharma and McKeon2016; Rigas et al. Reference Rigas, Schmidt, Colonius and Bres2017).
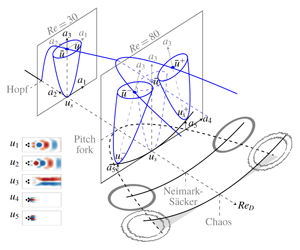
Our study develops a generalized mean-field Galerkin model for the first two bifurcations of the fluidic pinball with increasing Reynolds number. The primary supercritical bifurcation leads to periodic vortex shedding which is statistically symmetric. At higher Reynolds numbers, the resulting limit cycle undergoes a pitchfork bifurcation into a stable, asymmetric, mirror-symmetric pair of periodic solutions. This local bifurcation has a transverse effect resulting from the decoupling of these two bifurcations (see appendix E), which simultaneously leads to an identical local pitchfork bifurcation of the steady solution, into an unstable, asymmetric, mirror-symmetric pair of steady solutions. The underlying dynamics is modelled with a small number of assumptions. The key simplification results from exploiting the symmetry of the mean flow and the antisymmetry of the fluctuation. The generalized mean-field Galerkin methodology can be expected to be useful for describing other transition scenarios.
The manuscript is organized as follows. In § 2, the numerical plant is introduced and the Reynolds number dependent flow behaviour described. This phenomenology drives the mean-field modelling of the first two bifurcations in § 3. The resulting models for the Hopf and subsequent pitchfork bifurcation are present in § 4 and § 5, respectively. Section 6 summarizes the results and outlines future directions of research.
2 Flow configuration
In this section we describe the numerical toolkit and the flow features as the Reynolds number is increased. The direct Navier–Stokes solver with MATLAB interfaces, used for the simulation, is described in § 2.1. The fluidic pinball configuration and the flow features and route to chaos are described in § 2.2 and § 2.3, respectively.
2.1 Direct Navier–Stokes solver
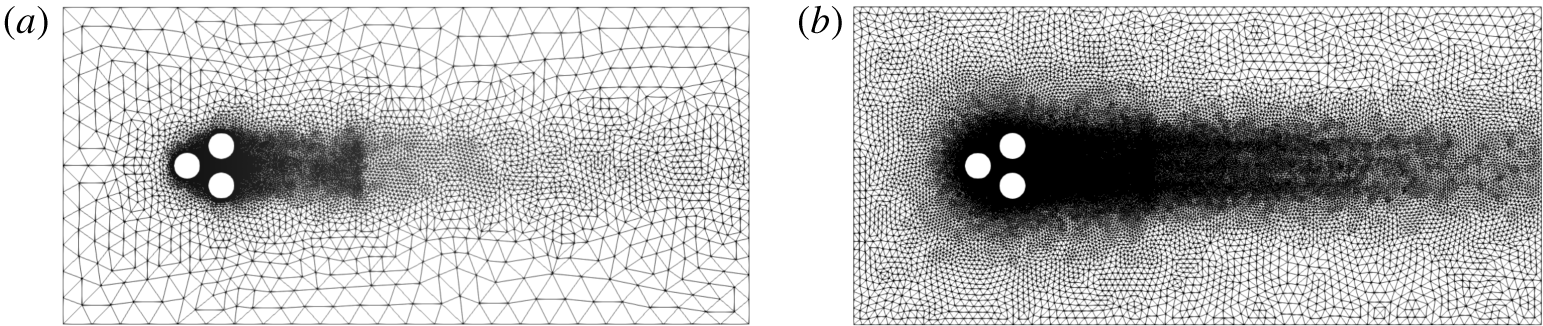
The unsteady Navier–Stokes solver is based on fully implicit time integration and finite-element method (FEM) discretization (Noack & Morzyński Reference Noack and Morzyński2017; Noack et al. Reference Noack, Afanasiev, Morzyński, Tadmor and Thiele2003, Reference Noack, Stankiewicz, Morzyński and Schmid2016). The time integration is third-order accurate while FEM discretization employs second–order Taylor–Hood finite elements (Taylor & Hood Reference Taylor and Hood1973). The solution is obtained iteratively, with the Newton–Raphson type approach. The tangent matrix is updated at each iteration and computations are carried out until the residual is under a prescribed tolerance. The steady solution is obtained in a similar Newton–Raphson iteration for the steady Navier–Stokes equations. The convergence to one of the three steady solutions with different states of the base-bleeding jet is triggered by appropriate ‘initial’ conditions in the iteration, see appendix A. The solver quickly converges to one of the steady states and a final, near-zero residual confirms that this is indeed the steady flow solution sought. The computational domain is discretized on an unstructured grid. Pinball configuration uses a grid with 4225 triangles and 8633 vertices (see figure 1a). To test the grid dependency of the solution we increased the number of triangles by nearly a factor 4 (26 849 elements and 54 195 nodes, see figure 1b). The flow patterns shown in figure 2 develop from a steady solution at  $Re=100$ subjected to an instantaneous rotation of cylinders at
 $T=0.2$. The upper cylinder rotates counterclockwise, the lower one clockwise and the centre cylinder also in a clockwise direction – all with unit circumferential velocity, i.e. the velocity of oncoming flow
 $U_{\infty }$. This configuration and boundary conditions result in the vortex shedding shown in figure 2 for the time instance
 $t=200$. Both simulations prove grid independence and yield dynamically consistent results (see figure 2).
Computational grid for the fluidic pinball, with 8633 (a) and 54 195 vertices (b).

Direct numerical simulation (DNS) computations on a grid with 8633 nodes (a) and 54 195 nodes (b). Vorticity depicted with colour is  $[-1.5,1.5]$,
 $t=200$. The initial kick is provided by a rotation of all three cylinders at
 $t=0.2$, see text for details.

2.2 Pinball configuration
We refer to the configuration shown in figure 1 as the fluidic pinball as the rotation speeds allow one to change the paths of the incoming fluid just as flippers manipulate the ball of a conventional pinball machine. The fluidic pinball is a set of three equal circular cylinders with radius  $R$ placed parallel to each other in a viscous incompressible uniform flow at speed
 $U_{\infty }$. The flow over a cluster of three parallel cylinders has been experimentally studied involving heat transfer, fluid–structure interactions and multiple frequency interactions over the past few decades (Price & Paidoussis Reference Price and Paidoussis1984; Sayers Reference Sayers1987; Lam & Cheung Reference Lam and Cheung1988; Tatsuno, Amamoto & Ishi-i Reference Tatsuno, Amamoto and Ishi-i1998; Bansal & Yarusevych Reference Bansal and Yarusevych2017). For the fluidic pinball, the cylinders can rotate at different speeds, creating a kaleidoscope of vortical structures or variety of steady flow solutions. The configuration is used for evaluation of flow controllers (Cornejo Maceda Reference Cornejo Maceda2017) as this problem is a challenging task for control methods comprising several frequency cross-talk mechanisms (Noack & Morzyński Reference Noack and Morzyński2017). The centres of the cylinders form an equilateral triangle with side length
 $3R$, symmetrically positioned with respect to the flow. The leftmost triangle vertex points upstream, while the rightmost side is orthogonal to the oncoming flow. The origin of the Cartesian coordinate system is placed in the middle of the top and bottom cylinder. The fluidic pinball computational domain, shown in figure 1, is bounded by the rectangle
 $[-6,20]\times [-6,6]$.
Without forcing, the boundary conditions comprise a no-slip condition on the cylinders and a unit velocity in the far field,
 $$\begin{eqnarray}U_{r}=0\quad \text{on the cylinders and }U_{\infty }=\boldsymbol{e}_{x}\text{ at infinity}.\end{eqnarray}$$
The far field boundary conditions are exerted on the inflow, upper and lower boundaries while the outflow boundary is assumed to be a stress-free one, transparent for the outgoing fluid structures. A typical initial condition is the unstable steady Navier–Stokes solution  $\boldsymbol{u}_{s}(\boldsymbol{x})$.
In this study, all three cylinders remain static as we are interested in the natural dynamics of the flow as the Reynolds number is increased.
2.3 Flow features
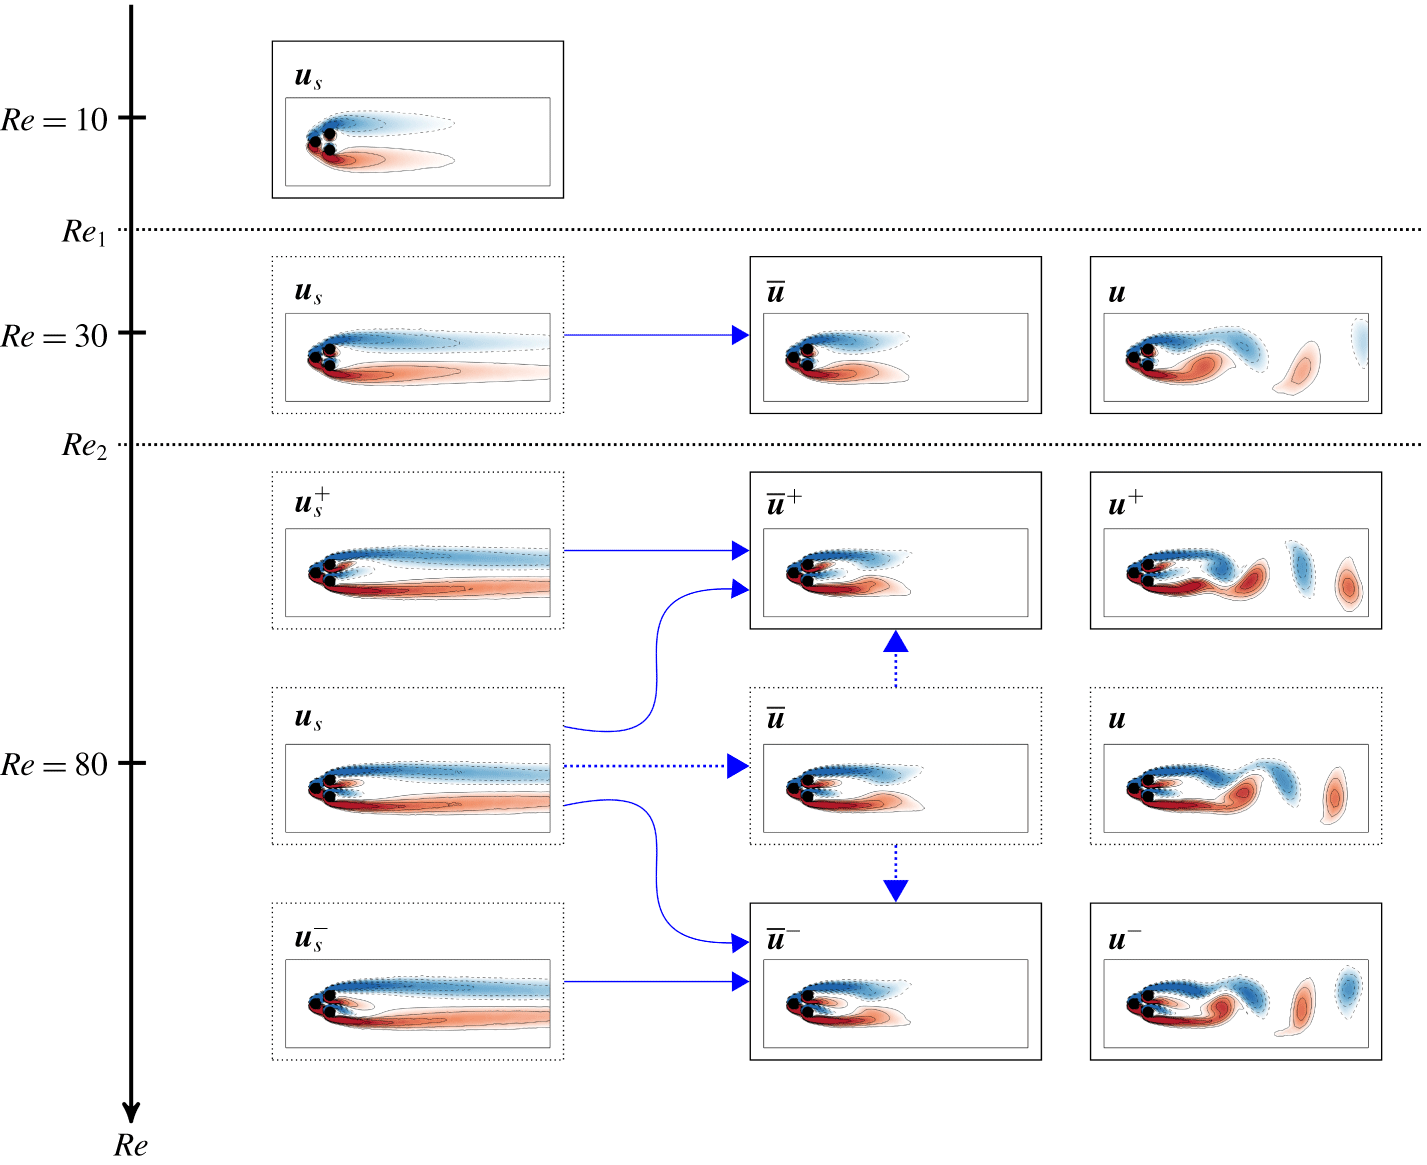
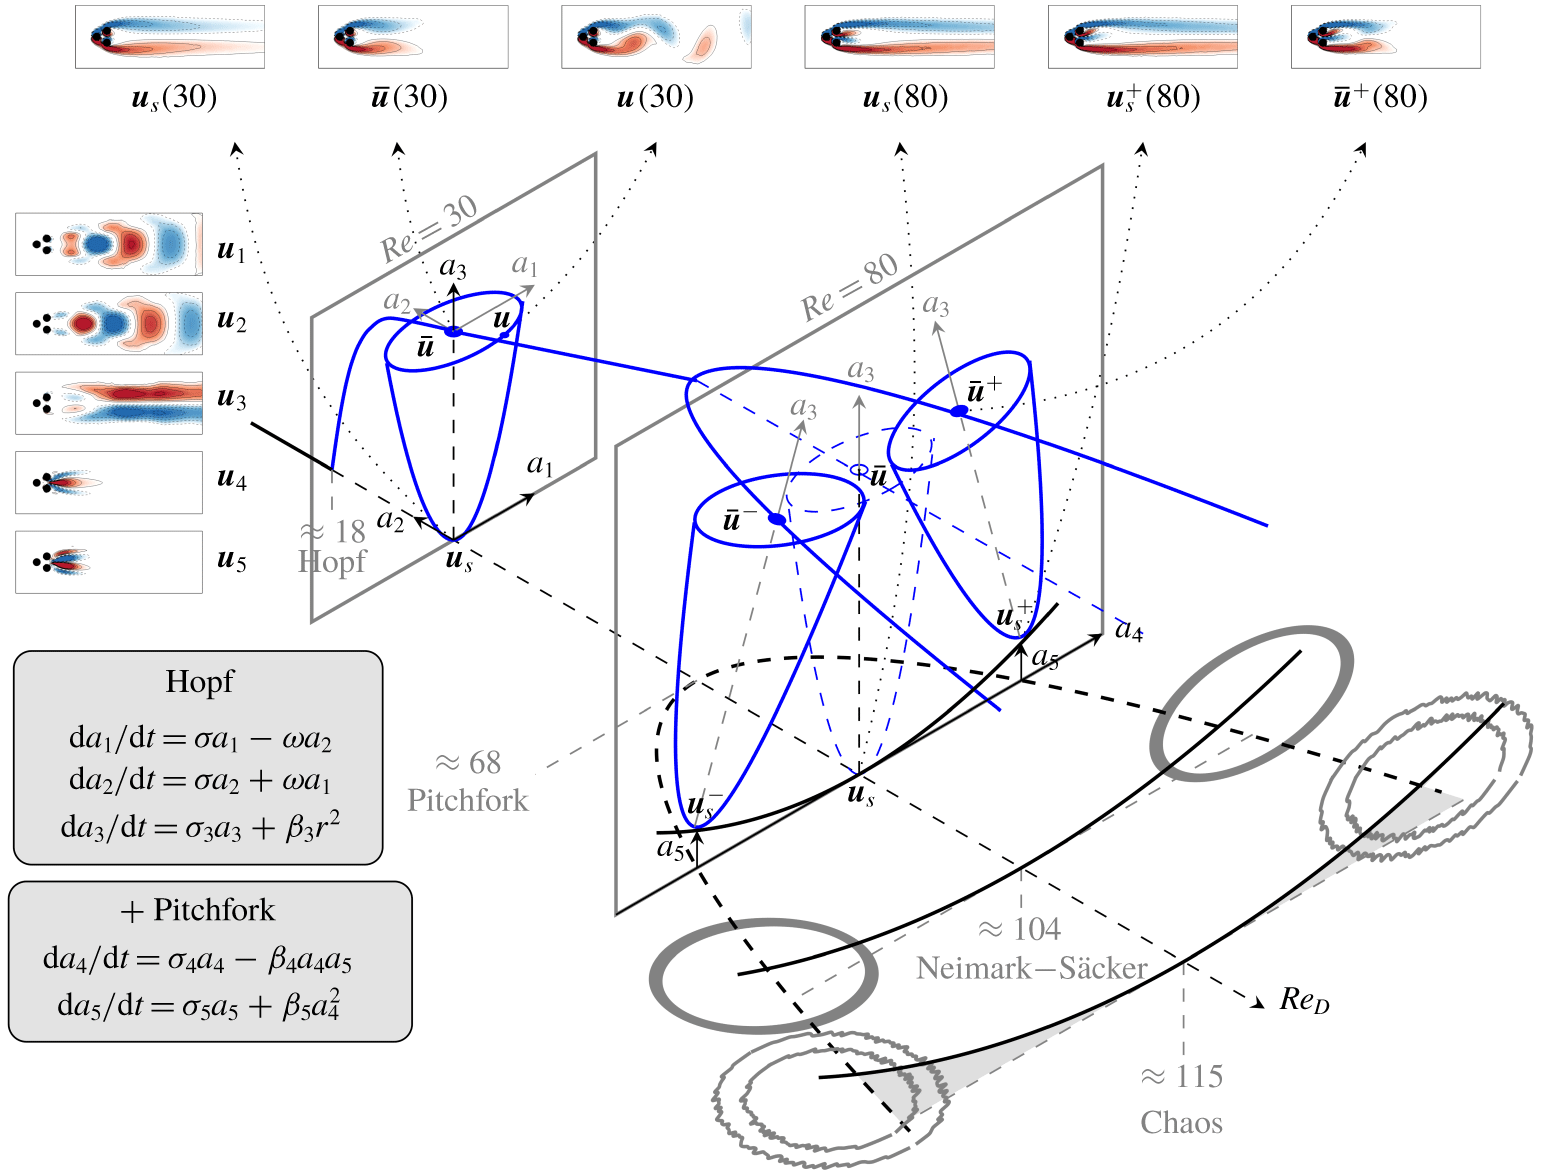
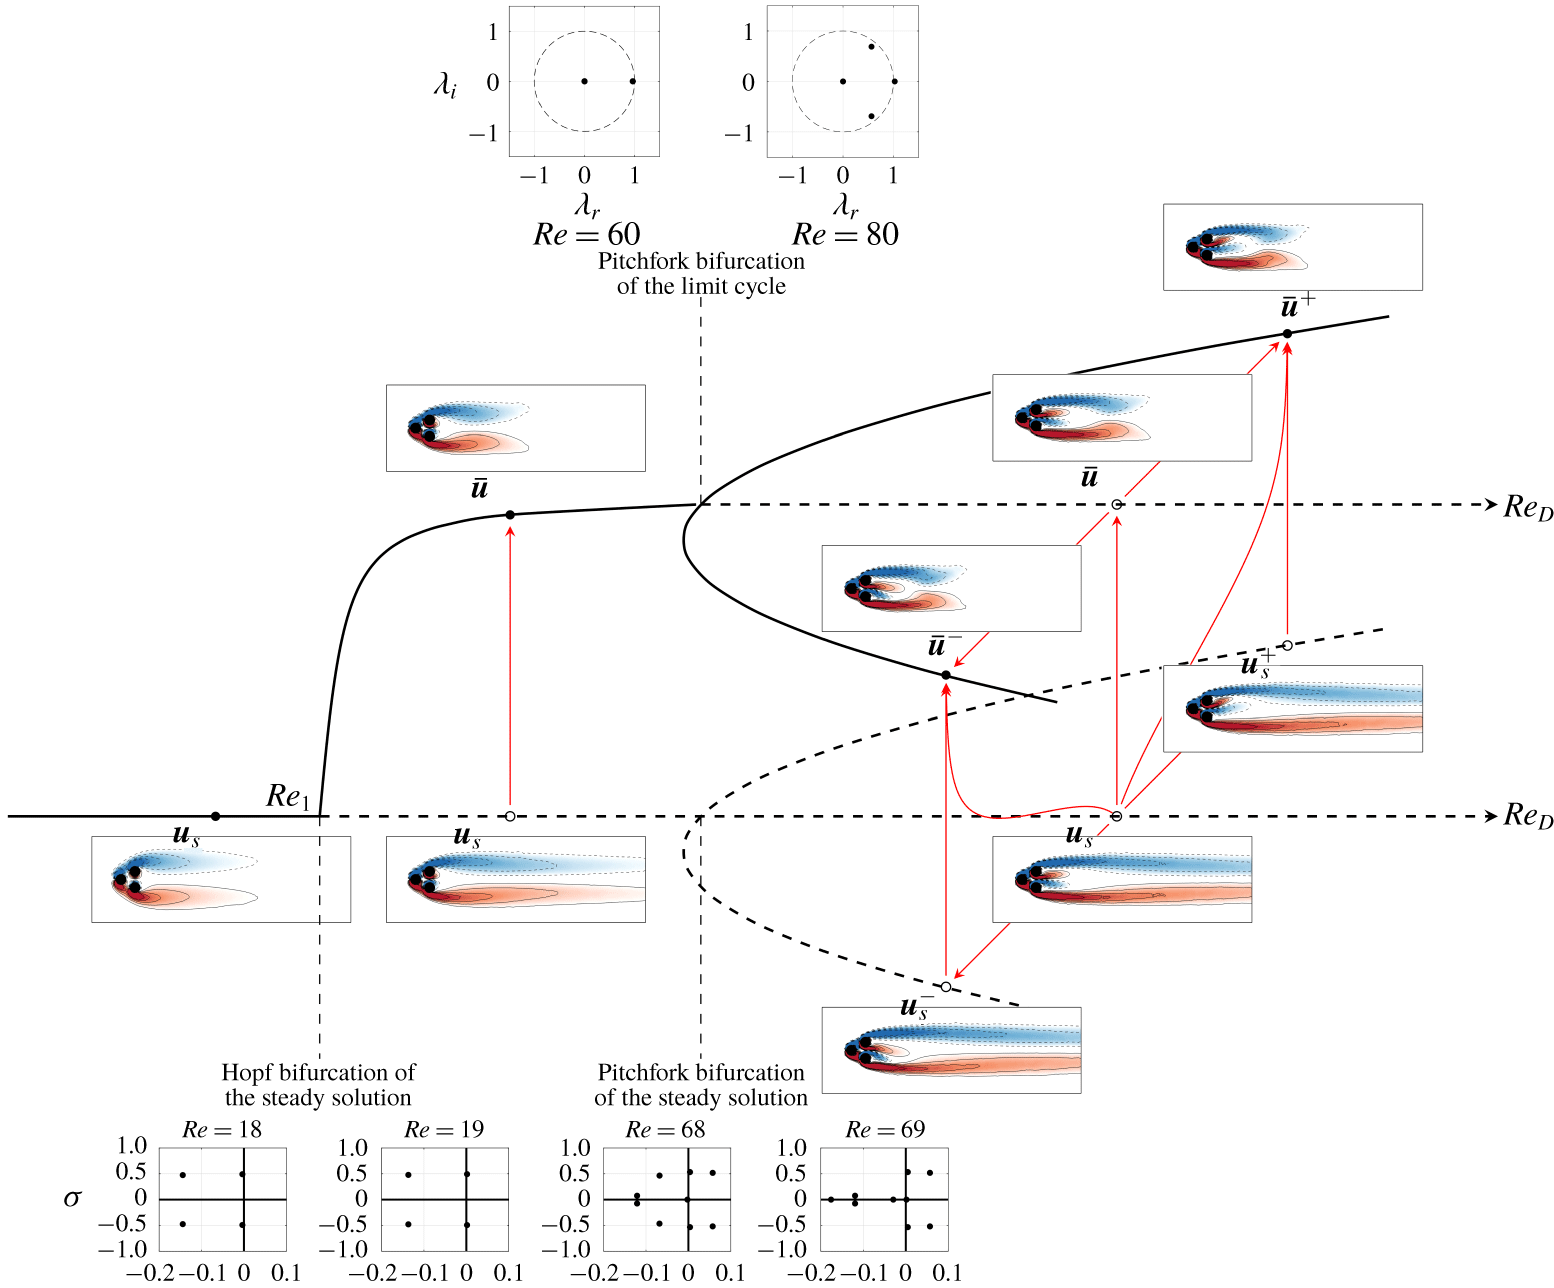
Flow states at different values of the Reynolds number: the stable states are labelled with a solid-line box and the unstable states with a dashed-line box. Steady solutions  $\boldsymbol{u}_{s}(\boldsymbol{x})$ (on the left side): three steady solutions
 $\boldsymbol{u}_{s}(\boldsymbol{x})$ (symmetric),
 $\boldsymbol{u}_{s}^{\pm }(\boldsymbol{x})$ (asymmetric), exist at
 $Re=80$. For
 $Re=30$ and
 $Re=80$, the steady solutions are unstable: the permanent regime
 $\boldsymbol{u}(\boldsymbol{x},t)=\overline{\boldsymbol{u}}(\boldsymbol{x})+\boldsymbol{u}^{\prime }(\boldsymbol{x},t)$ is unsteady with mean flow field
 $\overline{\boldsymbol{u}}(\boldsymbol{x})$. At
 $Re=80$, the instantaneous flow field
 $\boldsymbol{u}(\boldsymbol{x},t)=\overline{\boldsymbol{u}}(\boldsymbol{x})+\boldsymbol{u}^{\prime }(\boldsymbol{x},t)$, transiently explored when starting close to
 $\boldsymbol{u}_{s}(\boldsymbol{x})$, is unstable with respect to either
 $\boldsymbol{u}^{\pm }(\boldsymbol{x},t)=\overline{\boldsymbol{u}}^{\pm }(\boldsymbol{x})+\boldsymbol{u}^{\prime }(\boldsymbol{x},t)$.

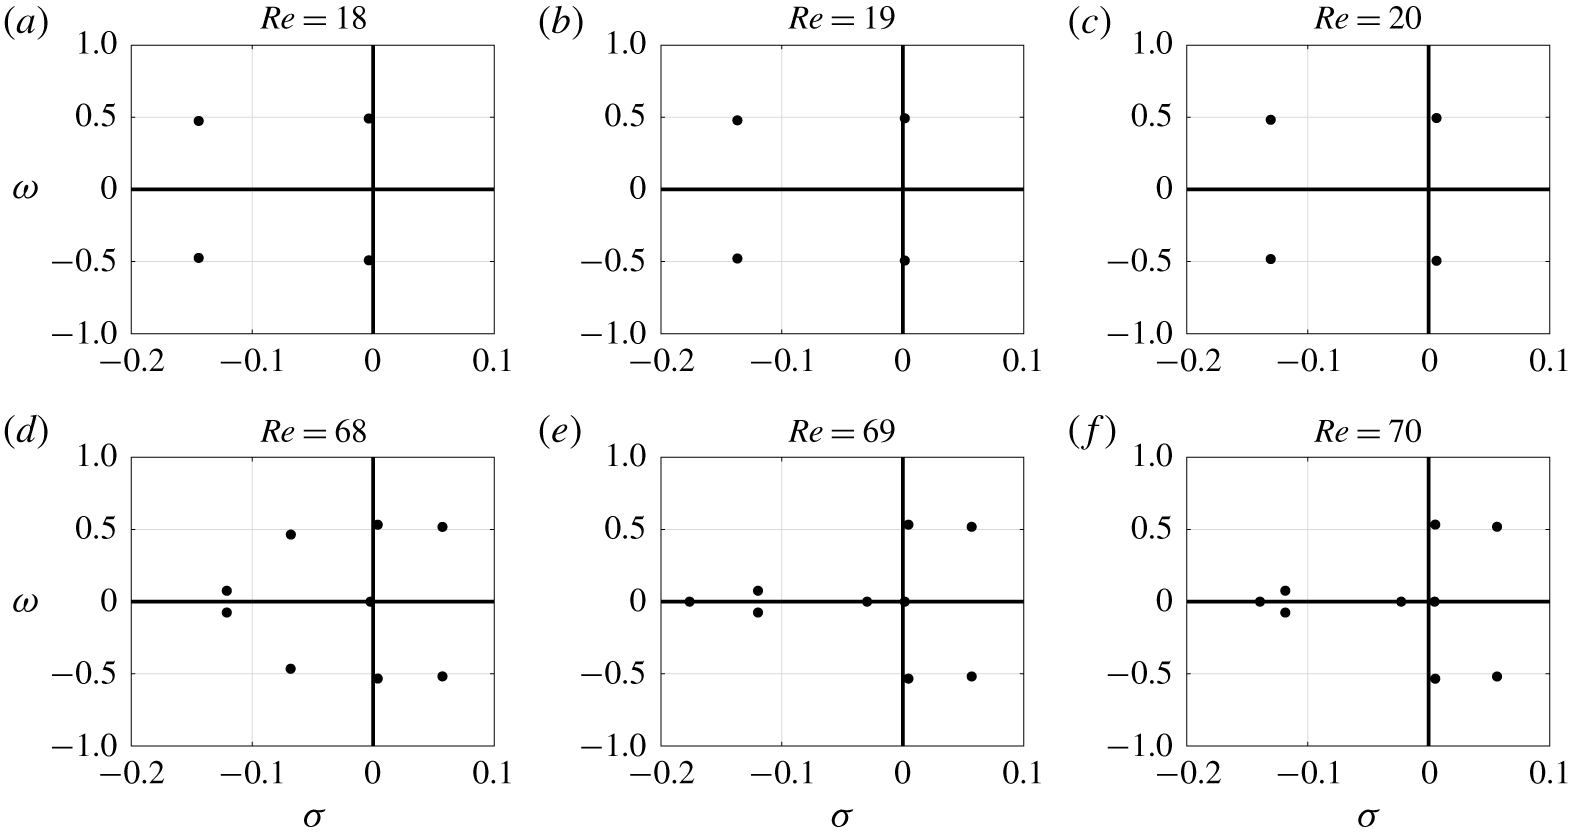
The steady solution  $\boldsymbol{u}_{s}$, shown in figure 3 for different values of the Reynolds number
 $Re$, is stable up to the critical value
 $Re_{1}\approx 18$. This value corresponds to
 $5/2\times Re_{1}\approx 45$ with respect to the actual body height
 $5R$, which is consistent with the critical value of the Reynolds number found for a single cylinder (Ding & Kawahara Reference Ding and Kawahara1999; Barkley Reference Barkley2006). Beyond
 $Re_{1}$, the steady solution becomes unstable with respect to vortices periodically and alternately shed at the top and bottom of the two rightmost cylinders, following a Hopf bifurcation (instability of the fixed point via a pair of complex-conjugated eigenvalues, see e.g. Strogatz et al. (Reference Strogatz, Friedman, Mallinckrodt and McKay1994)). In addition to the resulting von Kármán street of vortices, the gap between the cylinders makes possible the formation of a jet at the base of the two outer cylinders. The steady solution
 $\boldsymbol{u}_{s}$, the mean flow
 $\overline{\boldsymbol{u}}$ and the instantaneous flow field
 $\boldsymbol{u}$, are shown in figure 3, for
 $Re=30$.
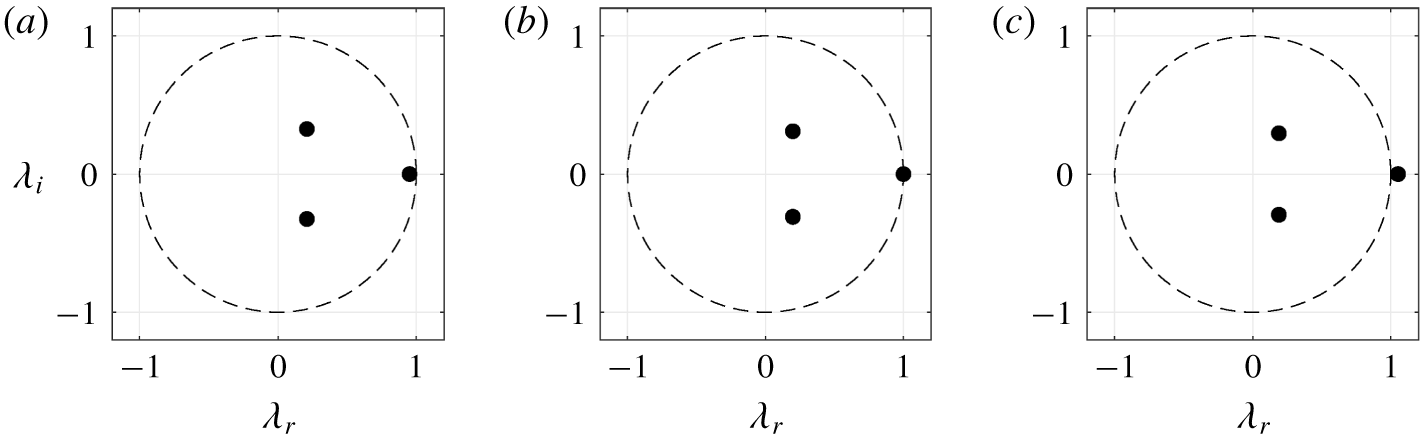
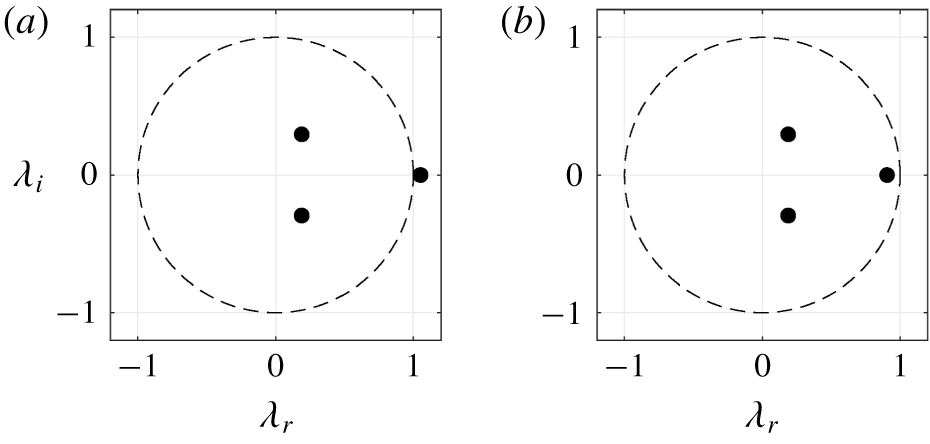
The flow passing between the two rearward cylinders, the base-bleeding flow, has a critical impact on the successive bifurcations undergone by the system on the route to chaos. Indeed, beyond a secondary critical value  $Re_{2}\approx 68$ of the Reynolds number, the system undergoes a pitchfork bifurcation, which affects both the fixed point and the limit cycle, via a real eigenvalue, see e.g. Strogatz et al. (Reference Strogatz, Friedman, Mallinckrodt and McKay1994). As a result, the symmetry of both the steady solution and the mean flow is broken with respect to the symmetry plane defined by
 $y=0$. This is illustrated by the two mirror-conjugated steady solutions
 $\boldsymbol{u}_{s}^{\pm }$ and the two associated mean flows
 $\overline{\boldsymbol{u}}^{\pm }$, shown in figure 3 for
 $Re=80$, where the base-bleeding jet appears deflected either upward or downward with respect to the symmetry plane. Note, however, that a symmetry-preserving mean flow (
 $\overline{\boldsymbol{u}}$ in figure 3 for
 $Re=80$) still exists beyond the secondary bifurcation, so that three mean flows exist beyond
 $Re_{2}$: two of them,
 $\overline{\boldsymbol{u}}^{\pm }$, are mirror conjugated and break the symmetry, while the last one,
 $\overline{\boldsymbol{u}}$ preserves the symmetry. This bifurcation of the limit cycle is coincident with the bifurcation of the fixed point, as three steady solutions can be found beyond
 $Re_{2}$:
 $\boldsymbol{u}_{s}^{\pm }$ are mirror conjugated and break the symmetry, while the last one,
 $\boldsymbol{u}_{s}$ preserves the symmetry. Yet, all three of them are unstable with respect to the cyclic shedding of von Kármán vortices, in which symmetry properties of the steady solution are succeeded in the resulting mean flow. When the initial condition is close to the symmetric steady solution
 $\boldsymbol{u}_{s}$, the flow regime arrives after a long transient on a limit cycle whose mean flow
 $\overline{\boldsymbol{u}}$ is symmetric, as illustrated in figure 3 for
 $Re=80$. However, the dynamics of this limit cycle is only transient, indicating that it is not a stable state. After a new transient, depending on the details of the initial condition, the flow regime eventually reaches one of the two mirror-conjugated limit cycles (centred on either
 $\overline{\boldsymbol{u}}^{\pm }$). When the initial condition already breaks the symmetry of the flow configuration, the unstable ‘symmetry-centred’ limit cycle is not explored and the system reaches directly one of the two stable limit cycles. The transient dynamics between these six typical states beyond
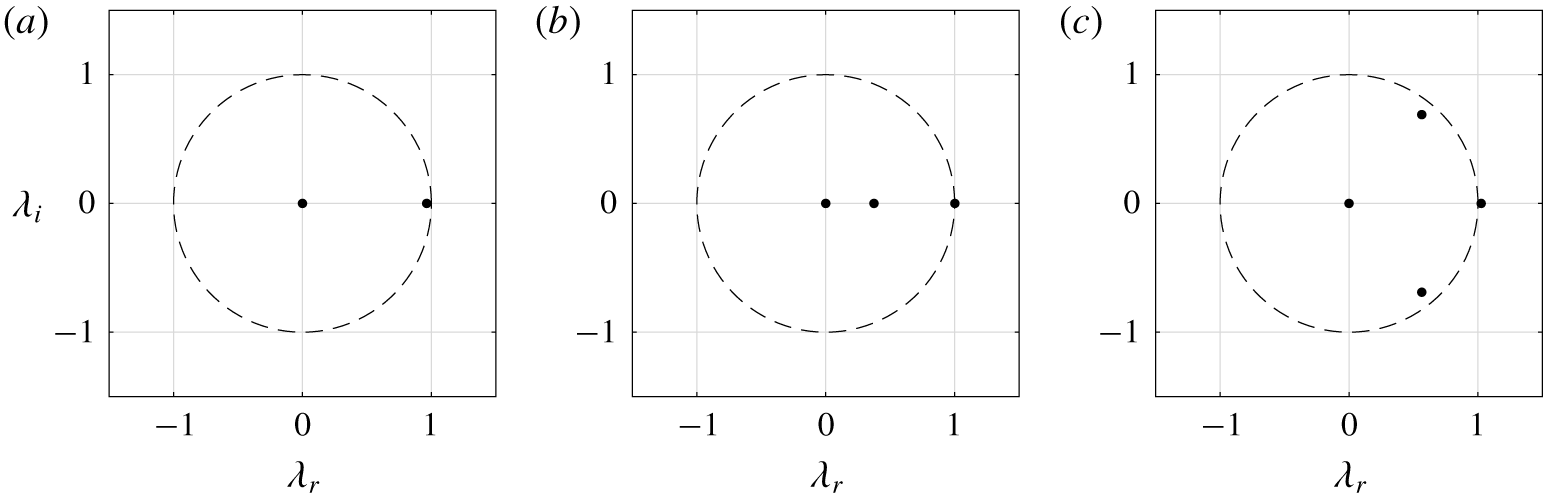
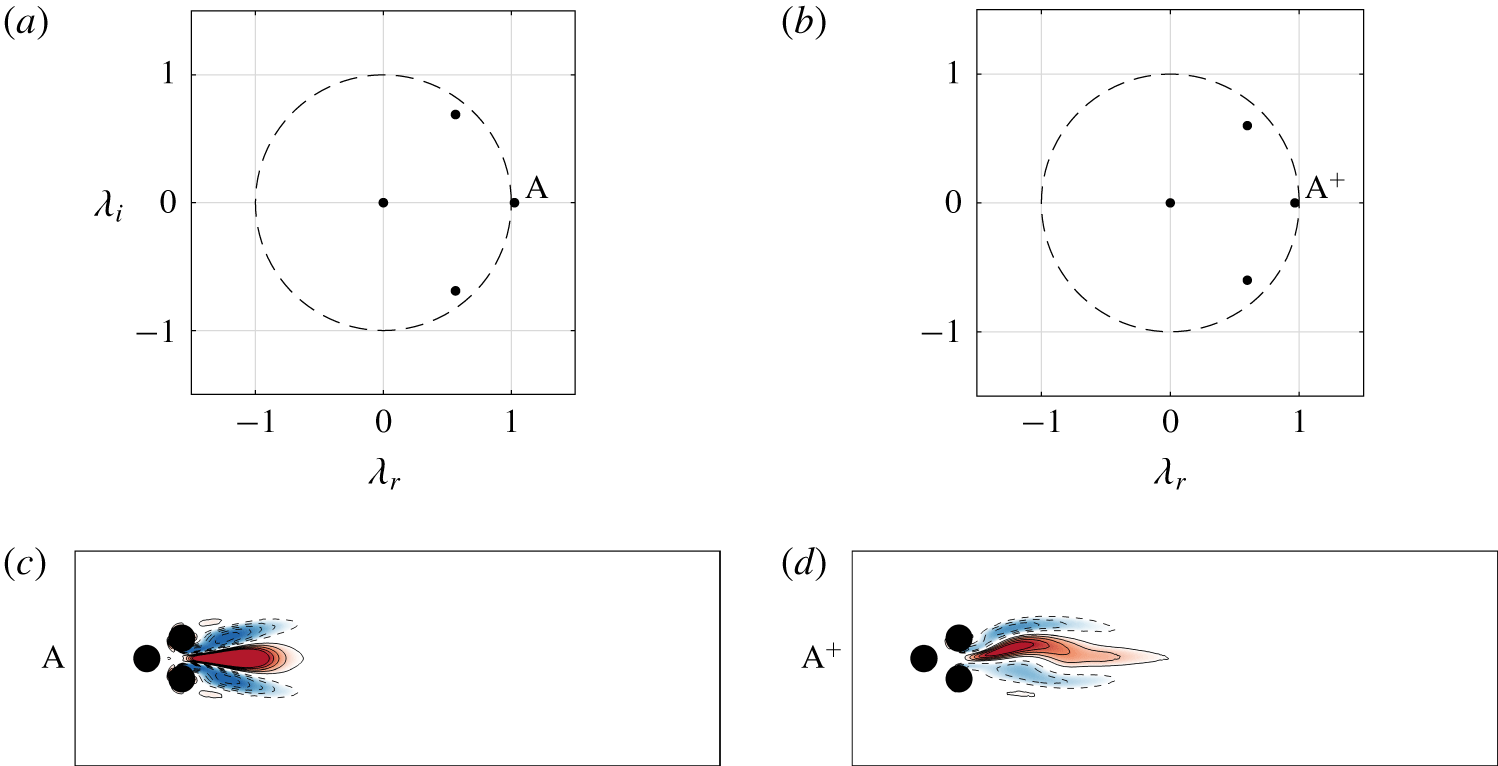
 $Re_{2}$ illustrates a transverse action on the original state space resulting from the new active symmetry-breaking mode decoupling with the primary Hopf bifurcation, as detailed in appendix D. The new active degree of freedom introduced by the pitchfork instability is responsible for the two simultaneous local pitchfork bifurcations, of both the steady solution and the periodic solution, as shown in the appendices B and C. The simultaneous bifurcation of the steady and periodic solution has also been observed for the cylinder wake transition from stability analyses (Noack & Eckelmann Reference Noack and Eckelmann1994a,Reference Noack and Eckelmannb) and from three-dimensional Navier–Stokes simulations (Zhang, Noack & Eckelmann Reference Zhang, Noack and Eckelmann1994). A further discussion about this non-generic situation is recorded in appendix E. Besides, the linear stability analysis (see appendix B) and the Floquet stability analysis (see appendix C) around
 $Re_{2}$ have been performed to prove these two simultaneous bifurcations.
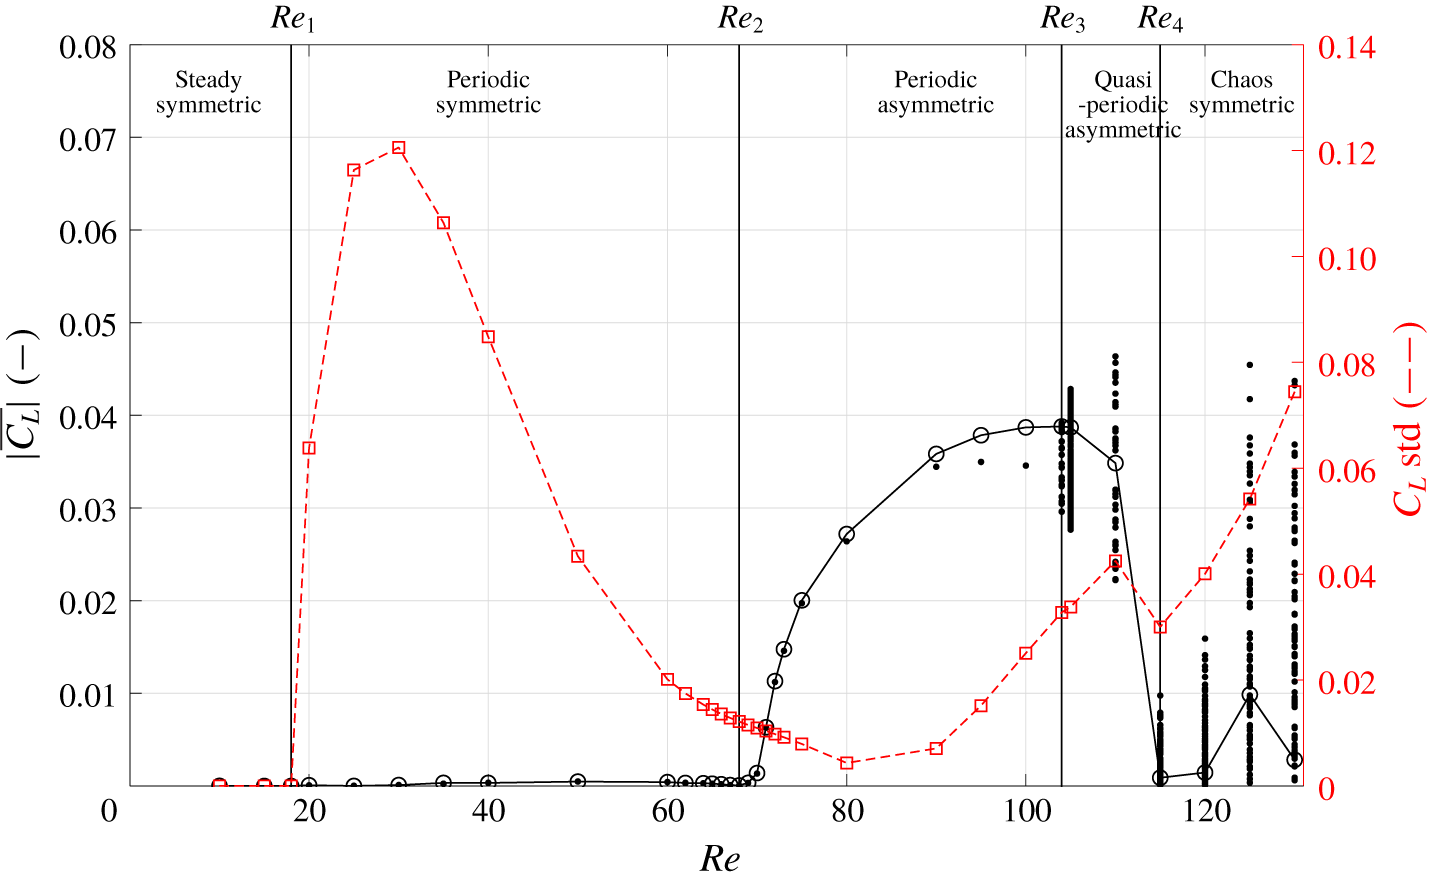
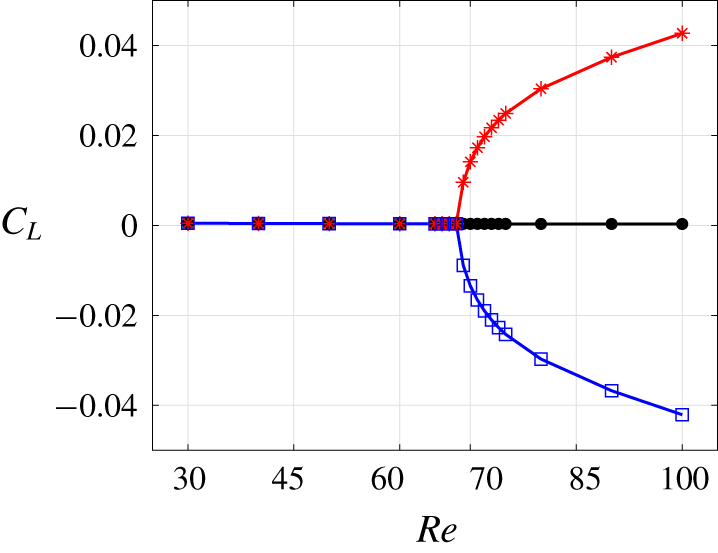
Bifurcation diagram based on the absolute value of the mean lift coefficient  $|\overline{C}_{L}|$ (circles
 $+$ solid line) and its standard deviation (squares
 $+$ dashed line). By symmetry, each non-vanishing mean lift value is associated with a positive and negative sign for the two attractors. The vertically distributed black dots that are visible for
 $Re>Re_{3}$, are median values
 $\overline{c}_{n}=(C_{n}+C_{n+1})/2$ between successive local optima
 $C_{n}=C_{L}(t_{n})$ of
 $C_{L}(t)$, at a given Reynolds number, where the
 $t_{n}$ are times at which
 ${\dot{C}}_{L}(t_{n})=0$. Transition to unsteadiness occurs at
 $Re_{1}\approx 18$ (Hopf bifurcation), the average symmetry is broken beyond
 $Re_{2}\approx 68$ (pitchfork bifurcation), a secondary (incommensurable) frequency rises in the power spectrum at
 $Re_{3}\approx 104$ (Neimark–Säcker bifurcation) and transition to chaos occurs at
 $Re_{4}\approx 115$. Note that the symmetry is statistically recovered in the chaotic regime (
 $\overline{C}_{L}\approx 0$).

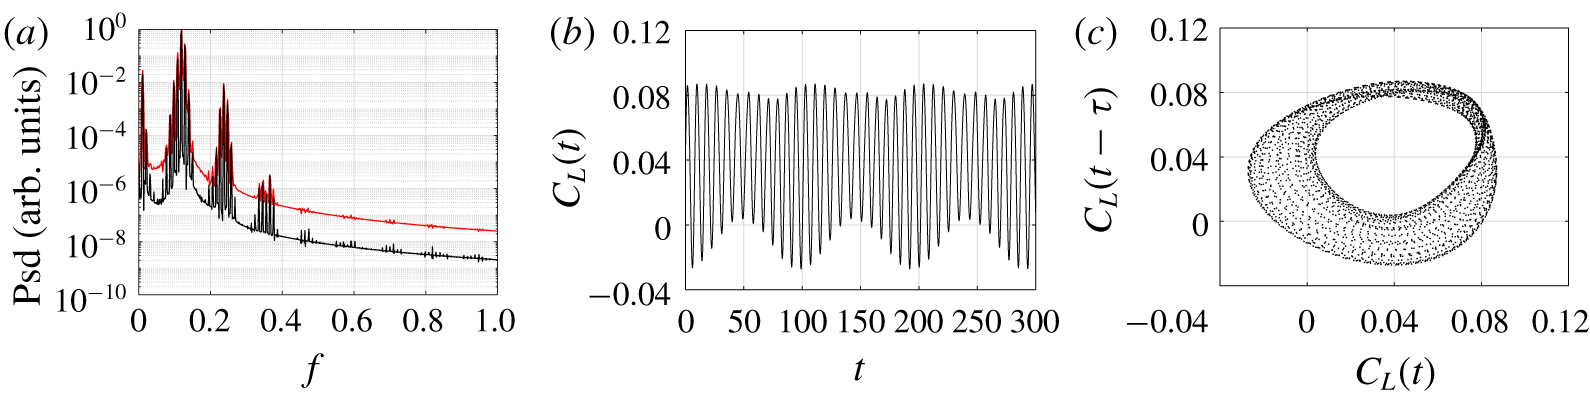
Quasi-periodic dynamics at  $Re=105$ displayed by (a) the power spectral density on time series of length
 $T_{data}=400$ (red curve),
 $T_{data}=900$ (black curve), (b) the time series and (c) the phase portrait of the lift coefficient
 $C_{L}$.

Chaotic dynamics at  $Re=130$ displayed by (a) the power spectral density on time series of length
 $T_{data}=400$ (red curve),
 $T_{data}=900$ (black curve), (b) the time series and (c) the phase portrait of the lift coefficient
 $C_{L}$.

As a result, when the symmetry of vortex shedding is broken, the mean value  $\overline{C}_{L}$ (solid line) of the lift coefficient
 $C_{L}=2F_{L}/\unicode[STIX]{x1D70C}U^{2}$, where
 $F_{L}$ is the total lift force, no longer vanishes, as shown in figure 4. At the precision of our investigation, both the Hopf and pitchfork bifurcations were found to be supercritical.
The fluctuation amplitude of the lift coefficient is minimum for  $Re\approx 80>Re_{2}$, as shown in figure 4 (dashed curve). It starts to decrease around
 $Re=30$, when the jet starts to grow at the base of the two outer cylinders. Henceforth, the growth of the base-bleeding jet, as the Reynolds number is increased, seems to be fed with the energy of the fluctuations. Transfers of energy between the dynamically dominant degrees of freedom will be made clear in § 3.
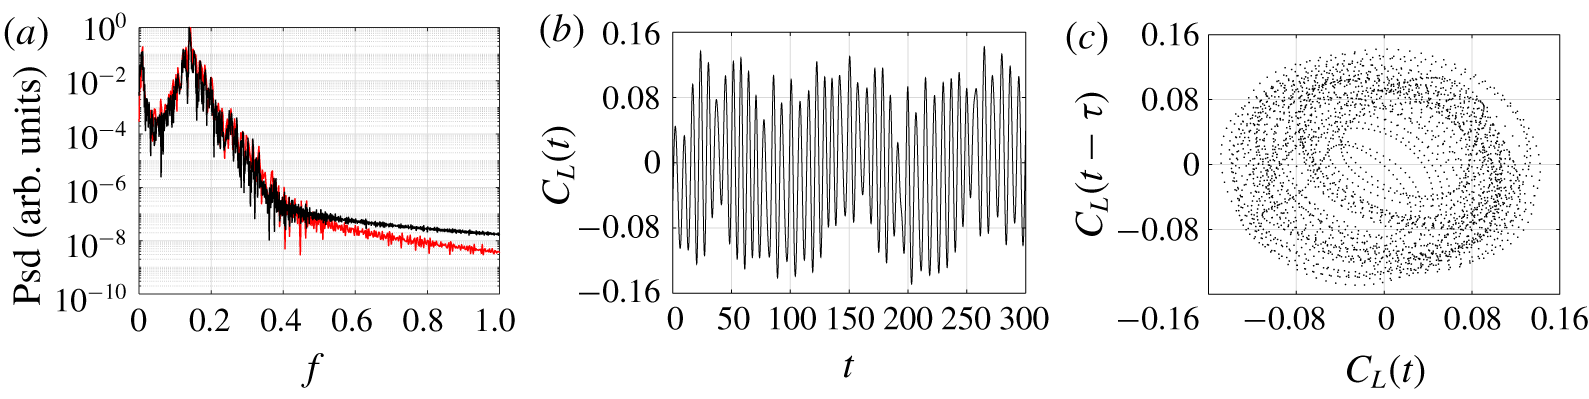
When the Reynolds number is further increased up to a critical value  $Re_{3}\approx 104$, a new frequency rises in the power spectrum of the lift coefficient
 $C_{L}(t)$. This frequency is approximately one order of magnitude smaller than the natural frequency of the vortex shedding, as illustrated in figure 5(a) for
 $Re=105$ and in the movie QP.MP4 of the additional materials available online at https://doi.org/10.1017/jfm.2019.959. The low and natural frequencies couple to generate combs of sharp peaks in the power spectrum, while the background level depends on the length of the time series. The new frequency is associated with modulations of the base-bleeding jet around its deflected position. A visual inspection of both the time series and the phase portrait at
 $Re=105$ indicates that the new frequency also modulates the amplitude (figure 5b) of the main oscillator and thickens the limit cycle associated with the main oscillator (figure 5c). All these features are typical of a quasi-periodic dynamics, indicating that the system has most likely undergone a Neimark–Säcker bifurcation, e.g. a secondary Hopf bifurcation, at
 $Re=Re_{3}$, after which two mirror-conjugated 2-tori exist in the state space of the system.
At even larger values of the Reynolds number,  $Re\geqslant Re_{4}\approx 115$, the main peak in the power spectral density of the lift coefficient widens significantly, as shown in figure 6(a) for
 $Re=130$. In this new regime, the instantaneous flow field is characterized by random switches between an upward or downward base-bleeding jet, see the movie CHAOS.MP4 in the additional materials, and the mean flow
 $\overline{\boldsymbol{u}}$ is symmetric, as shown in figure 4 for
 $Re>115$. The time series exhibits neither periodic nor quasi-periodic features anymore (see figure 6b) and the phase portrait exhibits a much more complex dynamics (see figure 6c). The dynamical regime henceforth exhibits many features of a chaotic regime, indicating that the system has most likely followed the Ruelle–Takens–Newhouse route to chaos (Newhouse, Ruelle & Takens Reference Newhouse, Ruelle and Takens1978).
3 Low-dimensional modelling
We derive a mean-field Galerkin model for the primary and secondary bifurcations of the fluidic pinball. First (§ 3.1), the Galerkin method is recapitulated as a very general approach to reduced-order models. In § 3.2, the constitutive equations of the mean-field model are derived from a minimal set of assumptions. Then, mean-field Galerkin models are derived for the Hopf bifurcation (§ 3.3), the pitchfork bifurcation (§ 3.4) and the succession of both bifurcations (§ 3.5).
3.1 Galerkin method
The starting point is the non-dimensionalized incompressible Navier–Stokes equations
 $$\begin{eqnarray}\unicode[STIX]{x2202}_{t}\boldsymbol{u}+\unicode[STIX]{x1D735}\boldsymbol{\cdot }\boldsymbol{u}\otimes \boldsymbol{u}=\unicode[STIX]{x1D708}\triangle \boldsymbol{u}-\unicode[STIX]{x1D735}p,\end{eqnarray}$$
where  $\unicode[STIX]{x1D708}=1/Re$. The velocity field satisfies the no-slip condition
 $\boldsymbol{u}=0$ on the cylinders, the free-stream condition
 $\boldsymbol{u}=(1,0)$ at the inflow, a no-slip condition at the top and bottom boundary and the no-stress condition at the outflow. The steady solution
 $\boldsymbol{u}_{s}$ satisfies the steady Navier–Stokes equations
 $$\begin{eqnarray}\unicode[STIX]{x1D735}\boldsymbol{\cdot }\boldsymbol{u}_{s}\otimes \boldsymbol{u}_{s}=\unicode[STIX]{x1D708}\triangle \boldsymbol{u}_{s}-\unicode[STIX]{x1D735}p_{s}.\end{eqnarray}$$
The Galerkin method is based on an inner product in the space of square-integrable vector fields  ${\mathcal{L}}^{2}(\unicode[STIX]{x1D6FA})$ in the observation domain
 $\unicode[STIX]{x1D6FA}$. The standard inner product between
 $\boldsymbol{u}(\boldsymbol{x})$ and
 $\boldsymbol{v}(\boldsymbol{x})$ reads
 $$\begin{eqnarray}(\boldsymbol{u},\boldsymbol{v})_{\unicode[STIX]{x1D6FA}}:=\int _{\unicode[STIX]{x1D6FA}}\,\text{d}\boldsymbol{x}\,\boldsymbol{u}(\boldsymbol{x})\boldsymbol{\cdot }\boldsymbol{v}(\boldsymbol{x}).\end{eqnarray}$$
A traditional Galerkin approximation with a basic mode  $\boldsymbol{u}_{0}$, for instance, the steady solution and
 $N$ orthonormal expansion modes
 $\boldsymbol{u}_{i}(\boldsymbol{x})$,
 $i=1,\ldots ,N$ with time-dependent amplitudes
 $a_{i}(t)$, reads
 $$\begin{eqnarray}\boldsymbol{u}(\boldsymbol{x},t)=\boldsymbol{u}_{0}(\boldsymbol{x})+\mathop{\sum }_{i=1}^{N}a_{i}(t)\boldsymbol{u}_{i}(\boldsymbol{x}).\end{eqnarray}$$
Orthonormality implies
 $$\begin{eqnarray}(\boldsymbol{u}_{i},\boldsymbol{u}_{j})_{\unicode[STIX]{x1D6FA}}=\unicode[STIX]{x1D6FF}_{ij},\quad i,j\in \{1,\ldots ,N\}.\end{eqnarray}$$
The projection of (3.4) on (3.1) leads to the linear–quadratic Galerkin system (Fletcher Reference Fletcher1984)
 $$\begin{eqnarray}\frac{\text{d}}{\text{d}t}a_{i}=\unicode[STIX]{x1D708}\mathop{\sum }_{j=0}^{N}l_{ij}^{\unicode[STIX]{x1D708}}a_{j}+\mathop{\sum }_{j,k=0}^{N}q_{ijk}^{c}a_{j}a_{k}.\end{eqnarray}$$
Following Rempfer & Fasel (Reference Rempfer and Fasel1994),  $a_{0}=1$ is introduced. The coefficients
 $l_{ij}^{\unicode[STIX]{x1D708}}=(\boldsymbol{u}_{i},\triangle \boldsymbol{u}_{j})_{\unicode[STIX]{x1D6FA}}$ and
 $q_{ijk}^{c}=-(\boldsymbol{u}_{i},\unicode[STIX]{x1D735}\boldsymbol{\cdot }\boldsymbol{u}_{j}\otimes \boldsymbol{u}_{k})_{\unicode[STIX]{x1D6FA}}$ parametrize the viscous and convective Navier–Stokes terms. The pressure term vanishes for sufficiently large domains and is neglected in the following.
In the following, the steady solution is taken as the basic mode  $\boldsymbol{u}_{0}=\boldsymbol{u}_{s}$. This implies that
 $\boldsymbol{a}=0$ is a fixed point of (3.6) and the constant term
 $\unicode[STIX]{x1D708}l_{i0}^{\unicode[STIX]{x1D708}}+q_{i00}^{\unicode[STIX]{x1D708}}=0$ vanishes as the projection of (3.2) onto the
 $i$th mode
 $\boldsymbol{u}_{i}$. In this case, equation (3.6) can be rewritten as a linear–quadratic system of ordinary differential equations
 $$\begin{eqnarray}\frac{\text{d}}{\text{d}t}a_{i}=\mathop{\sum }_{j=1}^{N}l_{ij}a_{j}+\mathop{\sum }_{j,k=1}^{N}q_{ijk}a_{j}a_{k},\end{eqnarray}$$
where  $l_{ij}=\unicode[STIX]{x1D708}l_{ij}^{\unicode[STIX]{x1D708}}+q_{ij0}^{c}+q_{i0j}^{c}$ and
 $q_{ijk}=q_{ijk}^{c}$ for
 $i,j,k\in \{1,\ldots ,N\}$.
3.2 Mean-field modelling
Mean-field modelling allows a dramatic simplification of a general Galerkin system (3.7) close to bifurcations. In this section, we derive constitutive equations with a small number of more general assumptions.
In the spirit of the Reynolds decomposition, the velocity field is decomposed into a slowly varying distorted mean flow  $\boldsymbol{u}^{D}$ and fluctuation
 $\boldsymbol{u}^{\prime }$ with first-order (relaxational) or second-order (oscillatory) dynamics
 $$\begin{eqnarray}\boldsymbol{u}(\boldsymbol{x},t)=\boldsymbol{u}^{D}(\boldsymbol{x},t)+\boldsymbol{u}^{\prime }(\boldsymbol{x},t),\quad \boldsymbol{u}^{D}(\boldsymbol{x},t)=\boldsymbol{u}_{s}(\boldsymbol{x})+\boldsymbol{u}_{\unicode[STIX]{x1D6E5}}(\boldsymbol{x},t).\end{eqnarray}$$
Here, the mean-field deformation  $\boldsymbol{u}_{\unicode[STIX]{x1D6E5}}$ is the difference between the distorted mean flow and the steady solution. For the oscillatory dynamics considered, the distorted mean flow can be defined as an average over one local fluctuation period
 $T$ denoted by
 $\langle \cdot \rangle$. Thus,
 $$\begin{eqnarray}\boldsymbol{u}^{D}(\boldsymbol{x},t)=\langle \boldsymbol{u}(\boldsymbol{x},t)\rangle :=\frac{1}{T}\int _{t-T/2}^{t+T/2}\,\text{d}\unicode[STIX]{x1D70F}\,\boldsymbol{u}(\boldsymbol{x},\unicode[STIX]{x1D70F}).\end{eqnarray}$$
After the pitchfork bifurcation into two mirror-conjugated flows  $\boldsymbol{u}^{+}$,
 $\boldsymbol{u}^{-}$, a symmetric distorted mean flow is enforced via
 $$\begin{eqnarray}\boldsymbol{u}^{D}(\boldsymbol{x},t)={\textstyle \frac{1}{2}}(\langle \boldsymbol{u}^{+}(\boldsymbol{x},t)\rangle +\langle \boldsymbol{u}^{-}(\boldsymbol{x},t)\rangle ).\end{eqnarray}$$
We note that  $\boldsymbol{u}^{D}(\boldsymbol{x},t)$ is not the mean flow, which is defined by the post-transient limit
 $$\begin{eqnarray}\bar{\boldsymbol{u}}(\boldsymbol{x})=\lim _{T\rightarrow \infty }\frac{1}{T}\int _{0}^{T}\boldsymbol{u}(\boldsymbol{x},\unicode[STIX]{x1D70F})\,\text{d}\unicode[STIX]{x1D70F}.\end{eqnarray}$$
The distorted mean flow coincides with mean flow for the post-transient phase before the pitchfork bifurcation. Technically, a harmonic fluctuation is assumed and this one period average is computed as an average of all phases in  $[0,2\unicode[STIX]{x03C0}]$. The somewhat loaded term ‘distorted mean flow’ is directly adopted from the original publications of mean-field theory (Stuart Reference Stuart1958). J. T. Stuart considers this flow as ‘distorted’ from the steady solution by the Reynolds stress associated with the instability mode(s).
For a nominally symmetric cylindrical obstacle, the distorted mean flow can be expected to be symmetric while the dominant fluctuation is antisymmetric. This leads to a symmetry-based decomposition of the flow into a symmetric contribution  $\boldsymbol{u}^{s}=(u^{s},v^{s})\in {\mathcal{U}}^{s}$ with
 $$\begin{eqnarray}u^{s}(x,-y)=u^{s}(x,y),\quad v^{s}(x,-y)=-v^{s}(x,y),\end{eqnarray}$$
and an antisymmetric component  $\boldsymbol{u}^{a}=(u^{a},v^{a})\in {\mathcal{U}}^{a}$ satisfying
 $$\begin{eqnarray}u^{a}(x,-y)=-u^{a}(x,y),\quad v^{a}(x,-y)=v^{a}(x,y).\end{eqnarray}$$
Here,  ${\mathcal{U}}^{s}$ and
 ${\mathcal{U}}^{a}$ denote the set of symmetric and antisymmetric vector fields, respectively. The resulting decomposition reads
 $$\begin{eqnarray}\boldsymbol{u}(\boldsymbol{x},t)=\boldsymbol{u}^{s}(\boldsymbol{x},t)+\boldsymbol{u}^{a}(\boldsymbol{x},t).\end{eqnarray}$$
In the sequel, we will identify the distorted mean flow with the symmetric component and the fluctuation with the antisymmetric one
 $$\begin{eqnarray}\boldsymbol{u}^{D}(\boldsymbol{x},t)=\boldsymbol{u}^{s}(\boldsymbol{x},t),\quad \boldsymbol{u}^{\prime }(\boldsymbol{x},t)=\boldsymbol{u}^{a}(\boldsymbol{x},t).\end{eqnarray}$$
This identification is justified for symmetry-breaking bifurcations with first- or second-order dynamics with neglected higher harmonics. For brevity,  ${\mathcal{U}}^{s}$ and
 ${\mathcal{U}}^{a}$ are introduced as symmetric and antisymmetric subsets of
 ${\mathcal{L}}^{2}(\unicode[STIX]{x1D6FA})$.
The convective term is easily shown to have the following symmetry properties:
 $$\begin{eqnarray}\displaystyle & \displaystyle \unicode[STIX]{x1D735}\boldsymbol{\cdot }\boldsymbol{u}^{s}\otimes \boldsymbol{u}^{s}\in {\mathcal{U}}^{s}, & \displaystyle\end{eqnarray}$$
 $$\begin{eqnarray}\displaystyle & \displaystyle \unicode[STIX]{x1D735}\boldsymbol{\cdot }\boldsymbol{u}^{a}\otimes \boldsymbol{u}^{a}\in {\mathcal{U}}^{s}, & \displaystyle\end{eqnarray}$$
 $$\begin{eqnarray}\displaystyle & \displaystyle \unicode[STIX]{x1D735}\boldsymbol{\cdot }\boldsymbol{u}^{s}\otimes \boldsymbol{u}^{a}\in {\mathcal{U}}^{a}, & \displaystyle\end{eqnarray}$$
 $$\begin{eqnarray}\displaystyle & \displaystyle \unicode[STIX]{x1D735}\boldsymbol{\cdot }\boldsymbol{u}^{a}\otimes \boldsymbol{u}^{s}\in {\mathcal{U}}^{a}. & \displaystyle\end{eqnarray}$$
The antisymmetric component is derived starting with (3.1), subtracting the steady version of (3.2) and exploiting the symmetry of  $\boldsymbol{u}^{D}$, the antisymmetry of
 $\boldsymbol{u}^{\prime }$ as well as the symmetry relations (3.16). The fluctuation dynamics reads:
 $$\begin{eqnarray}\unicode[STIX]{x2202}_{t}\boldsymbol{u}^{\prime }+\unicode[STIX]{x1D735}\boldsymbol{\cdot }[\boldsymbol{u}^{D}\otimes \boldsymbol{u}^{\prime }+\boldsymbol{u}^{\prime }\otimes \boldsymbol{u}^{D}]=\unicode[STIX]{x1D708}\triangle \boldsymbol{u}^{\prime }-\unicode[STIX]{x1D735}p^{\prime }.\end{eqnarray}$$
Analogously, the symmetric part describes the distorted mean flow dynamics
 $$\begin{eqnarray}\unicode[STIX]{x2202}_{t}\boldsymbol{u}_{\unicode[STIX]{x1D6E5}}+\unicode[STIX]{x1D735}\boldsymbol{\cdot }[\boldsymbol{u}_{s}\otimes \boldsymbol{u}_{\unicode[STIX]{x1D6E5}}+\boldsymbol{u}_{\unicode[STIX]{x1D6E5}}\otimes \boldsymbol{u}_{s}+\boldsymbol{u}_{\unicode[STIX]{x1D6E5}}\otimes \boldsymbol{u}_{\unicode[STIX]{x1D6E5}}+\boldsymbol{u}^{\prime }\otimes \boldsymbol{u}^{\prime }]=\unicode[STIX]{x1D708}\triangle \boldsymbol{u}_{\unicode[STIX]{x1D6E5}}-\unicode[STIX]{x1D735}p_{\unicode[STIX]{x1D6E5}}.\end{eqnarray}$$
Note that this symmetric component of the Navier–Stokes equations has not yet been averaged and the sum of equations (3.2), (3.18) and (3.17) leads to the Navier–Stokes equations (3.1). To this point, all equations are strict identities for the symmetric and antisymmetric parts of the Navier–Stokes dynamics.
Next, we follow mean-field arguments and consider  $\boldsymbol{u}^{\prime }$ and
 $\boldsymbol{u}_{\unicode[STIX]{x1D6E5}}$ as small perturbations around the fixed point
 $\boldsymbol{u}_{s}$. Let
 $\boldsymbol{u}^{\prime }\in O(\unicode[STIX]{x1D700})$ and
 $\boldsymbol{u}_{\unicode[STIX]{x1D6E5}}\in O(\unicode[STIX]{x1D6FF})$ where
 $\unicode[STIX]{x1D700}$ and
 $\unicode[STIX]{x1D6FF}$ are smallness parameters. Hence,
 $\boldsymbol{u}_{\unicode[STIX]{x1D6E5}}\otimes \boldsymbol{u}_{\unicode[STIX]{x1D6E5}}\in O(\unicode[STIX]{x1D6FF}^{2})$ can be neglected in comparison to the
 $O(\unicode[STIX]{x1D6FF})$ terms
 $\boldsymbol{u}_{s}\otimes \boldsymbol{u}_{\unicode[STIX]{x1D6E5}}$,
 $\boldsymbol{u}_{\unicode[STIX]{x1D6E5}}\otimes \boldsymbol{u}_{s}$. We follow Stuart’s original idea to separate the fluctuation
 $\boldsymbol{u}^{\prime }$ driven by the instability and the resulting mean-field deformation
 $\boldsymbol{u}_{\unicode[STIX]{x1D6E5}}$ and arrive at the unsteady linearized Reynolds equation
 $$\begin{eqnarray}\unicode[STIX]{x2202}_{t}\boldsymbol{u}_{\unicode[STIX]{x1D6E5}}+\unicode[STIX]{x1D735}\boldsymbol{\cdot }[\boldsymbol{u}_{s}\otimes \boldsymbol{u}_{\unicode[STIX]{x1D6E5}}+\boldsymbol{u}_{\unicode[STIX]{x1D6E5}}\otimes \boldsymbol{u}_{s}+\langle \boldsymbol{u}^{\prime }\otimes \boldsymbol{u}^{\prime }\rangle ]=\unicode[STIX]{x1D708}\triangle \boldsymbol{u}_{\unicode[STIX]{x1D6E5}}-\unicode[STIX]{x1D735}p_{\unicode[STIX]{x1D6E5}}.\end{eqnarray}$$
The mean-field deformation  $\boldsymbol{u}_{\unicode[STIX]{x1D6E5}}$ characterized by the scale
 $\unicode[STIX]{x1D6FF}$ is seen to respond linearly to the Reynolds stress force
 $-\unicode[STIX]{x1D735}\boldsymbol{\cdot }\langle \boldsymbol{u}^{\prime }\otimes \boldsymbol{u}^{\prime }\rangle$ scaling with
 $\unicode[STIX]{x1D716}^{2}$. Hence,
 $\unicode[STIX]{x1D6FF}\sim \unicode[STIX]{x1D716}^{2}$.
Summarizing, equations (3.17) and (3.19) are the constitutive equations of mean-field theory exploiting only symmetry and smallness of the mean-field deformation.
Close to the critical Reynolds number,  $Re_{c}$, the temporal growth rate can be Taylor expanded to
 $\unicode[STIX]{x1D70E}=\unicode[STIX]{x1D6FC}(Re-Re_{c})$ and can be assumed to be small. In this case,
 $\unicode[STIX]{x2202}_{t}\boldsymbol{u}_{\unicode[STIX]{x1D6E5}}\in O(\unicode[STIX]{x1D70E}\unicode[STIX]{x1D6FF})$, i.e. the time derivative of (3.19) can be neglected with respect to the other terms
 $\in O(\unicode[STIX]{x1D6FF})=O(\unicode[STIX]{x1D700}^{2})$. This leads to the steady linearized Reynolds equation
 $$\begin{eqnarray}\unicode[STIX]{x1D735}\boldsymbol{\cdot }[\boldsymbol{u}_{s}\otimes \boldsymbol{u}_{\unicode[STIX]{x1D6E5}}+\boldsymbol{u}_{\unicode[STIX]{x1D6E5}}\otimes \boldsymbol{u}_{s}+\langle \boldsymbol{u}^{\prime }\otimes \boldsymbol{u}^{\prime }\rangle ]=\unicode[STIX]{x1D708}\triangle \boldsymbol{u}_{\unicode[STIX]{x1D6E5}}-\unicode[STIX]{x1D735}p_{\unicode[STIX]{x1D6E5}}.\end{eqnarray}$$
This equation is also true for the post-transient solution, e.g. the limit cycle of a Hopf bifurcation or the asymmetric state of a pitchfork bifurcation. Often, the distorted mean flow  $\boldsymbol{u}^{D}$ quickly responds to the Reynolds stress even far away from the bifurcation.
3.3 Supercritical Hopf bifurcation
At low Reynolds numbers, a symmetric stable steady solution  $\boldsymbol{u}_{s}\in {\mathcal{U}}^{s}$ is observed. Periodic vortex shedding sets in with the occurrence of an unstable oscillatory antisymmetric eigenmode at
 $Re\geqslant Re_{1}$. The Reynolds number dependent initial growth rate and frequency are denoted by
 $\unicode[STIX]{x1D70E}_{1}$ and
 $\unicode[STIX]{x1D714}_{1}$, respectively. The real and imaginary parts of this eigenmode are
 $\boldsymbol{u}_{1}$ and
 $\boldsymbol{u}_{2}$, respectively, both antisymmetric modes. In the following, these modes are assumed to be orthonormalized.
This oscillation generates a Reynolds stress, which changes the mean flow via (3.19). The mean flow deformation is described by the symmetric shift mode  $\boldsymbol{u}_{3}$ with unit norm. By symmetry, the first two modes are orthogonal with respect to the shift mode. Thus, the modes form an orthonormal basis. The resulting Galerkin expansion reads as follows:
 $$\begin{eqnarray}\boldsymbol{u}(\boldsymbol{x},t)=\boldsymbol{u}_{s}(\boldsymbol{x})+\underbrace{a_{1}(t)\boldsymbol{u}_{1}(\boldsymbol{x})+a_{2}(t)\boldsymbol{u}_{2}(\boldsymbol{x})}_{\boldsymbol{u}^{\prime }}+\underbrace{a_{3}(t)\boldsymbol{u}_{3}(\boldsymbol{x})}_{\boldsymbol{u}_{\unicode[STIX]{x1D6E5}}}.\end{eqnarray}$$
Moreover, polar coordinates are introduced  $a_{1}(t)=r(t)\cos \unicode[STIX]{x1D703}(t)$,
 $a_{2}(t)=r(t)\sin \unicode[STIX]{x1D703}(t)$,
 $\text{d}\unicode[STIX]{x1D703}/\text{d}t=\unicode[STIX]{x1D714}(t)$ where
 $r$ and
 $\unicode[STIX]{x1D714}$ are assumed to be slowly varying functions of time.
Substituting (3.21) in (3.17), projecting on  $\boldsymbol{u}_{i}$,
 $i=1,2$ and applying the Krylov–Bogoliubov (Jordan & Smith Reference Jordan and Smith1999) averaging method yields
 $$\begin{eqnarray}\displaystyle & \displaystyle \text{d}a_{1}/\text{d}t=\unicode[STIX]{x1D70E}a_{1}-\unicode[STIX]{x1D714}a_{2},\quad \unicode[STIX]{x1D70E}=\unicode[STIX]{x1D70E}_{1}-\unicode[STIX]{x1D6FD}a_{3}, & \displaystyle\end{eqnarray}$$
 $$\begin{eqnarray}\displaystyle & \displaystyle \text{d}a_{2}/\text{d}t=\unicode[STIX]{x1D70E}a_{2}+\unicode[STIX]{x1D714}a_{1},\quad \unicode[STIX]{x1D714}=\unicode[STIX]{x1D714}_{1}+\unicode[STIX]{x1D6FE}a_{3}. & \displaystyle\end{eqnarray}$$
 $\unicode[STIX]{x1D70E}_{1},\unicode[STIX]{x1D714}_{1},\unicode[STIX]{x1D6FD}>0$ for a supercritical Hopf bifurcation. We refer to Noack et al. (Reference Noack, Afanasiev, Morzyński, Tadmor and Thiele2003) for details.
Krylov–Bogoliubov averaging implies a harmonic balancing on the slowly varying amplitude and frequency of oscillatory  $a_{1,2}$ and the slowly varying
 $a_{3}$ dynamics. The corresponding original theorem includes a convergence proof of this approximation for a second-order ordinary differential equation for oscillations in the limit of small nonlinearity. We cannot perform this limit but justify the operation on the a priori observation that quadratic Galerkin system terms
 $q_{ijk}$ are typically two orders of magnitude smaller than the dominant linear coefficients, i.e. describe a small nonlinearity. A posteriori the operation is justified by the results, i.e. by obtaining amplitudes and frequencies with up to a few per cent error.
Substituting (3.21) in (3.20) replaces (3.24) by the mean-field manifold
 $$\begin{eqnarray}a_{3}=\unicode[STIX]{x1D705}\,(a_{1}^{2}+a_{2}^{2}),\end{eqnarray}$$
with derivable proportionality constant  $\unicode[STIX]{x1D705}$.
Alternatively, the mean-field manifold may be obtained from the Galerkin system. Substituting (3.21) in (3.19) and projecting on  $\boldsymbol{u}_{3}$ yields
 $$\begin{eqnarray}\text{d}a_{3}/\text{d}t=\unicode[STIX]{x1D70E}_{3}a_{3}+\unicode[STIX]{x1D6FD}_{3}(a_{1}^{2}+a_{2}^{2}),\end{eqnarray}$$
where  $\unicode[STIX]{x1D70E}_{3}<0$ and
 $\unicode[STIX]{x1D6FD}_{3}>0$ are necessary for a globally stable limit cycle. Note that (3.24) can be rewritten as
 $$\begin{eqnarray}\text{d}a_{3}/\text{d}t=\unicode[STIX]{x1D70E}_{3}[a_{3}-\unicode[STIX]{x1D705}(a_{1}^{2}+a_{2}^{2})].\end{eqnarray}$$
Now, the slaving process which leads to the mean-field manifold of (3.23) can be appreciated from the mean-field Galerkin system. If  $|\unicode[STIX]{x1D70E}_{3}|\gg \unicode[STIX]{x1D70E}_{1}$, the time scale of slaving
 $a_{3}$ to the fluctuation level
 $a_{1}^{2}+a_{2}^{2}$ is much smaller than the time scale of the transient and
 $\text{d}a_{3}/\text{d}t$ can be set to zero.
Equations (3.22) and (3.23) yield the famous Landau equations with the cubic damping term
 $$\begin{eqnarray}\text{d}r/\text{d}t=\unicode[STIX]{x1D70E}_{1}r-\unicode[STIX]{x1D6FD}\unicode[STIX]{x1D705}r^{3},\quad \text{d}\unicode[STIX]{x1D703}/\text{d}t=\unicode[STIX]{x1D714}_{1}+\unicode[STIX]{x1D6FE}\unicode[STIX]{x1D705}r^{2}.\end{eqnarray}$$
The Landau oscillator leads to a stable limit cycle with  $r^{\circ }=\sqrt{\unicode[STIX]{x1D70E}_{1}/\unicode[STIX]{x1D6FD}\unicode[STIX]{x1D705}}$, frequency
 $\unicode[STIX]{x1D714}^{\circ }=\unicode[STIX]{x1D714}_{1}+\unicode[STIX]{x1D70E}_{1}\unicode[STIX]{x1D6FE}/\unicode[STIX]{x1D6FD}$ and shift-mode amplitude
 $a_{3}^{\circ }=\unicode[STIX]{x1D70E}_{1}/\unicode[STIX]{x1D6FD}$. The three nonlinearity parameters
 $\unicode[STIX]{x1D6FD}$,
 $\unicode[STIX]{x1D6FE}$ and
 $\unicode[STIX]{x1D705}$ can be uniquely derived from the limit cycle parameters
 $r^{\circ }$,
 $\unicode[STIX]{x1D714}^{\circ }$ and
 $a_{3}^{\circ }$. The growth rate
 $\unicode[STIX]{x1D70E}_{3}$ needs to be chosen sufficiently large, e.g.
 $\unicode[STIX]{x1D70E}_{3}=-10\unicode[STIX]{x1D70E}_{1}$, to ensure slaving on the manifold.
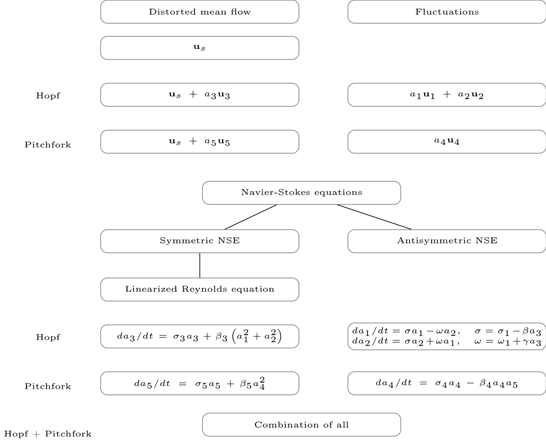
Equations (3.22), (3.24) are the mean-field Galerkin system, as illustrated in table 1, while equations (3.22), (3.23) characterize the original mean-field model, i.e. the slaved Galerkin system. Near the Hopf bifurcation, when  $\unicode[STIX]{x1D70E}_{1}(Re)$ crosses the zero line at
 $Re_{1}$, the growth rate is approximated by
 $\unicode[STIX]{x1D70E}_{1}=\unicode[STIX]{x1D6FC}(Re-Re_{1})$ implying the square-root law
 $r^{\circ }=\sqrt{\unicode[STIX]{x1D6FC}/\unicode[STIX]{x1D6FD}\unicode[STIX]{x1D705}}\sqrt{Re-Re_{1}}$.
The Landau equation has been proposed by Landau (see, e.g. Landau & Lifshitz Reference Landau and Lifshitz1987), derived from the Navier–Stokes equation by Stuart (Reference Stuart1958), generalized for Galerkin systems by Noack et al. (Reference Noack, Afanasiev, Morzyński, Tadmor and Thiele2003) and validated in numerous simulations and experiments for cylinder wakes (Schumm et al. Reference Schumm, Berger and Monkewitz1994) and other soft onsets of oscillatory flow. We note that the proposed derivation from symmetry considerations constrains the model to symmetric obstacles but liberates the mean-field Galerkin model from typical assumptions, such as closeness to the Hopf bifurcation or the need for frequency filtered Navier–Stokes equations.
3.4 Supercritical pitchfork bifurcation
Symmetries and hierarchy of equations.

Next, the symmetry-breaking pitchfork bifurcation of a steady symmetric Navier–Stokes equation is considered. Now, mode  $\boldsymbol{u}_{4}$ describes the antisymmetric instability with positive growth rate
 $\unicode[STIX]{x1D70E}_{4}$. The shift mode
 $\boldsymbol{u}_{5}$ prevents unbounded exponential growth. The corresponding Galerkin expansion reads
 $$\begin{eqnarray}\boldsymbol{u}(\boldsymbol{x},t)=\boldsymbol{u}_{s}(\boldsymbol{x})+\underbrace{a_{4}(t)\boldsymbol{u}_{4}(\boldsymbol{x})}_{\boldsymbol{u}^{\prime }}+\underbrace{a_{5}(t)\boldsymbol{u}_{5}(\boldsymbol{x})}_{\boldsymbol{u}_{\unicode[STIX]{x1D6E5}}}.\end{eqnarray}$$
Substituting (3.27) in equations (3.17) and (3.19), and exploiting the symmetry of the modes, yields
 $$\begin{eqnarray}\displaystyle & \displaystyle \text{d}a_{4}/\text{d}t=\unicode[STIX]{x1D70E}_{4}a_{4}-\unicode[STIX]{x1D6FD}_{4}a_{4}a_{5}, & \displaystyle\end{eqnarray}$$
 $$\begin{eqnarray}\displaystyle & \displaystyle \text{d}a_{5}/\text{d}t=\unicode[STIX]{x1D70E}_{5}a_{5}+\unicode[STIX]{x1D6FD}_{5}a_{4}^{2}. & \displaystyle\end{eqnarray}$$
 $a_{5}$ term and quadratic
 $a_{4}a_{4}$ and
 $a_{5}a_{5}$ terms in (3.28a) are ruled out by symmetry. Similarly, a linear
 $a_{4}$ term or a mixed quadratic term
 $a_{4}a_{5}$ in (3.28b) is prohibited by symmetry. The quadratic
 $a_{5}a_{5}$ term is not consistent with the linearized Reynolds equation (3.19). The pitchfork bifurcation can be considered as a Hopf bifurcation with
 $\unicode[STIX]{x1D714}=0$ and a single mode. Replacing
 $a_{1}$ by
 $a_{4}$,
 $a_{3}$ by
 $a_{5}$ and setting
 $a_{2}=0$ yields (3.28a) from (3.22) and (3.28b) from (3.24).
Equations (3.28a), (3.28b) are the mean-field Galerkin system, as shown in table 1. Substituting (3.27) in (3.20) yields the manifold
 $$\begin{eqnarray}a_{5}=\unicode[STIX]{x1D705}_{5}a_{4}^{2},\end{eqnarray}$$
with  $\unicode[STIX]{x1D705}_{5}=-\unicode[STIX]{x1D6FD}_{5}/\unicode[STIX]{x1D70E}_{5}$. The asymmetric steady solutions read
 $a_{4}^{\pm }=\pm \sqrt{\unicode[STIX]{x1D70E}_{4}/\unicode[STIX]{x1D6FD}_{4}\unicode[STIX]{x1D705}_{5}}$,
 $a_{5}=\unicode[STIX]{x1D70E}_{4}/\unicode[STIX]{x1D6FD}_{4}$. The two nonlinearity parameters
 $\unicode[STIX]{x1D705}_{4}$,
 $\unicode[STIX]{x1D6FD}_{4}$ are readily determined from the two asymptotic values
 $a_{4}$ and
 $a_{5}$. The growth rate can be set in analogy to the previous model to
 $\unicode[STIX]{x1D70E}_{5}=-10\unicode[STIX]{x1D70E}_{4}$ to ensure slaving on the manifold.
From (3.28a) and (3.29), the famous unstable dynamics with cubic damping term is obtained
 $$\begin{eqnarray}\displaystyle \text{d}a_{4}/\text{d}t=\unicode[STIX]{x1D70E}_{4}a_{4}-\unicode[STIX]{x1D705}_{5}\unicode[STIX]{x1D6FD}_{4}a_{4}^{3}, & & \displaystyle\end{eqnarray}$$
where  $\unicode[STIX]{x1D705}_{5}\unicode[STIX]{x1D6FD}_{4}>0$ for a supercritical bifurcation. Equations (3.28a), (3.28b) are the mean-field Galerkin system.
Near the secondary pitchfork bifurcation,  $\unicode[STIX]{x1D70E}_{4}=\unicode[STIX]{x1D6FC}_{2}(Re-Re_{2})$ and
 $a_{4}\propto \sqrt{Re-Re_{2}}$. The parameters of the pitchfork Galerkin system can be derived from the eigenmode and the asymptotic state in complete analogy to § 3.3. The growth rate
 $\unicode[STIX]{x1D70E}_{5}=-10\unicode[STIX]{x1D70E}_{4}$ will ensure the slaving of (3.29). We emphasize that this pitchfork model is derived primarily from symmetry considerations and does not require closeness to the critical parameter.
3.5 Pitchfork bifurcation of periodic solution
In the final modelling effort, a low-dimensional model from a primary supercritical Hopf bifurcation at  $Re=Re_{1}$ and a secondary supercritical pitchfork bifurcation at
 $Re=Re_{2}>Re_{1}$ are derived following the numerical observations of the fluidic pinball in § 2. For simplicity, closeness to the secondary bifurcation is assumed. For the same reason, the mean-field Galerkin system shall still describe the periodic solution. In this case, the generalized 5-mode mean-field expansion
 $$\begin{eqnarray}\boldsymbol{u}(\boldsymbol{x},t)=\boldsymbol{u}_{s}(\boldsymbol{x})+\mathop{\sum }_{i=1}^{5}a_{i}(t)\boldsymbol{u}_{i}(\boldsymbol{x})\end{eqnarray}$$
describes the flow where  $a_{1},a_{2},a_{3}\in O(1)$ and
 $a_{4}\in O(\unicode[STIX]{x1D700})$ and
 $a_{5}\in O(\unicode[STIX]{x1D6FF})$,
 $\unicode[STIX]{x1D700}$,
 $\unicode[STIX]{x1D6FF}$ being smallness parameters associated with the pitchfork bifurcation. We project equations (3.17) and (3.19) on (3.31). The
 $O(1)$ terms encapsulate the original Hopf model while the low-pass filtered
 $O(\unicode[STIX]{x1D700},\unicode[STIX]{x1D6FF})$ terms yield the original pitchfork system. This yields the following generalized mean-field system:
 $$\begin{eqnarray}\displaystyle & \displaystyle \text{d}a_{1}/\text{d}t=\unicode[STIX]{x1D70E}a_{1}-\unicode[STIX]{x1D714}a_{2},\quad \unicode[STIX]{x1D70E}=\unicode[STIX]{x1D70E}_{1}-\unicode[STIX]{x1D6FD}a_{3}, & \displaystyle\end{eqnarray}$$
 $$\begin{eqnarray}\displaystyle & \displaystyle \text{d}a_{2}/\text{d}t=\unicode[STIX]{x1D70E}a_{2}+\unicode[STIX]{x1D714}a_{1},\quad \unicode[STIX]{x1D714}=\unicode[STIX]{x1D714}_{1}+\unicode[STIX]{x1D6FE}a_{3}, & \displaystyle\end{eqnarray}$$
 $$\begin{eqnarray}\displaystyle & \displaystyle \text{d}a_{3}/\text{d}t=\unicode[STIX]{x1D70E}_{3}a_{3}+\unicode[STIX]{x1D6FD}_{3}(a_{1}^{2}+a_{2}^{2}), & \displaystyle\end{eqnarray}$$
 $$\begin{eqnarray}\displaystyle & \displaystyle \text{d}a_{4}/\text{d}t=\unicode[STIX]{x1D70E}_{4}a_{4}-\unicode[STIX]{x1D6FD}_{4}a_{4}a_{5}, & \displaystyle\end{eqnarray}$$
 $$\begin{eqnarray}\displaystyle & \displaystyle \text{d}a_{5}/\text{d}t=\unicode[STIX]{x1D70E}_{5}a_{5}+\unicode[STIX]{x1D6FD}_{5}a_{4}^{2}. & \displaystyle\end{eqnarray}$$
 $\unicode[STIX]{x1D70E}_{1}$,
 $\unicode[STIX]{x1D714}_{1}$,
 $\unicode[STIX]{x1D70E}_{4}$ are obtained from the corresponding global stability analysis. Slaving is ensured with
 $\unicode[STIX]{x1D70E}_{3}=-10\unicode[STIX]{x1D70E}_{1}$ and
 $\unicode[STIX]{x1D70E}_{5}=-10\unicode[STIX]{x1D70E}_{4}$. The nonlinearity parameters
 $\unicode[STIX]{x1D6FD}$,
 $\unicode[STIX]{x1D6FE}$,
 $\unicode[STIX]{x1D6FD}_{3}$,
 $\unicode[STIX]{x1D6FD}_{4}$ and
 $\unicode[STIX]{x1D6FD}_{5}$ are determined from the limit cycle parameters
 $r^{\circ }$,
 $\unicode[STIX]{x1D714}^{\circ }$ and
 $a_{3}^{\circ }$ and pitchfork parameters
 $a_{4}^{\pm }$ and
 $a_{5}^{\pm }$ in the asymptotic regime.
As the amplitude of the pitchfork bifurcation grows, the smallness argument does not hold and we get cross-terms, like  $\unicode[STIX]{x1D70E}=\unicode[STIX]{x1D70E}_{1}-\unicode[STIX]{x1D6FD}a_{3}-\unicode[STIX]{x1D6FD}_{15}a_{5}$. We shall not pause to elaborate on the possible generalizations now, but will return to the topic in the results section.
3.6 Sparse Galerkin model from mean-field considerations
The mean-field Galerkin system (3.32) with decoupled Hopf and pitchfork dynamics can, by construction, only be expected to hold near the pitchfork bifurcation  $Re\approx Re_{2}$. At higher Reynolds numbers
 $Re>Re_{2}$, cross-terms will appear, e.g. the growth rate
 $\unicode[STIX]{x1D70E}$ may also depend on the pitchfork-related shift-mode amplitude
 $a_{5}$. The most general Galerkin system (3.7) contains
 $5\times 5=25$ linear terms and
 $5\times 5\times 6/2=75$ quadratic terms.
The assumed symmetry of the modes excludes roughly half of these 100 coefficients. Let  $\unicode[STIX]{x1D712}_{i}=0$ for symmetric mean flow modes
 $\boldsymbol{u}_{i}$,
 $i=3,5$ and
 $\unicode[STIX]{x1D712}_{i}=1$ for the antisymmetric fluctuation modes
 $\boldsymbol{u}_{i}$,
 $i=1,2,4$. The linear coefficients
 $$\begin{eqnarray}\displaystyle l_{ij}=\unicode[STIX]{x1D708}(\boldsymbol{u}_{i},\triangle \boldsymbol{u}_{j})_{\unicode[STIX]{x1D6FA}}-(\boldsymbol{u}_{i},\unicode[STIX]{x1D735}\boldsymbol{\cdot }\boldsymbol{u}_{s}\otimes \boldsymbol{u}_{j})_{\unicode[STIX]{x1D6FA}}-(\boldsymbol{u}_{i},\unicode[STIX]{x1D735}\boldsymbol{\cdot }\boldsymbol{u}_{j}\otimes \boldsymbol{u}_{s})_{\unicode[STIX]{x1D6FA}} & & \displaystyle\end{eqnarray}$$
can be shown to vanish if  $\text{mod}\;(\unicode[STIX]{x1D712}_{i}+\unicode[STIX]{x1D712}_{j},2)=1$. In other words, the coefficients
 $l_{ij}$ vanish if the modes
 $\boldsymbol{u}_{i}$ and
 $\boldsymbol{u}_{j}$ have opposite symmetries. This excludes 12 of the 25 linear coefficients. Analogously, the quadratic coefficient
 $q_{ijk}$ can be shown to vanish if
 $\unicode[STIX]{x1D712}_{i}\not =\text{mod}\;(\unicode[STIX]{x1D712}_{j}+\unicode[STIX]{x1D712}_{k},2)$. In other words, the
 $q_{ijk}$ vanishes if the symmetry of
 $\boldsymbol{u}_{i}$ does not coincide with the symmetry of quadratic term
 $\boldsymbol{u}_{j}\otimes \boldsymbol{u}_{k}$. The quadratic term is symmetric if the modes
 $\boldsymbol{u}_{j}$ and
 $\boldsymbol{u}_{k}$ are both symmetric or both antisymmetric and is antisymmetric if both modes have opposite symmetries. In summary,
 $q_{ijk}$ vanishes if one or three modes are antisymmetric.
An additional sparsity of the coefficients arises from the temporal dynamics. Modes  $\boldsymbol{u}_{i}$,
 $i=1,2$ have oscillatory behaviour with angular frequency
 $\unicode[STIX]{x1D714}$, while the other modes show first-order dynamics, i.e. relaxation to asymptotic values. We apply the Krylov–Bogoliubov approximation with oscillatory
 $a_{1},a_{2}$ and slow
 $a_{3},a_{4},a_{5}$ dynamics. Thus, for instance,
 $l_{41}a_{1}$ vanishes on a one-period average and should not contribute to
 $\text{d}a_{4}/\text{d}t$. The linear coefficient
 $l_{41}$ can hence be set to zero. Taking the quadratic terms for example,
 $a_{1}a_{3}$ generates a first harmonic. Hence,
 $q_{413}a_{1}a_{3}$ cannot contribute to
 $\text{d}a_{4}/\text{d}t$ but
 $q_{113}a_{1}a_{3}$ can contribute to the oscillatory behaviour of
 $\text{d}a_{1}/\text{d}t$. Similarly,
 $a_{1}a_{2}$ generates a second harmonic,
 $a_{1}a_{2}=r\cos \unicode[STIX]{x1D714}t\times r\sin \unicode[STIX]{x1D714}t=(1/2)r^{2}\sin 2\unicode[STIX]{x1D714}t$ does not have a steady contribution, so
 $q_{312}$ can be set to zero.
From symmetry and Krylov–Bogoliubov considerations, only nine coefficients contribute to the linear term:  $l_{11}$,
 $l_{12}$,
 $l_{21}$,
 $l_{22}$,
 $l_{33}$,
 $l_{35}$,
 $l_{44}$,
 $l_{53}$,
 $l_{55}$. Note that the oscillator equations contain the
 $2\times 2$ block, while the shift-mode equations
 $i=3,5$ have cross-terms and the pitchfork amplitude dynamics
 $i=4$ has no cross-terms. Similarly, only 16 quadratic coefficients survive. The first eight coefficients
 $q_{113}$,
 $q_{115}$,
 $q_{123}$,
 $q_{125}$,
 $q_{213}$,
 $q_{215}$,
 $q_{223}$,
 $q_{225}$ are consistent with the Landau oscillator but with cross-terms to the pitchfork-related shift-mode amplitude, i.e.
 $\unicode[STIX]{x1D70E}=\unicode[STIX]{x1D70E}_{1}-\unicode[STIX]{x1D6FD}a_{3}-\unicode[STIX]{x1D6FD}_{15}a_{5}$ and
 $\unicode[STIX]{x1D714}=\unicode[STIX]{x1D714}_{1}+\unicode[STIX]{x1D6FE}a_{3}+\unicode[STIX]{x1D6FE}_{15}a_{5}$, introducing
 $\unicode[STIX]{x1D6FD}_{15}$ and
 $\unicode[STIX]{x1D6FE}_{15}$ as new coefficients. The first and second shift-mode equations
 $i=3,5$ may contain six quadratic terms
 $q_{311}$,
 $q_{322}$,
 $q_{344}$,
 $q_{511}$,
 $q_{522}$,
 $q_{544}$ from the Reynolds stresses. The amplification of the pitchfork dynamics is affected by the shift modes via
 $q_{443}$,
 $q_{445}$.
4 Primary flow regime
The primary flow regime covers the range of Reynolds numbers  $Re_{1}<Re<Re_{2}$. We consider the flow and reduction of the dynamics at
 $Re=30$, as a representative case. In § 4.1, a linear stability analysis is done on the steady solution and the three degrees of freedom of the flow dynamics are identified. In § 4.2, we propose a least-order model of the flow dynamics at
 $Re=30$ and compare its performance with respect to the full flow dynamics.
4.1 Eigenspectra of the steady solution
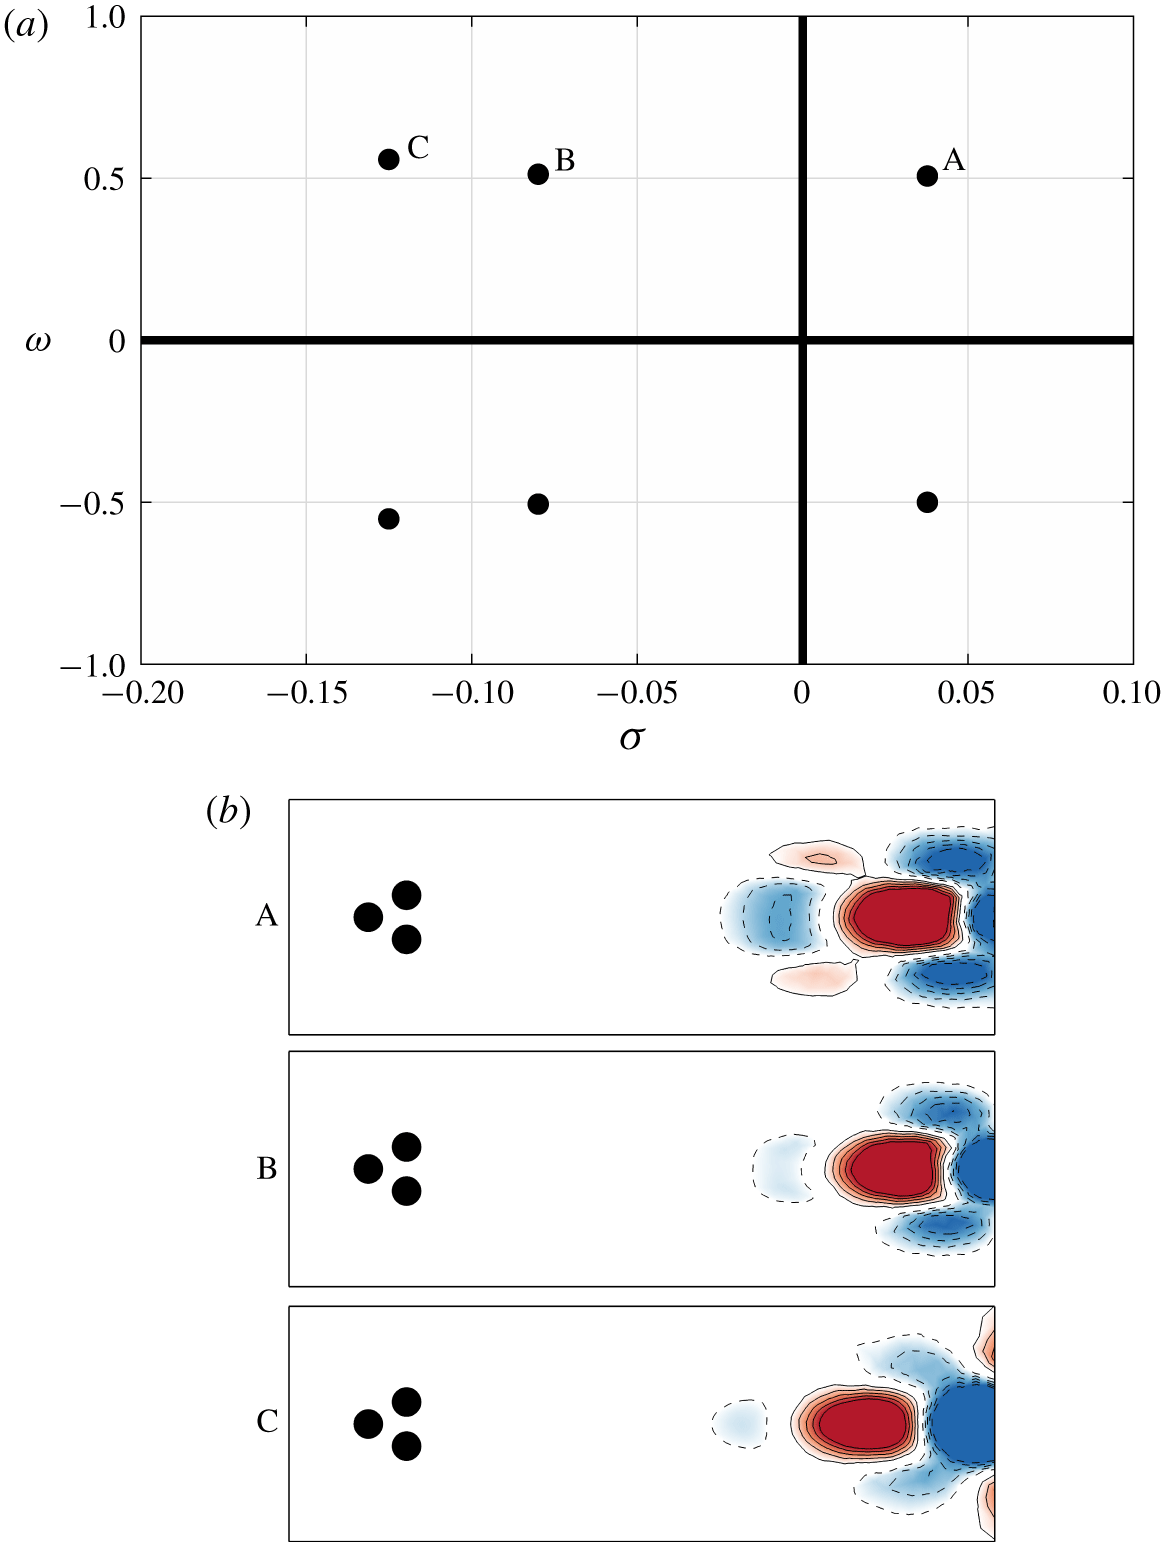
The steady solution becomes unstable beyond  $Re=Re_{1}$, as reported in § 2. A linear stability analysis indicates that one pair of complex-conjugated eigenmodes have a positive growth rate on the range
 $Re_{1}<Re<Re_{2}$, as shown in figure 7 for
 $Re=30$. These two leading eigenmodes are associated with vortical structures shed downstream in the wake, at the angular frequency
 $1/2$. As the instability grows, the distorted mean flow
 $\boldsymbol{u}^{D}=\boldsymbol{u}_{s}+\boldsymbol{u}_{\unicode[STIX]{x1D6E5}}$ changes, as expected by equations (3.2) and (3.18). The shift mode
 $\boldsymbol{u}_{3}$, involved in
 $\boldsymbol{u}_{\unicode[STIX]{x1D6E5}}$ at
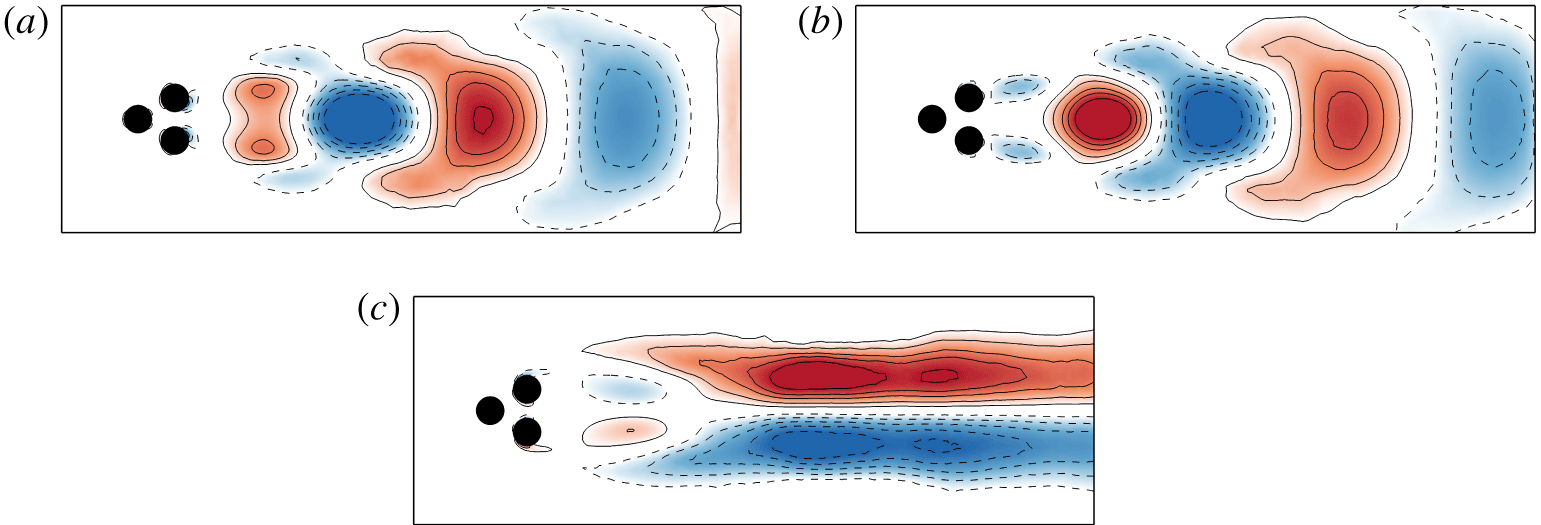
 $Re=30$, is shown in figure 8(c). In the permanent (time-periodic) flow regime, the distorted mean flow
 $\boldsymbol{u}^{D}$ eventually matches the asymptotic mean flow field
 $\overline{\boldsymbol{u}}$, and vortex shedding is well established with frequency
 $8.7\times 10^{-2}$.
(a) Eigenspectrum resulting from the linear stability analysis of the steady solution  $\boldsymbol{u}_{s}$, together with (b) the first three leading eigenmodes, at
 $Re=30$. Only the real part of the complex eigenmodes is shown. Red colour and solid contours are positive values of the vorticity, blue colour and dashed contours are negative values.

First two leading POD modes  $\boldsymbol{u}_{1,2}$ at
 $Re=30$ (a) & (b) and shift mode
 $\boldsymbol{u}_{3}$ (c). Red colour and solid contours are positive values of the vorticity, blue colour and dashed contours are negative values.

4.2 Reduced-order model (ROM) of the primary flow regime
As introduced in § 3, the Galerkin ansatz for the Hopf bifurcation reads
 $$\begin{eqnarray}\boldsymbol{u}(\boldsymbol{x},t)\approx \boldsymbol{u}_{s}(\boldsymbol{x})+a_{1}(t)\boldsymbol{u}_{1}(\boldsymbol{x})+a_{2}(t)\boldsymbol{u}_{2}(\boldsymbol{x})+a_{3}(t)\boldsymbol{u}_{3}(\boldsymbol{x}).\end{eqnarray}$$
The von Kármán modes  $\boldsymbol{u}_{1,2}$ could be chosen as the real and imaginary parts of the first eigenmode, respectively. This choice would make sense to describe the transient dynamics close to the steady solution. A better choice for describing the dynamics on the asymptotic limit cycle is to choose
 $\boldsymbol{u}_{1,2}$ as the first two modes of a proper orthogonal decomposition (POD) of the limit cycle data. The first two POD modes actually contribute almost 95 % of the total fluctuating kinetic energy at
 $Re=30$ and are clearly associated with the von Kármán street of shed vortices, as shown in figure 8(a,b). For the construction of the ROM, POD modes
 $\boldsymbol{u}_{1,2}$ are preferred to the two leading eigenmodes, because we demand an accurate representation of the asymptotic periodic dynamics. Following equations (3.22)–(3.23), the dynamical system resulting from the Galerkin projection of ansatz (4.1) on the Navier–Stokes equations, after Krylov–Bogoliubov simplifications, reads
 $$\begin{eqnarray}\displaystyle & \displaystyle \text{d}a_{1}/\text{d}t=\unicode[STIX]{x1D70E}a_{1}-\unicode[STIX]{x1D714}a_{2}, & \displaystyle\end{eqnarray}$$
 $$\begin{eqnarray}\displaystyle & \displaystyle \text{d}a_{2}/\text{d}t=\unicode[STIX]{x1D70E}a_{2}+\unicode[STIX]{x1D714}a_{1}, & \displaystyle\end{eqnarray}$$
 $$\begin{eqnarray}\displaystyle & \displaystyle \text{d}a_{3}/\text{d}t=\unicode[STIX]{x1D70E}_{3}(a_{3}-\unicode[STIX]{x1D705}(a_{1}^{2}+a_{2}^{2})), & \displaystyle\end{eqnarray}$$
with  $\unicode[STIX]{x1D70E}=\unicode[STIX]{x1D70E}_{1}-\unicode[STIX]{x1D6FD}a_{3}$ and
 $\unicode[STIX]{x1D714}=\unicode[STIX]{x1D714}_{1}+\unicode[STIX]{x1D6FE}a_{3}$. The value of the coefficients at
 $Re=30$ for the resulting ROM are summarized in table 2. Note that all coefficients but
 $\unicode[STIX]{x1D6FE}$ and
 $\unicode[STIX]{x1D70E}_{3}$ are fixed by either the linear stability analysis or the asymptotic dynamics, see § 3. The coefficient
 $\unicode[STIX]{x1D70E}_{3}$ can be chosen arbitrarily large as
 $a_{3}$ is slaved to
 $a_{1},a_{2}$ (here we chose
 $\unicode[STIX]{x1D70E}_{3}=-10\unicode[STIX]{x1D70E}_{1}$), while
 $\unicode[STIX]{x1D6FE}$ had to be calibrated in order to better match the asymptotic angular frequency.
Coefficients of the reduced-order model at  $Re=30$. See text for details.

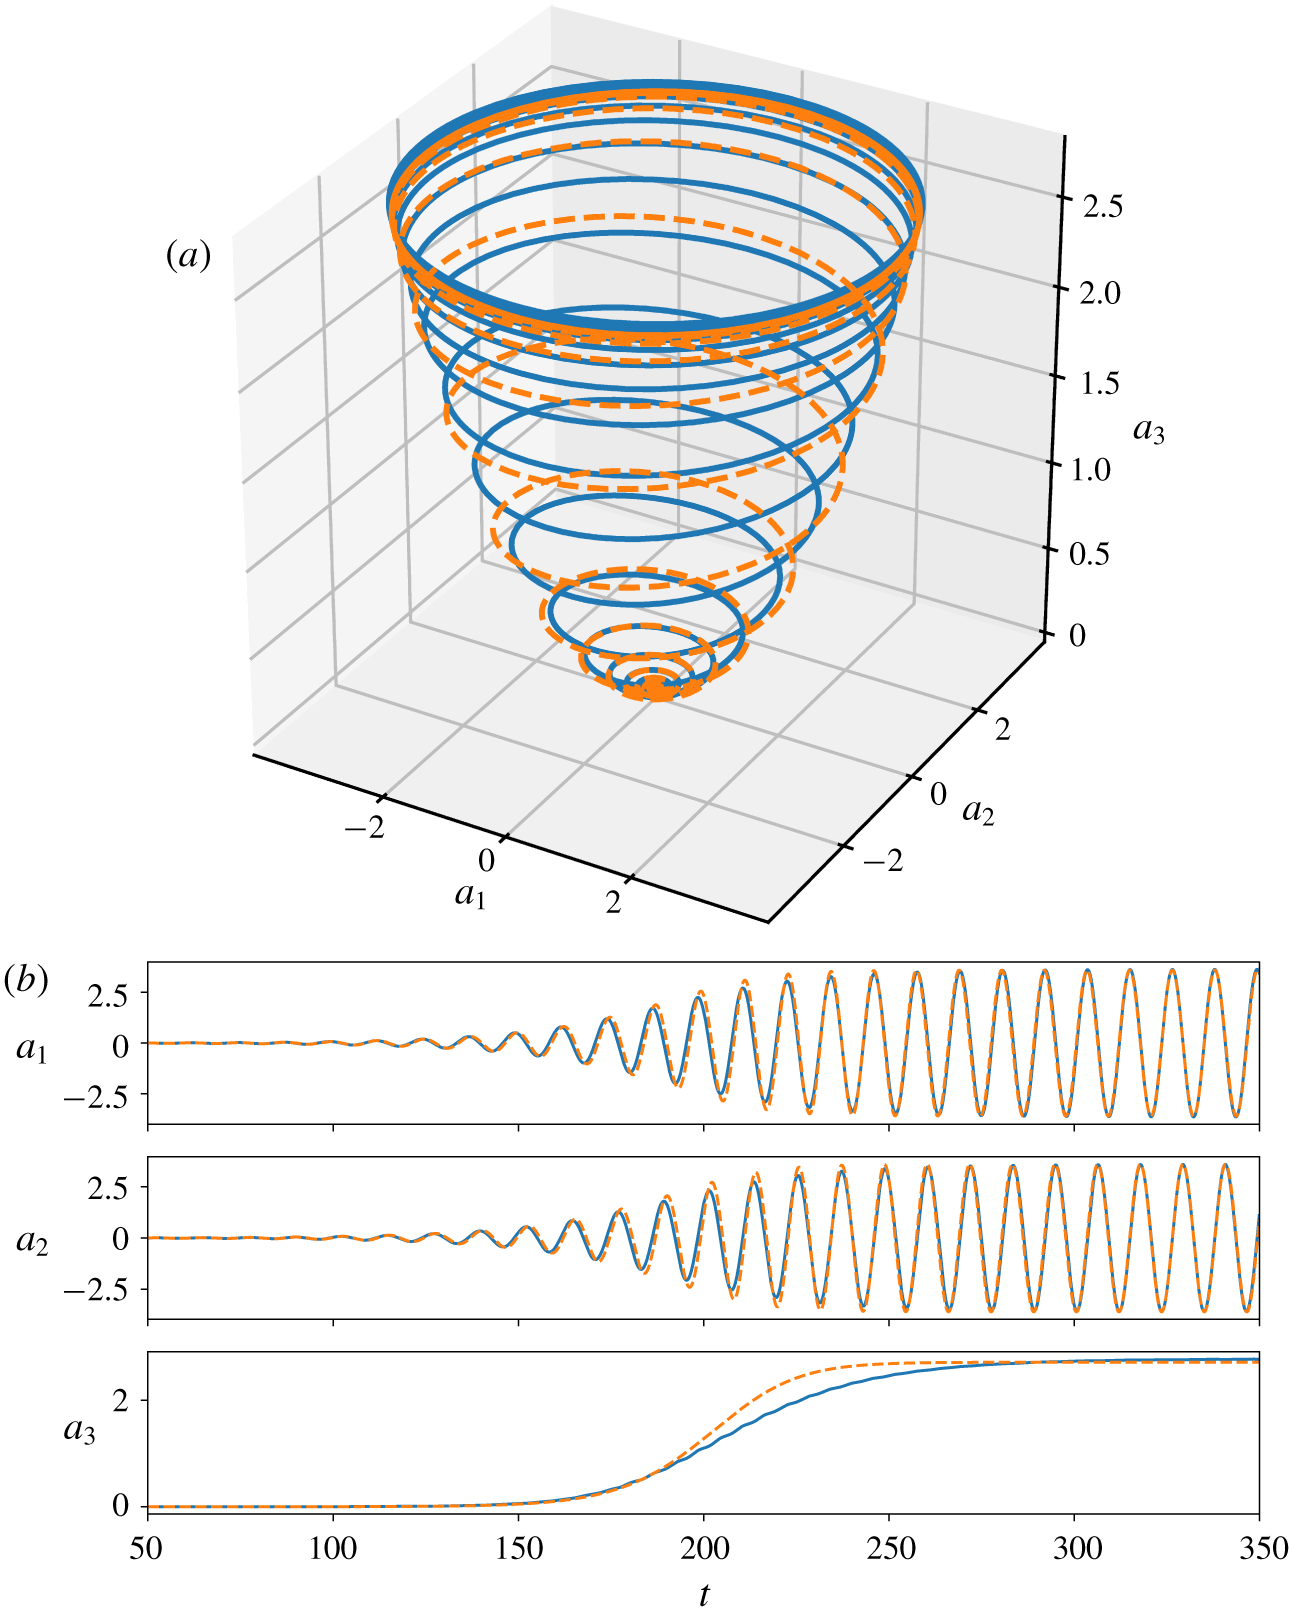
The dynamics of both the fluidic pinball (solid blue curve) and the ROM (dashed red curve) are compared in the three-dimensional subspace spanned by  $a_{1}$,
 $a_{2}$,
 $a_{3}$, see the top of figure 9. In figure 9 are also shown the individual time series of
 $a_{1}$ to
 $a_{3}$ for both the fluidic pinball and the ROM (same representation). As expected from the POD modes
 $\boldsymbol{u}_{1,2}$, the dynamics on the asymptotic (permanent) limit cycle is well described in amplitude
 $r$ and angular frequency
 $\unicode[STIX]{x1D714}$ by the ROM. Moreover, the ROM also captures the transient dynamics on the parabolic manifold
 $a_{3}\equiv \unicode[STIX]{x1D705}(a_{1}^{2}+a_{2}^{2})$. Henceforth, although all coefficients but one are fixed, the Galerkin system (4.1) is able to reproduce the most salient dynamical features of the flow in both the transient and the permanent regimes.
(a) Three-dimensional state space spanned by  $a_{1}$,
 $a_{2}$,
 $a_{3}$, at
 $Re=30$. From direct numerical simulations of the fluidic pinball (solid blue line) and from the mean-field reduced-order model (dashed red line). The initial condition, identical in both systems, starts close to the fixed point (steady solution) before evolving on the parabolic manifold
 $a_{3}=\unicode[STIX]{x1D705}(a_{1}^{2}+a_{2}^{2})$ toward the asymptotic limit cycle. (b) Corresponding time series for
 $a_{1}$ to
 $a_{3}$.

5 Secondary flow regime
The secondary flow regime ranges over  $Re_{2}<Re<Re_{3}$. For illustration, we focus on the flow at
 $Re=80$, i.e. at a finite distance from the secondary bifurcation. In § 5.1 a linear stability analysis of the resulting three steady solutions is performed. A least-order model is proposed and discussed in § 5.2.
5.1 Eigenspectra of the steady solutions
As a result of the pitchfork bifurcation, there exist three steady solutions beyond  $Re_{2}$: the symmetric steady solution
 $\boldsymbol{u}_{s}$, unstable to the periodic vortex shedding beyond
 $Re_{1}$, and two mirror-conjugated asymmetric steady solutions
 $\boldsymbol{u}_{s}^{\pm }$, also unstable to vortex shedding but only existing beyond
 $Re_{2}$, see figure 3.
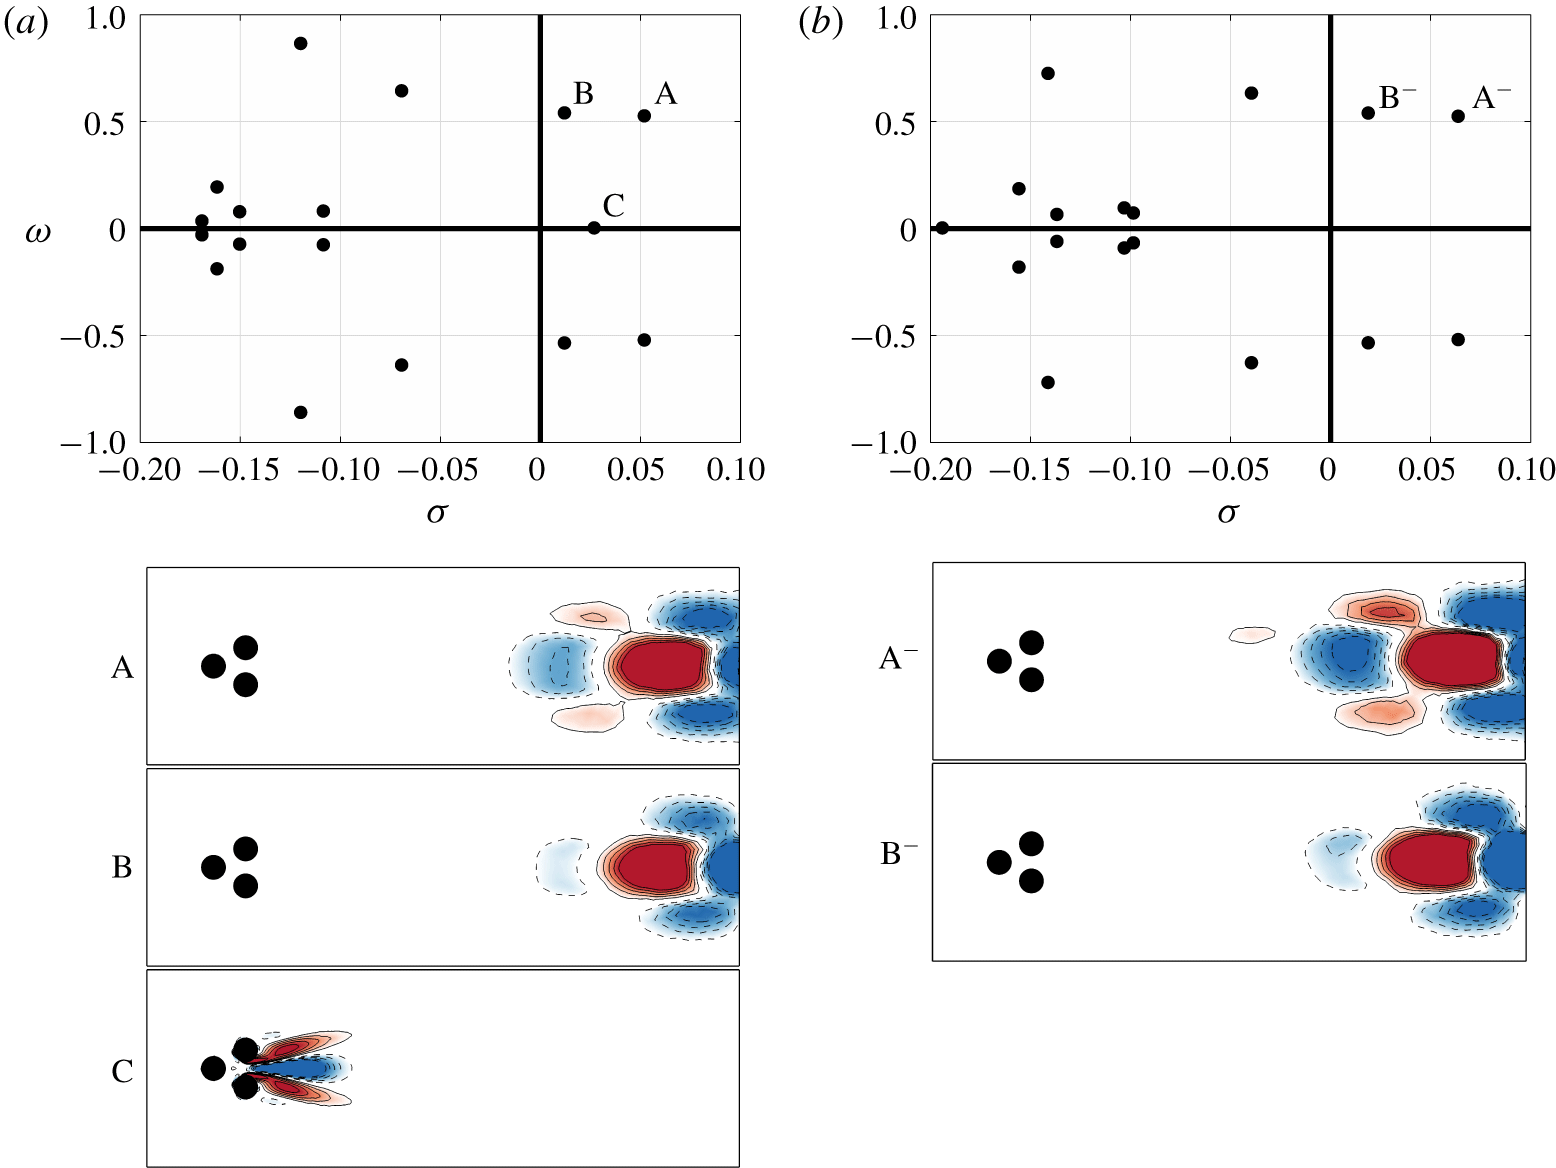
The linear stability analysis of  $\boldsymbol{u}_{s}$ reveals two pairs of complex-conjugated eigenmodes with positive growth rate, and one eigenmode of zero frequency, see figure 10(a). The steady eigenmode is antisymmetric and reflects the symmetry broken by the pitchfork bifurcation. It is clearly associated with the base-bleeding jet, with all its energy concentrated in the near field. The two pairs of complex-conjugated eigenmodes are each associated with von Kármán streets of shed vortices. Both pairs of complex eigenmodes are antisymmetric and have quite similar angular frequencies. A closer view of the second pair of complex eigenmodes indicates that its growth rate cancels when the real eigenmode crosses the zero axis. This indicates that the new oscillatory mode is intimately connected to the symmetry breaking occurring at
 $Re_{2}$. At
 $Re>Re_{2}$, this gives rise to the only stable limit cycle for the flow dynamics, while the limit cycle associated with the leading pair of complex eigenmodes has become unstable and can only be visited transiently in time.
The linear stability analysis of  $\boldsymbol{u}_{s}^{-}$ (respectively
 $\boldsymbol{u}_{s}^{+}$) reveals two pairs of complex-conjugated eigenmodes with positive growth rate, centred on an asymmetric mean flow, see figure 10(b). All eigenmodes are asymmetric, a property inherited from the steady solution.
In the permanent regime, the mean flow field will inherit the symmetry of one of the three (unstable) steady solutions, depending on the details of the initial perturbation.
Eigenspectrum (top) and real part of the eigenvectors (bottom) of the symmetry-preserving steady solution  $\boldsymbol{u}_{s}$ (a), of the symmetry-breaking steady solution
 $\boldsymbol{u}_{s}^{-}$ (b), both at
 $Re=80$. The red colour and solid contours in the eigenvectors are positive values of the vorticity, blue colour and dashed contours are negative values.

5.2 Reduced-order model in the secondary flow regime
Additional modes arising from the pitchfork bifurcation, at  $Re=80$, (a) mode
 $\boldsymbol{u}_{4}$, (b) mode
 $\boldsymbol{u}_{5}$. Red colour and solid contours are positive values of the vorticity, blue colour and dashed contours are negative values. See text for details about the computation of these two modes.

As discussed in § 3, an ansatz of the flow state can now be written as
 $$\begin{eqnarray}\boldsymbol{u}(\boldsymbol{x},t)\approx \underbrace{\boldsymbol{u}_{s}(\boldsymbol{x})}_{}+\underbrace{a_{1}(t)\boldsymbol{u}_{1}(\boldsymbol{x})+a_{2}(t)\boldsymbol{u}_{2}(\boldsymbol{x})}_{\mathit{leading}\;\mathit{POD}\;\mathit{modes}\;\mathit{at}~Re=80}+\underbrace{a_{3}(t)\boldsymbol{u}_{3}(\boldsymbol{x})}_{\mathit{shift}\;\mathit{mode}}+\underbrace{a_{4}(t)\boldsymbol{u}_{4}(\boldsymbol{x})+a_{5}(t)\boldsymbol{u}_{5}(\boldsymbol{x})}_{\mathit{pitchfork}\;\mathit{degrees}\;\mathit{of}\;\mathit{freedom}}.\end{eqnarray}$$
It is worthwhile noticing that, in the frame of this ansatz, the two asymmetric steady solutions  $\boldsymbol{u}_{s}^{\pm }$ are related to the symmetric steady solution
 $\boldsymbol{u}_{s}$ via the additional antisymmetric mode
 $\boldsymbol{u}_{4}$
 $$\begin{eqnarray}\boldsymbol{u}_{s}^{\pm }=\boldsymbol{u}_{s}\pm \overline{a}_{4}\boldsymbol{u}_{4}+\overline{a}_{5}\boldsymbol{u}_{5},\end{eqnarray}$$
where  $\overline{a}_{4}$ and
 $\overline{a}_{5}$ are the time-averaged coefficients in the permanent regime. Consequently,
 $\boldsymbol{u}_{4}$ can be easily computed as
 $$\begin{eqnarray}\boldsymbol{u}_{4}\propto (\boldsymbol{u}_{s}^{+}-\boldsymbol{u}_{s}^{-}),\end{eqnarray}$$
and further orthonormalized to  $u_{1}$,
 $u_{2}$,
 $u_{3}$ by a Gram–Schmidt procedure. The resulting mode
 $\boldsymbol{u}_{4}$ is shown in figure 11(a). A comparison with the eigenmode associated with the real eigenvalue, in figure 10(a), shows that the shift mode
 $\boldsymbol{u}_{4}$ is just the real eigenmode against which the symmetric steady solution is unstable at
 $Re=80$, as expected by the definition of mode
 $\boldsymbol{u}_{4}$.
In a similar way, the additional mode  $\boldsymbol{u}_{5}$ can be constructed as
 $$\begin{eqnarray}\boldsymbol{u}_{5}\propto (\boldsymbol{u}_{s}^{+}+\boldsymbol{u}_{s}^{-})/2-\boldsymbol{u}_{s}.\end{eqnarray}$$
Mode  $\boldsymbol{u}_{5}$ is shown in figure 11(b) after orthonormalization.
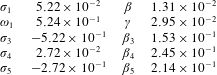
Coefficients of the least reduced-order model (3.32) at  $Re=80$.

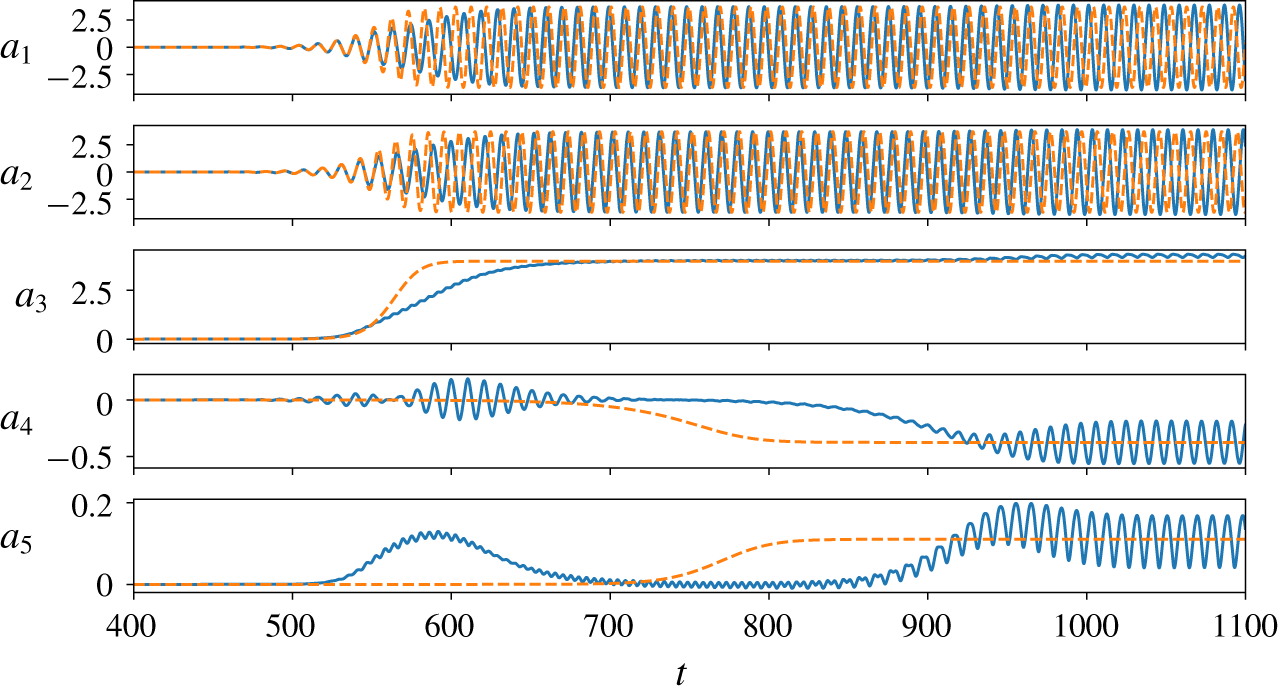
Time evolution of coefficients  $a_{1}$ to
 $a_{5}$ in the full flow dynamics (solid blue line) and the ROM (dashed red line) without cross-terms and coefficients fixed by the linear stability analysis and the asymptotic dynamics. The initial condition for both systems is the same.

Close to the pitchfork bifurcation, the resulting dynamical system is described by (3.32). At the threshold, the degrees of freedom  $a_{4}$,
 $a_{5}$ associated with the pitchfork bifurcation are expected to be fully uncoupled to the degrees of freedom
 $a_{1}$,
 $a_{2}$,
 $a_{3}$ associated with the Hopf bifurcation, and reciprocally, see § 3.3. In this case, an accurate linear and nonlinear dynamics from a Galerkin projection relies on deformable modes from eigenmodes near the fixed point to POD modes near the limit cycle (Loiseau, Noack & Brunton Reference Loiseau, Noack and Brunton2018). We avoid this complication by model identification from simulation data. The coefficients of the mean-field system (3.32) reported in table 3 were identified from the linear stability analysis of the symmetric steady solution and the asymptotic dynamics on the unstable symmetric preserving limit cycle and the stable symmetric-breaking limit cycle (see §§ 3.3 to 3.5). The resulting ROM dynamics is compared to the flow dynamics in figure 12. Inspection of figure 12 shows that such a model, reduced to only five degrees of freedom, is able to reproduce many features of the original dynamics: both the early transient and asymptotic dynamics of
 $a_{1}$ to
 $a_{3}$ are well reproduced, as well as the large time scale evolution of
 $a_{4},a_{5}$. However, the growth of coefficients
 $a_{1}$ to
 $a_{3}$ appears to be faster for the ROM, and
 $a_{4}$,
 $a_{5}$ also reach their asymptotic values significantly sooner than their values for the full simulations of the fluidic pinball. In addition, the transient kick in
 $a_{4},a_{5}$ is absent from the mean-field system (3.32), as well as the transient and asymptotic oscillations of
 $a_{4}$ and
 $a_{5}$ visible in figure 12, which would require coupling to
 $a_{1}$ or
 $a_{2}$, or both. All these features indicate that at Reynolds number
 $Re=80$, the Krylov–Bogoliubov assumption of pure harmonic behaviour with slowly varying amplitude and frequency no longer holds.
As a consequence, cross-terms must be included in the ROM. The assumption of non-oscillatory dynamics of the shift-mode amplitude  $a_{3}$ and of the two pitchfork modes
 $a_{4}$,
 $a_{5}$ is relaxed to reproduce the oscillatory behaviour evidenced in figure 12. Following § 3.6, the model identification process reads as follows.
- Step 1:
keep the five-dimensional linear–quadratic form of the dynamical system from the Galerkin projection with 25 linear and 75 quadratic terms.
- Step 2:
remove vanishing terms arising from the symmetry of the modes. Thus, only 13 linear and 36 quadratic terms are left to be determined.
- Step 3:
enforce the linear dynamics of the unstable Hopf and pitchfork eigenmodes from stability analysis in the Galerkin system. This implies that the growth rate
 $\unicode[STIX]{x1D70E}_{1}$ and frequency $\unicode[STIX]{x1D714}_{1}$ characterize the initial growth and angular frequency of $a_{1}$, $a_{2}$ and $\unicode[STIX]{x1D70E}_{4}$ represents the linear growth rate for $a_{4}$.
- Step 4:
the slaving of the Reynolds-stress-induced modes
$\boldsymbol{u}_{3}$ and $\boldsymbol{u}_{5}$ to the fluctuation level is imposed by setting the damping rate 10 times larger than the growth rate of the corresponding fluctuation: $\unicode[STIX]{x1D70E}_{3}=-10\unicode[STIX]{x1D70E}_{1}$, $\unicode[STIX]{x1D70E}_{5}=-10\unicode[STIX]{x1D70E}_{4}$. This strong damping rate quickly forces the trajectory onto the mean-field manifold.- Step 5:
enforce phase invariance for
$a_{1}$, $a_{2}$ in the first two equations. This is implied by the mean-field theory and is found to be a good approximation from numerical inspection. Thus, the oscillatory dynamics of $a_{1}$, $a_{2}$ is governed by $\unicode[STIX]{x1D70E}_{1}$, $\unicode[STIX]{x1D714}_{1}$, $\unicode[STIX]{x1D6FD}$, $\unicode[STIX]{x1D6FD}_{15}$, $\unicode[STIX]{x1D6FE}$, $\unicode[STIX]{x1D6FE}_{15}$ and $\unicode[STIX]{x1D6FD}_{3}$.- Step 6:
impose the asymptotic dynamics of the unstable symmetric limit cycle by fixing
$\unicode[STIX]{x1D6FD}$, $\unicode[STIX]{x1D6FE}$ and $\unicode[STIX]{x1D6FD}_{3}$.- Step 7:
apply the SINDy algorithm (Brunton, Proctor & Kutz Reference Brunton, Proctor and Kutz2016) to the remaining unknown terms, i.e. 6 linear terms and 28 quadratic terms. This step alone typically fails to yield a physics-based globally stable Galerkin system. This is not surprising in view of the necessary and sufficient conditions for global boundedness of Galerkin systems by Schlegel & Noack (Reference Schlegel and Noack2015). A Galerkin system identification with
$\ell 1$-norm penalization of the coefficients is found to have a performance similar to SINDy for the chosen constraints.- Step 8:
two additional simplifying physics-based constraints are found to make the dynamic system identified by SINDy robust for a large range of initial conditions. Enforcing
$q_{145}=q_{245}=0$ avoids the initial oscillatory dynamics being influenced by the initial kick of $a_{5}$, and setting $q_{344}=q_{434}=0$ leads to the right asymptotic transition of the pitchfork bifurcation.


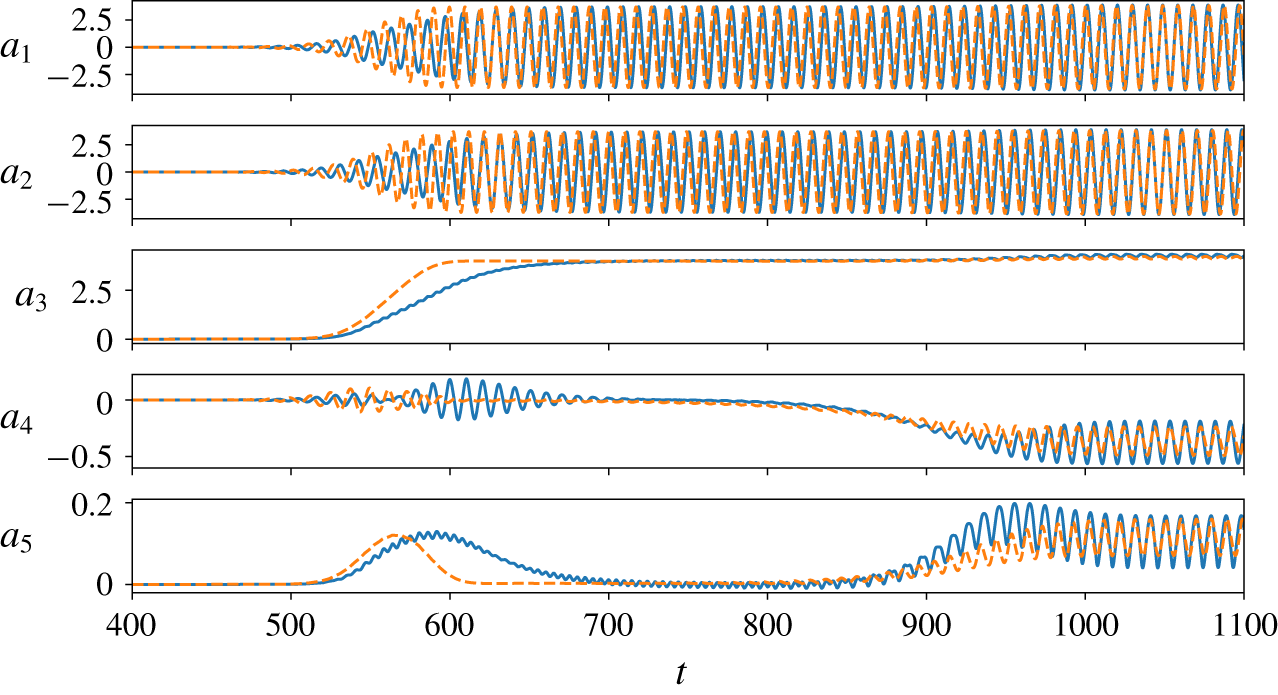
Performance of the ROM with cross-terms. Time evolution of coefficients  $a_{1}$ to
 $a_{5}$ in the full flow dynamics (solid blue line) and for the ROM (red dashed line). The initial condition is the same for the ROM and the full flow dynamics.

The resulting ROM reads
 $$\begin{eqnarray}\displaystyle & \displaystyle \text{d}a_{1}/\text{d}t=a_{1}(\unicode[STIX]{x1D70E}_{1}-\unicode[STIX]{x1D6FD}a_{3}-\unicode[STIX]{x1D6FD}_{15}a_{5})-a_{2}(\unicode[STIX]{x1D714}_{1}+\unicode[STIX]{x1D6FE}a_{3}+\unicode[STIX]{x1D6FE}_{15}a_{5})+l_{14}a_{4}+q_{134}a_{3}a_{4}, & \displaystyle\end{eqnarray}$$
 $$\begin{eqnarray}\displaystyle & \displaystyle \text{d}a_{2}/\text{d}t=a_{2}(\unicode[STIX]{x1D70E}_{1}-\unicode[STIX]{x1D6FD}a_{3}-\unicode[STIX]{x1D6FD}_{15}a_{5})+a_{1}(\unicode[STIX]{x1D714}_{1}+\unicode[STIX]{x1D6FE}a_{3}+\unicode[STIX]{x1D6FE}_{15}a_{5})+l_{24}a_{4}+q_{234}a_{3}a_{4}, & \displaystyle\end{eqnarray}$$
 $$\begin{eqnarray}\displaystyle & \displaystyle \text{d}a_{3}/\text{d}t=\unicode[STIX]{x1D70E}_{3}a_{3}+\unicode[STIX]{x1D6FD}_{3}r^{2}+l_{35}a_{5}+q_{314}a_{1}a_{4}+q_{335}a_{3}a_{5}+q_{355}a_{5}^{2}, & \displaystyle\end{eqnarray}$$
 $$\begin{eqnarray}\displaystyle & \displaystyle \text{d}a_{4}/\text{d}t=\unicode[STIX]{x1D70E}_{4}a_{4}-\unicode[STIX]{x1D6FD}_{4}a_{4}a_{5}+a_{1}(l_{41}+q_{413}a_{3}+q_{415}a_{5})+a_{2}(l_{42}+q_{423}a_{3}+q_{425}a_{5}),\qquad & \displaystyle\end{eqnarray}$$
 $$\begin{eqnarray}\displaystyle & \displaystyle \text{d}a_{5}/\text{d}t=\unicode[STIX]{x1D70E}_{5}a_{5}+\unicode[STIX]{x1D6FD}_{5}a_{4}^{2}+l_{53}a_{3}+q_{514}a_{1}a_{4}+q_{533}a_{3}^{2}+q_{535}a_{3}a_{5}, & \displaystyle\end{eqnarray}$$
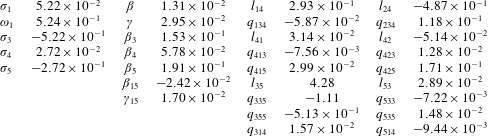
 $r^{2}=a_{1}^{2}+a_{2}^{2}$. The coefficients are summarized in table 4. The dynamics of the system (5.5) (dashed red line) is compared to the full flow dynamics of the fluidic pinball (solid blue line) in figure 13. Now the initial stage of the dynamics is much better reproduced, as well as the asymptotic oscillations of
 $a_{3}$,
 $a_{4}$ and
 $a_{5}$. Interestingly, the faster growth in
 $a_{1}$ to
 $a_{3}$, on the time range around 600, could not be completely corrected. It is worthwhile noticing that this range of time also corresponds to oscillations in
 $a_{4}$, which could not be reproduced by any cross-terms compatible with the symmetries of the system. Noticing that
 $a_{4}\neq 0$ on this range of time may also question our choice for
 $\unicode[STIX]{x1D70E}_{1}=5.22\times 10^{-2}$, which is the linear growth rate of the leading eigenmode around the symmetric steady solution
 $\boldsymbol{u}_{s}$. Indeed, although the initial condition is close to this point, the large amplitude oscillations of
 $a_{4}$ in the time range around 600 mean that the trajectory transiently escapes the symmetric subspace not only along
 $a_{3}$, but also along
 $a_{4}$ and
 $a_{5}$, before coming back close to the
 $a_{3}$ axis, in the time range from 700 to approximately 800. Therefore, it would be reasonable here to keep all the coefficients of the model unconstrained, but the number of free parameters is now too large for the identification process to be computationally tractable – for instance, it provides positive
 $\unicode[STIX]{x1D70E}_{3}$ when it must necessarily be strongly negative.
Model identification can be very challenging for a number of reasons. First, the conditions for global boundedness of the attractor for the linear–quadratic Galerkin system are rather restrictive (Schlegel & Noack Reference Schlegel and Noack2015). Second, the Galerkin method assumes fixed expansion modes. Yet, least-order models often have deformable modes changing with the fluctuation level (Tadmor et al. Reference Tadmor, Lehmann, Noack, Cordier, Delville, Bonnet and Morzyński2011). The von Kármán vortex shedding metamorphosis from stability modes to POD modes may serve as an example. These deformations may also affect the structure of the dynamical system. Third, the Navier–Stokes dynamics may live on a strongly attracting manifold. This restriction of the state space may make certain Galerkin system coefficients numerically unobservable, like  $\unicode[STIX]{x1D70E}_{3}$ and
 $\unicode[STIX]{x1D70E}_{5}$ in our case. Despite these challenges, the model identified in table 4, as exemplified by figure 13, constitutes a faithful least-order model for the fluidic pinball at
 $Re=80$. Although the model is only five-dimensional, it can reproduce most of the key features, time scales, transient and asymptotic behaviours of the full dynamics.
Coefficients of the reduced-order model at  $Re=80$. See text for details.

6 Conclusions and outlook
Reduced-order models serve a number of purposes. For instance, ROMs facilitate a deeper understanding of the physical mechanisms at play in a flow configuration, by extracting the low-dimensional manifold on which the dynamics evolves (Manneville Reference Manneville2010). In that respect, the linear stability analysis of the steady solution shows the nonlinear amplitude saturation mechanism through the distorted mean flow. The difference between the steady solution and the mean flow is caused by the Reynolds stress, captured by the shift mode  $\boldsymbol{u}_{\unicode[STIX]{x1D6E5}}$, and affects the stability properties (Noack et al. Reference Noack, Afanasiev, Morzyński, Tadmor and Thiele2003; Barkley Reference Barkley2006; Sipp & Lebedev Reference Sipp and Lebedev2007; Turton, Tuckerman & Barkley Reference Turton, Tuckerman and Barkley2015). Deeper investigations would certainly deserve to be carried out on the relation between the stability analysis of fixed points, Floquet analysis of limit cycles and Lyapunov exponents of chaotic flow regimes. In addition, because Hopf and pitchfork bifurcations are generic bifurcations in fluid flows, the nonlinear dynamics identified in this study is expected to be extended and generalizable to other flows exhibiting similar bifurcations. Last but not least, a ROM provides fast estimators for predicting the forward evolution of the system. Such estimators could be used for control purposes (Brunton & Noack Reference Brunton and Noack2015; Rowley & Dawson Reference Rowley and Dawson2017). All these considerations motivated the present study, whose main results are summarized in § 6.1. Outlooks of this work are listed in § 6.2.
6.1 Concluding remarks and discussion
Flow configurations undergoing successive Hopf and pitchfork bifurcations are common in fluid mechanics. This is, for instance, the case of three-dimensional wake flows such as spheres (Mittal Reference Mittal1999; Gumowski et al. Reference Gumowski, Miedzik, Goujon-Durand, Jenffer and Wesfreid2008; Szaltys et al. Reference Szaltys, Chrust, Przadka, Goujon-Durand, Tuckerman and Wesfreid2012; Grandemange et al. Reference Grandemange, Gohlke and Cadot2014) or bluff body wake flows (Grandemange et al. Reference Grandemange, Cadot and Gohlke2012, Reference Grandemange, Gohlke and Cadot2013; Cadot et al. Reference Cadot, Evrard and Pastur2015; Bonnavion & Cadot Reference Bonnavion and Cadot2018; Rigas et al. Reference Rigas, Oxlade, Morgans and Morrison2014). The drag crisis and stalled flows are also characterized by the pitchfork bifurcation of a primarily Hopf-bifurcated flow, but the secondary transition is subcritical in this case.
In this study, we have considered the fluidic pinball on its way to chaos and have identified least-order models of the flow dynamics in the primary Hopf-bifurcated and secondary pitchfork-bifurcated flow regimes. Reduced-order modelling of Hopf bifurcations was already addressed in Noack et al. (Reference Noack, Afanasiev, Morzyński, Tadmor and Thiele2003) for the cylinder wake flow, while Meliga et al. (Reference Meliga, Chomaz and Sipp2009) derived the amplitude equation for a codimension two bifurcation (pitchfork and Hopf) based on a weakly nonlinear analysis in the wake of a disk, and Fabre et al. (Reference Fabre, Auguste and Magnaudet2008) derived the same equation solely based on symmetry arguments, in the wake of axisymmetric bodies. In the present contribution, we could demonstrate that the dynamics resulting from the successive Hopf and pitchfork bifurcations could be well captured by a five-dimensional model whose degrees of freedom couple through quadratic nonlinearities, as imposed by the Navier–Stokes equations.
For the fluidic pinball, the route to chaos is characterized by a primary supercritical Hopf bifurcation at  $Re\approx 18$, followed by a secondary supercritical pitchfork bifurcation at
 $Re\approx 68$. The Hopf bifurcation corresponds to the destabilization of the steady solution with respect to vortex shedding, while the pitchfork bifurcation occurs when the mean flow breaks the symmetry with respect to the mirror plane. The fluctuation amplitude of the von Kármán street is reduced, over a finite range of the Reynolds number around
 $Re_{2}$, when the base-bleeding jet is rising. This means that energy is withdrawn from the fluctuations to feed the mean flow transformation. Before the next transition occurs, the fluctuation amplitude starts to grow again, up to the largest value of the Reynolds number considered in this work.
There is strong evidence that the next transition is a Neimark–Säcker bifurcation. The resulting flow regime is most likely quasi-periodic over the range  $[Re_{3},Re_{4}]$. In this regime, a new oscillatory phenomenon takes place, characterized by slow oscillations of the base-bleeding jet. Three additional degrees of freedom might be necessary to deal with the newly arising oscillator. The flow dynamics eventually bifurcates into a chaotic regime, characterized by the random switching of the base-bleeding jet between two symmetric deflected positions. The overall route to chaos is summarized in the phenomenogram of figure 14.
Phenomenogram. The route to chaos develops along the  $Re_{D}$-axis. On this route are highlighted the least-order models identified at
 $Re=30$ and
 $Re=80$, where the manifolds on which the dynamics takes place are schematically drawn. The branches of the steady solution and periodic solution are presented by the black and blue curves, with the solid/dashed curves for the stable/unstable states. The degrees of freedom
 $a_{1}$,
 $a_{2}$ span the limit cycle subspace,
 $a_{3}$ is the axis of the parabolically shaped manifold, while
 $a_{4}$ is transversally associated with the pitchfork bifurcation, together with
 $a_{5}$, which slightly bends the surface to which the steady solutions
 $\boldsymbol{u}_{s}^{\pm }$ and
 $\boldsymbol{u}_{s}$ belong. The grey shaded shadows of the quasi-periodic and chaotic regimes are represented for the sake of illustration. Grey shaded inserts provide the least reduced-order models at the threshold for both the Hopf and pitchfork bifurcations under the constraint of the Navier–Stokes equations. Also shown at the top are the figure snapshots of the steady solutions, mean flow fields and instantaneous flow field, at either
 $Re=30$ or
 $Re=80$. The dotted arrows connect these snapshots to the corresponding points in the phenomenogram. In addition, individual degrees of freedom
 $\boldsymbol{u}_{1}$ to
 $\boldsymbol{u}_{5}$ are shown at the left.

The reduced-order models derived by Galerkin projections of the Navier–Stokes equations, based on the symmetry of the individual degrees of freedom, under Krylov–Bogoliubov simplifications, faithfully extract the manifolds on which the flow dynamics sets in. The ROM for the primary flow regime is only three-dimensional: two degrees of freedom are associated with the asymptotic stable limit cycle resulting from the vortex shedding. The third degree of freedom is a mode slaved to the two dominant modes and is mandatory for the description of the transient flow dynamics from the unstable steady solution to the post-transient mean flow, as already demonstrated in Noack et al. (Reference Noack, Afanasiev, Morzyński, Tadmor and Thiele2003). The least-order model in the secondary flow regime has only five degrees of freedom, three of which are associated with the Hopf bifurcation, the two remaining degrees of freedom being associated with the pitchfork bifurcation. In the phenomenogram of figure 14 are reported the structure of both reduced-order models close to the Hopf and the pitchfork bifurcations. When the two sets of degrees of freedom are fully uncoupled, some features of the flow dynamics are well reproduced (asymptotic mean behaviour, parabolic manifolds of the Hopf and pitchfork bifurcations), but many details are missing. To reproduce most of the transient and asymptotic flow features far from the bifurcation point, additional cross-terms have been included in the model, which relaxes the steadiness constraint usually assumed for the shift modes.
6.2 Outlook
The current generalized mean-field model captures the Hopf bifurcation and subsequent pitchfork bifurcation of the steady solution and limit cycles. The following onset of a quasi-periodic regime with slow oscillations of the deflected base-bleeding jet might presumably be incorporated by another Hopf bifurcation, leading to an eight-dimensional mean-field Galerkin model. The transition to chaos is accompanied by a return to a statistically symmetric flow, i.e. the base-bleeding jet oscillates around one asymmetric state before it stochastically switches to the other mirror-symmetric one. This behaviour is reminiscent of the transition to chaos of a harmonically forced Duffing oscillator. In the case of the fluidic pinball, the vortex shedding would constitute a forcing. Hence, one may speculate that the transition to chaos may already be resolved by the eight-dimensional Galerkin model in which the effect of vortex shedding on the jet oscillation becomes stronger with an increasing Reynolds number.
An alternative direction is to increase the accuracy of the mean-field Galerkin model. While the structure of the Galerkin system prevails for a large range of Reynolds numbers, the modes and all Galerkin system coefficients change in a non-trivial manner, e.g. the growth-rate formula should read  $\unicode[STIX]{x1D70E}=\unicode[STIX]{x1D70E}_{1}(Re)-\unicode[STIX]{x1D6FD}(Re)a_{3}$. The transients can be expected to be much more accurately resolved by the mean flow dependent modes, e.g.
 $\boldsymbol{u}_{i}(Re,a_{3},a_{5},\boldsymbol{x})$,
 $i=1,2$ for the resolution of vortex shedding (Loiseau et al. Reference Loiseau, Noack and Brunton2018). More generally, the flow lives on a low-dimensional manifold which includes mode deformations (Noack Reference Noack2016). Locally linear embedding (LLE) is a powerful technique for identifying the dimension and a parameterization in an automatic manner (Roweis & Saul Reference Roweis and Saul2000). The normal form of the bifurcations can be expected to coincide with the dynamics on the LLE feature coordinates.
A third direction follows an observation of Rempfer (Reference Rempfer1994) that Galerkin systems of many fluid flows can be considered as nonlinearly coupled oscillators. For two incommensurable shedding frequencies, this observation has been formalized in a generalized mean-field model by Noack et al. (Reference Noack, Schlegel, Ahlborn, Mutschke, Morzyński, Comte and Tadmor2008), Luchtenburg et al. (Reference Luchtenburg, Günter, Noack, King and Tadmor2009). Such multi-frequency models may be extended to resolve broadband frequency dynamics taking, for instance, the most dominant dynamic mode decomposition (DMD) modes (Rowley et al. Reference Rowley, Mezić, Bagheri, Schlatter and Henningson2009; Schmid Reference Schmid2010). Strengths and weaknesses of techniques currently used for model reduction are discussed in Taira et al. (Reference Taira, Brunton, Dawson, Rowley, Colonius, McKeon, Schmidt, Gordeyev, Theofilis and Ukeiley2017). While mean-field consideration expressly ignores non-trivial triadic interactions, their quantitative effect on the frequency cross-talk may still be well approximated by the mean flow interaction terms. Such multi-frequency mean-field models may eventually describe the effect of open-loop forcing on turbulence, see for instance the recent thorough review by Jiménez (Reference Jiménez2018) on turbulent flow modelling.
A fourth direction aligned with the large success of machine learning/artificial intelligence is the automated learning of state spaces, modes and dynamical systems. For the latter, SINDy provides an established elegant framework (Brunton et al. Reference Brunton, Proctor and Kutz2016). The choice of the state spaces might be facilitated by manifold learning from many solution snapshots (Gorban & Karlin Reference Gorban and Karlin2005). The authors actively pursue all the mentioned directions.
Acknowledgements
This work is supported by a public grant overseen by the French National Research Agency (ANR) as part of the ‘Investissement d’Avenir’ programme, through the ‘iCODE Institute project’ funded by the IDEX Paris-Saclay, ANR-11-IDEX-0003-02, by the ANR grants ‘ACTIV_ROAD’ and ‘FlowCon’ (ANR-17-ASTR-0022), and by Polish Ministry of Science and Higher Education (MNiSW) under the grant no. 05/54/DSPB/6492. We appreciate valuable stimulating discussions with S. Brunton, A. Bucci, N. Kutz, O. Semeraro, Y. Duguet, L. Tuckerman and the French-German-Canadian-American pinball team: F. Lusseyran, G. Cornejo-Maceda, J.-C. Loiseau, R. Martinuzzi, C. Raibaudo, R. Semaan and A. Ehlert.
Supplementary movies
Supplementary movies are available at https://doi.org/10.1017/jfm.2019.959.
Appendix A. Asymmetric steady solutions
For a Reynolds number larger than the critical value of the pitchfork bifurcation  $Re_{2}$, we can obtain two additional asymmetric steady solutions, one associated with the base-bleeding jet deflected upward, the other downward. These two asymmetric steady solutions are obtained by the steady Navier–Stokes solver initialized with a flow field (snapshot) with the same state of the base-bleeding jet. From the two asymmetric vortex sheddings, their corresponding asymmetric steady solutions can be obtained by the following steps.
- Step 1:
Run the unsteady Navier–Stokes solver with a time step larger than the vortex shedding period, initialized from a snapshot of the asymmetric vortex shedding. The vortex shedding will quickly vanish for this artificially large time step and approach the corresponding approximation of the steady state.
- Step 2:
Run the steady Navier–Stokes solver, restarted from this vortex shedding vanished solution to further refine the steady state.
Initialized with the three steady solutions with different states of the base-bleeding jet at  $Re=80$, the steady solutions for other Reynolds numbers can be obtained by the steady Navier–Stokes solver. At
 $Re=68$, all three steady solutions converge to a unique solution, which indicates that the critical value of the pitchfork bifurcation of the steady solution is between
 $68$ and
 $69$, as shown in figure 15 based on the lift coefficient of the steady solutions.
Lift coefficient of steady solutions at different values of the Reynolds number resulting from the steady Navier–Stokes solver starting with the steady solutions:  $\boldsymbol{u}_{s}(\boldsymbol{x})$ (point
 $+$ black curve),
 $\boldsymbol{u}_{s}^{+}(\boldsymbol{x})$ (star
 $+$ red curve) and
 $\boldsymbol{u}_{s}^{-}(\boldsymbol{x})$ (square
 $+$ blue line), at
 $Re=80$. Three curves overlap on the
 $C_{L}=0$ level as
 $Re\leqslant 68$.

Appendix B. Linear stability analysis
The linear stability problem for a base flow  $(\boldsymbol{U}(\boldsymbol{x}),P(\boldsymbol{x}))$ with small perturbations
 $(\boldsymbol{u}^{\prime }(\boldsymbol{x},t),p^{\prime }(\boldsymbol{x},t))$ is governed by the linearized Navier–Stokes equations, which read
 $$\begin{eqnarray}\unicode[STIX]{x2202}_{t}\boldsymbol{u}^{\prime }+(\boldsymbol{U}\boldsymbol{\cdot }\unicode[STIX]{x1D735})\boldsymbol{u}^{\prime }+(\boldsymbol{u}^{\prime }\boldsymbol{\cdot }\unicode[STIX]{x1D735})\boldsymbol{U}=\unicode[STIX]{x1D708}\triangle \boldsymbol{u}^{\prime }-\unicode[STIX]{x1D735}p^{\prime },\quad \unicode[STIX]{x1D735}\boldsymbol{\cdot }\boldsymbol{u}^{\prime }=0.\end{eqnarray}$$
The assumption of small perturbation allows us to linearize the equations, and we can separate the time and space dependence as
 $$\begin{eqnarray}\boldsymbol{u}^{\prime }(\boldsymbol{x},t)=\hat{\boldsymbol{u}}(\boldsymbol{x})\text{e}^{(\unicode[STIX]{x1D70E}+\text{i}\unicode[STIX]{x1D714})t},\quad p^{\prime }(\boldsymbol{x},t)=\hat{p}(\boldsymbol{x})\text{e}^{(\unicode[STIX]{x1D70E}+\text{i}\unicode[STIX]{x1D714})t}.\end{eqnarray}$$
By introducing the linear operator  $\boldsymbol{L}(\boldsymbol{U})$, all the terms except the time derivative term and the continuity equation can be cast as
 $\boldsymbol{L}(\boldsymbol{U})\boldsymbol{u}^{\prime }$, we can rewrite (B 1) as
 $$\begin{eqnarray}\unicode[STIX]{x2202}_{t}\boldsymbol{u}^{\prime }=\boldsymbol{L}(\boldsymbol{U})\boldsymbol{u}^{\prime }.\end{eqnarray}$$
Introducing (B 2) into (B 3), the equations can be written as
 $$\begin{eqnarray}(\unicode[STIX]{x1D70E}+\text{i}\unicode[STIX]{x1D714})\hat{\boldsymbol{u}}=\boldsymbol{L}(\boldsymbol{U})\hat{\boldsymbol{u}}.\end{eqnarray}$$
We use subspace iteration to solve this eigenvalue problem. A detailed review can be found in Morzynski, Afanasiev & Thiele (Reference Morzynski, Afanasiev and Thiele1999).
The global stability analysis of the steady solutions at different Reynolds numbers has been performed on a Krylov subspace of dimension 9–20. This converges after 50–100 iterations. The linear stability analysis of the symmetric steady solution  $\boldsymbol{u}_{s}$ reveals a pair of conjugated eigenvalues with positive real part first appearing as the Reynolds number is changing from 18 to 19, see figure 16(a). A real eigenvalue becomes positive between
 $Re=68$ and
 $69$, see figure 16(b). This confirms that a Hopf bifurcation occurs on the symmetric steady solution at
 $Re_{1}\approx 18$, and a pitchfork bifurcation at
 $Re_{2}\approx 68$.
Eigenspectrum resulting from the linear stability analysis of the symmetric steady solution  $\boldsymbol{u}_{s}$. With increasing
 $Re$, (a–c) a complex-conjugated eigenvalue pair crosses the imaginary axis at
 $Re$ changing from 18 to 19, the critical value of the Hopf bifurcation
 $Re_{1}\approx 18$, (d–f) a real eigenvalue crosses the imaginary axis at
 $Re$ changing from 68 to 69, the critical value of the pitchfork bifurcation
 $Re_{2}\approx 68$.

Appendix C. Floquet stability analysis
Similar to the linear stability framework, the Floquet stability problem works with a T-periodic base flow  $(\boldsymbol{U}(\boldsymbol{x},t),P(\boldsymbol{x},t))$. The linear operator now reads
 $$\begin{eqnarray}\unicode[STIX]{x2202}_{t}\boldsymbol{u}^{\prime }=\boldsymbol{L}(\boldsymbol{U}(\boldsymbol{x},t))\boldsymbol{u}^{\prime }.\end{eqnarray}$$
The linear operator  $\boldsymbol{L}(\boldsymbol{U}(\boldsymbol{x},t))$ is T-periodic because of the base flow
 $\boldsymbol{U}(\boldsymbol{x},t)$. The solutions to (C 1) are sought as
 $$\begin{eqnarray}\boldsymbol{u}^{\prime }(\boldsymbol{x},t)=\hat{\boldsymbol{u}}(\boldsymbol{x},t)\text{e}^{(\unicode[STIX]{x1D70E}+\text{i}\unicode[STIX]{x1D714})t},\end{eqnarray}$$
with the T-periodic Floquet modes  $\hat{\boldsymbol{u}}(\boldsymbol{x},t)$ and the corresponding Floquet exponents
 $\unicode[STIX]{x1D70E}+\text{i}\unicode[STIX]{x1D714}$. We define the Floquet operator as the time integrated
 $\boldsymbol{L}(\boldsymbol{U}(\boldsymbol{x},t))$ with the pre-stored periodic solutions over one period (Barkley & Henderson Reference Barkley and Henderson1996; Schatz, Barkley & Swinney Reference Schatz, Barkley and Swinney1995), which reads
 $$\begin{eqnarray}A_{F}=\int _{0}^{T}\boldsymbol{L}(\boldsymbol{U}(\boldsymbol{x},t))\,\text{d}t.\end{eqnarray}$$
The method used to solve the eigenproblem is the same as the linear stability analysis. The Floquet multipliers of  $A_{F}$ can be written as
 $\unicode[STIX]{x1D706}_{F}=\text{e}^{(\unicode[STIX]{x1D70E}+\text{i}\unicode[STIX]{x1D714})T}$. In our case, we consider the multipliers
 $\unicode[STIX]{x1D706}=\text{e}^{(\unicode[STIX]{x1D70E}+\text{i}\unicode[STIX]{x1D714})}$.
We performed the iteration on a Krylov subspace of dimension 9, using a symmetry-constrained T-periodic base flow. Below the critical Reynolds number, the base-bleeding jet is approximately steady and symmetric. This symmetry is also enforced at higher Reynolds numbers to compute the unstable periodic solution. The constraint is imposed on the central line as
 $$\begin{eqnarray}v(0\leqslant x\leqslant 1,|y|\leqslant 5\times 10^{-4})=0.\end{eqnarray}$$
As (C 4) restricts the vertical velocity of the nodes, the symmetry-constrained periodic solution is very close to the symmetry-preserving periodic solution. Normally, 10–20 iterations are enough to get a converged leading eigenvalue, initialized with a random vector or a Ritz vector computed at nearby Reynolds number with the periodic solution of the same symmetry. We do not attempt to calculate a complete, converged spectrum of all the eigenvalues, as the leading eigenvalue is associated with the instability of interest. The multipliers from the Floquet analysis around the critical value of the pitchfork bifurcation  $Re_{2}$ are shown in figure 17. When increasing
 $Re$, the leading real eigenvalue crosses the unit cycle at
 $(+1,0)$ as
 $Re$ changes from 69 to 70. The critical value of the pitchfork bifurcation is, therefore,
 $Re_{2}\approx 69$, identical to the critical value for the steady solution at the precision of the numerics. Both of them have the same eigenmode. At
 $Re=80$, the Floquet modes of both the unstable symmetric periodic solution and the stable asymmetric periodic solutions are shown in figure 18.
Multipliers resulting from the Floquet analysis of the symmetry-preserving periodic solution for (a)  $Re=60$, (b) 70 and (c) 80.

Multipliers resulting from the Floquet analysis (top) and the leading modes (bottom) of (a,c) the symmetry-preserving periodic solution, (b,d) the asymmetric periodic solution, both at  $Re=80$. Only the real part of the complex eigenmodes is shown. Red colour and solid contours are positive values of the vorticity, blue colour and dashed contours are negative values.

Overall, combined with the result of the linear stability analysis of the steady solutions, the bifurcation scenario at low Reynolds numbers can be shown in figure 19. The linear stability analysis of the steady solution and the periodic solution show a highly consistent result: the same kind of bifurcation with nearly the same critical Reynolds number, and the same eigenmodes. Besides, at  $Re=80$, the growth rates of the real eigenmode are very close: 0.0272 from the symmetric steady solution, 0.0247 from the symmetric periodic solution. This similarity is understood as the result of a transverse effect of the symmetric subspace.
Bifurcation scenario along the  $Re_{D}$-axis for the first two successive instabilities. The black curve indicates the stable branch, and dashed black curve for the unstable branch, combined with the linear/Floquet stability analysis results around the critical Reynolds number. The stability of the steady solutions
 $\boldsymbol{u}_{s}$ and
 $\boldsymbol{u}_{s}^{\pm }$, and the periodic solutions presented by the mean flow field
 $\overline{\boldsymbol{u}}$ and
 $\overline{\boldsymbol{u}}^{\pm }$ are illustrated by a dot for the stable state, or a circle for the unstable state. The red arrows show the possible transitions between them. The flow states in three stages are represented by the flow fields at
 $Re=10,30,80$.

Appendix D. Transient dynamics from different steady solutions
In this section, we show in figure 20 some typical transient dynamics starting with the unstable symmetric/asymmetric steady solutions at different Reynolds numbers, based on the lift coefficient  $C_{L}(t)$ from the resulting force on the three cylinders. Combining
 $C_{L}(t)$ with the drag coefficient
 $C_{D}(t)$ and the time-delayed lift coefficient
 $C_{L}(t-\unicode[STIX]{x1D70F})$ in which
 $\unicode[STIX]{x1D70F}$ is a quarter period, provides the phase portraits of figure 21. Three comparative numerical simulations are shown, starting with the symmetric and the two mirror-conjugated asymmetric steady solutions at the same
 $Re$ respectively. The mirror-conjugated initial conditions provide mirror-conjugated transient dynamics.
Transient dynamics based on the lift coefficient  $C_{L}$, resulting from the DNS starting with three steady solutions at different Reynolds numbers: (a)
 $Re=68$ starting with three steady solutions at
 $Re=75$, (b)
 $Re=75$ starting with three steady solutions at
 $Re=75$ and (c)
 $Re=100$ starting with three steady solutions at
 $Re=100$. The black dashed curve starts with the symmetric steady solution
 $\boldsymbol{u}_{s}$, the red curve starts with
 $\boldsymbol{u}_{s}^{-}$ and the blue curve starts with
 $\boldsymbol{u}_{s}^{+}$.

Figure 20(a) shows the transient dynamics at the critical Reynolds number  $Re_{2}$, initialized with the three steady solutions at
 $Re=75$. The lift coefficient starts oscillating quickly, and eventually reaches a unique oscillating state with zero mean value. This is consistent with the Floquet analysis at
 $Re=68$, where only one stable symmetry-centred limit cycle exists and any other state will eventually converge to this stable state.
Figure 20(b) shows three different scenarios at  $Re=75$ depending on the initial condition: from the symmetric steady solution
 $\boldsymbol{u}_{s}$ to the symmetry-centred limit cycle, from the symmetry-centred limit cycle to the asymmetry-centred limit cycles and from the asymmetric steady solutions
 $\boldsymbol{u}_{s}^{\pm }$ to the asymmetry-centred limit cycles. Starting with the symmetric steady solution, it will first reach the unstable symmetry-centred limit cycle, before asymptotically approaching one of two stable asymmetry-centred limit cycles. However, starting with the asymmetric steady solutions, it will directly reach the corresponding stable asymmetry-centred limit cycle. If the initial perturbation introduced to the symmetric steady solution has a certain bias of symmetry, a transition from the symmetric steady solution
 $\boldsymbol{u}_{s}$ to one of the two asymmetry-centred limit cycles will occur.
As we keep increasing the Reynolds number up to  $Re=100$, there still exist six states, but the transient scenario from the symmetric steady solution
 $\boldsymbol{u}_{s}$ is different. It will first reach one of two unstable asymmetric steady solutions
 $\boldsymbol{u}_{s}^{\pm }$, before asymptotically approaching the corresponding asymmetry-centred limit cycle, as shown in figure 20(c).
All of the transient dynamics mentioned above are highlighted with the red arrows in figure 19.
Scenarios of transient dynamics from the three unstable symmetric/asymmetric steady solutions of (a)  $Re=75$, (b)
 $Re=75$ and (c)
 $Re=100$, to their asymptotic stable limit cycles at (a)
 $Re=68$, (b)
 $Re=75$ and (c)
 $Re=100$: the black dashed curve from the symmetric steady solution
 $\boldsymbol{u}_{s}$ (
 $\times$), the red curve from the asymmetric steady solution
 $\boldsymbol{u}_{s}^{-}$ (●) and the blue curve from the asymmetric steady solution
 $\boldsymbol{u}_{s}^{+}$ (▪).

The phase portraits starting with different steady solutions, as shown in figure 21, reveal the above-mentioned transient dynamics, which is affected by the initial condition and the Reynolds number. At the same time, it also reflects the global effect of the pitchfork bifurcation at  $Re_{2}$, splitting the state space (see figure 21a) into a symmetric subspace and two mirror-conjugated asymmetric subspaces (see figure 21b,c).
Appendix E. On the simultaneous instability of the fixed point and the limit cycle
In this section, we exemplify the transverse effect of the pitchfork bifurcation on a three-dimensional dynamical system equivalent to the system of equation (3.32).
E.1 Dynamical system
The dynamical system reads
 $$\begin{eqnarray}\left.\begin{array}{@{}c@{}}{\dot{x}}=(\unicode[STIX]{x1D707}-\unicode[STIX]{x1D707}_{1}-(x^{2}+y^{2}))x+(\unicode[STIX]{x1D714}_{0}+(x^{2}+y^{2}))y\\ {\dot{y}}=(\unicode[STIX]{x1D707}-\unicode[STIX]{x1D707}_{1}-(x^{2}+y^{2}))y-(\unicode[STIX]{x1D714}_{0}+(x^{2}+y^{2}))x\\ {\dot{z}}=(\unicode[STIX]{x1D707}-\unicode[STIX]{x1D707}_{2})z-z^{3},\end{array}\right\}\end{eqnarray}$$
with  $\unicode[STIX]{x1D707}_{1}=1,\unicode[STIX]{x1D707}_{2}=2,\unicode[STIX]{x1D714}_{0}=1$. This system undergoes a supercritical Hopf bifurcation in the
 $(x,y)$-plane at
 $\unicode[STIX]{x1D707}=\unicode[STIX]{x1D707}_{1}$ and a supercritical pitchfork bifurcation along the
 $z$-axis at
 $\unicode[STIX]{x1D707}=\unicode[STIX]{x1D707}_{2}$. For
 $\unicode[STIX]{x1D707}>\unicode[STIX]{x1D707}_{1}$, the stable fixed point at
 $(0,0,0)$ becomes unstable, and the limit cycle around
 $(0,0,0)$ with radius
 $r=\sqrt{\unicode[STIX]{x1D707}-\unicode[STIX]{x1D707}_{1}}$ and angular frequency
 $\unicode[STIX]{x1D714}=\unicode[STIX]{x1D714}_{0}+\unicode[STIX]{x1D707}-\unicode[STIX]{x1D707}_{1}$ is stable in the (
 $x,y$)-plane. Increasing
 $\unicode[STIX]{x1D707}$ until
 $\unicode[STIX]{x1D707}>\unicode[STIX]{x1D707}_{2}$, the fixed point undergoes a secondary instability, as well as the limit cycle. Three unstable fixed points
 $(0,0,0)$,
 $(0,0,\pm \sqrt{\unicode[STIX]{x1D707}-\unicode[STIX]{x1D707}_{2}})$, and three limit cycles around these fixed points with radius
 $r=\sqrt{\unicode[STIX]{x1D707}-\unicode[STIX]{x1D707}_{1}}$ and angular frequency
 $\unicode[STIX]{x1D714}=\unicode[STIX]{x1D714}_{0}+\unicode[STIX]{x1D707}-\unicode[STIX]{x1D707}_{1}$ in the (
 $x,y$)-plane are found, as shown in figure 22.
Three-dimensional schematic diagram of  $\unicode[STIX]{x1D707}=3$, with the transition from the perturbed initial conditions on the unstable limit cycle
 $z=0$ (the black cycle) to the corresponding stable limit cycles
 $z=\pm \sqrt{\unicode[STIX]{x1D707}-\unicode[STIX]{x1D707}_{2}}$ (the blue and red cycles): the blue dashed curve from
 $(-1,-1,-0.0001)$ (▪), the red dashed curve from
 $(1,1,0.0001)$ (●).

E.2 Linear stability analysis
The ordinary differential equation (ODE) (E 1) can be written as
 $$\begin{eqnarray}\dot{\boldsymbol{q}}=\boldsymbol{F}(\boldsymbol{q}),\quad \boldsymbol{q}=(x,y,z)\end{eqnarray}$$
and we note  $\boldsymbol{q}_{s}$ is the steady state, that is,
 $\boldsymbol{F}(\boldsymbol{q}_{s})=0$. Consider a small perturbation
 $\boldsymbol{q}^{\prime }$ around the steady state
 $\boldsymbol{q}_{s}$ by
 $$\begin{eqnarray}\boldsymbol{q}=\boldsymbol{q}_{s}+\boldsymbol{q}^{\prime }.\end{eqnarray}$$
We derived the linearized evolution equation
 $$\begin{eqnarray}\dot{\boldsymbol{q}^{\prime }}=\boldsymbol{D}\boldsymbol{F}(\boldsymbol{q}_{s})\boldsymbol{q}^{\prime },\end{eqnarray}$$
where  $\boldsymbol{D}\boldsymbol{F}(\boldsymbol{q}_{\boldsymbol{s}})$ is the Jacobian matrix of the considered steady state
 $\boldsymbol{q}_{s}$.
The stability of this steady state is determined by the eigenvalues  $\unicode[STIX]{x1D70E}+\text{i}\unicode[STIX]{x1D714}$ of the Jacobian matrix. The eigenspectrum of the fixed point
 $\boldsymbol{q}_{s}^{0}=(0,0,0)$ is shown in figure 23. The growth rate and angular frequency of the pair of conjugated eigenvalues are
 $\unicode[STIX]{x1D707}-\unicode[STIX]{x1D707}_{1}$ and
 $\unicode[STIX]{x1D714}_{0}$ respectively. The growth rate of the real eigenvalue is
 $\unicode[STIX]{x1D707}-\unicode[STIX]{x1D707}_{2}$.
Eigenspectrum resulting from the linear stability analysis of the steady solution  $\boldsymbol{q}_{s}^{0}$ at different
 $\unicode[STIX]{x1D707}$: (a)
 $\unicode[STIX]{x1D707}=0.5$, (b) 1.0, (c) 1.5, (d) 2.0, (e) 2.5.

The eigenspectrum of the steady solution  $\boldsymbol{q}_{s}^{\pm }=(0,0,\sqrt{\unicode[STIX]{x1D707}-\unicode[STIX]{x1D707}_{2}})$ for
 $\unicode[STIX]{x1D707}>\unicode[STIX]{x1D707}_{2}$ is shown in figure 24(b). The growth rate is
 $\unicode[STIX]{x1D707}-\unicode[STIX]{x1D707}_{2}$ at the steady solution
 $\boldsymbol{q}_{s}^{0}$ and
 $-2(\unicode[STIX]{x1D707}-\unicode[STIX]{x1D707}_{2})$ at the steady solution
 $\boldsymbol{q}_{s}^{\pm }$.
Eigenspectrum resulting from the linear stability analysis of the steady solutions  $\boldsymbol{q}_{s}^{0}$ (a) and
 $\boldsymbol{q}_{s}^{\pm }$ (b), at
 $\unicode[STIX]{x1D707}=2.5$.

E.3 Floquet stability analysis
Now, we consider the periodic solution  $\boldsymbol{q}_{p}(t)$ of the system of (E 1), which can be written as
 $$\begin{eqnarray}\boldsymbol{q}_{p}(t+T)=\boldsymbol{q}_{p}(t),\quad \text{with }\dot{\boldsymbol{q}}_{p}(t)=F(\boldsymbol{q}_{p}(t)).\end{eqnarray}$$
Consider a small perturbation  $\boldsymbol{q}^{\prime }$ around the periodic solution by
 $$\begin{eqnarray}\boldsymbol{q}(t)=\boldsymbol{q}_{p}(t)+\boldsymbol{q}^{\prime }(t).\end{eqnarray}$$
The first variational form reads
 $$\begin{eqnarray}\dot{\boldsymbol{q}^{\prime }}(t)=\boldsymbol{D}\boldsymbol{F}(\boldsymbol{q}_{p}(t))\boldsymbol{q}^{\prime }(t),\end{eqnarray}$$
where  $\boldsymbol{D}\boldsymbol{F}(\boldsymbol{q}_{p}(t))$ is the Jacobian matrix of the considered periodic solution
 $\boldsymbol{q}_{p}(t)$, but now, the linear equation has periodic coefficients.
The monodromy matrix can be written as
 $$\begin{eqnarray}M_{mono}=\int _{0}^{T}\boldsymbol{D}\boldsymbol{F}(\boldsymbol{q}_{p}(t))\,\text{d}t\end{eqnarray}$$
or equivalently
 $$\begin{eqnarray}M_{mono}=\frac{T}{2\unicode[STIX]{x03C0}}\int _{0}^{2\unicode[STIX]{x03C0}}\boldsymbol{D}\boldsymbol{F}(\boldsymbol{q}_{p}(\unicode[STIX]{x1D703}))\,\text{d}\unicode[STIX]{x1D703}.\end{eqnarray}$$
The stability of this periodic solution is determined by the multipliers  $\unicode[STIX]{x1D706}=\exp ((\unicode[STIX]{x1D70E}_{F}+\text{i}\unicode[STIX]{x1D714}_{F})/T)$, with
 $\unicode[STIX]{x1D70E}_{F}+\text{i}\unicode[STIX]{x1D714}_{F}$ being the eigenvalues of the monodromy matrix. As shown in figure 25, the periodic solution
 $\boldsymbol{q}_{p}^{0}$:
 $(\sqrt{\unicode[STIX]{x1D707}-\unicode[STIX]{x1D707}_{1}}\cos (\unicode[STIX]{x1D703}),\sqrt{\unicode[STIX]{x1D707}-\unicode[STIX]{x1D707}_{1}}\sin (\unicode[STIX]{x1D703}),0)$ for
 $\unicode[STIX]{x1D707}\geqslant \unicode[STIX]{x1D707}_{2}$ becomes unstable. A real multiplier
 $\unicode[STIX]{x1D706}$ crosses the unit cycle at
 $+1$. The Floquet exponent of this real multiplier is
 $\unicode[STIX]{x1D707}-\unicode[STIX]{x1D707}_{2}$, equal to the growth rate at the fixed point
 $\boldsymbol{q}_{s}^{0}$.
Floquet stability analysis of the periodic solution  $\boldsymbol{q}_{p}^{0}$ at different
 $\unicode[STIX]{x1D707}=$ (a) 1.95, (b) 2.0 and (c) 2.05.

The multipliers of the other two periodic solutions  $\boldsymbol{q}_{p}^{\pm }$: (
 $\sqrt{\unicode[STIX]{x1D707}-\unicode[STIX]{x1D707}_{1}}\cos (\unicode[STIX]{x1D703})$,
 $\sqrt{\unicode[STIX]{x1D707}-\unicode[STIX]{x1D707}_{1}}\sin (\unicode[STIX]{x1D703})$,
 $\pm \sqrt{\unicode[STIX]{x1D707}-\unicode[STIX]{x1D707}_{2}}$) are shown in figure 26(b). The Floquet exponent of the leading multiplier is
 $-2(\unicode[STIX]{x1D707}-\unicode[STIX]{x1D707}_{2})$, equal to the growth rate at the fixed point
 $\boldsymbol{q}_{s}^{\pm }$.
Floquet stability analysis of the periodic solutions  $\boldsymbol{q}_{p}^{0}$ (a) and
 $\boldsymbol{q}_{p}^{\pm }$ (b), at
 $\unicode[STIX]{x1D707}=2.05$.

As a consequence, if the additional degree of freedom  $z$, introduced by the pitchfork bifurcation, does not couple, at the onset of the bifurcation, to the primary degrees of freedom
 $x,y$ associated with the Hopf bifurcation (see § 3.5), then it is easy to understand that both the symmetric steady solution
 $(x_{s},y_{s},z_{s})\equiv (0,0,0)$ and the statistically symmetric periodic solution
 $(x_{c}(t+T),y_{c}(t+T),0)=(x_{c}(t),y_{c}(t),0)$,
 $T$ being the period of the limit cycle, will both undergo an instability with respect to the symmetry breaking provoked by the pitchfork bifurcation (
 $z\neq 0$). This simultaneous instability of both the symmetric fixed point and the statistically symmetric limit cycle looks like an instability of the subspace (
 $x,y$) with respect to the transverse direction
 $z$, associated with the active degree of freedom introduced by the pitchfork bifurcation.