I. INTRODUCTION
Titanium alloys are getting extensive applications in aerospace industry with excellent mechanical properties like low density, high specific strength, good corrosion resistance, and elevated service temperature. Reference Ezugwu and Wang1,Reference Wang, Guo, Wang, Peng, Zhao and Yao2 However, with the rapid development of aero-engines, higher requests for elevated-temperature strength and thermal-mechanical stability have been raised for working under extreme environment. Reference Ma, Zeng, Tian and Zhou3 Thus an increasing number of studies on high temperature titanium alloys have been performed, and BT25y alloy is one of the satisfying alloys.
The BT25y (Ti–6.5Al–2Sn–4Zr–4Mo–1W–0.2Si) was improved from BT25 alloy, which was developed by BHAM in the former Soviet Union. Reference Yang, Guo, Liang, Yao and Yuan4 Due to the addition of β eutectoid element tungsten and neutral element stannum, the alloy possesses qualified comprehensive mechanical properties at the working temperature of 550 °C. BT25y is an ideal heat-strength titanium alloy for manufacturing components in aero-engines and will get widely used in the aerospace field. However, the Russian BT25y alloy is seldom known in the west countries, public information concerning its high-temperature deformation behavior can almost not be found. Primarily, the BT25y alloy is a martensite α + β titanium alloy, which can be adopted to produce compressor disks with outstanding tensile strength and creep resistance at a high temperature of 550 °C. Reference Moiseyev5 In recent years, increasing attention has been paid to BT25y in China due to its potential for manufacturing dual-property blisk. Reference Wang, Zeng, Zhao, Lai and Zhou6 The dual-property blisk consisting of basket-weave structure in disc section and equiaxed structure in the blades is dramatically influenced by the deformation parameters like strain rate, deformation temperature, and strain. Reference Ma, Zeng, Tian, Sun and Zhou7 Thus, it is crucial to study the high-temperature deformation behavior and sensitivity of flow stress to different processing parameters.
The strain rate sensitivity exponent, temperature sensitivity exponent, and strain hardening exponent are commonly used to measure the sensitivity of flow stress to processing parameters during isothermal compression. Nan Reference Nan, Ning, Liang, Guo, Yao and Fu8 and Liang Reference Liang, Nan, Ning, Li, Zhang, Shi and Guo9 investigated the strain-rate sensitivity behavior of Ti–5Al–5Mo–5V–1Cr–1Fe alloy and observed that low strain rate and high temperature contributed to more obvious strain-rate sensitivity in hot deformation. Liu Reference Liu, Ning, Yang, Yao and Guo10 studied the effect of strain rate and temperature on the workability of FGH4096 superalloy. He pointed out that the temperature sensitivity exponent reached the maximum at a strain rate of 0.1 s−1, and the strain rate sensitivity exponent presented significantly variation at 1080 °C because of the dissolution of r′ phase. Luo Reference Luo and Li11 calculated the strain rate sensitivity and strain hardening exponent during the isothermal compression of Ti60 alloy. She concluded that the strain rate sensitivity exponent decreased with increasing strain rate, and the strain hardening exponent increased with increasing deformation temperature at strain rates of 0.001, 1, and 10 s−1. Lee Reference Lee, Lin, Chen and Hwang12 analyzed the effects of strain rate and temperature on mechanical behavior of Ti–15Mo–5Zr–3Al alloy, and found that the strain rate sensitivity exponent increased with added strain and strain rate, but decreased with elevated temperature. Chiou Reference Chiou, Tsai and Lee13 also got the same conclusion while researching on the impact mechanical response and microstructural evolution of Ti alloy under various temperatures. Lee and Lin Reference Lee and Lin14 studied the effect of deformation temperature on the strain hardening exponent of Ti–6Al–4V alloy, and observed that the strain hardening exponent dropped rapidly with elevated deformation temperature. However, no detailed expositions about the effect of processing parameters on the strain rate sensitivity, temperature sensitivity and strain hardening exponent of BT25y alloy were described in open literature. Therefore, investigations are necessary so as to figure out the deformation behavior during the hot compression of BT25y alloy.
The objective of this paper is to explore the high-temperature deformation behavior and reveal the flow stress sensitivity of BT25y alloy. Based on the stress–strain curves from isothermal compression, the variation rules of strain rate sensitivity, temperature sensitivity, and strain hardening exponent with deformation parameters were discussed, and detailed explanations were analyzed by microstructural evolution.
II. EXPERIMENTAL MATERIALS AND PROCEDURES
A. Sample preparation
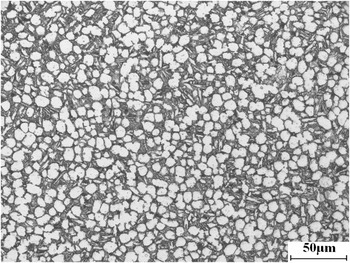
In this study, the as-received bar stock of BT25y alloy with a 270 mm diameter is used. The chemical composition is listed in Table I. Figure 1 presents the optical microstructure of original material. As shown in the figure, the microstructure is a typical equiaxed structure, consisting of 50% primary α phase with the average grain size of 7 um and transformed β with the secondary lamellar α thickness of 1.1 um.
Chemical composition of BT25y titanium alloy (mass fraction, %).

Microstructure of as-received BT25y titanium alloy.

B. Experimental procedures
The β phase transformation temperature (T β) of BT25y alloy was confirmed to be 983 °C by metallographic technique. Cylindrical specimens with the dimension of Φ 8 × 12 mm were machined from the forged bar. Compression direction of the specimens should be ensured parallel to the axis of initial BT25y bar. Isothermal compression tests were performed on a Gleeble-1500 thermo-simulation machine (DSI, St. Paul, Minnesota) at deformation temperatures of 880 °C, 910 °C, 940 °C, 960 °C, 980 °C, 1000 °C, and 1020 °C, and constant strain rates of 0.001 s−1, 0.01 s−1, 0.1 s−1, 1 s−1, and 10 s−1, respectively. The specimens were heated at a heating rate of 10 °C s−1 and soaked for 5 min prior to the deformation to obtain a uniform deformation temperature throughout the specimens. The specimens were all compressed by 60% of its original height. After hot compression, the specimens were water-quenched to room temperature instantly to preserve the high-temperature deformation microstructure. The load-stroke curves obtained from the compression tests were recorded automatically and converted into true stress–strain curves. The whole process of heating, heat preservation and hot deformation was protected by argon. To examine the microstructure, the specimens were axially sectioned, and the processed surfaces were polished and etched by a solution consisting of HF (3 mL) + HNO3 (6 mL) + H2O (91 mL). The microstructure observation was carried out on an Olympus PM3 optical microscope (Olympus Corporation, Tokyo, Japan).
III. RESULTS AND DISCUSSION
A. Flow behaviors
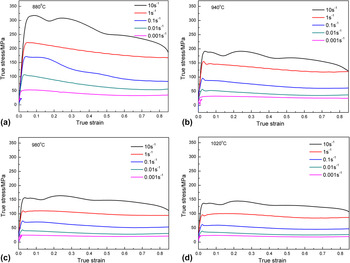
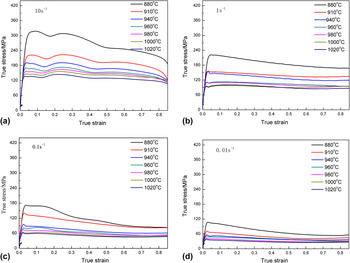
The high-temperature plastic deformation is accompanied by the competition between work hardening and flow softening. On the one hand, the continuous deformation induces dislocation multiplication and dislocation pile-up, which results in work hardening. On the other hand, flow softening gradually takes into effect due to the occurrence of dynamic recovery (DRV), dynamic recrystallization (DRX) and adiabatic temperature rise. Figures 2 and 3 present the true stress–strain curves of BT25y alloy at different deformation temperatures and strain rates. As shown in the figure, in the initial stage, the flow stress increases sharply and reaches the peak value at a very small strain (≤0.06). Later, the flow curves begin to drop and go into the transition stage. Work hardening plays a much significant role before reaching the peak stress so that the flow curves show a rapid upward trend. Once across the flow peak, the mechanisms of DRV and DRX gradually become dominant, thus the flow stress declines. As the deformation continues, the flow curves can be divided into two different types. When deformed under low temperature and high strain rate, the flow curves present flow softening phenomenon as the flow stress drops continually with further strain. Such flow characteristics may be attributed to deformation heating, flow instability, and microcracking during hot deformation. Reference Seshacharyulu, Medeiros, Frazier and Prasad15 At lower strain rate or high temperature, the flow curves tend to keep steady-state after the peak stress. Such steady-state curves suggest that the effect of work hardening is balanced by the flow softening mechanism with the occurrence of DRX, DRV, or superplasticity. Reference Jia, Zeng, Zhou, Liu and Wang16 Besides, flow oscillation can be observed at high strain rate on the true stress–strain curves for both α + β phase field and β single phase field.
The influence of strain rate on the true stress–strain curves of BT25y alloy at different deformation temperatures: (a) 880 °C; (b) 940 °C; (c) 980 °C; (d) 1020 °C.

The influence of temperature on the true stress–strain curves of BT25y alloy at different strain rates: (a) 10 s−1; (b) 1 s−1; (c) 0.1 s−1; (d) 0.01 s−1.

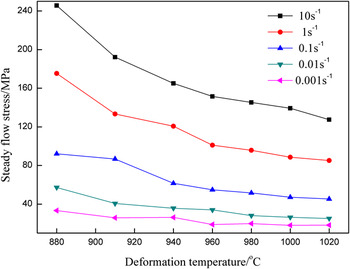
Figure 4 exhibits the influence of strain rate and deformation temperature on the steady-state stress. The plastic deformation reaches steady state at the strain of approximately 0.6, thus the flow stress of ε = 0.6 is considered as the steady stress in this study. Based on the figure, it can be concluded that the flow behavior is sensitive to strain rate and deformation temperature. The flow stress drops with increasing temperature and decreasing strain rate, because higher temperature and lower strain rate provide longer time for energy accumulation, more stored energy for dislocation annihilation and higher boundary mobility for DRX nucleation. Reference Lin and Chen17,Reference Lin, Chen and Zhang18 For constant deformation temperature and strain, dislocation proliferates rapidly and moves forward drastically at high strain rate. Thus, the mechanism of work hardening operates and flow stress increases rapidly. Besides, there is no enough time for complete DRV or DRX. So long as the strain rate and strain are fixed, the flow stress drops with elevated deformation temperature. Reasons for this phenomenon are as follows: firstly, the thermal activation energy of metals and average kinetic energy of atoms increase with elevated temperature, which can promote vigorous atom diffusion; secondly, the critical shear stress for plastic slip decreases, and more slip systems can participate in the deformation; finally, high stored energy at high temperature will contribute to the occurrence of softening mechanisms like DRV and DRX. Reference Cui, Yang, Sun, Li, Li and Shen19 However, when deformed at strain rate lower than 0.01 s−1, the effect of temperature on the steady stress becomes indistinct especially under higher temperature. Therefore, it is sufficient deformation time and stored energy for dynamic softening and microstructural evolution that result in dropping flow stress.
The effects of deformation temperature and strain rate on steady flow stress of BT25y alloy during isothermal compression.

B. Strain rate sensitivity exponent
It can be observed from Fig. 2 that strain rate has great influence on the flow stress of BT25y alloy. Rapid deformation at high strain rate induces severe dislocation multiplication and dislocation tangles, thus work hardening dominants and flow stress increases. The rapid dislocation propagation will lead to the increase of crystal defect and distortion energy, which can provide more nucleation site for DRX. Nevertheless, there is no adequate time for the diffusion of internal atoms and migration of grain boundaries, which restrains the growth of recrystallized grains. As the strain rate decreases, the stored energy can be released timely and the nucleation of recrystallized grains slows down. But it can provide enough time for the growth of recrystallized grains. Thus, a certain number of recrystallized grains can be observed at the trigeminal grain boundaries.
The strain rate sensitivity exponent (m) is generally adopted to estimate the tensile ductility of materials. Moreover, the m is related to the deformation mechanisms of metals.
Reference Lin and Dunne20
Thus, different methods have been used to measure m values.
Reference Wang and Fu21,Reference Ghosh22
There exists a mathematical relationship of
 $\sigma = C{\dot \varepsilon ^m}$
between applied stress and strain rate. A positive m value indicates that the flow stress will increase with ascending strain rate, and a negative one means that the flow stress will decrease with rising strain rate. The strain rate sensitivity exponent can also be used to characterize the superplasticity of metals.
Reference Hales, Holdsworth, O'Donnell, Perrin and Skelton23
Commonly, the m value for conventional metals belongs to 0.02–0.2, and that for superplastic metals is in the range of 0.3–0.9. Larger m value indicates that the flow stress is more sensitive to strain rate. The m can be expressed as follows
Reference Backfen, Turner and Avery24
:
 $$m = {\left. {{{\partial \ln \sigma } \over {\partial \ln \dot \varepsilon }}} \right|_{\varepsilon ,T}}\quad ,$$
where σ is the flow stress (MPa),
 $\dot \varepsilon$
is the strain rate (s−1), ε is the strain, and T is the absolute deformation temperature (K).
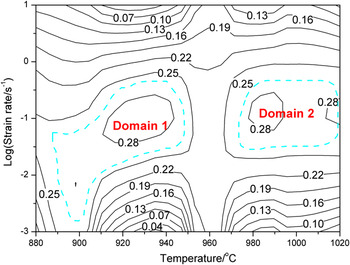
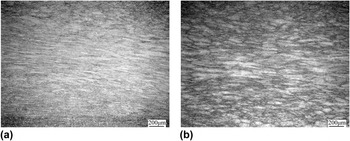
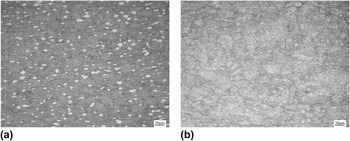
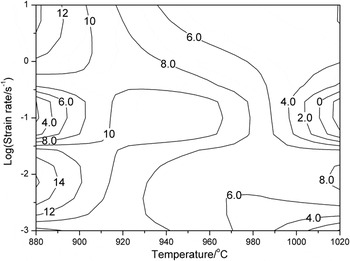
Figure 5 shows the effect of strain rate and temperature on the strain rate sensitivity at a strain of 0.6 during the isothermal compression of BT25y alloy. As can be seen from the figure, the m value presents an overall trend of first increase and then decrease with the strain rate, and gets the maximum value at strain rate of 0.1 s−1. There is a large domain exhibiting m values all above 0.2 in the strain rate range of 0.01–0.1 s−1. When deformed at higher strain rate, the dislocation density increases rapidly. The internal stress can not be released timely and results in stress concentration, which would lead to inhomogeneous deformation and flow localization, as shown in Fig. 6. On the contrary, it can provide enough time for atom diffusion and grain coarsening at lower strain rate, but excessively coarsened grains may cause deterioration of mechanical properties, especially plasticity of metals. It can be observed that the strain rate sensitivity contours in the map exhibit a distinctive change in their curvatures at the temperature of 960 °C, which is close to the phase-transition temperature of BT25y alloy. Furthermore, for the same strain rate, the m value varies a little when deformed under a series of deformation temperatures. Thus, it can be concluded that the effect of strain rate on m values is much more significant than that of temperature within deformation temperatures of 880–1020 °C and strain rates of 0.001–10 s−1. Besides, it can be observed that the region with large m values migrates slightly from the domain with lower strain rate in α + β phase field (≈0.01 s−1) to domain with higher strain rate (≈0.1 s−1) in β single-phase field. This phenomenon can be reasonably explained based on the interaction between strain rate and deformation temperature. When deformed at higher temperature, the diffusion activation energy and average kinetic energy increase, which will contribute to violent atom diffusion. Moreover, the thermal conversion under high temperature will provide enough energy for the functioning of flow softening and corresponding microstructural evolution, which can offset the effect of work hardening emerging in high strain-rate deformation. Typical microstructures corresponding to high m values are shown in Fig. 7. As can be seen, the microstructures all belong to bimodal structure. Besides, DRX has happened on the β matrix, and the grain boundaries of β grains are clearly visible.
Effect of strain rate and temperature on m values of BT25y alloy at strain of 0.6.

Microstructures with flow localization deformed at conditions of (a) 960 °C, 10 s−1; (b) 980 °C, 10 s−1.

Microstructures with high m values after hot deformation at conditions of (a) 940 °C, 0.1 s−1; (b) 980 °C, 0.1 s−1.

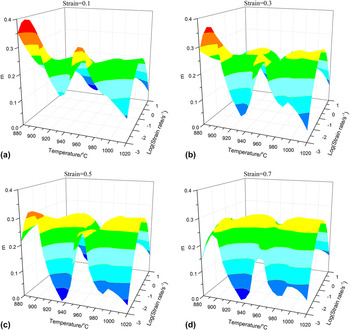
For constant deformation temperature and strain rate, the strain rate sensitivity exponent shows a rough tendency of decrease after the first rise with the strain, as shown in Fig. 8. The variation trend of m with strain is mainly controlled by three aspects Reference Luo, Li, Yu and Li25 : (i) work hardening resulted from dislocation pile-up and dislocation–dislocation interaction; (ii) flow softening induced by dislocation annihilation and dislocation offset; (iii) microstructural evolution. In the initial deformation stage, the dislocation propagates extensively under applied stress. The dislocation pile-up and dislocation tangles lead to smaller m values. As the deformation continues, the flow softening gradually takes the lead. When the strain increases to 0.6, the deformation reaches the steady state. The DRV and DRX have almost accomplished and most of the slip systems have been activated, thus the m gets higher values. Then, as the growth and coarsening of recrystallized grains, the m values present a downward trend. Actually, the m values are also associated with microstructural evolution. At beginning, the original grains get crushed and refined under applied stress, which results in large quantities of grain boundaries. As deformation continues, diffusion along the grain boundary enhances, thus the grain boundaries become much more sensitive to strain rate and lead to elevated m values. With further increase of strain, the occurrence of DRV, DRX, and grain coarsening results in weakened grain boundary diffusion, and the m values decrease. Therefore, it can be concluded that the macroscopic mechanical behavior and microstructural evolution can both affect the strain rate sensitivity of BT25y alloy.
The variation trend of m with deformation temperature and strain rate at different strains: (a) 0.1, (b) 0.3, (c) 0.5, and (d) 0.7.

C. Deformation temperature sensitivity exponent
Deformation temperature has an important effect on the flow stress of BT25y alloy. As Fig. 3 shows, the flow stress decreases with elevated temperature. As the temperature increases, the critical shear stress reduces, and more slip systems would participate in the deformation, thus the alloy can deform under smaller applied stress. Besides, the diffusion activation energy and average kinetic energy increase, which promotes the intense diffusion of internal atoms. Moreover, the relatively sufficient DRV and DRX can also help to reduce flow stress. The temperature-rise effect becomes much significant when deformed at higher strain rate. When deformed under the strain rate of 10 s−1, the steady stress of 880 °C is 53 MPa higher than that of 910 °C, and the steady stress at a high temperature of 1000 °C is 15 MPa higher than that of 1020 °C, which indicates that low temperature deformation under high strain rate has an obvious effect on the flow stress.
The plastic deformation behavior of titanium alloys is significantly affected by the deformation temperature. Reference Lei, Huang, Wang, Wang, Qin and Lu26–Reference Gong, Wang, Xia, Ge and Zhao29 The variation of microstructure characteristics including phase composition, phase distribution, grain size, and dislocation density has a great relationship with the deformation temperature. Reference Liu, Ning, Yang, Yao and Guo10 However, few literature about the temperature sensitivity of metals can be referred, especially for titanium alloys. The deformation temperature sensitivity exponent (s) is adopted to quantitatively characterize the sensitivity of flow stress to deformation temperature. Generally, s is expressed as follows Reference Li and Zhou30 :
 $$s = {\left. {{{\partial \ln \sigma } \over {\partial \left( {{1 \mathord{\left/ {\vphantom {1 T}} \right. \kern-\nulldelimiterspace} T}} \right)}}} \right|_{\varepsilon ,\dot \varepsilon }}\quad .$$
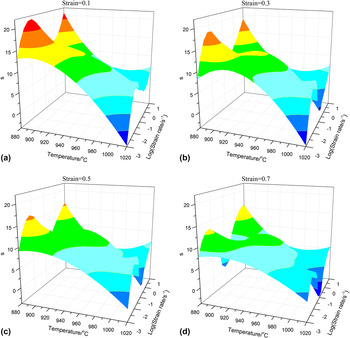
According to Eq. (2), the values of temperature sensitivity exponent under different deformation conditions can be determined. Figure 9 shows the variation map of temperature sensitivity exponent with deformation temperature and strain rate of BT25y alloy. The variation map can clearly shows the effect of deformation temperature and strain rate on s values. As can be seen from the figure, the s values decrease with increasing temperature when deformed at strain rates of 10 s−1, 1 s−1, and 0.01 s−1, and increase at strain rates of 0.1 s−1 and 0.001 s−1 in α + β phase field. Moreover, the s values increase with elevated temperature at strain rates of 10 s−1 and 0.01 s−1, and decrease at strain rates of 1 s−1, 0.1 s−1, and 0.001 s−1 in β phase field. In general, the s shows an overall dropping trend with elevated temperature once eliminating the influence of experimental fluctuation. Since high-temperature deformation can provide enough stored energy for DRV and DRX. Then, the surface free energy and average kinetic energy of atoms increase, which enhances the thermal activation and promotes the grain boundary sliding and atomic diffusion. Thus, the sensitivity of macroscopic deformation and microstructural evolution to temperature is reduced, and the s values decrease. Figure 9 also shows that the s tends to first increase, then decrease and finally increase with the strain rate at low temperatures of 880 °C, 910 °C in α + β two-phase field and 1000 °C, 1020 °C in β single-phase field. Nevertheless, the s presents a trend of decrease after a first rise with the strain rate at high temperatures of 940 °C, 960 °C, and 980 °C in two-phase field. However, strain has a minor influence on s values. The distribution form of s changes a little with varied strain. Only the values at two ends of the temperature range present slight fluctuation, as shown in Fig. 10.
Effect of strain rate and temperature on s values of BT25y alloy at strain of 0.6.

The variation trend of s with deformation temperature and strain rate at different strains: (a) 0.1, (b) 0.3, (c) 0.5, and (d) 0.7.

D. Strain hardening exponent
It can be observed from Figs. 2 and 3 that the flow stress increases rapidly at initial stage. Due to the dislocation propagation and dislocation–dislocation interaction under applied stress, the dislocation density increases rapidly and results in work hardening. But the accompanied flow softening caused by dislocation sliding and climbing can hardly balance the hardening effect. As a result, the flow stress increases quickly to the peak. After the peak stress, the flow softening mechanisms begin to take the dominant role. Moreover, the vacancy concentration increases with further deformation. The climb of edge dislocation and the cross-slip of screw dislocation are also involved in the plastic deformation. Thus the dislocation can overcome obstacles and move forward easily, and the true stress–strain curves tend to drop down. When the effects of work hardening and flow softening reach a dynamic balance, the deformation goes into the steady state.
The strain hardening exponent (n) controls the strain amount for uniform plastic deformation that the material can experience before strain localization, necking, and failure. Reference Ebrahimi and Pardis31 The n results from a balance between the strain hardening and flow softening mechanisms. Usually, the n value is calculated as follows Reference Holloman32 :
 $$n = {\left. {{{\partial \ln \sigma } \over {\partial \ln \varepsilon }}} \right|_{\dot \varepsilon ,T}}\quad .$$
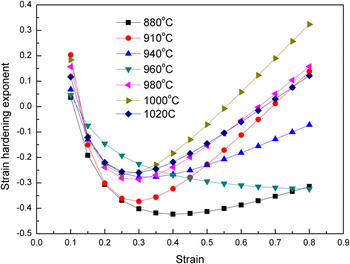
Figure 11 shows the variation trend of strain hardening exponent with strain at the strain rate of 0.01 s−1. The n values present a tendency of first decrease and then increase with the strain. This is because dislocation multiplication rate is in direct proportion to ρ1/2, and dislocation annihilation rate is proportional to ρ. Reference Luo, Li, Yu and Li25 Hence, flow softening mechanism gradually plays the dominant role at strain of 0.1–0.3. As the strain increases further, the relation between flow softening and work hardening tends to achieve the dynamic balance again. As can be seen from the figure, the n value presents a roughly increased tendency with elevated deformation temperature. According to the hot deformation behavior, the softening effect in β single-phase field is lower than that in α + β phase field, as Fig. 3 shows. Basically, the strain hardening originates from the dynamic competition between work hardening and flow softening. Reference Stüwe and Les33 Therefore, the decrease in softening effect at high temperatures leads to increased n values of BT25y alloy. Besides, predominant softening effect at small strains results in negative n values for lower temperatures. Reference Luo and Li11
Effect of strain on the strain hardening exponent of BT25y alloy at strain rate of 0.01 s−1.

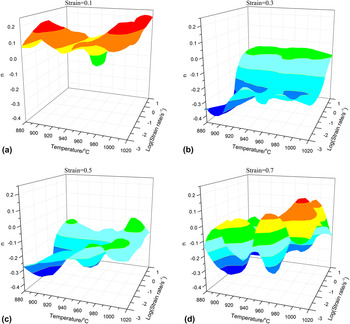
Figure 12 presents the variation maps of strain hardening exponent with deformation temperature and strain rate at different strains. There exist quite major differences among the distribution of n values for various strains. As shown in the figure, most of n values are positive at a small strain of 0.1, and the negative values are distributed in the area of 960–980 °C/0.1–0.01 s−1. At initial deformation stage, the crystal slip occurs and the dislocation density increases rapidly, thus work hardening takes into effect and results in high n values. However, when deformed at the condition of 960–980 °C/0.1–0.01 s−1, the corresponding microstructure is bimodal structure, which possesses excellent machining performance. Besides, deformation at lower strain rate avoids the rapid progress of dislocation multiplication, thus the softening mechanism quickly takes the lead and results in negative n values. As the deformation continues, the distribution of n values gradually becomes consistent. Large positive n values lie in areas with high strain rates because deformation in these conditions can contribute to dislocation proliferation and dislocation pile-up, which enhances the work hardening and leads to large n values. Nevertheless, small negative n values are located in areas with lower temperature and small strain rate. Since there are large amounts of initial equiaxed α in the microstructure after deforming at lower temperature in α + β phase field and small strain rate, and the equiaxial phase is beneficial for the coordinate deformation and plastic slip, the effect of work hardening is weakened and the softening mechanism dominates.
The variation trend of n with deformation temperature and strain rate at different strains: (a) 0.1, (b) 0.3, (c) 0.5, and (d) 0.7.

E. Microstructural evolution
The high-temperature plastic deformation can make a change to both the macroscopic morphology and microstructural evolution, which has a significant effect on the mechanical properties. On one hand, the composition, volume, morphology of precipitated phases and grains will be influenced by the external heat input and internal stress field. On the other hand, a single grain can be affected by its neighboring grains. Under the combined influence of external conditions and internal factors, the microstructure is bound to present characteristics with certain regular variation.
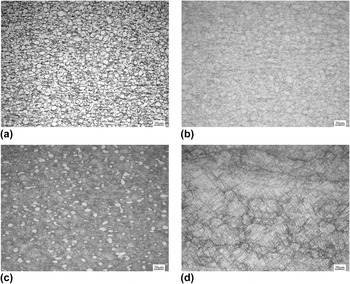
Figure 13 shows the microstructures corresponding to different temperatures and the same strain rate of 0.1 s−1. With the increase of deformation temperature, the phase transformation of α → β happens and the content of primary equiaxial α gradually reduces. Besides, the secondary lamellar α appears when deformed near the phase transition temperature. When deformed under the temperature of 880 °C, large amounts of equiaxed α with different grain sizes can be observed in the microstructure. The primary α gets coarsened and the equiaxial degree decreases. A small amount of strip α distributes on the local region of β matrix. Since the distortion accumulation can easily satisfy the requirement for recrystallization nucleation, small recrystallized grains appear at the triangle grain boundary. Besides, subgrain boundary within primary α grains can be observed, which indicates the activation of subgrain nucleation mechanism. The microstructure characteristics of 910 °C are almost the same with those of 880 °C. Nevertheless, the content of equiaxed α phase reduces and the primary α gets coarsened further. Small recrystallized grains can be observed on the β matrix, indicating that the mechanism of DRX works under this deformation condition. The microstructure of 960 °C is composed of small amounts of initial equiaxed α and transformed β, which is called the bimodal structure. The primary α presents a slight elongated characteristic. Besides, a considerable amount of small equiaxed grains can be observed distributing at the triangle grain boundary of β grains. Secondary lamellar α phase forms during the cooling process after plastic deformation, and precipitates from the β matrix. When deformed at a high temperature of 1020 °C in β single field, the primary equiaxed α has completely disappeared and the grain boundary of transformed β is clearly visible. Large amounts of cross-cutting secondary α within β grains constitute the Widmanstatten structure. Since the tested specimen was water-quenched instantly after high temperature deformation, the secondary α grain presents slender needle-like appearance.
The microstructures of BT25y alloy at different temperatures (0.1 s−1): (a) 880 °C; (b) 910 °C; (c) 960 °C; (d) 1000 °C.

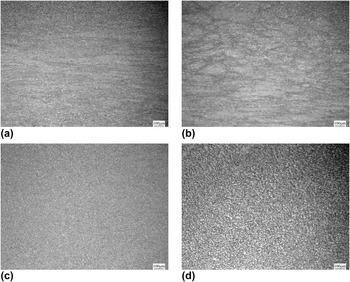
Figure 14 shows the microstructures corresponding to different strain rates and the same temperature of 960 °C. As can be seen from the figure, with the increase of strain rate, the content of initial equiaxed α gradually reduces and the volume fraction of transformed β with different grain size increases. Since the deformation heat effect is much significant at a high strain rate of 10 s−1, there is only less primary α distributing in the upper and lower parts of the specimen. Reference Ma, Zeng, Tian, Zhou and Sun34 The β grains are seriously elongated in large deformation zone. In addition, adiabatic shear band can be observed in the microstructure. The microstructure characteristics of 1 s−1 are almost the same with those of 10 s−1. Besides, small recrystallized grains can be observed at the trigeminal grain boundaries, suggesting that the mechanism of DRX has taken into effect. There exist quantities of initial equiaxed α with relatively uniform grain size and homogeneous distribution in the microstructure of 0.1 s−1. The DRX has occurred on the β matrix and the grain boundaries of transformed β are clearly visible. The secondary lamellar α distributed on the matrix can not be intertwined yet. When deformed at lower strain rate of 0.01 s−1, large amounts of primary equiaxed α distribute in the microstructure. Besides, small recrystallized β grains at the grain boundary indicate that the DRX mechanism plays an important role.
The microstructures of BT25y alloy at different strain rates (960 °C): (a) 10 s−1; (b) 1 s−1; (c) 0.1 s−1; (d) 0.01 s−1.

IV. CONCLUSIONS
The high-temperature plastic deformation behavior and microstructural evolution of BT25y alloy in isothermal compression were analyzed. The strain rate sensitivity, deformation temperature sensitivity, and strain hardening exponent were discussed from the point of dynamics. Some main conclusions are as follows:
-
(1) The flow stress of BT25y alloy is sensitive to deformation parameters. Typical features of work hardening at small strains and flow softening after the peak stresses appear at all flow curves. Flow oscillation at high strain rate indicates the occurrence of flow instability.
-
(2) The flow stress is very sensitive to strain rate. The strain rate sensitivity exponent tends to first increase and then decrease with the strain rate, and reaches the maximum value at strain rate of 0.1 s−1. There is a large temperature range exhibiting m values all above 0.2 at strain rates of 0.01–0.1 s−1. The region with large m values migrates from the domain with lower strain rate in α + β phase field (≈0.01 s−1) to domain with higher strain rate (≈0.1 s−1) in β phase field.
-
(3) Deformation temperature has significant effect on the flow stress. The temperature sensitivity exponent shows an overall dropping trend with elevated temperature. The s tends to first increase, then decrease, and finally increase with the strain rate at lower temperatures in α + β phase field and β phase field. Besides, it presents a downward trend after a first rise at higher temperatures in two-phase field. Strain has a minor influence on the temperature sensitivity.
-
(4) There exist quite major differences among the distribution of strain hardening exponent at different strains. Due to the dynamic competition between work hardening and flow softening, the n first decreases and then increases with the strain for all studied temperatures at a strain rate of 0.01 s−1. Large positive n values lie in areas with high strain rate, and small negative n values are mainly located in areas with lower temperature and small strain rate.
ACKNOWLEDGMENT
This study was financially supported by the National Natural Science Foundation of China (No. 51205319).