Introduction
African Americans have lived in Hartford, Connecticut, since colonial times. In the early nineteenth century Hartford's African Americans comprised a small part of the city's population during a time period when Hartford became a center of the Abolitionist movement and the home of Harriet Beecher Stowe, author of Uncle Tom's Cabin. Hartford, Connecticut's capital, prospered during the period between the Civil War and World War I; the city became the center of the country's insurance and munitions industries.
Until the beginning of the twentieth century, African Americans remained a small segment of the city's overall population. From 42,015 residents in 1880, the city's population increased to 98,915 by 1910 and to 164,072 by 1930. African Americans totaled 1,399 residents in the 1880 Census, less than 2 percent of overall population, and 1,812 in 1910, again only a small fraction of the total population (1.8 percent). Most of the African American migrants before 1910 came from Virginia. Between 1910 and 1930, Hartford's overall population grew substantially and the city also experienced a dramatic increase in the number of African American residents. The increase in the African American population was part of the first wave of the “Great Migration” of African Americans from the South to the northern and midwestern cities.
The Great Migration and Hartford
The Great Migration of African Americans from the rural south to the urban north is one of the key chapters in American urban history in the twentieth century. Beginning at the turn of the twentieth century, African Americans, in ever-increasing numbers began to leave the American South and move to the North and Midwest. Overwhelmingly, their destinations were the cities, including Hartford, Connecticut. The great migration continued after World War II and constituted a biblical exodus of millions of African Americans from the South. While some have described the exodus as a search for a “promised land,” in the northern cities many encountered racism, discrimination, and residential segregation that created inner-city ghettos in every city including Hartford (Lemann Reference Lemann1992; Wilkerson Reference Wilkerson2011).Footnote 1
Scholars who study the urban experience of African Americans migrants tend to utilize a biracial lens that views African Americans as one undifferentiated racial group. This view, while useful for many purposes, ignores the internal complexity that characterizes all racial and ethnic groups including the African American residents of Hartford, past and present. A more complete picture can be obtained by examining the differences among African Americans in Hartford by place of birth, socioeconomic status, and political participation. Most importantly residential patterns also illustrate complex, intraracial patterns within the African American community that emerged, even as residential segregation in Hartford intensified and a ghetto formed in the North End.
The arrival of large numbers of migrants from Georgia and other southern states created tensions within the black community. Just as with new immigrants from eastern and southern Europe in the 1900s, the migrants from Georgia differed from the long-standing black population of Hartford, whose roots in Hartford went back to pre-Revolutionary times. The newly arrived Georgians, many of whom first traveled to the Hartford region to work in the tobacco fields, were poor and uneducated.
In 1921 the National Urban League conducted a major study of the African American population in Hartford led by the sociologist Charles S. Johnson, who later served as the first black president of Fisk University. Johnson described the intraracial tension between the older Hartford residents and new migrants from the South:
The older Hartford Negro residents fearing a restriction of the privileges which they supposed were theirs became insistent on the cultural differences between themselves and the Negroes of the South. They refused to be seen in their company and avoided places where they were likely to be encountered . . . were quick to call attention to this distinction, and to emphasize their difference and advantage in culture and schooling. (Johnson Reference Johnson1921: 40)
As a direct consequence of the Great Migration significant differences emerged within the black community in terms of socioeconomic status, civic participation, and, most importantly, residential location. In turn these differences contributed to the tension described by Johnson.
The classic study of African American migration at the neighborhood level is W. E. B. Du Bois, The Philadelphia Negro: A Social Study (Du Bois Reference DuBois1899). Du Bois focused on the 7th Ward, where one in five African Americans in Philadelphia lived in 1897. His methodology included a door-to-door census of the black population. Detailed street maps identify the spatial location of both the African American and white residents in the ward. Du Bois also analyzed the place of birth of the 9,675 African Americans surveyed and distinguished between the “native” and “immigrants” within the black population. In 1897, 38.6 percent of the Ward 7 blacks were born in either Philadelphia or Pennsylvania and were part of the “native” African American population while 21.7 percent were migrants from Virginia and 15 percent were from Maryland. An additional 10.1 percent were born in other southern states and to use Du Bois's terminology were “immigrants.”
Du Bois pointed to the tension between the new migrants from the South: “as a whole, it is true that the average of culture and wealth and social efficiency is far lower among immigrants [southern born] than natives, and that this gives rise to the gravest of the Negro problems” (Reference DuBois1899: 80). In Ward 7 there was also residential clustering of the Southern migrants along Tenth and Juniper streets because of both steering and discrimination. “Even when the new migrants seek better districts, their low standard of living and careless appearance make them unwelcome to the better class of blacks and to the great mass of whites. They find themselves hemmed in” (Reference DuBoisibid.: 56–57). Du Bois compared the southern migrants to “illiterate foreigners to this country” (Reference DuBoisibid.: 82).
Hiller (Reference Hiller2005) and a research team at the University of Pennsylvania have recreated Du Bois's study using his original data from the archives at the university and a geographical information system (GIS) to create digital historical maps of the 7th Ward (www.mappingdubois.org). The digital maps replicate Du Bois's original maps and further illustrate racial segregation at the block and building. For example on Addison Street between 19th and 17th avenues, almost all of the residential buildings are occupied by African Americans while two blocks away on Delancy Place all of the residents are white. Hiller also created a database of all residents in the 7th Ward based on the 1900 Census and then aggregated the African American residents by residential building. This analysis illustrates the intraracial residential clustering of southern migrants on certain blocks and residential buildings in Philadelphia in 1900 and is an important extension of Du Bois's work.
Hunter's recent work, Black Citymakers: How the Philadelphia Negro Changed Urban America, builds on Du Bois's groundbreaking study and uses Ward 7 as a setting to study the “political agency of black Philadelphians” to explain urban change during the twentieth century (Hunter Reference Hunter2013: 16). Hunter views migration as a manifestation of agency and describes the area in Ward 7 south of Lombard Street as “a distinctive black enclave . . . in many ways a city within a city” (Reference Hunteribid.: 10, emphasis added). In Chapter 2 Hunter examines the rise and fall of black banks in Ward 7 during the Great Migration and points out the impact of black migrants from the South and the tension that ensued: “with a high concentration of poverty due to the influx of southern black migrants who replaced long-time black residents” (Reference Hunteribid.: 16). Long-time black Philadelphians responded to the migration from the South by leaving Ward 7 and moving to other areas of the city and “drawing new boundaries of racial geography” in Philadelphia, new intraracial boundaries.
In the Hartford region there was need was for agricultural laborers. Farmland in the Connecticut River valley surrounding Hartford provides some of the best soil in the country for growing leaf tobacco used in the manufacture of cigars.Footnote 2 During the Civil War, Hartford industry expanded—especially the manufacture of hand guns (Colt) and rifles (Sharpe). Armament production continued for decades after the war, as did precision manufacturing. With the approach of World War I the armament industry in Hartford struggled to fill huge orders, which dramatically increased labor needs. The relatively high wages and job security offered by the arms manufacturers enticed European immigrant laborers working on the tobacco plantations (Hartford Courant 1916b).
With workers leaving for the factories in Hartford, tobacco plantation owners turned to the South, recruiting African Americans particularly from Americus, Georgia, and the surrounding Sumter County.Footnote 3 This practice set in motion a pattern of “chain migration” from Georgia to the Hartford region that mirrored the chain migration of European immigrants, primarily Eastern Europeans to Hartford, in the same time period, from the 1890s to the 1920s.
Importantly, migrants from the South working in the tobacco fields often stayed for only a short time. As Lewis (Reference Lewis1999) explains, “Many permanent migrants found the conditions unacceptable on the plantations and moved to the city of Hartford in search of a more vibrant black community, better jobs, and more freedom” (53). Many migrants found conditions in the city of Hartford were far more favorable than those on the tobacco plantations. Nevertheless the new migrants, especially those from Georgia, faced discrimination from two sources. In Lewis's words, “They faced racial discrimination from Hartford's white residents and class discrimination within the black community” (Reference Lewisibid.).
Methodology
To build a data base of the African American residents of Hartford in 1910, 1920, and 1930, the decennial manuscript census records were used, available on Ancestry.com. Each page, in each enumeration district was examined. The census data for all individuals whose race was coded as “B” for African American or “M” for mixed race was entered into an SPSS database. All of the demographic variables, from each census, were included along with the street address of the household in which the African American resident lived. The variables were coded using the coding scheme developed for the Integrated Public Use Microdata Series (IPUMS) and North Atlantic Population Project (NAPP) projects by the Minnesota Population Center (Ruggles and Sobeck Reference Ruggles and Sobek1995). For Bellevue Street in the North End, the census records for all of the white residents living on the street in1920 and 1930 were added.
Every effort was made to include all of the African American residents of Hartford enumerated in each census. For each census the published records include counts by race for each political ward in Hartford and each enumeration district is coded by ward. The published counts of African Americans by ward were compared with the number of African Americans identified and entered into the databases from the manuscript records for each ward. In some wards the published numbers were slightly higher. There are manuscript pages that are blurred and cannot be read or no race is coded, which would explain the undercount.
In order to geocode the residential addresses, two historical digital street GIS maps of Hartford were created. The digital maps started with a contemporary digital Hartford street map. Street by street the modern map was compared with historical street maps (Elihu Geer Sons 1920). Streets that did not exist in 1910 or 1920 were eliminated and streets that did exist in1910 and 1920, and no longer do, were added back onto the digital map.Footnote 4 A further step involved changing the street addresses to follow the address range on each city block in 1910 or 1920. Hartford city directories for the time period include listings of each street and the addresses between each cross street and were used to update the GIS street ranges prior to geocoding (Schlichting, Tuckel, and Maisel Reference Schlichting, Tuckel and Maisel2006).
The US Post Office changed the street numbers in Hartford between 1910 and 1920, which necessitated the need to build two historical digital maps, one to geocode the records from the 1910 Census and the second for the 1920 and 1930 censuses. With the two historical digital maps, African American residents from each census could be geocoded to their geographical place of residence (see note 2 and Schlichting et al. Reference Schlichting, Tuckel and Maisel2006).
In a small number of cases, there was no street number for the household or the street name, written horizontally along the left margin of the manuscript page, was missing or not legible. City directories were used to look up individuals without a street number or street address and the address added if it was clear the city directory record matched to the census record. A limitation of the city directories is they usually include only the name of the head of household and do not include spouse, children, lodgers, or boarders. In addition, some of the street numbers listed did not correspond to the street address ranges in the city directories.
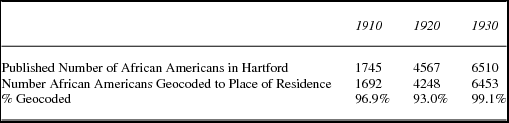
Table 1 compares the published census total of African American residents with the final number of African Americans geocoded to their place of residence for the 1910, 1920, and 1930 censuses.
1910 – 1920 – 1930 census number of African Americans report in census, number geocoded to place of residence

Differentiation within the African American Community—Place of Birth
In 1910 as the Great Migration began, half of the African American residents of Hartford had been born in Connecticut. Another 11 percent were born in New York, New Jersey, and Massachusetts. Overwhelmingly, the Connecticut born had parents who were both also born in Connecticut corresponding to the “native born, native parents” category used in studies of European immigration during the same time period.
The Connecticut-born African Americans represented the long-established community of black residents who had resided in Hartford before the Great Migration. An article in the Hartford Courant in 1915 describes at length long-time black residents who had achieved a modicum of success working as servants, messengers, and janitors. The title “The Colored People Who Live in Hartford” included the comment that the African Americans “have been and are a peaceful and orderly contingent, industrious and a credit to the city in which they live” (Hartford Courant 1915). Pictures of prominent individuals list their occupations including two pastors along with Henry Champion, “twenty-five years in the service of Mrs. Samuel Colt.” Many of the individuals featured in the article also owned property, including rental apartments.
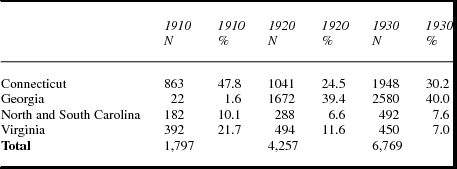
As the Great Migration continued the composition of the African American population changed. In 1910, among the African American residents born in the South, only 22 had migrated from Georgia. Virginia migrants comprised the significant subgroup in 1910. By 1920 the Connecticut-born portion of the African Americans declined to 24.5 percent and migrants born in Georgia represented almost 40 percent of Hartford's black population (table 2).
Hartford: African American population by state of birth, 1910–1930

Differentiation within the African American Community—Socioeconomic Status
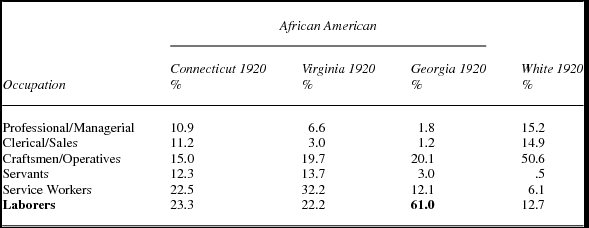
African Americans overall had significantly lower occupation status than whites. In 1920, more than 15 percent of the white workforce held professional or managerial positions and 50 percent worked as craftsmen or operatives comprising most of the industrial workforce. Very few whites worked as service workers and almost none as domestic servants (table 2).
By contrast, African Americans worked as service workers, servants, and laborers at the low end of the occupational scale and earned wages far below those of white workers, especially those who worked in the skilled trades and the more highly paid factory jobs. Less than 20 percent of African American heads of household worked as craftsmen or operatives in the factories earning higher wages.
Among the African Americans in the Hartford workforce in 1920, Connecticut-born African Americans had a higher percentage of professional and managerial workers and those employed in clerical or sales positions than did migrants from either Virginia or Georgia. More than a third of the Connecticut born worked as servants or service workers as the Hartford Courant article in 1915 emphasized. Among the Virginian born almost half, in 1920, worked as servants and service workers. Few Georgian born worked in professional or managerial jobs and even fewer in clerical or sales positions. In 1920 the number of Georgian migrants working as servants or service workers was significantly less than both the Connecticut and Virginian born. In 1920 the migrants from Georgia worked as laborers, the lowest occupation category in terms of status, skill, and income (table 3).Footnote 5
Hartford: African American subgroups: Occupation status by place of birth—male

The reason blacks had lower occupational status was straightforward. Overall blacks faced discrimination in finding employment in Hartford's burgeoning factories and therefore had to work in service occupations, as domestic servants or laborers. The Urban League study documented the difficulties African Americans encountered in trying to secure jobs in Hartford's factories, even during World War I, when demand for labor in the armament factories soared. Prevented from working in the factories, black workers competed among themselves for service and laborer jobs and a three-tier system emerged. Whites worked as professionals, clericals and sales, and skilled factory operatives. The more established Virginian- and Connecticut-born African Americans worked as domestic servants and in service employment, while the recently arrived African American migrants from Georgia occupied the lowest rung of the occupational structure working as low-paid laborers.
The Urban League study detailed the employment discrimination faced by the southern migrants from Georgia. Even skilled workers from the South were assumed to be from in Hartford: “so evident is that employers have frequently classified good southern workers as Hartford men and inefficient Hartford men as southerners” (Johnson Reference Johnson1921: 134). The report referred to articles in the newspaper describing the southern migrant workers in derogatory terms: “the press called attention to their crudities and plantation manners. They had, many of them, habits formed in the South that were intolerable to northern employers” (Johnson Reference Johnson1921: 135). In Hartford these perceptions were shared by the major manufacturing companies (Colt Firearms, Pratt and Whitney, Underwood Typewriters) that paid the highest wages and also trained workers for skilled and semiskilled factory work.
Blacks as a whole were also underrepresented as home owners in 1920. Only 5.1 percent owned their homes, compared to 23 percent for whites. Although the overall level of home ownership among blacks as a group was low, there were still noticeable disparities within the black community based on place of birth. Approximately 10 percent of African Americans who were born in either Connecticut or Virginia owned their own homes, compared to less than 1 percent from Georgia.Footnote 6 The migrants from Georgia arrived with few financial resources. The Georgians arriving in Hartford between 1910 and 1920 did not find jobs that paid well and most could only afford to rent. A significant number of the longer-established black residents of Hartford, especially those born in Connecticut, did own homes although the home ownership rate, even among the Connecticut born, was less than half that of the white population.
Differences between the two racial groups and within African American subgroups also existed with respect to housing density. More white than black households occupied single-family dwellings (31.3 percent vs. 17.8 percent) reflecting the higher level of home ownership among white residents. Contrary to expectations, though, a greater proportion of white than black heads of households also occupied dwelling units with four or more households (32 percent vs. 28.8 percent). An analysis of the census data for whites revealed that a disproportionately large number of these multiple-household dwellings were inhabited by the foreign born. Within the African American community, socioeconomic divisions persisted with respect to housing density. Georgian households were more likely to live in crowded conditions. A Hartford Chamber of Commerce committee formed in 1917 to deal with housing conditions reported: “the newcomers [from Georgia] have been forced to pay high rents for poor accommodations and that they are at the present time obligated to live in such congestion as to be a menace to the health of the city” (Hartford Courant 1917b).
A further divide between the Georgians, Virginians, and Connecticut born was reflected in the African American churches. A 1938 study of the African American population by Samuel Jenkins included an analysis of the African American churches in Hartford for the decade between 1926 and 1936. The number of African American churches increased from seven in 1926 to 14 in 1936 in direct response to migration from the South. The migrants from Georgia in particular where not welcome in the established black churches:
One reason for this growth [number of churches] is the attitude of the first churches [established African American churches]. These did not receive the newcomer with open arms. They were informed by some of the church officials that because of their intellectual background they would not be happy nor would they be welcome in some of the original churches. (Jenkins Reference Jenkins1938: 65)
The Georgian migrants responded by establishing their own church on Bellevue Street and asked their former pastor in Americus, Georgia, the Reverend G. W. Thompson, to move to Hartford and “watch over his Georgia flock in a Connecticut city,” which he did (Jenkins Reference Jenkins1938: 59).
The Urban League study, conducted a decade earlier, also studied the new churches and described them as “transplanted Southern churches made up almost entirely of migrants from the South” with comparatively large congregations, in some cases, compared to the established churches (Johnson Reference Johnson1921: 140). The Mount Olive Baptist Church on Bellevue had 370 members in 1921 and only one of the four “older churches,” Union Baptist, had more members: 658. The report added that the only reason the Mount Olive Church did not have as large a membership as the Union Baptist was that the church on Bellevue Street was a converted residential dwelling and “is filled to capacity at every meeting.” The intraracial hostility between the established African American community and the new migrants from Georgia led to the establishment of separate congregations delineated by place of birth.
Differentiation within the African American Community—Voting
During the Great Migration African Americans escaped from the pervasive racism of the South, which included complete disenfranchisement from the political process. Throughout the southern states the Jim Crow laws excluded blacks from the political process including the fundamental right to vote. Almost all African Americans living in Georgia were barred from voting by the state's Jim Crow laws, enforced by fear, intimidation, and violence. Redding and James (Reference Redding and James2001) estimate that 2 percent of the eligible African Americans in Georgia voted in the 1912 presidential election versus 42 percent in 1880. Moving north offered an opportunity to participate in the political process for the first time in their lives. Despite the absence of Jim Crow laws in the North, Georgians still faced challenges. One of the eventual consequences of the migration of African Americans out of the South was to change the electoral politics of the North and especially the northern cities.
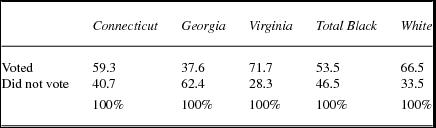
By 1920, in Hartford, a significant number of recent migrants from the South joined the substantial number of native-born African Americans registered to vote in the 1920 general election.Footnote 7 Overall, 53 percent of the eligible African American men voted in the election as compared with 67 percent of registered white males (City of Hartford 1920). Among black registered voters there were significant differences in voting by place of birth. Connecticut- and Virginian-born African Americans voted at comparatively high rates. In fact, 71.7 percent of blacks born in Virginia voted, the highest rate among any subgroup and significantly higher than among white eligible voters. Far fewer eligible black voters from Georgia voted. The turnout among the Georgian born was substantially lower than any other group within the African American population (table 4).
Hartford: Voter turnout of African Americans males—1920 general election by place of birth

Differentiation within the African American Community—Residential Patterns
By 1917 civic leaders recognized the impact of the migration to Hartford from Georgia on housing and belatedly admitted that the new migrants faced overt housing discrimination. An article in the Hartford Courant headlined: “Many Agents Refused to Rent to Negroes” (Hartford Courant 1917a). Johnson unambiguously presented the underlying fact faced by all African Americans living in Hartford:
With Negroes it is different. Where their communities are established they remain. Public sentiment never changes with regard to them. They are recognizable by their color. They begin and end in isolation. . .. This confinement to certain neighborhoods is aided both by pressure from without which restrains them as undesirable in “white neighborhoods.” . . . They must be located where Negroes are permitted to live. (Johnson Reference Johnson1921: 53)
The Urban League study investigated housing conditions and reported that African Americans faced limited choices, forced to rent in just a few neighborhoods in Hartford. These neighborhoods were characterized as those with often the worst housing in the city. A “Slum Clearance Housing Study” conducted during the Depression in 1933 mapped the neighborhoods with the most dilapidated housing. The worst housing, located in the North End of the city, was home to the highest concentration of migrants from Georgia (Slum Clearance Study Committee 1934).
In addition to overall discrimination faced by all black residents in the 1920s, complex residential patterns within the African American community emerged. As part of the Urban League study Johnson and his staff mapped six neighborhoods where African Americans lived including part of the North End adjacent to the railroad yards. The report included stark characterizations of the different neighborhoods:
There was a section (District 5 – North End) . . . in which roughly speaking, the residue of the city's Negroes lived after the more progressive had moved out. . .. Here the great bulk of crude Southern Laborers with their families lived alongside the hundreds of floaters and ne’er-do-wells, many of whom were also from the South. . .. The fourth grouping (District 1) seemed one of like economic status rather than one of common locality. These were the more conspicuously successful, the more exclusive and, incidentally, the more self-conscious on the question of color. . .. They form a social set so to speak. (Johnson Reference Johnson1921: 15)
A commonly used measure of segregation is the Dissimilarity Index, which uses geographical units (e.g., wards or census tracts) and aggregate population data to calculate an index score from 0 percent to 100 percent (Lieberson Reference Lieberson1963). An index score of 100 means total segregation while a score of 0 means that in each geographical unit the ethnic/racial composition mirrors that of the city as a whole.
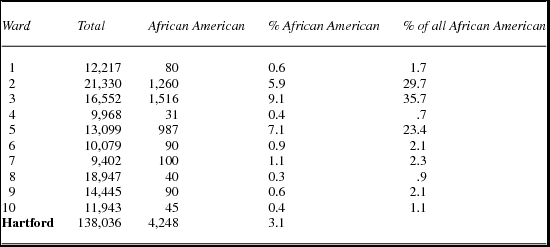
Table 5 examines the distribution of the 1920 African American population by ward. The Dissimilarity Index for 1920 is 53.8; more than half of the black residents of Hartford in 1920 would have to move in order for 3.1 percent of the population in each of the 10 wards in the city to be African American. By 1920 as a whole, blacks were spatially isolated from whites to a substantial degree.
Hartford, Connecticut—1920 Population Data by Ward

The Dissimilarity Index, though based on aggregate data at the ward level, may seriously underestimate the degree of racial segregation in Hartford in 1920. More than one-third of the black population (1,516—35.7 percent) resided in Ward 3 in the North End where they constituted 9.1 percent of the total population.
Figure 1 displays the geocoded residential location of each African American household in 1910 and 1930. In 1910 there was a concentration of African Americans living in the central business district along the Connecticut River. To the west, near Farmington Avenue in Ward 10, was the most affluent area in Hartford and home to Mark Twain and Harriet Beecher in the 1880s. Here the African American residents were domestic servants living with affluent white families.
Hartford: African-American Households – 1910 and 1930.

By contrast, in 1930 there were only a few households near the central business district and the African Americans were now concentrated in the North End. A large segment of the African American population resided in the northeastern portion of Hartford adjacent to the rail yards of the New York, New Haven, and Hartford Railroad (Wards 2, 3, and 5). Between 1910 and 1930 the black population of Hartford became increasingly segregated.
Figure 1 illustrates the changing patterns of the spatial location of African Americans during the Great Migration. Previously the only published data available was at the political ward level, which identifies the wards in 1910 and 1930 that African Americans were concentrated in—but provides no indication of how spread out or spatially concentrated the population was within the wards. For example in North End Ward 3, in 1930, there are two distinct African American residential concentrations: one along Capen Street in the center and the second to the east adjacent to the railroad yards, on Bellevue and Wooster streets. Before the availability of GIS analysis at the street level, studies of historic residence patterns relied on aggregate census data at the political ward level that mask important residential patterns on a street by street basis as Capen, Bellevue, and Wooster streets in the North End illustrate.
Residential Clustering within the African American Community
One major source of tension in the African American community involved the search for available and affordable housing. For many Georgian migrants working conditions on the tobacco plantations, while significantly better than those in Georgia, still required long hours in the fields. Many did not stay after their initial contracts ended and they moved to Hartford, the closest city and one with an established African American community. Once they arrived they found the only work available—as laborers (61 percent; see table 2)—earning a low wage. Forced by both discrimination and economic pressures, the Georgians competed for housing with the more established African American residents. They had to live in the worst housing in Hartford, often overcrowded tenements where existing apartments were subdivided by cheap partitions to create more housing. An article in the Hartford Courant in October 1917 was headlined: “Hartford's Negro Population Tripled in Eighteen Months” with subheadings: “Over 3,000 Here Now 2,000 of Whom Came from South Because of Better Conditions in North,” “Help Meet Labor Scarcity and Promise to Become Good Citizens” (Hartford Courant 1917c). The article included a picture of a decrepit house where three recently arrived families from Georgia lived and paid a total of $38 a month in rent. The Health Department had ordered the families to move out. In the newspaper the same day, a real estate ad offered a five-room apartment in the south end of the city for $25 a month, but few blacks lived in the south end of Hartford, evidence of the housing discrimination faced by African Americans.
In 1920, 74 percent of all African Americans in Hartford lived in the six districts delineated in the Urban League study. The subgroups within the African American population were spatially separated. In the northwest lived the more affluent among the African Americans, and they included the highest percentage of residents born in Connecticut. By comparison, the newly arrived migrants from Georgia lived in the east side of the North End including Wooster and Bellevue streets in Ward 3 adjacent to the railroad yards. Johnson described these areas using harsh terms to characterize the newly arrived southern migrants from Georgia (Johnson Reference Johnson1921).Footnote 8 The aggregate data organized by either political wards or the districts delineated in the Urban League study understate the extent of residential clustering among the black subgroups. Distinct enclaves formed within wards: two black subgroups (i.e., those born in Connecticut and Georgia) lived in the same neighborhood of Hartford but were spatially separated within.
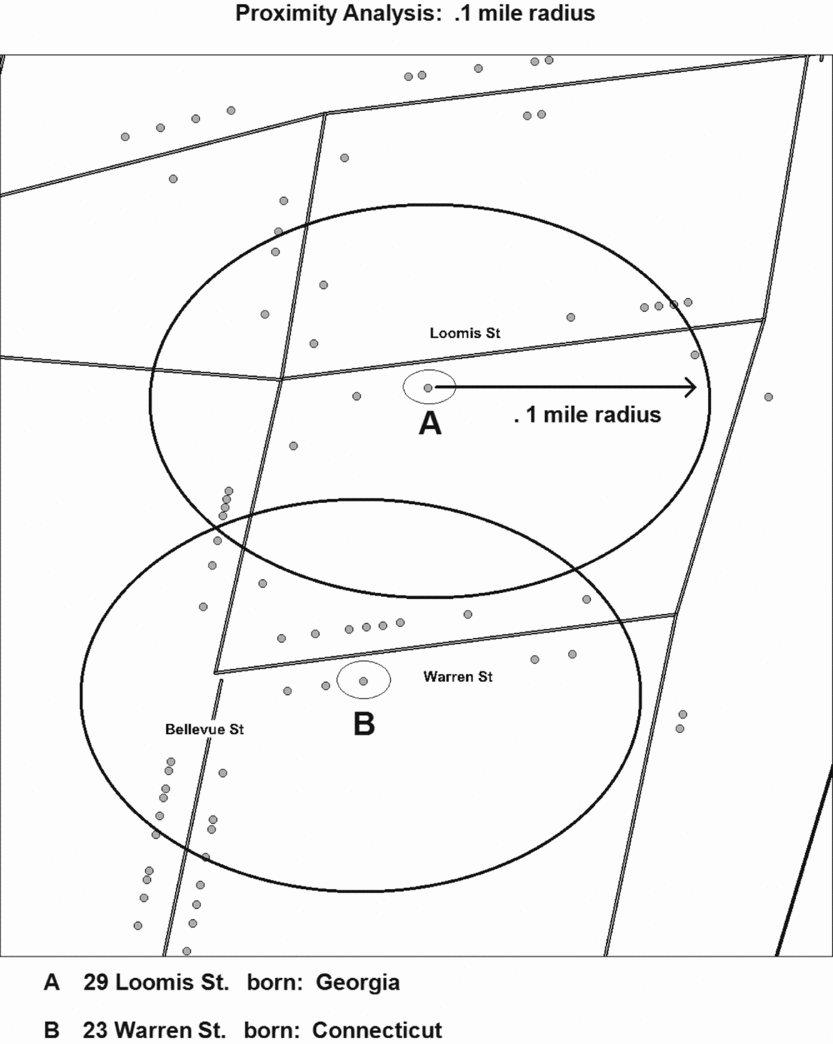
To measure intra–African American clustering a proximity analysis program was used. The program first generates a radius of a given magnitude (e.g., a quarter or a half a mile) simultaneously around each black head of household (figure 2). The program then calculates the total number of black heads of households within the specified geographic radius and the average percentage of residents within the radius around each individual who are members of the same subgroup (i.e., born in the same state).Footnote 9
Hartford North End: Bellevue, Warren & Loomis Streets.

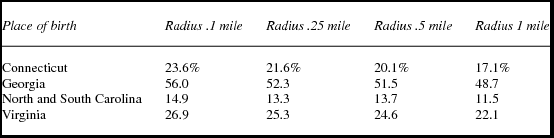
African Americans from each of the major subgroups (i.e., individuals born in Connecticut, Georgia, the Carolinas, or Virginia) tended to live on streets in close proximity with other members of their same subgroup. What is striking, though, is the degree of residential clustering of Georgians. More than any other subgroup, Georgians resided in areas heavily populated by individuals who migrated to Hartford from Georgia. Within a .1 mile radius around the residential locations where Georgians lived, 56 percent of all the other heads of households were also from Georgia (table 5). The corresponding percentages for heads of households from Connecticut, the Carolinas, or Virginia were markedly lower: 23.6 percent, 14.9 percent, and 26.9 percent, respectively. The proximity analysis shows the clustering of Georgians persists for larger spatial areas out to one mile (table 6).
Residential proximity of head of households to members of the same subgroup average % of subgroup within radius

Residential Clustering at the Street Level—Georgians and Eastern European Immigrants on Bellevue Avenue in North End
Hartford's total population increased from 138,036 in 1920 to 164,072 in 1930, including an influx of immigrants from Eastern Europe. By 1930, 27.2 percent of Hartford's population was foreign born, a total of 44,463 residents. The increase in immigration coincided with the Great Migration of African Americans from the South, creating further tensions as the newly arriving blacks competed with the new immigrants from Europe for employment and housing.
In the north end of Hartford, the changing residential patterns on Bellevue Street illustrate the competition for housing and the process of “invasion” and “succession,” terms employed by the Chicago School of urban theorists to describe the movement of a new social group into a spatial area and the departure of the previous residents (McKenzie Reference McKenzie1924). Bellevue Street runs north for three-fifths of a mile between Canton and Sanford streets and is two blocks to the west of the expansive train yard of the New York, New Haven and Hartford Railroad.
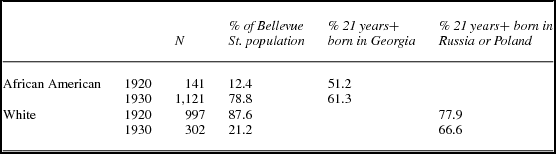
For the period from 1920 to 1930, for one moment in historical time, whites and blacks shared residential space on Bellevue Street. Over the course of the decade, the white population declined significantly as the white European immigrants moved out and more African Americans moved to Bellevue. In 1920, of those whites 21 years and older, 81 percent were foreign born and of the foreign born, 77.9 percent came from Russia or Poland, spoke Yiddish, and represented the increase of Eastern European Jewish immigrants to Hartford (table 7).Footnote 10
Hartford—Bellevue St. Racial and Ethnic Composition—1920 and 1930

By 1930 the white population declined significantly while the African American population increased with continued migration from Georgia. As Charles Johnson wrote in 1921 “where their [African Americans] communities are established they remain” (53) as the residential change on Bellevue Street between 1920 and 1930 illustrates. Over the decade, the apartment buildings on Bellevue occupied by Eastern European immigrants became home for the newly arrived migrants from Georgia.
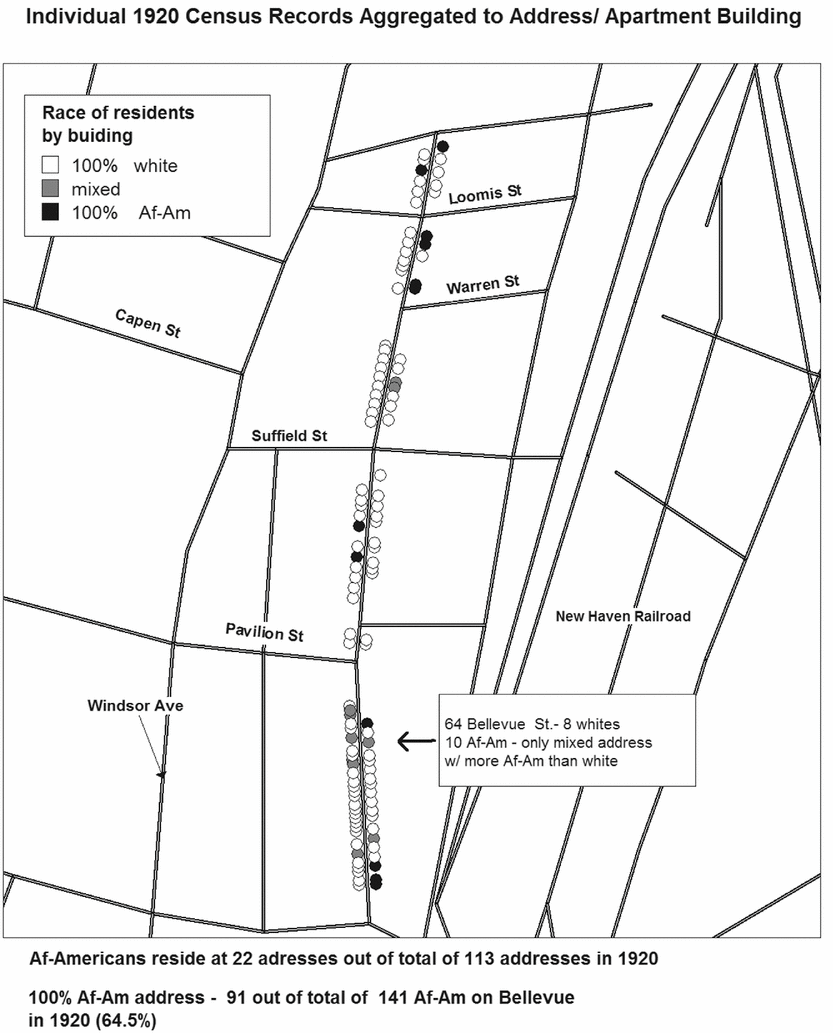
The residential dynamics on Bellevue Street were quite complex. Although blacks and whites both lived in a confined spatial area, they were segregated by residential buildings that the GIS analysis at the microlevel illustrates. First, in 1920 both racial groups were overwhelmingly renters. African Americans lived in apartments located at just 22 of the 113 addresses on Bellevue (figure 3). More than two-thirds of African Americans lived in buildings that had 100 percent black residents while next door or across the street were apartment buildings with only white residents. On all of Bellevue Street there was only one residential address with a mix of black and white residents, where the number of black residents exceeded the number of whites in 1920. In other “mixed” apartment buildings there was usually just one African American household.
Bellevue Street, 1920.

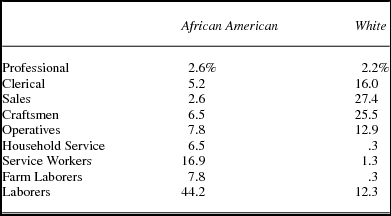
The Eastern European immigrants had a modicum of residential mobility and did not face the overt racial discrimination that African Americans did.Footnote 11 The white residents in 1920 had higher occupation status and earned higher wages. Significantly fewer whites worked as laborers, household servants, or as service workers. In fact the whites on Bellevue Street had a higher percentage of craftsmen than the overall population in Hartford. Skilled jobs as carpenters, machinists, and brick layers provided opportunity for upward mobility that work as a laborer did not. In addition, a striking share of the white immigrants worked in sales—many were street peddlers who worked for themselves. The African American migrants from Georgia living on Bellevue Street were trapped at the lowest rung of the occupational scale. Only 6.5 percent of black residents were skilled craftsmen and tellingly only 7.8 percent worked as operatives in Hartford's factories (table 8).
Occupation 1920—Bellevue Street

The changes that occurred on Bellevue Street between 1920 and 1930 were mirrored in the adjacent streets in the northeast section of Hartford in Ward 3 (figure 3). The number of African American residents in this area continued to increase as more whites left and by 1930 a racially segregated ghetto had emerged.
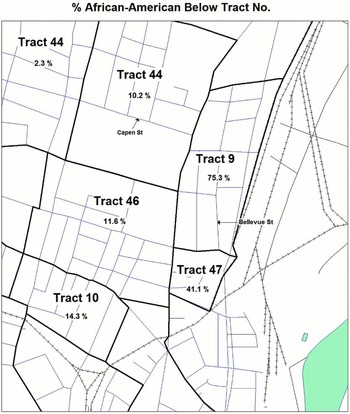
The Census Bureau released the 1940 Census individual level data in 2011 and the aggregate 1940 Census data is available at the census tract level. The Census Bureau first drew census tracts in Hartford for the 1940 Census. The 1940 Census track boundaries and aggregate data were obtained from the National Historical GIS (NHGIS 2008). Figure 4 displays the 1940 Census tracts in the north end of Hartford. Each census tract has an identification number, and below the track number is the percent of African American residents in 1940.
Hartford North End – 1940 Census Tracts.

All of Bellevue Street is in Census Tract 9 and the tract had the highest proportion of black residents in 1940, 75.3 percent, in all of Hartford. Tract 41, just to south, was second with 41.1 percent African Americans. By 1940 the “white flight” from the north end of Hartford, especially on Bellevue and the other streets in Tract 9 was well underway and would continue unabated.
Over the next decades this section of Hartford would become completely racially segregated and impoverished. A 1934 report of the Slum Clearance Study Committee found the area, including Bellevue Street, to have Hartford's worst housing and social conditions (Slum Clearance Study Committee 1934). These conditions have endured up to the contemporary era. In 2000, Census Tract 5009, which included both Census Tracts 9 and 8 from the 1940 Census, had a minority population of 99.5 percent, comprised of 51.7 percent African American and 47.8 percent Hispanic (US Bureau of the Census 2002). The federal poverty level stood at 49.9 percent. In 2000 the north end of Hartford was almost completely minority with the census tracts just to the north of Tract 5009, toward the border with Bloomfield, predominantly African American. Hirsch's study of the making of the “second ghetto” documents a similar pattern in Chicago. There was no concentrated African American neighborhood until 1890. By 1930 “it was possible to speak of an almost ‘solidly’ black area. . .. Whole neighborhoods were now black” (Hirsch Reference Hirsch1998: 3). On Hartford the Bellevue area was almost completely segregated by 1930 and would be by 1940.
Conclusion
The intense residential segregation that still characterizes Hartford today has its origins in the Great Migration over 100 years ago. The influx of new, poor African American migrants from Georgia led to their spatial concentration in the North End as illustrated on Bellevue Street. From just more than 20 percent of the residents in 1920, by 1930, 78.8 percent of the residents on Bellevue were African Americans as the white Eastern European immigrants left. This first “white flight” would continue and eventually the north end of Hartford would become a minority community.
Overall the African American residents of Hartford had lower occupational status, were renters rather than home owners, and lived in the city's worst housing. By 1930 the spatial contours of the future ghetto had become clearly established with blacks increasingly concentrating in the northeastern section of the city. As a consequence of Great Migration, Hartford's North End became racially segregated, a spatial pattern that persists to the present day.
Yet, this study also demonstrates that long-time African American residents and the newly arriving migrants did not form a homogeneous racial group. Significant differences in socioeconomic status, residential patterns, and voting behavior characterized different segments of the black community. These differences were closely tied to place of origin. African Americans born in Connecticut or Virginia had comparatively higher class status (measured in terms of occupation and voting) within the black population of Hartford. Newly arrived migrants from Georgia had significantly lower socioeconomic status and were more residentially clustered, isolated from whites and other African American subgroups. Just as studies of European immigrants focus on specific ethnic subgroups, the use of GIS and individual-level historic census records can be used creatively to study subgroups within the black population as the Great Migration to Hartford began.