


I. INTRODUCTION
High electron mobility transistors (HEMTs) based on AlGaN/GaN heterostructures have shown impressive performances, in terms of high-electron mobility, high-power density, high cut-off frequency and high-thermal conductivity. As a consequence, they represent the most promising candidates for future power switching and microwave applications. However, GaN technology suffers from an important lack of knowledge and poor control of trapping effects such as current collapse (CC) and knee walkout. These trapping effects combined with thermal effects lead to a limitation of their performances [Reference Binari, Klein and Kazior1, Reference Vetury, Zhang, Keller and Mishra2] under modulated large-signal dynamic excitations. In order to get insight into working mode of trapping effects, several techniques have been proposed:
-
(1) Pulsed I/V measurements, carried out at several quiescent bias points to quantify the CC [Reference Meneghesso, Meneghini, Tazzoli, Ronchi, Stocco, Chini and Zanoni3], to obtain a preliminary characterization and to understand which trapping mechanisms may affect the transistor performance [Reference Meneghini, Ronchi, Stocco, Meneghesso, Mishra, Pei and Zanoni4];
-
(2) Current deep-level transient spectroscopy (I-DLTS) analysis [Reference Joh and Del Alamo5, Reference Tartarin, Karboyan, Olivie, Astre, Bary and Lambert6] through stretched multiexponential fitting of the drain current transient (DCT) measurements [Reference Bisi, Meneghini, de Santi, Chini, Dammann, Bruckner, Mikulla, Meneghesso and Zanoni7] can provide information on the E a and σ c of the trap levels involved in CC;
-
(3) Output conductance frequency dispersion [Reference Umana-Membreno, Dell, Nener, Faraone, Parish, Wu and Mishra8, Reference Potier, Martin, Campovecchio, Laurent, Quere, Jacquet, Jardel, Piotrowicz and Delage9] and transconductance frequency dispersion [Reference Nsele, Escotte, Tartarin, Piotrowicz and Delage10] based on low-frequency (LF) 2-port S-parameters measurements can provide information on the trap characteristics (E a and σ c ) promoted by small-signal excitation at fixed bias point.
The aim of this paper is to contribute to better understand trapping phenomena from DC to radio-frequency (RF) range with the combination of these three characterization techniques. The frequency dispersion of electrical characteristics is important, for microwave circuit design, in the way that the trapping phenomena reduce significantly the transconductance and output conductance. Therefore, it is of prime importance to introduce those LF small-signal parasitic effects and I-DLTS in CAD models, in order to be able to predict more accurate the RF dispersion when the transistor is driven by pulsed-RF large-signal excitations [Reference Benvegnu, Laurent, Meneghini, Meneghesso, Muraro, Barataud, Zanoni and Quere11, Reference Jardel, Laurent, Reveyrand, Quéré, Nakkala, Martin, Piotrowicz, Campovecchio and Delage12]. In the following section, the pulsed I/V characteristics are presented, and associated with a specific procedure allowing the identification of traps. Section III is dedicated to DCT measurements, with emphasis on activation energies and capture cross sections of three main traps. Section IV describes the transconductance and output-conductance frequency dispersion technique; in particular, the new way to determine the E a and σ c , and to identify the traps from the LF dispersion of the transconductance is presented. Finally, Section V presents the comparison of the extracted trap characteristics using the different measurement techniques. It also discusses and compares the Arrhenius plot results found by DCT and transconductance and output-conductance frequency dispersion techniques with previous papers on defects in GaN.
II. PULSED CHARACTERIZATION
The devices used for this study are 2 mm (8 × 250 µm), 0.5 µm gate length AlGaN/GaN GH50 HEMTs (from UMS foundry), grown on SiC substrate, with a SiN passivation layer. The devices were submitted to a complete pulsed I/V characterization aimed at identifying the presence of traps and quantifying CC. Pulsed I/V characterization was carried out by means of a commercial 250 V/10A pulsed I/V BILT AMCAD system [13]. Figure 1(a) reports the results of pulsed I D -VD characterization and Fig. 1(b) shows the g m variation (extracted from I D -VG measurements) for different quiescent bias points:
-
• Q1: (V GQ , VDQ ) = (0 V, 0 V), which corresponds to negligible electron trapping;
Fig. 1.(a) I D -VD and (b) g m (derived from I D -VG ) pulsed characterizations for different quiescent bias points.

-
• Q2: (V GQ , VDQ ) = (−5 V, 0 V), which may favor the trapping of electrons under the gate region (gate-lag);
-
• Q3: (V GQ , VDQ ) = (−5 V, 40 V), which may favor the trapping of electrons under the gate-drain region (drain-lag);
-
• Q4: (V GQ , VDQ ) = (−1.9 V, 40 V), which is representative of electron trapping under class AB bias condition (I DS = 50 mA at V DQ = 40 V).
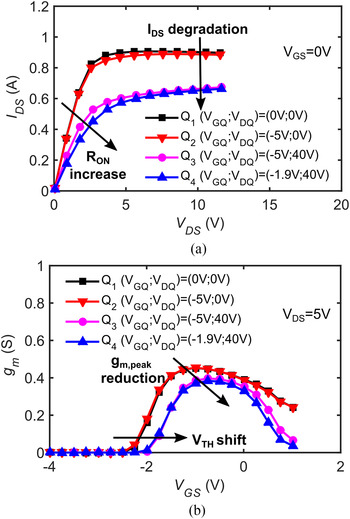
The results of pulsed I D -VD measurements indicate that the device is less sensitive to gate-lag than to drain-lag: the gate filling pulse V GQ has a negligible effect on device characteristics, while the application of V DQ induces a strong CC and degrades the R ON value. By comparing the OFF-state quiescent bias point (−5 V, 40 V) with SEMI-ON state, class AB bias condition (same V DQ but V GQ = −1.9 V), it can be noticed that the CC is relatively unchanged but the R ON degradation is enhanced.
Transconductance (g m ) measurements, shown in Fig. 1(b), show that drain-lag (point Q3) induces both a positive threshold voltage shift and a g m reduction (−15% at peak and more pronounced at higher V GS ). The Q4 quiescent point presents the same threshold voltage shift and a slightly more pronounced g m decrease with respect to Q3. These results suggest that CC is related with negative charge trapping both under the gate and in the access regions.
III. DCT MEASUREMENTS
The properties of the traps, responsible for CC, were investigated by DCT measurements. The experimental set-up used for DCT measurements is shown in Fig. 2.
Block diagram of thermal DCT measurement set-up.

In this set-up, the DCT is determined by measuring the differential voltage on a resistive load (R SENSE = 10 Ω) connected between the drain of transistor and the drain pulser. The drain pulse signal is linearly amplified to reach the required values of drain current and voltage. The scope is then triggered with a synchronous pulsed signal generated by the drain pulser. The delay introduced by the linear DC power amplifier (PA) has a negligible effect on the synchronized biasing and DC measurement of transistor. The transistor is first biased by applying a 100s filling pulse (V GF ; VDF ), thus inducing a specific trapping state. Subsequently, the device is switched to a different bias point in the saturation region (V GM , VDM ) = (−1.7 V, 5 V); the recovery of drain current related to charge detrapping is measured over 7 time decades (from 10 µs to 100 s) by means of a digital sampling oscilloscope. For the extraction of the time constants the DCT data were fitted by a stretched multiexponential function [Reference Bisi, Meneghini, de Santi, Chini, Dammann, Bruckner, Mikulla, Meneghesso and Zanoni7]:
 $${{I}_{{DS,fitting}}\,}({t}) = \sum\limits_{i}^{N} {{{A}_{i}}{{e}^{ - {{\left( {\displaystyle{{t} \over {{{\tau} _{i}}}}} \right)}^{{{\beta} _{i}}}}}} + {{I}_{{DS,final}}}}, $$
where A i , τi , and β i , are fitting parameters corresponding respectively, to trap amplitude, time constant and the stretching parameter (0 < β < 1) of N detected charge trapping. In trapping (detrapping) behavior, A > 0 (A < 0) corresponds to emission and A < 0 (A > 0) corresponds to capture process. Therefore, the extracted time constants with applied temperature correction [Reference Joh, Del Alamo, Chowdhury, Chou, Tserng and Jimenez14] allow us to determine the apparent activation energy E a and the capture cross section σ c by using the Arrhenius’ equation written as
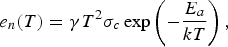 $${{e}_{n}}({T}) = {\gamma} {{T}^2}{{\sigma} _{c}}\exp \left( { - \displaystyle{{{{E}_{a}}} \over {{kT}}}} \right),$$
with
 ${{e}_{n}} = 1/{{\tau} _{n}}$
and
 ${\gamma} = 2\sqrt 3 {(2{\pi} )^{(3/2)}}{{k}^2}{m} \times {{h}^{ - 2}}{z}$
, where τ
n
is the time constant, e
n
is the emission rate, T is the temperature, m* is the effective electron mass, h is the Planck constant and k is the Boltzmann constant.
To achieve complementary information about CC, DCT measurements were carried out, starting from three different filling bias conditions (V GF ; VDF ) (corresponding to the quiescent bias points used in the previously described pulsed I/V measurements). The results are shown in Fig. 3. The OFF-state condition defined by (V GF , VDF ) = (−5 V, 10 V) induces negligible trapping. The emission process “E4” shows a high drain voltage dependence and clearly appears for the two following conditions: OFF state is defined by (V GF , VDF ) = (−5 V, 40 V) and SEMI-ON state is defined by (V GF , VDF ) = (−1.9 V, 40 V). Furthermore, the emission process “E2” and the capture process “E3” are mostly induced by the (V GF , VDF ) = (−1.9 V, 40 V) bias condition. In order to investigate the properties of traps for the SEMI-ON state, the DCT measurements were carried out at different temperatures. The time spectrum analysis and Arrhenius plot are reported, respectively, in Figs 4(b) and 4(c). The analysis for the SEMI-ON state is very interesting because it gives information on which traps will affect class AB operation mode of the transistor in a PA. It can be noticed that all emission and capture processes “E2”, “E3”, and “E4” will take place in this class AB operation mode.
(a) DCT recorded and fitting for three different trapping conditions at 80 °C (b) related time spectrum analysis.

(a) DCT recorded and fitting in SEMI-ON state condition for 80–140 °C temperature range, (b) related time spectrum analysis and (c) related Arrhenius plot.

IV. LF DISPERSION MEASUREMENTS
Output-conducatance and transconductance of GaN HEMTs have been observed to change significantly at LF (100 KHz–100 MHz) [Reference Nsele, Escotte, Tartarin, Piotrowicz and Delage10]. So, in order to gather complementary information on trapping effects under class AB operation mode, the LF Y-parameters dispersion are investigated through small-signal S-parameters measurements in the 100 Hz–1 GHz frequency range. These S-parameters measurements were carried out at several temperatures using a LF–HF Vector Network Analyzer (VNA; Agilent E5061b) to determine g d (f) and g m (f) dispersion. As illustrated in Fig. 5, the V GS is applied to LF home-made bias tee [Reference El Rafei, Callet, Mouginot, Faraj, Laurent, Prigent, Quéré, Jardel and Delage15] with DC port connected to power supply and the RF port connected to port 2 of VNA. The drain terminal is connected to internal bias system (port 1) to the network analyzer. On-wafer SOLT calibration is performed at each individual temperature.
Block diagram of the LF Y-parameters measurement set-up in 2-port configuration for the characterization of g d (f) and g m (f).

So, the Y-parameters are calculated from the measured S-parameters [Reference Frickey16]. Empirically, the effect of carrier trapping on frequency dispersion of output-conducatance and transconductance can be modeled as reported in [Reference Golio, Miller, Maracas and Johnson17]. The dispersion effects are taken into account with an additional voltage dependent current source (that represents the injection mechanism in trap state) in a RC circuit as shown in Fig. 6.
Empirically equivalent circuit model for output-conductance and transconductance dispersions.

According to this small-signal model at LF, g m (f) and g d (f) can be deduced from the Y-parameters of the Device Under Test, respectively, Y 21 and Y 22 parameters by the following equations:
 $${{Y}_{21}}({\omega} ) = \left( {{{g}_{m}} - \displaystyle{{{{g}_{{mn}}}{{({\omega} {{\tau} _{n}})}^2}} \over {1 + {{({\omega} {{\tau} _{n}})}^2}}}} \right) - {j}\displaystyle{{{{g}_{{mn}}}({\omega} {{\tau} _{n}})} \over {1 + {{({\omega} {{\tau} _{n}})}^2}}},$$
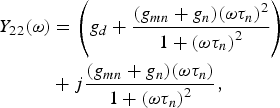 $$\eqalign{{{Y}_{22}}({\omega} ) & = \left( {{{g}_{d}} + \displaystyle{{({{g}_{{mn}}} + {{g}_{n}}){{({\omega} {{\tau} _{n}})}^2}} \over {1 + {{({\omega} {{\tau} _{n}})}^2}}}} \right) \cr & + {j}\displaystyle{{({{g}_{{mn}}} + {{g}_{n}})({\omega} {{\tau} _{n}})} \over {1 + {{({\omega} {{\tau} _{n}})}^2}}},}$$
τ n = C n /g n corresponds to the time constant of trapping process. For the extraction of time constants, the derivative forms of imaginary part of Y 21 and Y 22 are used. In this way, the emission constants due to g m (f) dispersion can be extracted either from peak values of Y 21 imaginary part (f imag ( Y21) = 1/2πτ n ) and the emission constants due to g d (f) dispersion can be extracted either from peak values of Y 22 imaginary part (f imag ( Y22) = 1/2πτ n ). The number of traps of g m (f) (g d (f)) is defined by the number of peaks of the Y 22 imaginary part (Y 21 imaginary part) or by the number of inflexion points of the Y 22 real part (Y 21 real part) [Reference Potier, Martin, Campovecchio, Laurent, Quere, Jacquet, Jardel, Piotrowicz and Delage9]. As it is demonstrated, the peak values of Y 21 and Y 22 imaginary parts at several temperatures allow extracting the E a and σ c (associated respectively, to g m (f) and g d (f) dispersion) using the Arrhenius formula (2) and substituting the emission rate with the reciprocal of time constant (e n = 1/τ n ). A temperature correction [Reference Joh, Del Alamo, Chowdhury, Chou, Tserng and Jimenez14] is applied to determine E a and σ c . LF Y-parameters measurements for the SEMI-ON state (V GS , VDS ) = (−1.9 V, 40 V) were carried out at different temperatures to obtain the Arrhenius plot, as shown in Figs 7 and 8. This analysis is focused only on Y 21 and Y 22 because the experimental data of Y 11 and Y 12 do not show any dispersion. The Y-parameters, depicted in Figs 7 and 8, show that above the 100 MHz frequency, the contribution of intrinsic capacitors of small signal model is not negligible.
(a) Y 21 real part versus frequency for 80–130 °C temperature range, (b) Y 21 imaginary part versus frequency for 80–130 °C temperature range and (c) related Arrhenius plot.

(a) Y 22 real part versus frequency for 80–130 °C temperature range, (b) Y 22 imaginary part versus frequency for 80–130 °C temperature range and (c) related Arrhenius plot.

The Y 21-measurement shows two distinct transition frequencies in Real(Y 21) and two distinct peaks in Imag(Y 21), proving that g m (f) dispersion presents two trapping phenomena. The peak of Y 21 imaginary part corresponds to the transitions in the transconductance (Y 21 real part). The Fig. 7(a) shows a significant decrease of the transconductance (Real(Y 21)) amplitude with the increase of the temperature due to thermal effects. On the one hand, the first transition appears at LF (approximately 5–10 KHz for 80 °C). On the other hand the Real(Y 21) increases when the frequency decreases. The conclusion of these two last observations is that the trap (label “E2”) can be associated with an emission process. Considering that Real(Y 21) decreases when the frequency decreases and considering that the time constant of trap “E1” is approximately 1 µs (range of capture time constant), the trap “E1” can be associated with a capture process. Output conductance dispersion for the same device is presented in Fig. 8. The Y 22 real part (Real(Y 22)) corresponding, in a first approximation, to the output conductance g d (or the reciprocal of output resistance) shows one inflexion point. So g d (f) dispersion presents one trap that corresponds to trap “E2” found by g m (f) dispersion according to [Reference Islam, Anwar and Webster18]. Moreover, for the process “E2” we found the same time constants by g d (f) and g m (f) dispersions. Thus, the traps “E1” and “E2” are promoted by two mechanisms: the first one appears only when the small-signal is applied to gate port, this suggests that the trap is located under the gate. The second trapping mechanism is due to hot electrons as explained in the next Section. The transconductance and output conductance frequency dispersions promoted by the process “E2” can be explained in this way: if the detrapping time constant is much higher than the signal period, traps cannot respond as quickly as the applied voltage. On the other hand, when the detrapping time constant is of the same order of the signal period, the trapped electrons due to the injection of highly energetic (hot) electrons are emitted and they participate to the RF current-carrying process giving rise to frequency dispersion in the device.
V. IDENTIFICATION OF THE DEEP LEVELS
A) Trap signatures
The overall Arrhenius plot provided by I-DLTS, transconductance and output-conductance frequency dispersion measurements is shown in Fig. 9.
Arrhenius plot of deep levels “E1”, “E2”, “E3” and “E4” detected within this paper. Presentation of trap states reported in previous papers for comparison (data taken from [Reference Bisi, Meneghini, de Santi, Chini, Dammann, Bruckner, Mikulla, Meneghesso and Zanoni7] and references therein).

To obtain more detailed information of trap properties, the deep levels observed in Fig. 9 are compared with deep levels previously reported in literature [Reference Joh and Del Alamo5, Reference Bisi, Meneghini, de Santi, Chini, Dammann, Bruckner, Mikulla, Meneghesso and Zanoni7, Reference Hacke, Detchprohm, Hiramatsu, Sawaki, Tadatomo and Miyake19–Reference Stocco, Gerardin, Bisi, Dalcanale, Rampazzo, Meneghini, Meneghesso, Grünenpütt, Lambert, Blanck and Zanoni50].
From Fig. 9, the emission process “E2” obtained from DCTs measurements is characterized by E a = 0.64 eV and σ c = 3.9 × 10⁻¹⁴ cm2. The emission trap process obtained from transconductance and output-conductance frequency dispersion measurements is characterized by E a = 0.61 eV and σ c = 1.2 × 10⁻¹⁴ cm2. For the first time, to our knoweledge, the correspondence of the trap characteristics allows concluding that the same trap level “E2” is extracted from the two different measurements. Moreover, the Y 21 imaginary part and the Y 22 imaginary part in Figs 7 and 8 shows a rightward shift of the peaks when the temperature increases. This frequency shift, from 5 kHz (at 80 °C) to 65 kHz (at 130 °C), converted in the time domain corresponds to a same time constant shift observed in I-DLTS measurements (Fig 4(a)) when the temperature increases. This level “E2” is supposed to be due to a native defect of GaN, based on the comparison with previous reports [Reference Bisi, Meneghini, de Santi, Chini, Dammann, Bruckner, Mikulla, Meneghesso and Zanoni7, Reference Meneghini, Rossetto, Bisi, Stocco, Chini, Pantellini, Lanzieri, Nanni, Meneghesso and Zanoni49, Reference Stocco, Gerardin, Bisi, Dalcanale, Rampazzo, Meneghini, Meneghesso, Grünenpütt, Lambert, Blanck and Zanoni50].
The level “E3” (E a = 0.86 eV; σ c = 8.7 × 10⁻¹³ cm2) obtained from DCTs measurements, reveals similar signature to deep levels already associated with nitrogen-related defects [Reference Hacke, Detchprohm, Hiramatsu, Sawaki, Tadatomo and Miyake19, Reference Arehart, Homan, Wong, Poblenz, Speck and Ringel35] present in the GaN layer.
The level “E4” (E a = 1 eV; σ c = 5.0 × 10⁻¹³ cm2) characterized by DCTs measurements, shows a correspondence with the signature of deep levels associated with extended defects in GaN [Reference Bisi, Meneghini, de Santi, Chini, Dammann, Bruckner, Mikulla, Meneghesso and Zanoni7, Reference Osaka, Ohno, Kishimoto, Maezawa and Mizutani27].
Finally, the level “E1” (E a = 0.25 eV; σ c = 1.6 × 10⁻¹⁷ cm2) characterized by LF Y 21 measurements, shows again a correspondence with the signature of deep levels associated with nitrogen-related defect [Reference Umana-Membreno, Parish, Fichtenbaum, Keller, Mishra and Nener30, Reference Arehart, Corrion, Poblenz, Speck, Mishra, DenBaars and Ringel31].
B) Filling time dependence
To obtain more information on the trap dynamic behavior, the evolution of the “E2”, “E3”, and “E4” time spectrum results is reported versus the duration of filling pulse in Fig. 10(a). For this investigation, the trapping phenomena were induced by appling (V GF , VDF ) = (−1.9 V, 40 V) at constant temperature (100 °C). The width of filling time varies from 100 µs to 100 s. As described in Fig. 10, the “E4” amplitude increases with time and saturates for long pulse width. This behavior can be explained by two possible hypotheses. The first one is related to the presence of linear line defects, possibly due to dangling bonds along dislocation core sites. As described in [Reference Cho, Kim and Hong51], the concentration of the ionized defects has a logarithmic dependency on duration of filling pulse (t p ) according to the following formula:
 $${n_T}({t_p}) = {c_n} \cdot \tau \cdot {N_T} \cdot \ln \left( {1 + \displaystyle{{{t_p}} \over \tau}} \right),$$
where c n , τ, and N T , respectively, represent the capture probability, the characteristic time for the capture barrier build-up and the total concentration of the defects. Before the saturation of trap occupancy, the charge filling time may produce a capture rate reduction due to repulsive interaction between the free electrons and the increased negatively charged traps. The second one is related to the presence of acceptor-like traps, where the filling time is associated with the emission of holes to the valence band [Reference Bisi, Meneghini, Van Hove, Marcon, Stoffels, Wu, Decoutere, Meneghesso and Zanoni52]. Simultaneously, the “E2” amplitude decreases when the pulse width increases up to a value, which corresponds to the saturation of ionized “E4” traps. The evolution of “E4” and “E2” amplitudes with the filling time suggests that there may exist an equilibrium between the ionization of the two trap states.
(a) E2 and E4 time spectrum analysis and (b) related amplitude processes dependency with the filling pulse duration.

C) Capture mechanism: dependence on gate bias and temperatures
To further investigate on the trapping behavior due to the RF working conditions, a complete analysis of CC dependence with the gate quiescent bias point (swept from −5 to −1.5 V) was performed. It allows emulating the RF sweep condition (that corresponds to a constant DC value of V DS and an increase DC value of I DS with the increase of input power). The results of this CC analysis (evaluated at V GS = 0 V and V DS = 10 V) are summarized in Fig. 11. It shows that for OFF state (V GS < −2.4 V) the CC is constant and for ON state (V GS > −2.4 V) the CC increases significantly with the drain current I DS . These variations cannot be due to the temperature increase when the drain current increases because Fig. 11 proves that the CC does not depend on the temperature of the device.
Thermal dependence of CC and I DS versus gate quiescent bias point for a 40 V drain quiescent bias point.

The CC increase for ON state can rather be attributed to the injection of hot electrons towards traps located in the buffer, in this case trap “E2” and/or trap “E4”. This hypothesis is also reported in [Reference Meneghini, Rossetto, Bisi, Stocco, Chini, Pantellini, Lanzieri, Nanni, Meneghesso and Zanoni49], which associates this phenomenon to trap “E2” and shows an increase of amplitude's process with increase of gate quiescent bias point. It is then demonstrated that the CC is strongly correlated to the value of gate quiescent bias conditions in the ON state.
VI. CONCLUSION
In this work, a detailed investigation of the trapping processes in AlGaN/GaN HEMTs under class AB bias condition is described. It is based on combined pulsed I/V measurements (which provide an identification of the possible trap position), I-DLTS investigation (which provide data on the large-signal voltage steps detrapping transient, suitable for deep-level analysis) and LF transconductance and output-conductance measurements (which provide small-signal trap analysis). The pulsed I/V measurements under class AB bias condition detected a shift in the threshold voltage, a significant increase in the resistivity of the gate–drain access region, and a decrease in the transconductance peak. Moreover, pulsed I/V characterization carried out at several temperatures shows that the CC increases when the gate quiescent bias point increases (due to hot electrons). This phenomenon can impact seriously the dynamic performances of the transistor. The properties of the trap responsible for CC are investigated with I-DLTS. This technique has evidenced three traps with the following activation energies: E4 = 1 eV, E3 = 0.86 eV, and E2 = 0.64 eV. For the first time, the level “E2” has been found to have a good matching with the trap level identified by the transconductance and output-conductance frequency technique, which is supposed to be due to a native defect GaN. The features of the pulsed I/V measurement suggest that these defects are located in the GaN buffer layer. The DCT technique is very powerful because of drain current sensitivity to trap parameter analysis. The time constants and amplitude of the traps are extracted by a stretched multiexponential function for trapping or detrapping phenomena. Real-time trapping behaviors are observed thanks to accurate records over a 7-decade time scale allowing investigation of slow and fast trapping phenomena. The transcondutance and output-conductance frequency dispersion technique can provide trap information (E a and σ c ) using small-signal excitations close to real continuous wave RF operation mode. This trapping extraction method (LF Y 21 and LF Y 22) is based on the 2-port S-parameters measurement that directly provides information of the current corresponding to g m and g d (in a first approximation). The advantage of this method lies in the g m and g d sensibility to the drain-lag trapping effects. LF Y-parameters characterization is very accurate because it is based on the use of VNA measurements. This method provides a fast characterization of trapping phenomena but suffers from the lack of a quantitative determination of trap density.
The complexity of the LF dispersion characterization and the scarcity of its analysis makes difficult to determine at the moment a detailed theoretical model of trap “E1”. But, the extraction technique of activation energies and capture cross sections for detected traps, based on temperature-dependent measurements of the imaginary part of Y 22 and Y 21, is demonstrated.
ACKNOWLEDGEMENTS
This work was supported by the Thales Alenia Space in Toulouse in the framework of the “DEFIS-RF” ANR project (ANR-13-CHIN-0003) under the supervision of Jean-Luc Muraro and by the French Space Agency (CNES) through contract 131223/00 (Etude de la fiabilité de transistors GaN) under the supervision of Jean-Luc Roux. The Authors also thank UMS foundry for providing the GaN GH50 transistor.
 Agostino Benvegnù was born in Padua, Italy, in 1988. He received the master's degree in Electronic Engineering in 2012 from the University of Padua, Padua, Italy. Since 2013, he has been working toward the Ph.D. degree within an international doctorate agreement between the Doctorate School of the Department of Information Engineering, University of Padua, and of the XLIM Laboratory, University of Limoges, France. His main research interests include the characterization and modeling of GaN microwave power devices and their related electrical defects.
 Davide Bisi received his Ph.D. degree from the University of Padua, Padua, Italy, in 2015. He is currently a postdoctoral researcher with the Department of Information Engineering, University of Padua, and visiting scholar with the University of California, Santa Barbara, CA, USA. His research interests include characterization, modeling and reliability of GaN-based electron devices.
 Sylvain Laurent was born in Chateauroux, France, in 1983. He received his Ph.D. degree in Electronics from the University of Limoges, Brive, France in 2010. He is currently an engineer in the “Composants Circuits Signaux et Systémes Hautes Freéquences” department of Xlim laboratory. His research interests include the characterization of RF microwave nonlinear devices.
 Matteo Meneghini (S'06–M'08–SM'13) received his Ph.D. degree from the University of Padua, Padua, Italy, in 2008. He is currently an Assistant Professor with the Department of Information Engineering, University of Padua, where he is involved in the electro-optical characterization and modeling of the performance and reliability of GaN-based LEDs, lasers, and HEMTs. He has authored over 200 papers on these topics.
 Gaudenzio Meneghesso (S'95–M'97–SM'07–F'13) received his degree in Electronics Engineering and the Ph.D. degree from the University of Padua, Padua, Italy, in 1992 and 1997, respectively. He has been a Full Professor with the University of Padua since 2011. His current research interests include the electrical characterization, modeling and reliability of microwave and optoelectronics devices on III-V and III-N, organic semiconductors devices, and photovoltaic solar cells. Within these activities, he published more than 600 technical papers.
 Denis Barataud was born in Saint-Junien, France. He received his Engineer's degree from the Ecole Nationale Supérieure de Télécommunications de Bretagne, Brest, France, in 1994, and the Ph.D. degree in Electronics from the University of Limoges, Limoges, France, in 1998. From 1998 to 1999, he was a Postdoctoral Scientist with the Microwave Laboratory, CNES, Toulouse, France. Since 2000, he has been with the XLIM (formerly IRCOM) Laboratory, University of Limoges, where in 2001 he became an Assistant Professor and a Full Professor in 2012. His research interests include the development of time-domain measurement set-ups and techniques for the characterization of non-linear devices.
 Enrico Zanoni (S'81–A'82–SM'93–F'09) was born in Verona, Italy, in 1956. He received the Laurea (cum laude) degree in physics from the University of Modena and Reggio Emilia, Modena, Italy, in 1982. He is currently with the University of Padua, Padua, Italy, where he has been a Full Professor of Digital Electronics with the Department of Information Engineering since 1997.
 Raymond Quéré (Fellow IEEE) received his Electrical Engineering degree from ENSEEIHT (Toulouse France) in 1976 and the French “Agrégation” in applied physics in 1978. Later he earned the Ph.D. degree from the University of Limoges where he was appointed as Full Professor in 1992. He leads the department of High Frequency Devices, Circuits, Signals and Systems at XLIM Laboratory (CNRS/University of Limoges – France) where he is particularly involved in the modeling and design of nonlinear circuits for Telecommunications and Radar Systems. He authored or coauthored more than 150 publications or communications in international journals and conferences. He is involved in French and European research projects and serves as an expert for the evaluation of research projects for the French Research Agency (ANR).



