1. Introduction and background
1.1. Introduction
While single robotic systems have shown remarkable progress, they encounter limitations in handling complex tasks, especially those demanding extensive resources. In response, multi-robot systems (MRS) have gained significant interest across various sectors, acclaimed for their efficiency in executing collaborative tasks [Reference Almadhoun, Taha, Seneviratne, Dias and Cai3, Reference Chung, Paranjape, Dames, Shen and Kumar6, Reference Silano, Baca, Penicka, Liuzza and Saska21]. As a network of actuating units collaborating toward a unified objective, they capitalize on their collective intelligence and capabilities. These systems are characterized by distributed intelligence, where multiple agents share the workload, optimizing task execution. The distribution of workload among the robots enables MRS to accomplish tasks faster and more accurately than a single robot could [Reference Basma Gh Elkilany, Fathelbab and Ishii8]. The key attributes of MRS, such as increased robustness, reliability, and precision, make them highly suitable for diverse applications, ranging from security operations, like reconnaissance and patrols, to search and rescue missions [Reference Basma Gh Elkilany, Fathelbab and Ishii8]. For example, the use of multi-drone systems in advertising and multi-robot teams in high-risk inspection tasks illustrates the potential of MRS in various fields, including environmental monitoring and collaborative transportation [Reference Abdelkader, Güler, Jaleel and Shamma1, Reference Horyna, Baca, Walter, Albani, Hert, Ferrante and Saska11, Reference Schellenberg, Richardson, Watson, Greatwood, Clarke, Thomas, Wood, Freer, Thomas, Liu, Salama and Chigna19, Reference Ullah, Al-Turjman, Qayyum, Inam and Imran23].
In the MRS field, relative localization plays a critical role in enhancing the functionality and effectiveness of robotic teams. Relative localization refers to the process of determining the position and orientation of robots in relation to each other, possibly within a common coordinate frame. This aspect is crucial for enabling coordination and collaboration among robots, as it facilitates accurate formation control and synchronized actions [Reference Wang, Wen, Yin, Xu, Cao and Gao26]. One of the key challenges in multi-robot localization is ensuring that robots can accurately determine their relative positions and orientations in dynamic environments where infrastructure may not be available. This requires the integration of various sensor data and localization algorithms to account for factors such as noise and occlusion. It is also crucial to consider the scalability of multi-robot localization systems, especially in large-scale environments or scenarios involving a high number of robots. Efficient data fusion and distributed algorithms are essential to manage the computational and communication overhead while maintaining accurate relative localization across the robot team. Moreover, addressing potential sources of ambiguity or uncertainty in relative localization results is vital for ensuring robust and reliable operation in diverse real-world settings. Therefore, the progress of robotic systems deeply relies on the advancement of relative localization techniques that enable coordination and navigation.
We examine the relative localization problem in MRS to build a multi-modal perception capability among the robots. Particularly, we examine the benefits of utilizing both omnidirectional distance sensors and monocular cameras on the robots for the ultimate goal of formation control designs. Through a comparative analysis, we demonstrate that the two sensing modalities can be used as complementary to each other for a unified perception model. While a vision sensor can provide extensive information about the neighbor robots in a team, ultrawideband (UWB) sensors can produce accurate inter-robot distance measurements which are crucial for formation control purposes. A Gaussian mixture probability hypothesis density (GM-PHD) filter successfully combines the two sensing models to generate a robust relative positioning between the robots. Furthermore, we provide suitable formation configurations that suit the needs of the localization module. Several simulations and real-world experiments verify that the proposed mechanism based on the two distinct sensing modalities performs well in real environmental conditions.
1.2. Related works
The successful deployment of MRS hinges on an effective combination of localization networks and formation control algorithms. Despite substantial theoretical contributions to formation control, the translation of these concepts into practical applications has progressed slowly. Numerous studies have theoretically established the convergence and stability of control laws [Reference Ahn2, Reference Trinh, Zhao, Sun, Zelazo, Anderson and Ahn22, Reference Zhao and Zelazo27]. However, the practical realization of these laws is often impeded by limitations in sensor networks necessary for implementation. To adhere to these control principles, a robust localization system is indispensable.
The field of localization in MRS has traditionally been dominated by infrastructure-based methods, which heavily rely on established systems and centralized computational units. Notable among these are the approaches documented in studies by De et al. [Reference De Queiroz, Cai and Feemster7] and Choi et al. [Reference Choi and Kim5]. These systems frequently utilize GPS for outdoor localization, despite its known limitations in indoor environments due to signal obstruction. For indoor localization, motion capture (mocap) camera systems are often employed. However, their application is typically confined to controlled environments with specific setup requirements, limiting their generalizability.
Given these constraints, there has been a significant shift toward developing localization systems that function effectively in both indoor and outdoor settings, a crucial advancement for MRS. In recent years, the focus has moved toward decentralized approaches. This includes the use of various fiducial markers for onboard localization strategies, as explored in the works [Reference Fidan, Gazi, Zhai, Cen and Karataş9, Reference Krajník, Nitsche, Faigl, Vaněk, Saska, Přeučil, Duckett and Mejail13, Reference Saska, Baca, Thomas, Chudoba, Preucil, Krajnik, Faigl, Loianno and Kumar18]. These methods involve placing physical markers in the environment, which the robots then use for localization. While effective, the installation of these markers can be impractical and time-consuming, especially in dynamic or unstructured environments.
To overcome the limitations of marker-based systems, recent research has increasingly focused on marker-free solutions by leveraging the advancements in deep learning for object detection and localization. Studies by Vrba et al. [Reference Vrba and Saska25], Schilling et al. [Reference Schilling, Schiano and Floreano20], and Liu et al. [Reference Liu, Ge and Goh15] exemplify this trend, demonstrating the potential of deep learning algorithms in enhancing the capabilities of MRS without the need for physical markers. These solutions utilize onboard cameras and advanced image processing techniques to improve the robots’ situational awareness. However, a significant challenge that persists in the current research landscape is the scalability of these solutions. Much of the existing work on marker-free, deep learning-based localization systems focuses on single-agent systems or small groups of robots. There remains a notable gap in the development of practical, scalable solutions that can be efficiently deployed in larger multi-agent configurations. Addressing this gap is essential for the wider adoption and application of MRS in varied real-world scenarios. Furthermore, previous works have ignored the consistency of the designed relative localization mechanisms with the formation control graph architectures. Accordingly, our work aims at providing a multi-modal relative localization algorithm and providing a formation graph design procedure obeying the localization algorithm’s constraints.
1.3. Contributions
This work introduces an innovative marker-free solution for MRS, employing a combination of range measurements and relative bearing information derived from convolutional neural networks (CNN). This approach is applied within a leader-follower graph network, specifically tailored for formation maneuvering tasks. The key contributions of our study are outlined as follows:
-
• Decentralized localization and formation maneuvering: Our framework showcases a fully decentralized approach to localization and distributed formation maneuvering in MRS. The proposed infrastructure-free approach is shown to be versatile for both indoor and outdoor environments. The marker-free nature of our solution enhances its practicality and scalability.
-
• Integration with hierarchical formation control: We propose a hierarchical formation graph that complies with the sensing requirements of the robots, which results in a minimally persistent graph. Then, we integrate the derived relative localization framework with a distributed and hierarchical formation control algorithm.
-
• Contribution of an open-source dataset: We provide an open-source labeled datasetFootnote 1 for ground robots, specifically designed for both simulation and real-world applications. This dataset, to our knowledge, is the first of its kind for ground vehicles like Turtlebots and Rosbots, contributing significantly to the field by facilitating further research and development.
-
• Realistic simulation and practical experiment: We conducted both a realistic simulation and indoor real-world experiments with real robots to demonstrate the feasibility and validate the effectiveness of the proposed localization framework.
These contributions collectively underscore the novelty and practical applicability of our approach, marking a significant advancement in the field of multi-robot teams.
2. Problem formulation
Consider
 $N$
robotic agents in a 2D Cartesian workspace environment
 $\mathbb {R}^2$
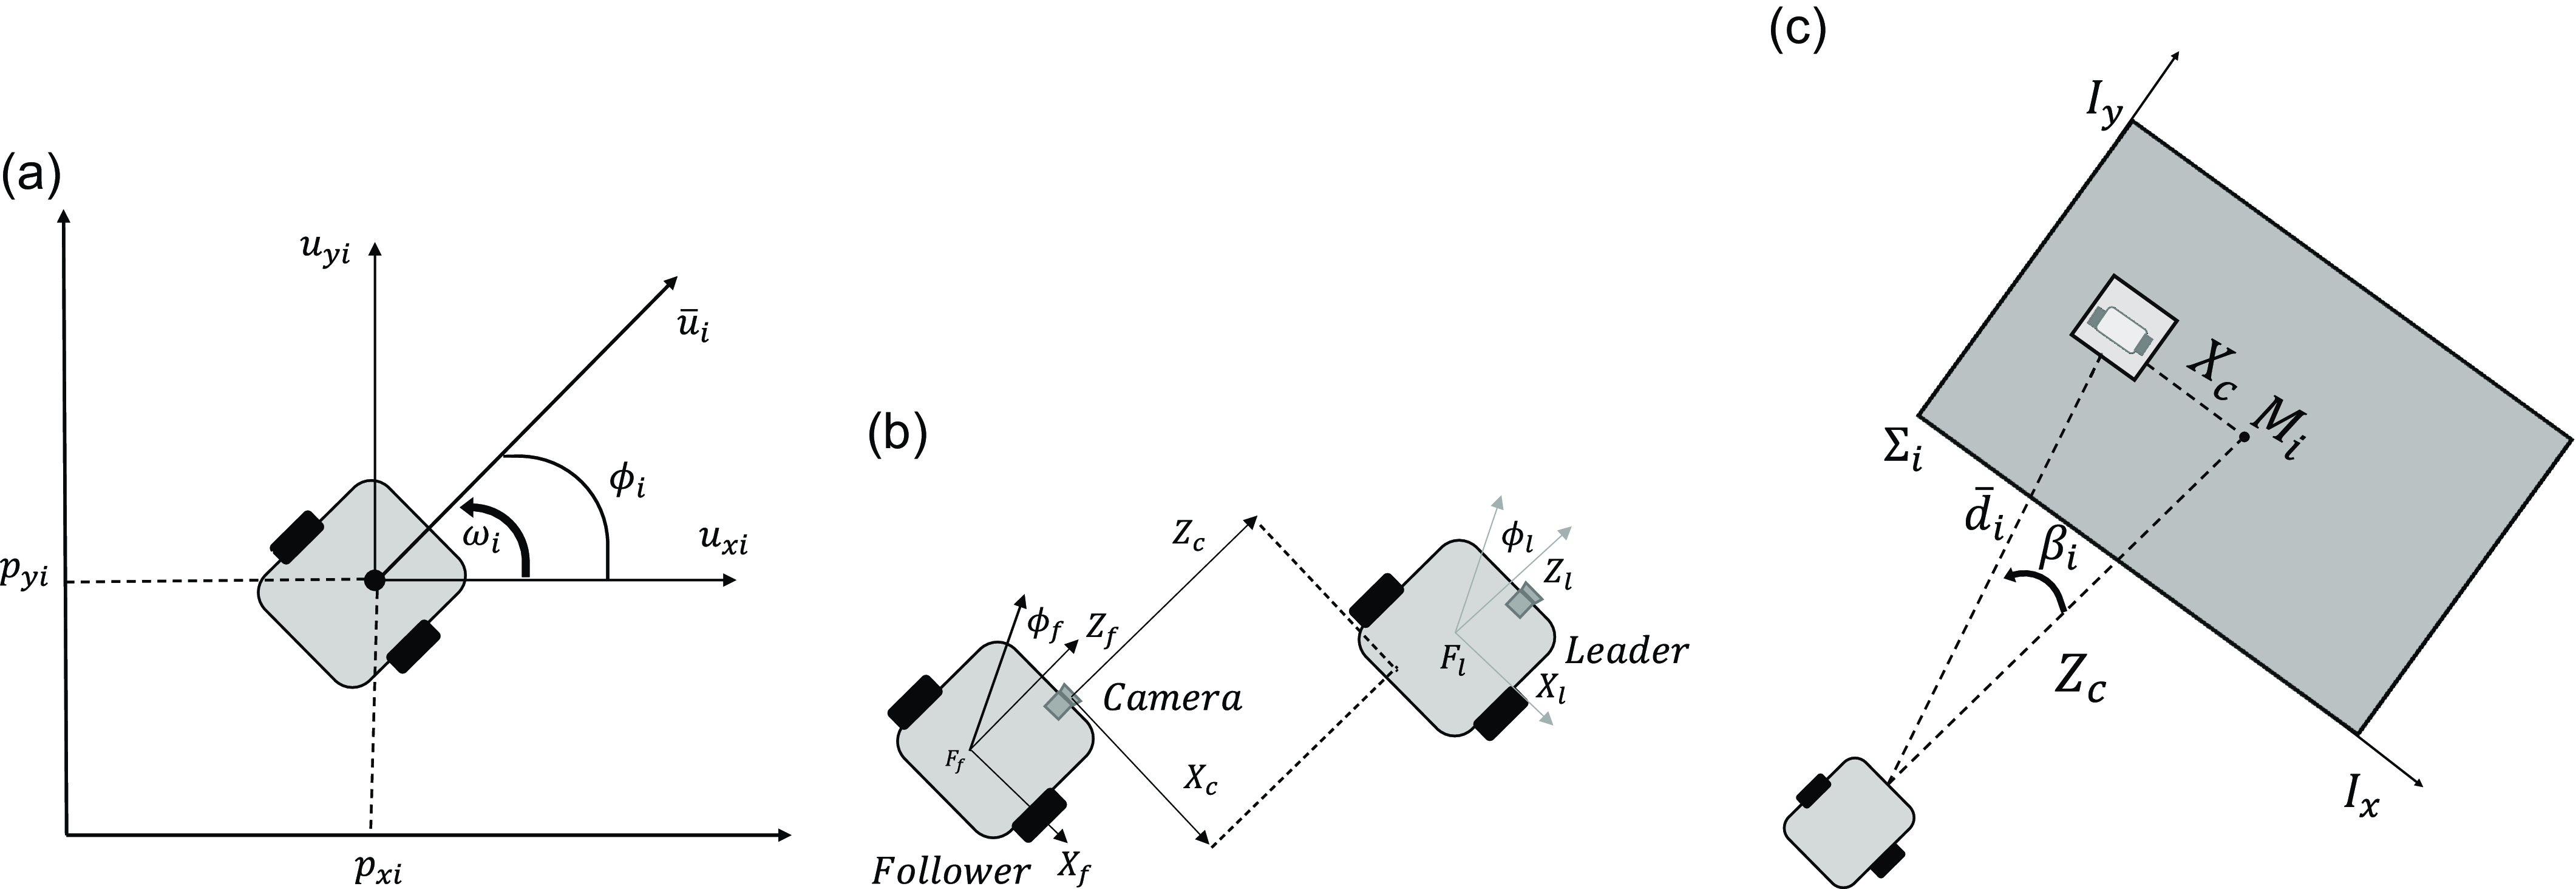
. The agent motions are modeled as the unicycle model as follows (Figure 1):
 \begin{align} \dot {x}_i(t) &= \bar {u}_i \cos {\theta _i}(t) \end{align}
 \begin{align} \dot {y}_i(t) &= \bar {u}_i \sin {\theta _i}(t) \end{align}
 \begin{align} \dot {\theta }_i(t) &= \omega _{i}(t) \end{align}
where
 $p_i(t) = [x_i(t), y_i(t)]^T \in \mathbb {R}^2$
is the position vector,
 $\theta _i(t)$
is the heading angle (i.e., orientation),
 $\bar {u}_i$
is the linear speed,
 $\omega _{i}(t)$
is the angular speed of agent
 $R_{i},\,i\in \{1,\ldots, N\}$
,
 $t\in [0,\infty )$
is the time index, and the superscript
 $T$
denotes the transpose of a matrix or vector. Defining
 $u_i(t)=\dot {p}_i(t)=[u_{xi}(t),u_{yi}(t)]^T\in \mathbb {R}^2$
as the velocity of the agent in the 2D Cartesian workspace, we have that
 $\|u_i(t)\|=\bar {u}_i$
, where
 $\|\cdot \|$
denotes the Euclidean norm.
a) The nonholonomic kinematic model of robot
 $R_i$
; b) The leader-follower network from the camera perspectives; c) A view of a neighbor robot from a follower robot’s camera image.

Each agent
 $R_{i}$
can calculate and measure its own heading
 $\theta _i(t)$
at any time
 $t$
with its onboard sensors. However, the agents do not have the capability to measure or acquire their positions
 $p_{i},\,i\in \{1,\ldots, N\}$
. This assumption reflects the usual real-life robotics application scenarios where the workspace may not contain any global localization aid such as a motion capture system and GPS, and thus, the robots must utilize their onboard sensors for localization and motion control, which is outlined in the following:
Assumption 1. Each robot in the system is assumed to rely exclusively on its onboard perception and computation resources for coordination.
The internal dynamics of the robots are assumed to be handled by a low-level control mechanism which can be designed based on the particular robot type. This approach enables us to focus on the design of high-level control and localization mechanisms. We define the objectives of our work as follows:
Objective 1.
Given a robot swarm
 $\mathcal {S}=\{R_0,R_1,\ldots, R_N\},\,N\geq 2,$
with each
 $R_{i}$
satisfying the kinematics and perception assumptions above, design a relative localization mechanism where every robot estimates its relative position(s) toward its neighbor robot(s).
Objective 2.
Design a formation framework
 $\mathcal {F}=(\mathcal {S},\mathcal {G},\mathcal {Q})$
, where
 $\mathcal {G}$
represents the formation graph and
 $\mathcal {Q}$
is the set of robot configurations so that the robot swarm moves cohesively maneuvering along a predefined trajectory while satisfying the constraints of the designed perception mechanism.
3. The proposed approach: an overview
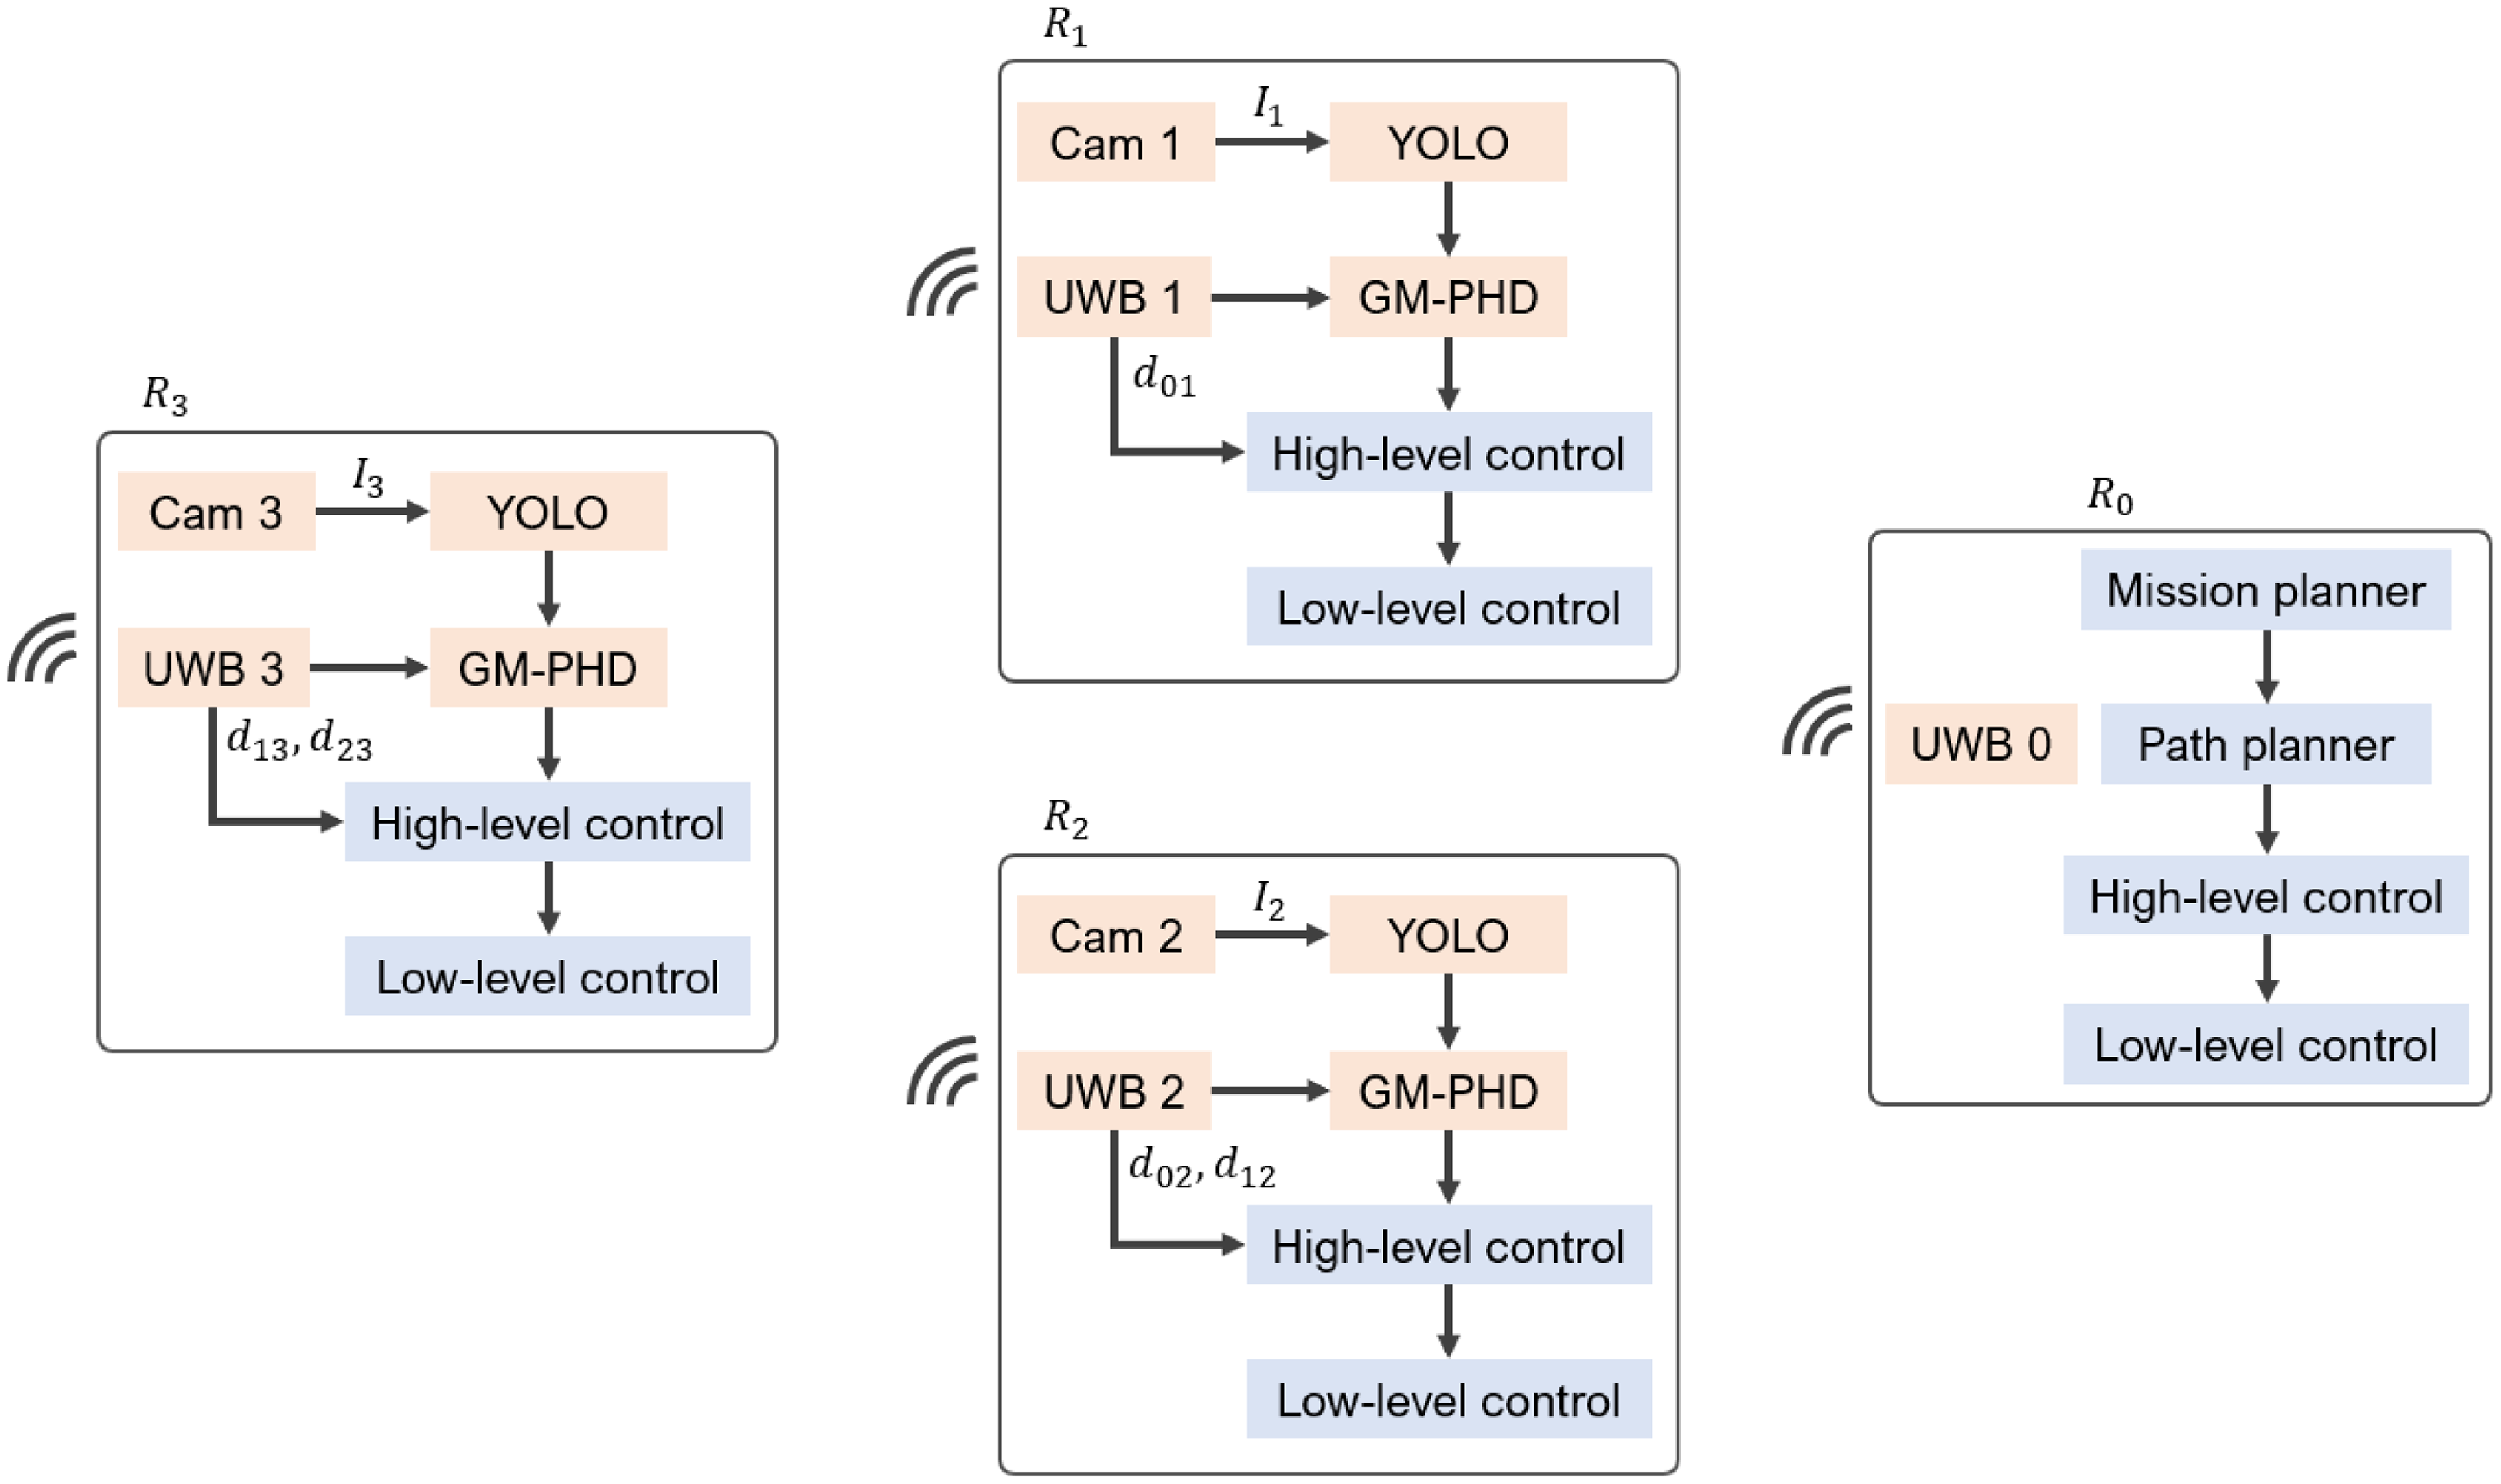
A block diagram illustrating the proposed framework to solve Objectives 2 and 3 for a four-robot system
 $\{R_0,R_1,R_2,R_3\}$
is given in Figure 2. It shows the main components of each robot and the inter-relationships among them. We opt for a distributed and decentralized approach, where each robot is responsible for estimating and controlling the relative positions to their neighbor robots in a formation graph structure. As will be explained in Section 6, since robot
 $R_0$
takes the leader role and guides the rest of the team, it does not possess a visual sensor for the formation control purposes.
A block diagram illustrating the mechanisms integrated within the proposed framework for a four-robot system. The components related to the localization and control layers are given with the orange and blue backgrounds, respectively.

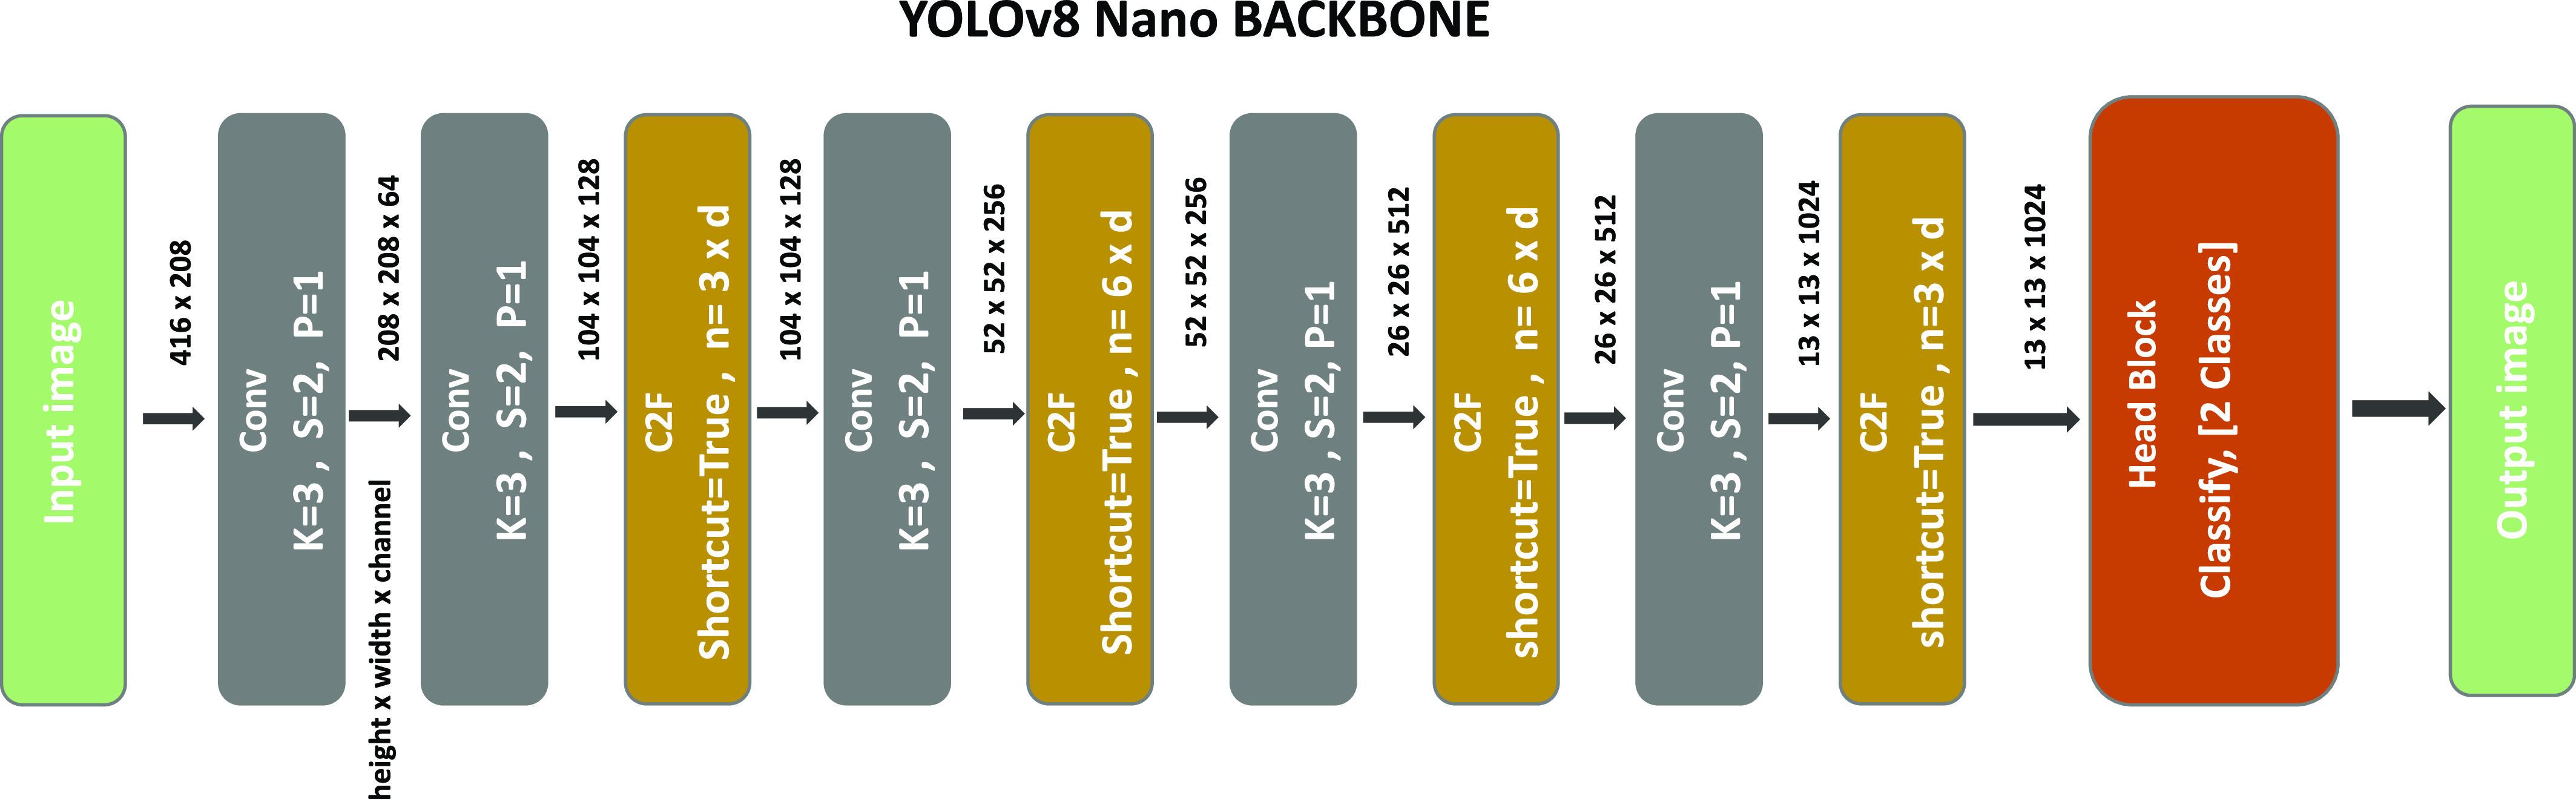
YOLOv8 nano image classification model backbone which forms the base architecture of our custom detection model.

Each robot consists of a localization layer and a control layer. To address Objective 2, we propose a specialized sensing suite for the robots by using two sensing modalities (Sections 4 and 5). Particularly, the localization layer estimates the relative positions between a robot and its neighbors by utilizing an UWB module and a camera sensor. The acquired sensor data are processed with customized CNN (YOLO) and tracking (GM-PHD) algorithms to generate an estimation of the relative positions between robots (Figure 2). These estimated values are fed to the high-level control block that computes the control signals (linear and angular speeds) required for maintaining the formation and achieving Objective 3. This two-step approach aims to ensure a cohesive and coordinated motion of the robots within the swarm, adhering to the specified requirements. The low-level controller, which is assumed to be embedded in the robots, controls the low-level force/torque dynamics to match the speed outputs with their desired values.
In the design process of the high-level controller, we propose a method to build the formation configuration that respects the constraints imposed by the designed perception mechanism (Section 6). Particularly, the distances between two neighbor robots should obey the camera field-of-view (FOV) constraints and the reliable object detection range limitations to ensure continuous operation.
4. Relative localization mechanism
In an MRS application, as the number of agents or the spatial area expands, relying on a centralized positioning infrastructure can become prohibitively costly. Therefore, utilizing formation control aided by onboard sensors becomes imperative. To design a distributed and decentralized framework and to address Objective 2, we propose a localization approach based on onboard distance and vision data, acquired from low-cost monocular cameras and UWB sensors on the robots. In this section, we provide a detailed description of our distance and bearing angle computation structure with an analysis of the measurement characteristics of both sensors.
4.1. Object detection
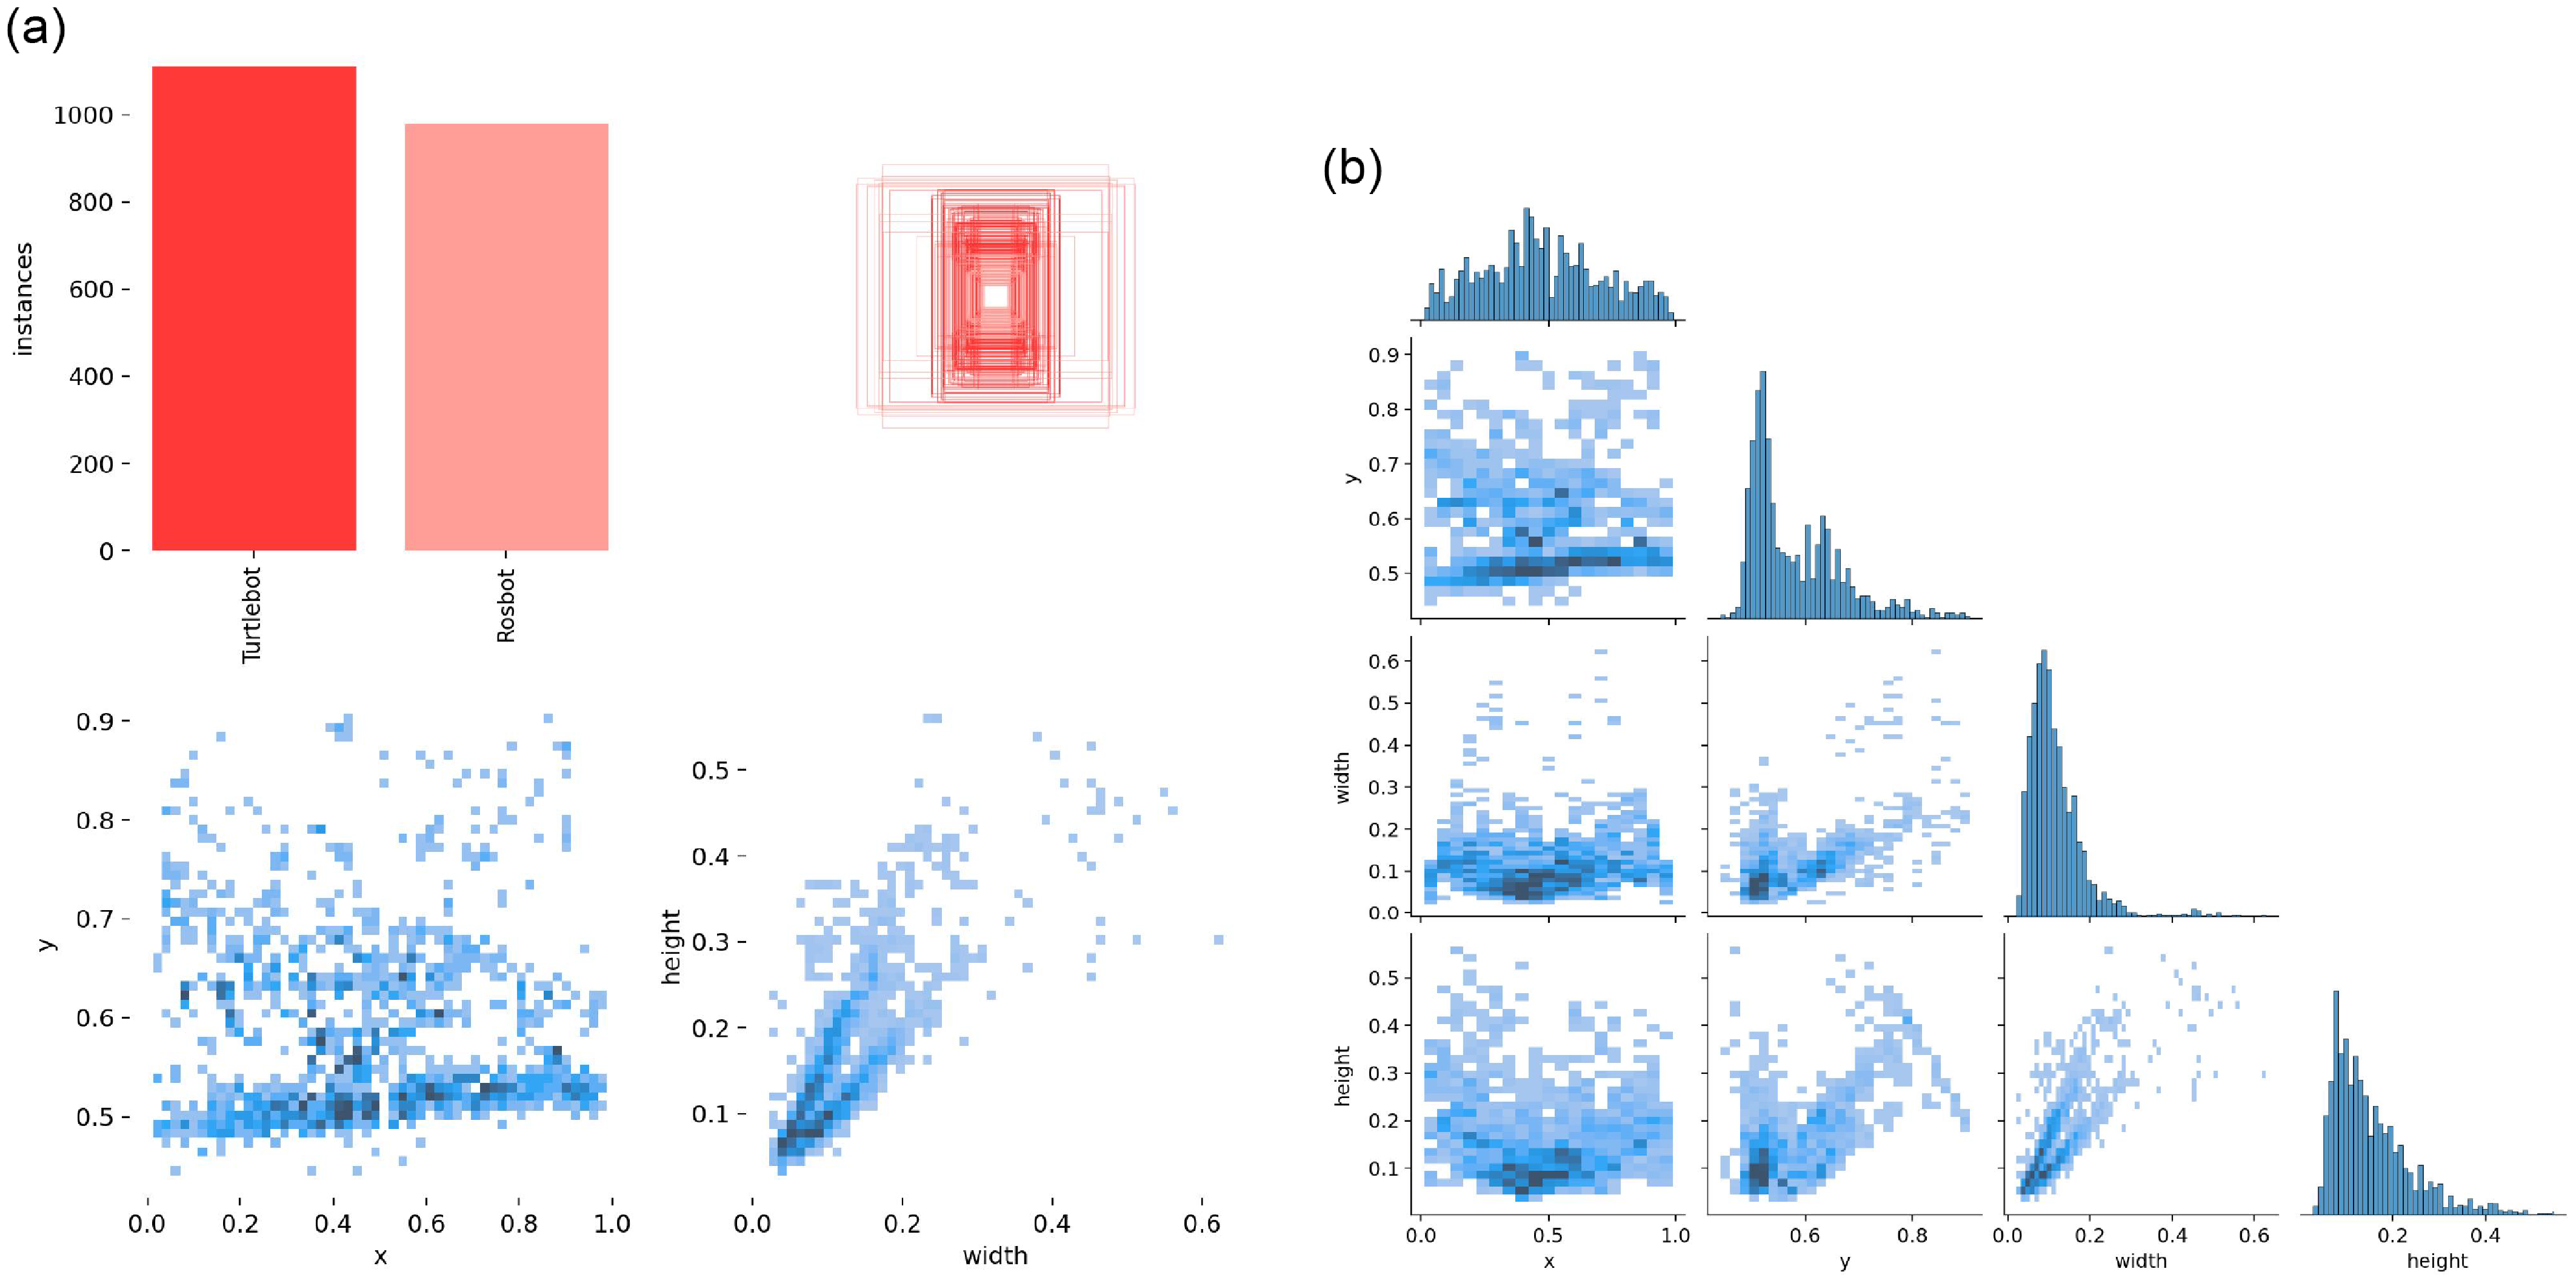
The statistics of the dataset used for real experiments: a) The descriptions of the images and the object classes, b) The correlation graphs of the items in the datasets.

While the earlier studies on object detection focused on feature extraction [Reference O’Mahony, Campbell, Carvalho, Harapanahalli, Hernandez, Krpalkova, Riordan and Walsh17], most of the current methods rely on deep learning techniques, by designing a network that can classify object classes and recognize objects in image frames. Notably, the convolutional neural network is the most advanced method for object detection. Accordingly, several CNN architectures have been developed to enhance the accuracy of object detection on the Common Object in Context (COCO) dataset [Reference Lin, Maire, Belongie, Hays, Perona, Ramanan, Dollár and Zitnick14].
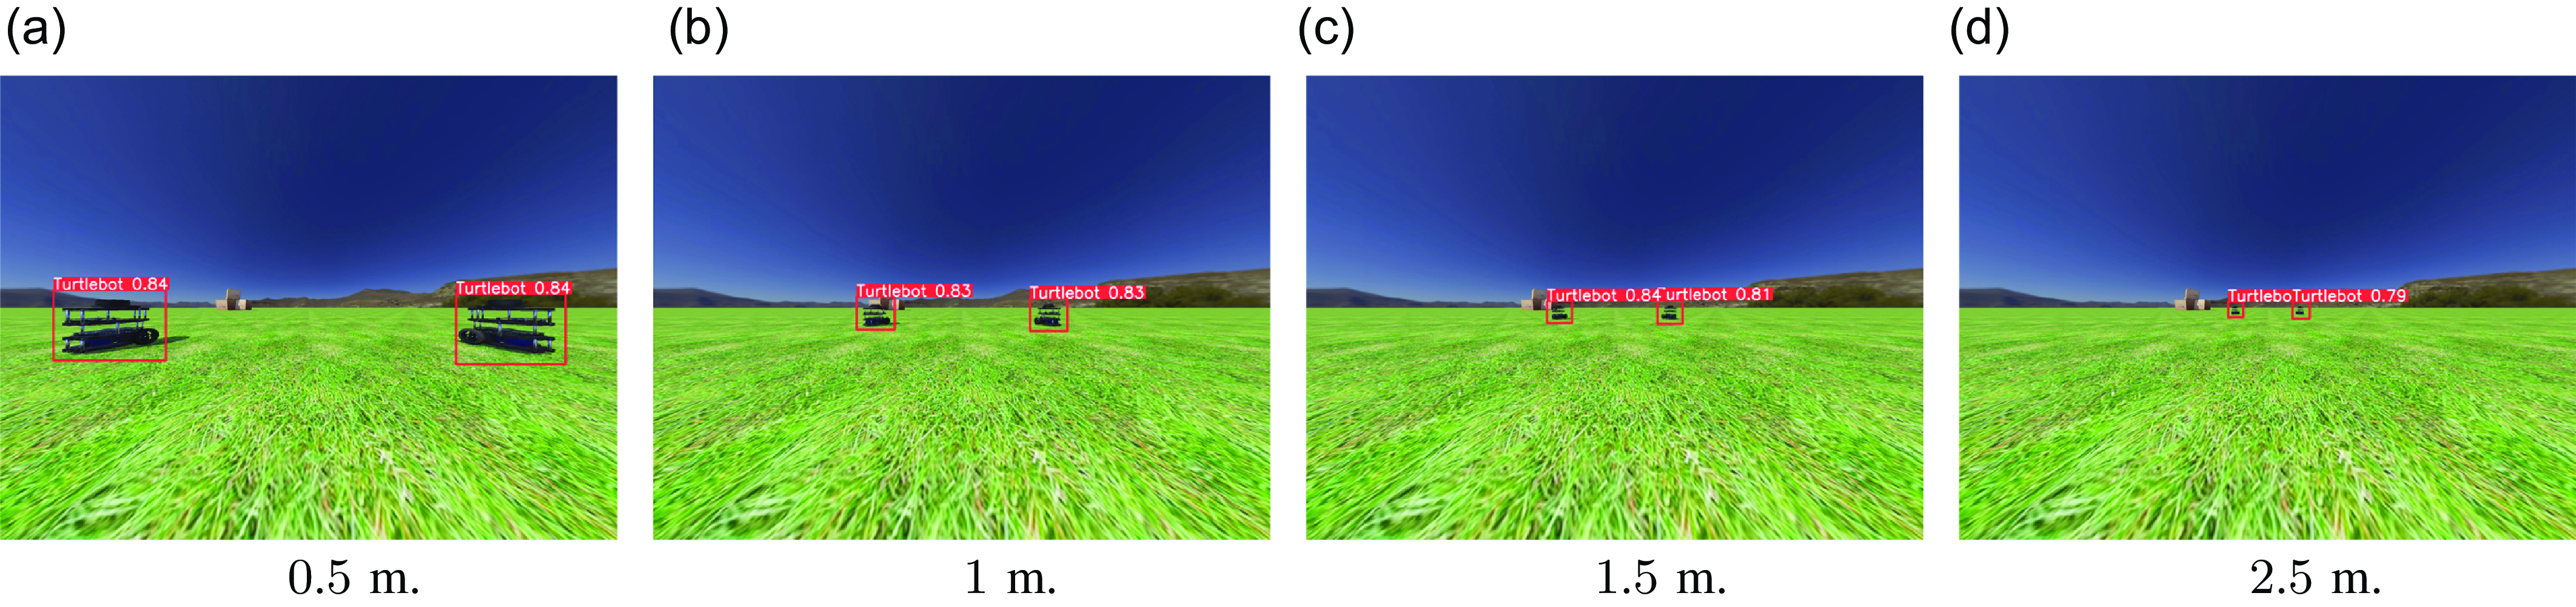
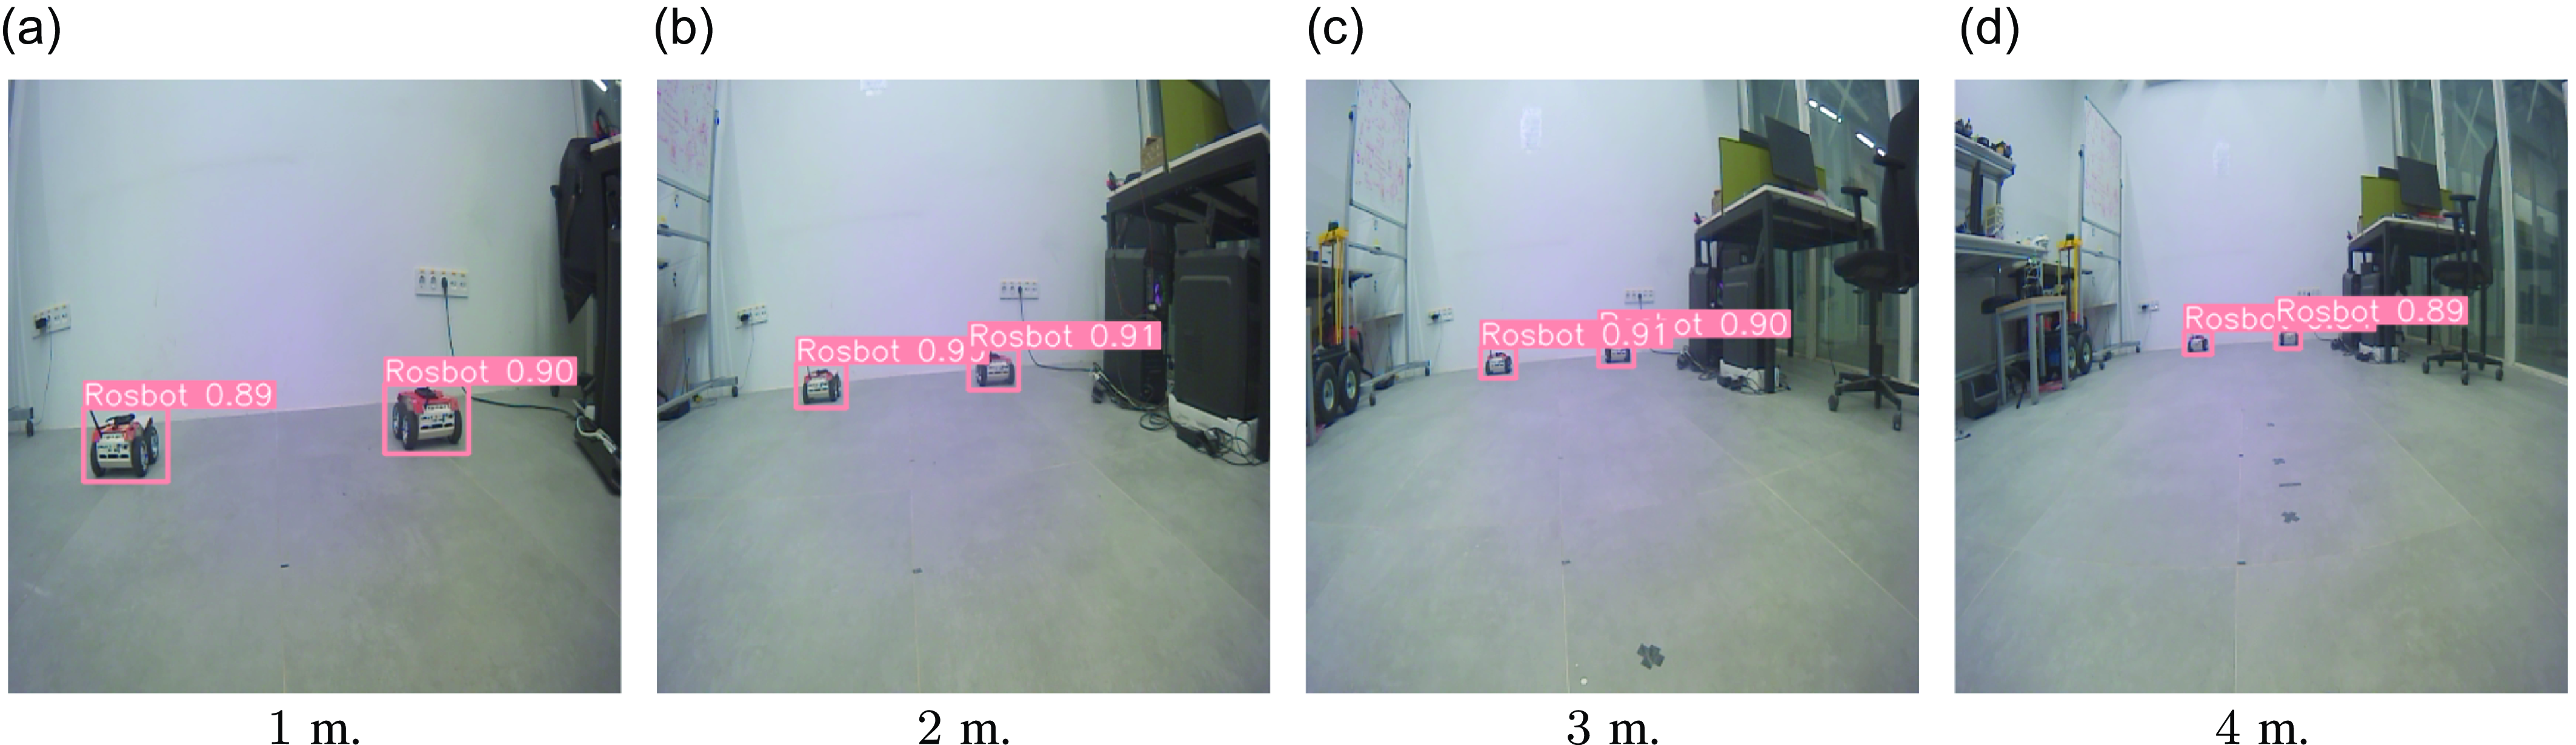
Since the performance of a deep learning model highly depends on the quality of its training data, and no dataset was available for mobile robots, our deep learning process started with generating a dataset. First, we built two image datasets (one for simulation and one for experiments) for training the model. In the simulation, we collected images from a series of image captures from Gazebo and Webots simulations, while for experiments, the robots were randomly moved in an indoor environment, and the camera frames were saved in a pool of images. The simulation dataset contained
 $1451$
images with a single class output (Figure 3) whereas the real experiment dataset contained
 $2130$
images with two classes (which correspond to two robot shapes), in both closed and outdoor environments (Figure 4). These images were labeled manually, which consisted of drawing the bounding boxes of the target on each image frame and assigning the detection to the proper class. As usual, the images were split into three datasets before the training: Training (80%), validation (10%), and testing (10%).
We employed the Ultralytics frameworkFootnote
2
for the training phase, opting for the YOLOv8 nano architecture to enhance detection speed during operation Figure 5. For each of the simulation and experimental environments, an individual CNN training was conducted with our custom robot training datasets, specifically curated for detecting ground robots in both simulated and real-world environments, on a desktop computer with a GeForce GTX 1660 Ti GPU to produce the required model weights. To expedite the training process, we initialized the network weights by using the YOLOv8 nano model pre-trained with the COCO dataset [Reference Lin, Maire, Belongie, Hays, Perona, Ramanan, Dollár and Zitnick14] and used the Stochastic Gradient Descent (SGD) algorithm, augmented with momentum for improved convergence. Key training parameters included a momentum setting of
 $0.937$
, a batch size of
 $16$
, and an initial learning rate of
 $10^{-2}$
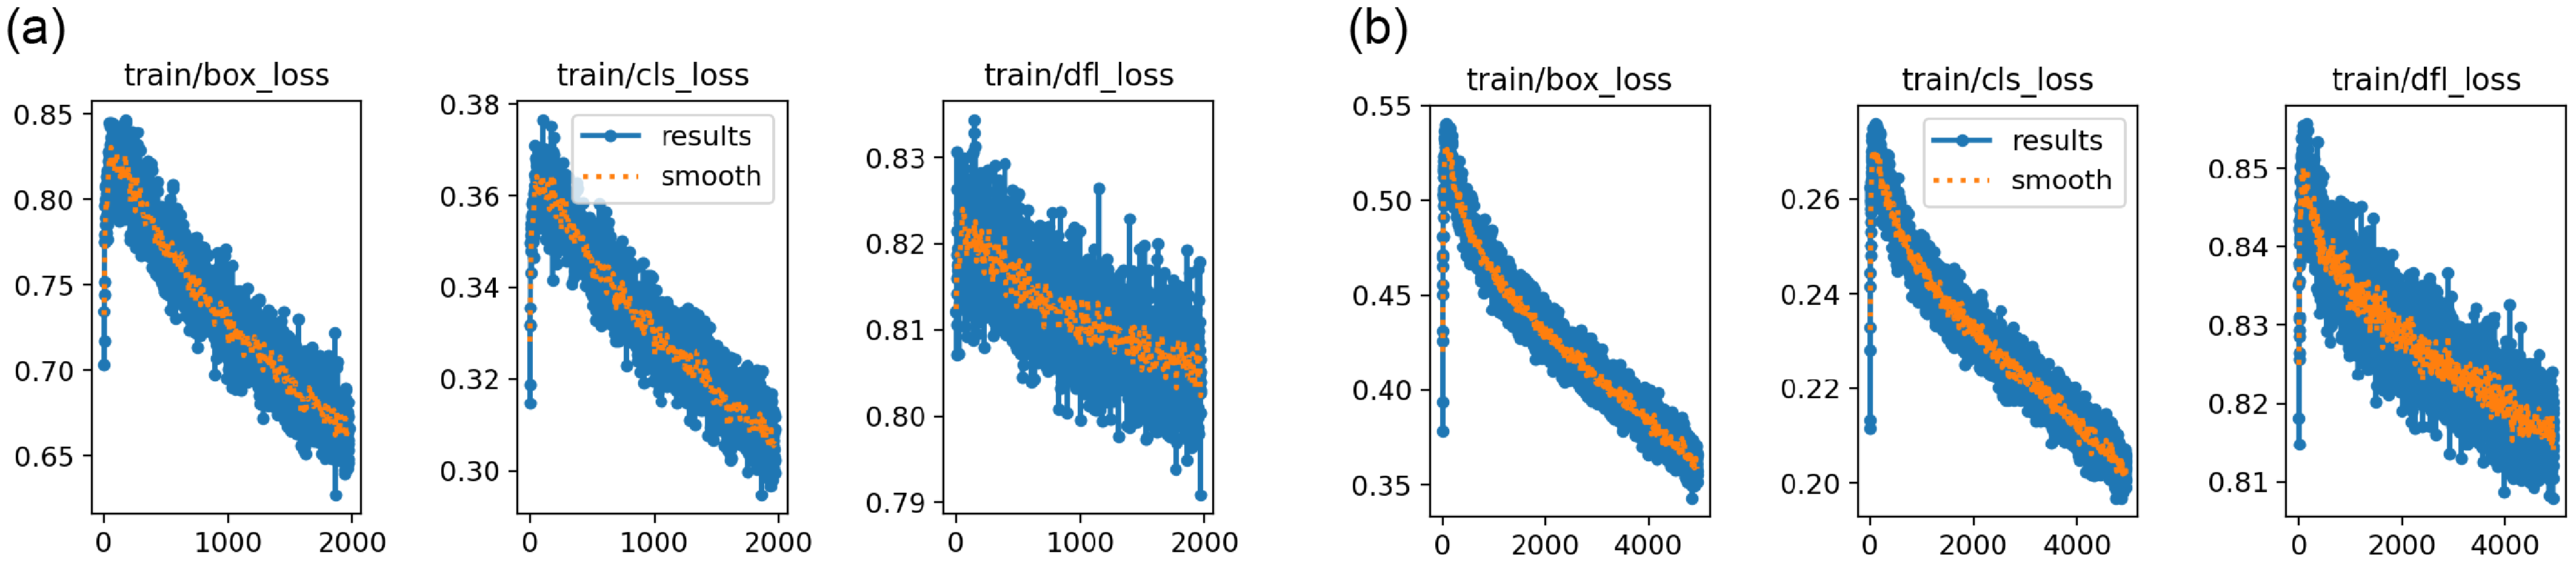
. We continued the training until there was no further obvious improvement in the loss scores on the test dataset (Figure 6). Statistics of the training datasets can be seen in Figure 7. Subsequently, we converted the model to TensorRT format to ensure compatibility with the Jetson GPU models used on the robots in the experiments. This conversion allowed for faster inference on the Jetson platform, as it is optimized for the NVIDIA architecture.
The results of the CNN training on the datasets: The loss of the boxes, the object classification, and the Directional Feature Learning (DFL) a) On simulation dataset, b) On experimental Dataset.

Detections at different distances in the simulation environment.

Detections at various distances in a room.

4.2. Sensor characteristics and distance and bearing angle estimation
The goal of the localization algorithm is to produce the relative positions between each pair of robots in a MRS, which can be achieved by measuring the distance and bearing angles between the robots. On one side, a UWB sensor pair can produce omnidirectional distance measurements by applying the time-based algorithms such as time-of-flight (TOA) and time-difference-of-arrival (TDOA). As a result of communicating at large bandwidths, they generate distance data remarkably robust to noise.Footnote 3 On the other side, camera sensors provide enormous information from image views. Remarkably, when integrated with the recent deep learning methods, they can be used for generating the relative bearing angle between robots. In this part, we aim to present the advantages of fusing distance and vision sensing modalities on the system performance by providing a comparative analysis.
The YOLO algorithm generates a bounding box around the detected robot as explained in Section 4.1. Thus, the presence of a neighbor robot can be detected on a robot’s camera. We conducted a set of experiments to analyze further if this detection result can be used to calculate the distance between the two robots and how it compares with the UWB distance measurements in terms of the error performance. In the first test series, we placed the robots in a line configuration where the detected robot resides in front of the detecting robot. In the second test series, the detecting robot was placed in a diagonal configuration so that both sides of the detected robot could be seen by the detecting robot. The distances between the robots were set to between
 $0.6$
m and
 $4.8$
m, with
 $0.2$
m increments. At each distance configuration, the areas of the detected bounding boxes were recorded in
 $500$
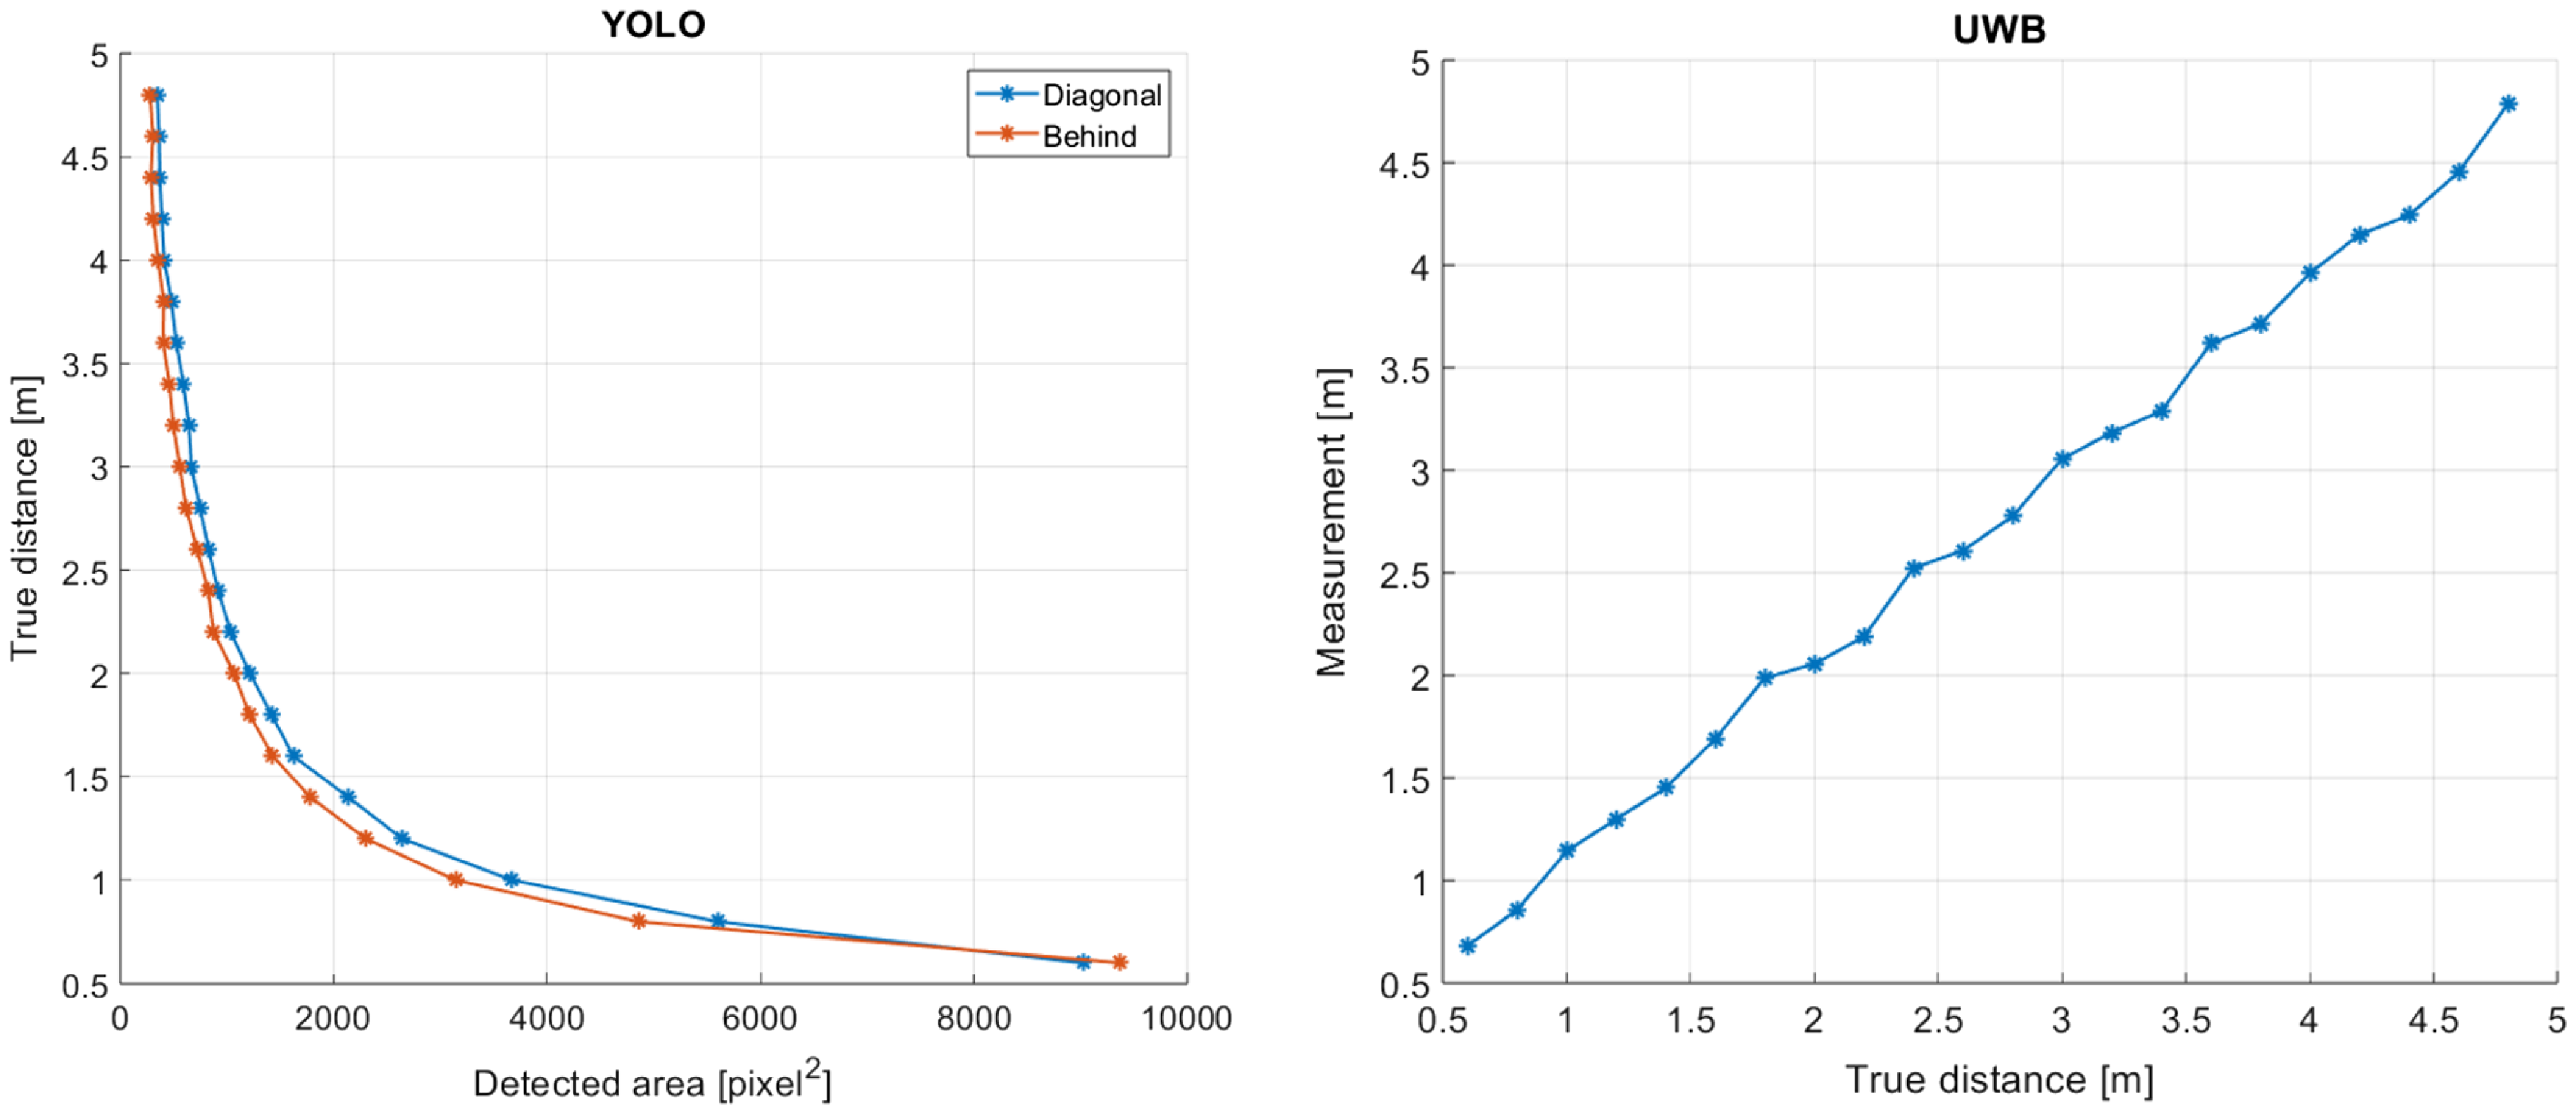
frames. The mean values of these areas versus the true distances are shown in Figure 8a. Also, the variances of the
 $500$
recordings can be seen in Figure 9.
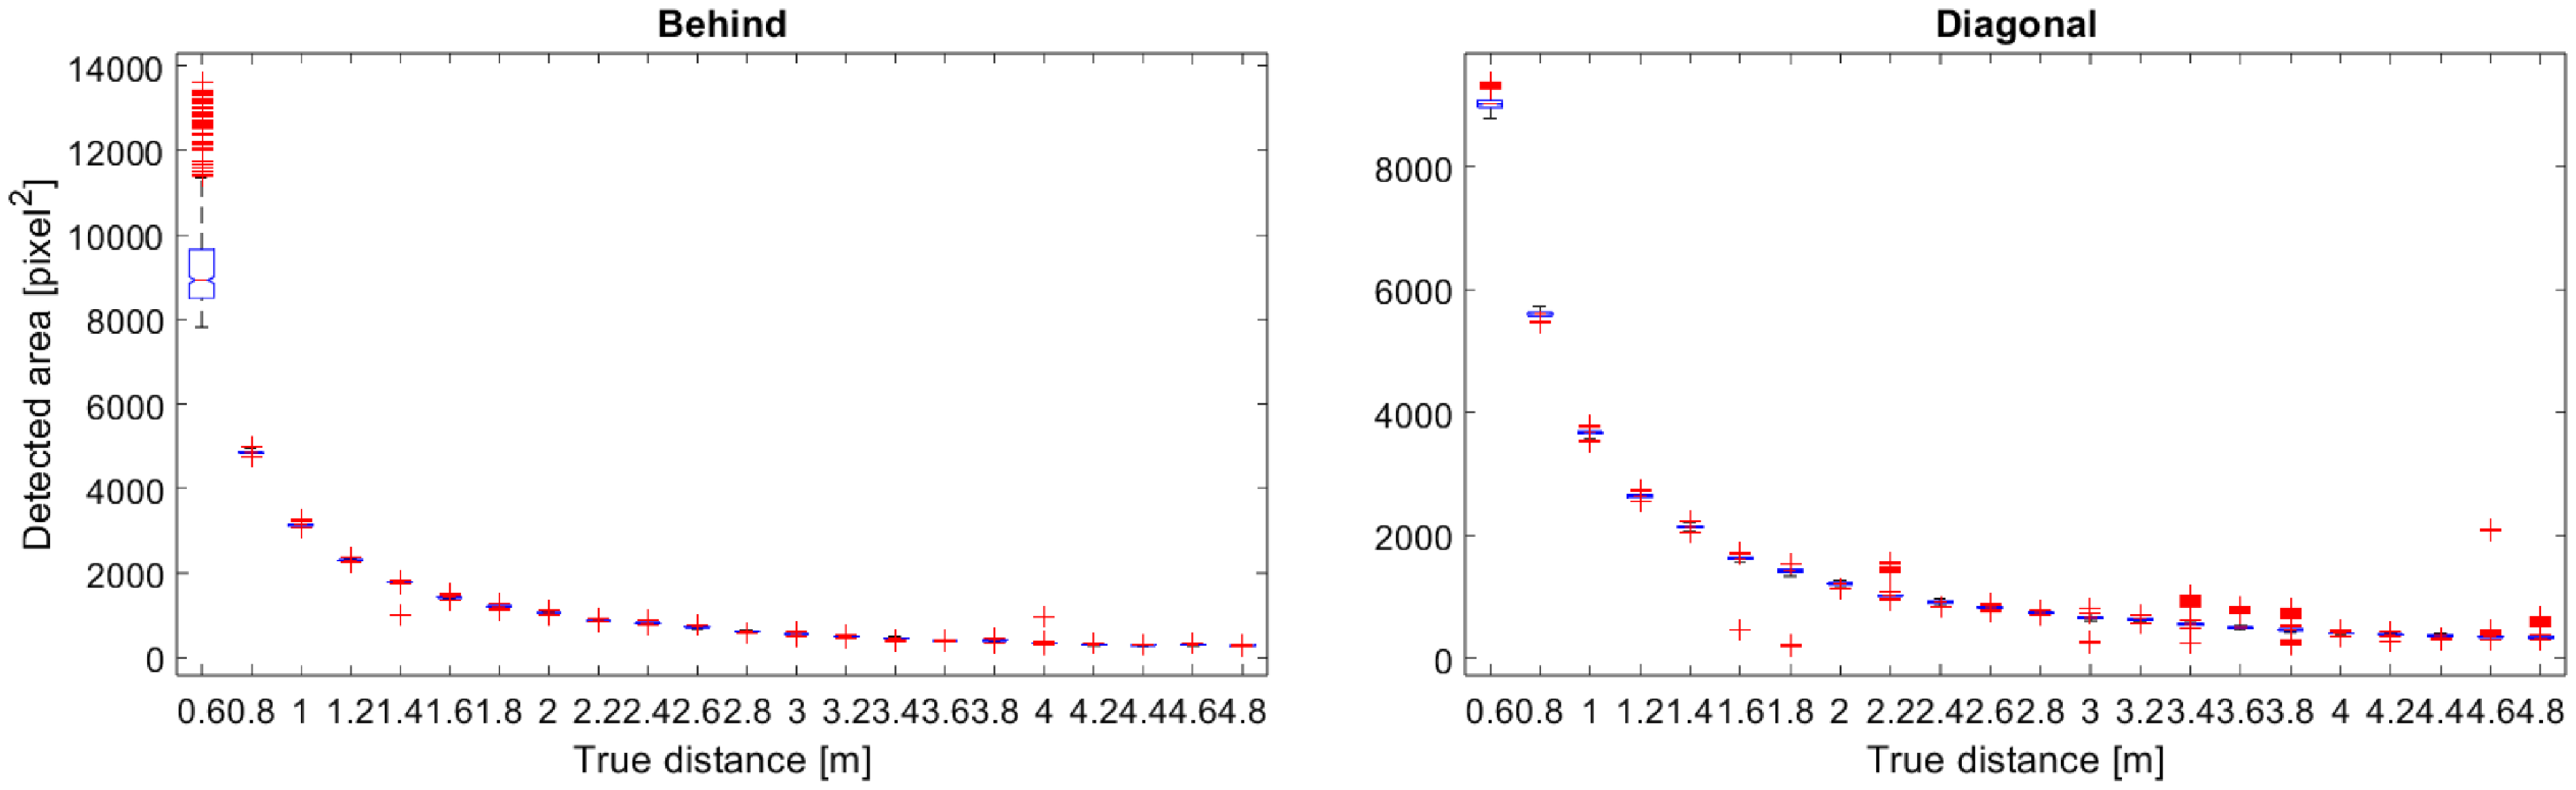
From Figure 8a and Figure 9, one can deduce that the variances of the recordings are so small that a function can be fit so that a distance estimation can be obtained for a detected box area. However, there are two drawbacks to this approach. First, since the detection does not give any clue about the robots’ configuration (behind or diagonal), inconsistency can easily occur in distance estimations. For instance, for a detected box area of
 $400$
, the behind configuration produces
 $3$
m, whereas the diagonal configuration produces
 $3.4$
m (Figure 8a). This inconsistency increases as the inter-robot distance increases. Second, the difference in the pixel values dramatically reduces as the inter-robot distance increases, which requires discriminating two distances by a few pixel differences. The performance gets even worse when we consider the different configurations of the two robots. On the other hand, the UWB sensor’s distance profile shows almost linear behavior at all evaluated distance values, thanks to the TOA mechanism (Figure 8b). Therefore, we use UWB sensors for distance measurements as it remains a more viable and robust approach compared to bounding box postprocessing.
Distance measurement comparison between YOLO and ultrawideband (UWB) sensors. Left: The area of the detected bounding box versus the true distances between the robots, Right: Mean values of the UWB measurements versus the true distances between the robots.

Variances of the converted distance measurements with YOLO. Left: Behind configuration, Right: Diagonal configuration.

Although YOLO output performs poorly in distance estimation, it provides high accuracy in bearing angle estimation. In the proposed framework, the bounding box locations are used to derive the relative bearing angle between the detected and the detecting robots. Referring to Figure 1b and Figure 1c, on an image of size of
 $I_x\times I_y$
, denote the center of the image plane by
 $c=(I_x/2,I_y/2)$
in pixels. On an image frame, a YOLO detection produces
 $K$
bounding boxes as
 $B_{i}=(x_{i},y_{i},w_{i},h_{i}),\,i=(1,\ldots, K)$
corresponding to
 $K$
robots in the frame, where
 $x_{i},\,y_{i}$
denote the coordinates of the left-bottom corner, and
 $w_{i},\,h_{i}$
denote the width and height of the
 $i$
th detected box in pixels. Thus, the horizontal center of the box is found as
 $m_{i}=x_{i}+w_{i}/2$
. Then, the metric value
 $X_c$
in Figure 1c can be obtained by
 $X_c = (I_x/2 - m_i) p_{x}\bar {d}_i\mu$
, where
 $p_{x}$
denotes the pixel size of the camera,
 $\bar {d}_i$
is the distance between the two robots which is obtained from the UWB sensors, and the constant
 $\mu$
is obtained from the camera calibration. Accordingly, the bearing angle
 $\beta _i$
is calculated, which, in combination with
 $\bar {d}_i$
, defines the relative position between a robot
 $R_i$
and its neighbor
 $R_j$
in the local frame of robot
 $R_i$
.
5. Target tracking
In the previous section, the relative position estimation mechanism between two robots is given, which utilizes the camera and UWB sensors to generate the estimations of the distance and bearing angles using a single image frame and a single measurement. To implement a distributed MRS, accurately tracking the detected robots in a stream of the image frames is equally important. In this section, we present our target tracking approach which aims to track the detected targets continuously. Since we are concerned with a scalable MRS of more than two robots, the multiple target tracking problem is investigated.
Gaussian Mixture Probability Hypothesis Density (GM-PHD) filter allows for the estimation of multiple targets in a dynamic environment. It is based on the idea of representing the probability distribution of multiple targets using a mixture of Gaussian components. By utilizing the GM-PHD algorithm, accurate and efficient tracking of multiple targets in a dynamic environment becomes possible. By combining the principles of probability hypothesis density and Gaussian mixture modeling, the GM-PHD can effectively estimate the number of targets as well as their individual states without the need for explicit data association [Reference Vo and Ma24]. In our system, GM-PHD is applied to track the relative position between the robots by using camera frames and distance measurements.
The GM-PHD filter processes a set of relative localization measurements, denoted as
 $\mathcal {Z}_{k}=\left \{\mathbf {z}_{k, 1}, \ldots, \mathbf {z}_{k, M_{k}}\right \}$
, to compute an output set of agent states
 $\mathcal {X}_{k}=\left \{\mathbf {x}_{k, 1}, \ldots, \mathbf {x}_{k, J_{k}}\right \}$
at each discrete time step
 $k$
. These states are represented as a single intensity,
 $v_{k}\left (\mathbf {x}_{k}\right )$
, expressed as a weighted sum of Gaussian components:
 \begin{equation*} v_{k}\left (\mathbf {x}_{k}\right )=\sum _{i=1}^{J_{k}} w_{k}^{(i)} \mathcal {N}\left (\mathbf {x}_{k} ;\, \mathbf {m}_{k}^{(i)}, \mathbf {P}_{k}^{(i)}\right ) \end{equation*}
where
 $w_{k}^{(i)}$
signifies the weight associated with each of the
 $J_{k}$
Gaussian components, defined by mean
 $\mathbf {m}_{k}^{(i)}$
and covariance
 $\mathbf {P}_{k}^{(i)}$
. Each Gaussian component undergoes propagation through a prediction and update step. The prediction step is formalized as follows:
 \begin{equation*} v_{k \mid k-1}\left (\mathbf {x}_{k}\right )=\sum _{i=1}^{J_{k}} w_{k \mid k-1} \mathcal {N}\left (\mathbf {x}_{k} ;\, \mathbf {m}_{k \mid k-1}^{(i)}, \mathbf {P}_{k \mid k-1}^{(i)}\right )+\gamma \left (\mathbf {z}_{k}\right ) \end{equation*}
with corresponding weight, mean, and covariance given by:
 \begin{equation*} \begin{aligned} w_{k \mid k-1}^{(i)} & =p_{s, k} w_{k-1}^{(i)} \end{aligned} \end{equation*}
The mean
 $\mathbf {m}_{k \mid k-1}^{(i)}$
and the covariance
 $\mathbf {P}_{k \mid k-1}^{(i)}$
follows an Extended Kalman Filter (EKF) with a transition model
 $\mathbf {m}_{k \mid k-1}^{(i)}=f(\mathbf {x}_{k-1}, \mathbf {u}_{k})$
with a state model
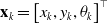 $\mathbf {x}_{k}=\left [x_{k}, y_{k}, \theta _{k}\right ]^{\top }$
, velocity input
 $\mathbf {u}_{k}=\left (v_{k}, \omega _{k}\right )$
and the linearized Jacobian matrix :
 \begin{equation*} \mathbf {F}_{k-1}=\frac {\partial f\left (\mathbf {x}_{k-1}, \mathbf {u}_{k}\right )}{\partial \mathbf {x}_{k-1}}=\left [\begin{array}{c@{\quad}c@{\quad}c} 1 & 0 & v_k \delta k\cos \theta _k \\[3pt] 0 & 1 & v_k \delta k\sin \theta _k \\[3pt]0 & 0 & 1\\ \end{array}\right ] . \end{equation*}
 $\mathbf {Q}_{k-1}$
is the process noise covariance and the survival probability after the prediction step is denoted by
 $p_{s, k}$
. The birth model
 $\gamma _{k}\left (\mathbf {z}_{k}\right )$
generate new Gaussian components with weight
 $w_{\gamma }$
, mean
 $\mathbf {m}_{\gamma }$
, and covariance
 $\mathbf {P}_{\gamma }$
.
The update step is formulated as:
 \begin{equation*} \begin{aligned} v_{k}\left (\mathbf {x}_{k}\right ) & =\left (1-p_{d, k}\right ) v_{k \mid k-1}\left (\mathbf {x}_{k}\right ) & +\sum _{\mathbf {z}_{k} \in Z_{k}} \sum _{i=1}^{J_{k}} w_{k}^{(i)}\left (\mathbf {z}_{k}\right ) \mathcal {N}\left (\mathbf {x}_{k} ;\, \mathbf {m}_{k \mid k}^{(i)}\left (\mathbf {z}_{k}\right ), \mathbf {P}_{k \mid k}^{(i)}\right ) \end{aligned} \end{equation*}
with corresponding weight, mean, and covariance given by:
 \begin{equation*} \begin{aligned} w_{k}^{(i)}\left (\mathbf {z}_{k}\right ) & =\frac {p_{d, k} w_{k \mid k-1}^{(i)} q_{k}^{(i)}\left (\mathbf {z}_{k}\right )}{\kappa _{k}\left (\mathbf {z}_{k}\right )+\sum _{j=1}^{J_{k \mid k-1}} p_{d, k} w_{k \mid k-1}^{(j)} q_{k}^{(j)}\left (\mathbf {z}_{k}\right )} \\ \mathbf {m}_{k \mid k}^{(i)}\left (\mathbf {z}_{k}\right ) & =\mathbf {m}_{k \mid k-1}^{(i)}+\mathbf {K}_{k}^{(i)}\left (\mathbf {z}_{k}-\mathbf {H}_{k} \mathbf {m}_{k \mid k-1}^{(i)}\right ) \\ \mathbf {P}_{k \mid k}^{(i)} & =\left (\mathbf {I}-\mathbf {K}_{k}^{(i)} \mathbf {H}_{k}\right ) \mathbf {P}_{k \mid k-1}^{(i)} \end{aligned} \end{equation*}
and
 \begin{equation*} \begin{aligned} q_{k}^{(i)}\left (\mathbf {z}_{k}\right ) & =\mathcal {N}\left (\mathbf {z}_{k} ; \mathbf {H}_{k} \mathbf {m}_{k \mid k-1}^{(i)}, \mathbf {H}_{k} \mathbf {P}_{k \mid k-1}^{(i)} \mathbf {H}_{k}^{\top }+\mathbf {R}_{k}\right ) \\ \mathbf {K}_{k}^{(i)} & =\mathbf {P}_{k \mid k-1}^{(i)} \mathbf {H}_{k}^{\top }\left (\mathbf {H}_{k} \mathbf {P}_{k \mid k-1}^{(i)} \mathbf {H}_{k}^{\top }+\mathbf {R}_{k}\right )^{-1} \end{aligned} \end{equation*}
where
 $\mathbf {H}_{k}$
is the measurement matrix and
 $\mathbf {R}_{k}$
is the measurement noise covariance.
The observation model is nonlinear and consists of measurements of range and bearing:
 \begin{equation*} h\left (\mathbf {x}_{k}\right )=\left [\begin{array}{c} r(x_{k},y_{k}) \\ \beta (x_{k},y_{k}) \end{array}\right ]=\left [\begin{array}{c} \sqrt {x_{k}^{2}+y_{ k}^{2}} \\ \operatorname {atan2}\left (y_{k}, x_{k}\right ) \end{array}\right ] \end{equation*}
where we use the two-argument function atan2 to avoid ambiguities in the conversion from cartesian to polar coordinates. We linearize the measurement model by computing the Jacobian with respect to the state as:
 \begin{equation*} \mathbf {H}_{k}=\frac {\partial h\left (\mathbf {x}_{k}\right )}{\partial \mathbf {x}_{k}}=\left [\begin{array}{ccc} \frac {x_{k}}{\sqrt {x_{ k}^{2}+y_{ k}^{2}}} & \frac {y_{ k}}{\sqrt {x_{k}^{2}+y_{k}^{2}}} & 0 \\ -\frac {\mathbf {0}_{2}}{x_{k}^{2}+y_{k}^{2}} & \frac {y_{k}^{2}}{x_{k}^{2}+y_{k}^{2}} & 0 \end{array}\right ] . \end{equation*}
The detection probability during the update step is denoted by
 $p_{d, k}$
, and false positive detections are modeled as clutter
 $\kappa _{k}$
.
In the filtering process, the number of Gaussian components increases with each iteration, leading to potential computational challenges. To maintain efficient tracking performance, we apply a three-step pruning strategy:
-
1. Pruning: Components with a weight below a certain threshold,
 $T$
, are discarded. This reduces the number of components to a manageable level without significantly impacting the overall accuracy.
-
2. Merging: Components that are very close to each other, as determined by a Mahalanobis distance less than threshold
$U$
, are merged. This step helps in reducing redundancy among the components. -
3. Selection: Out of the remaining components, only the top components, based on their weights, are retained. This step ensures that only the most significant components are considered, enhancing the efficiency of the process.


This streamlined approach helps in managing the complexity of the filter, ensuring fast and effective tracking performance.
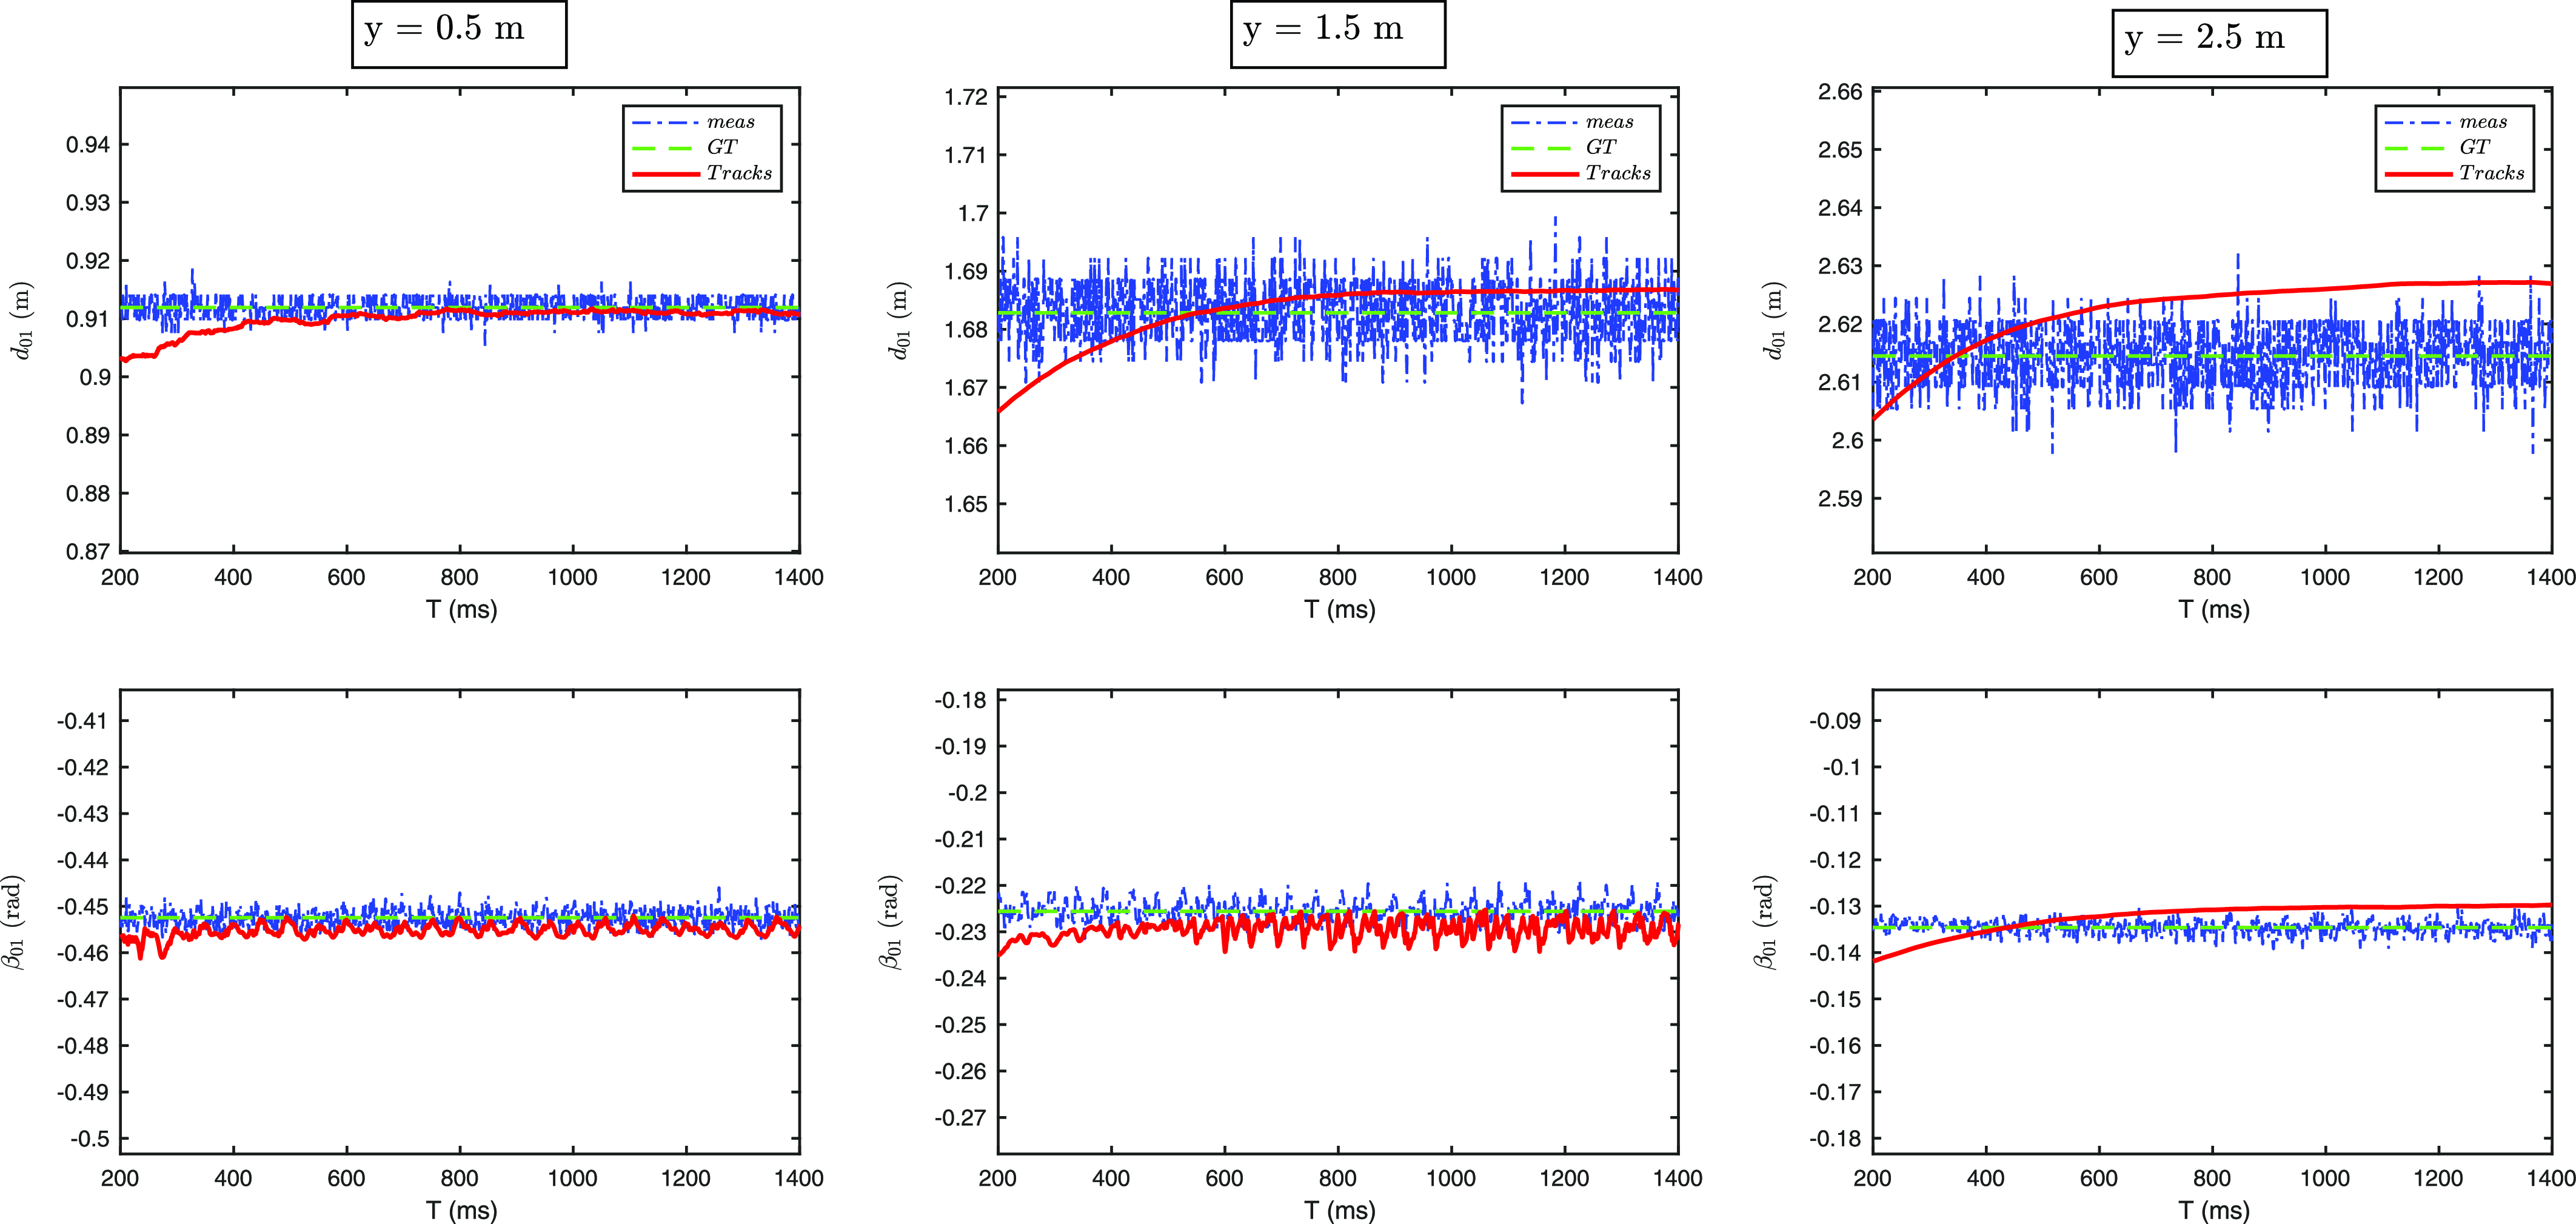
To specifically evaluate the performance of the Gaussian Mixture Probability Hypothesis Density (GMPHD) filter, we designed a tracking scenario where we measured the filter’s performance at multiple distances. The agents consisted of a follower and two leader robots. The two leaders were particularly placed at equidistant relative distances from the follower robot on the x-axis respectively 0.76 m and -0.76 m, creating a setup where the measurements varied based on their y-axis relative distances. During the evaluation, all three robots were given a constant velocity as input. We then executed the GMPHD filter on this scenario and recorded the results. The performance of the GMPHD filter was evaluated by analyzing its ability to accurately track the positions of the follower robot’s relative distance and bearing to the two leader robots at 0.5 m, 1.5 m, and 2.5 m. We have compared the performance of the GMPHD filter at different distances by analyzing its tracking output to the ground truth (GT) and the measurement (meas). The performance can be observed from the following plots, which show the results of the evaluation at multiple distances Figure 10.
Gaussian mixture probability hypothesis density experiments in a simulation environment: Each column represents a series of experiments at a specific distance while each row represents either the relative distance
 $d_{ij}$
or the bearing
 $\beta _{ij}$
from the follower agent
 $i=0$
to the leaders
 $j=\{1,2\}$
.

In conclusion, the evaluation of the GM-PHD filter at multiple distances demonstrated its ability to accurately track the positions of the follower robot relative to the two leader robots. The analysis of the filter’s tracking outputs at 0.5, 1.5, and 2.5 m distances provided valuable insights into its performance. From the plots, each column depicts a series of evaluations at a specific distance, while each row represents a measurement from the first leader robot.
6. Formation graph construction and control
Sections 4 and 5 provide the relative localization method between the robots in a MRS. To address Objective 3, here we propose a formation construction algorithm that produces a formation graph that obeys the restrictions on the sensing mechanism. After, we review the formation control algorithm of [Reference Fidan, Gazi, Zhai, Cen and Karataş9] that can be implemented with our localization module to complete the perception-action loop.
6.1. Formation graph construction under sensing constraints
The robotic agents in the MRS aim to move in formation from a start configuration to a goal configuration. Formation configuration plays a significant role in achieving formation tasks successfully. While numerous formation graph structures have been proposed with appealing theoretical properties for multi-agent systems, most of these structures cannot be implemented directly on real-world systems because they ignore the sensor constraints in the graph construction stage. Henneberg-based directed graph construction method provides an effective solution to this problem, enabling the modeling and optimization of agent paths while accounting for the field-of-view (FOV) constraints of each sensor. Therefore, we apply a Henneberg-based graph construction method to satisfy the feasibility of the proposed relative localization approach.
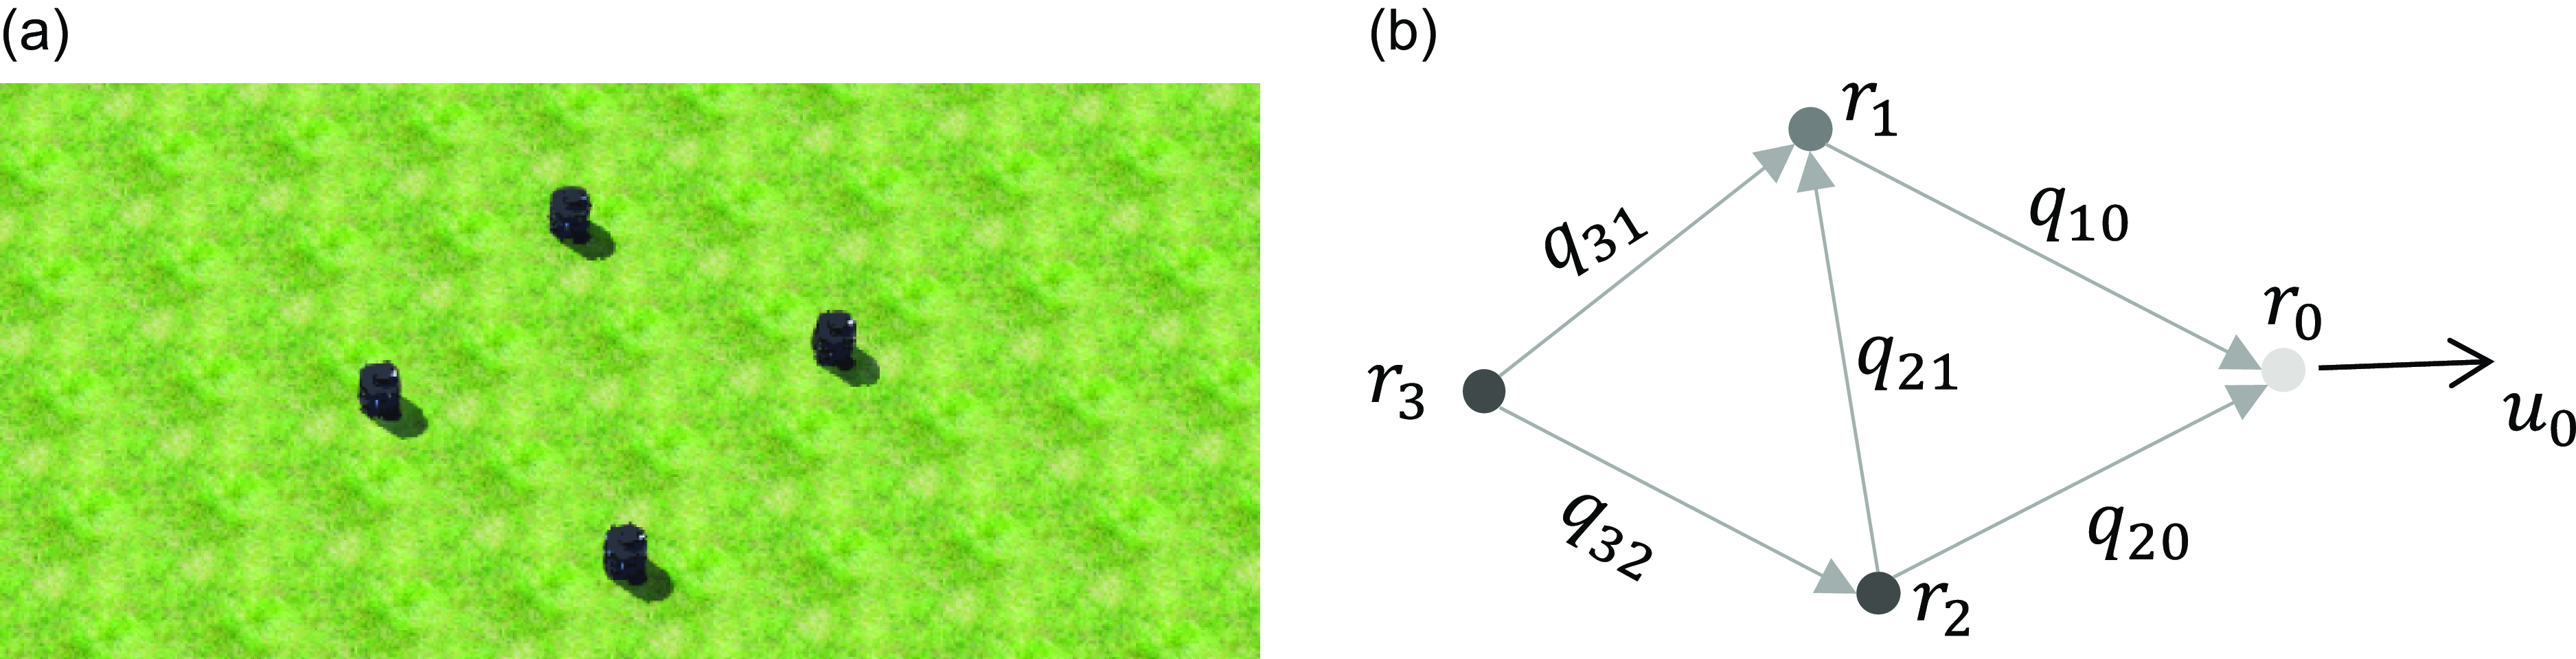
a) Four Turtlebot robot agents in theWebots simulation; b) The underlying L-FF graph among the robots.

Vertex and edge addition operation in the Henneberg construction method. Two directed edges are added towards the previous vertices with every new vertex.

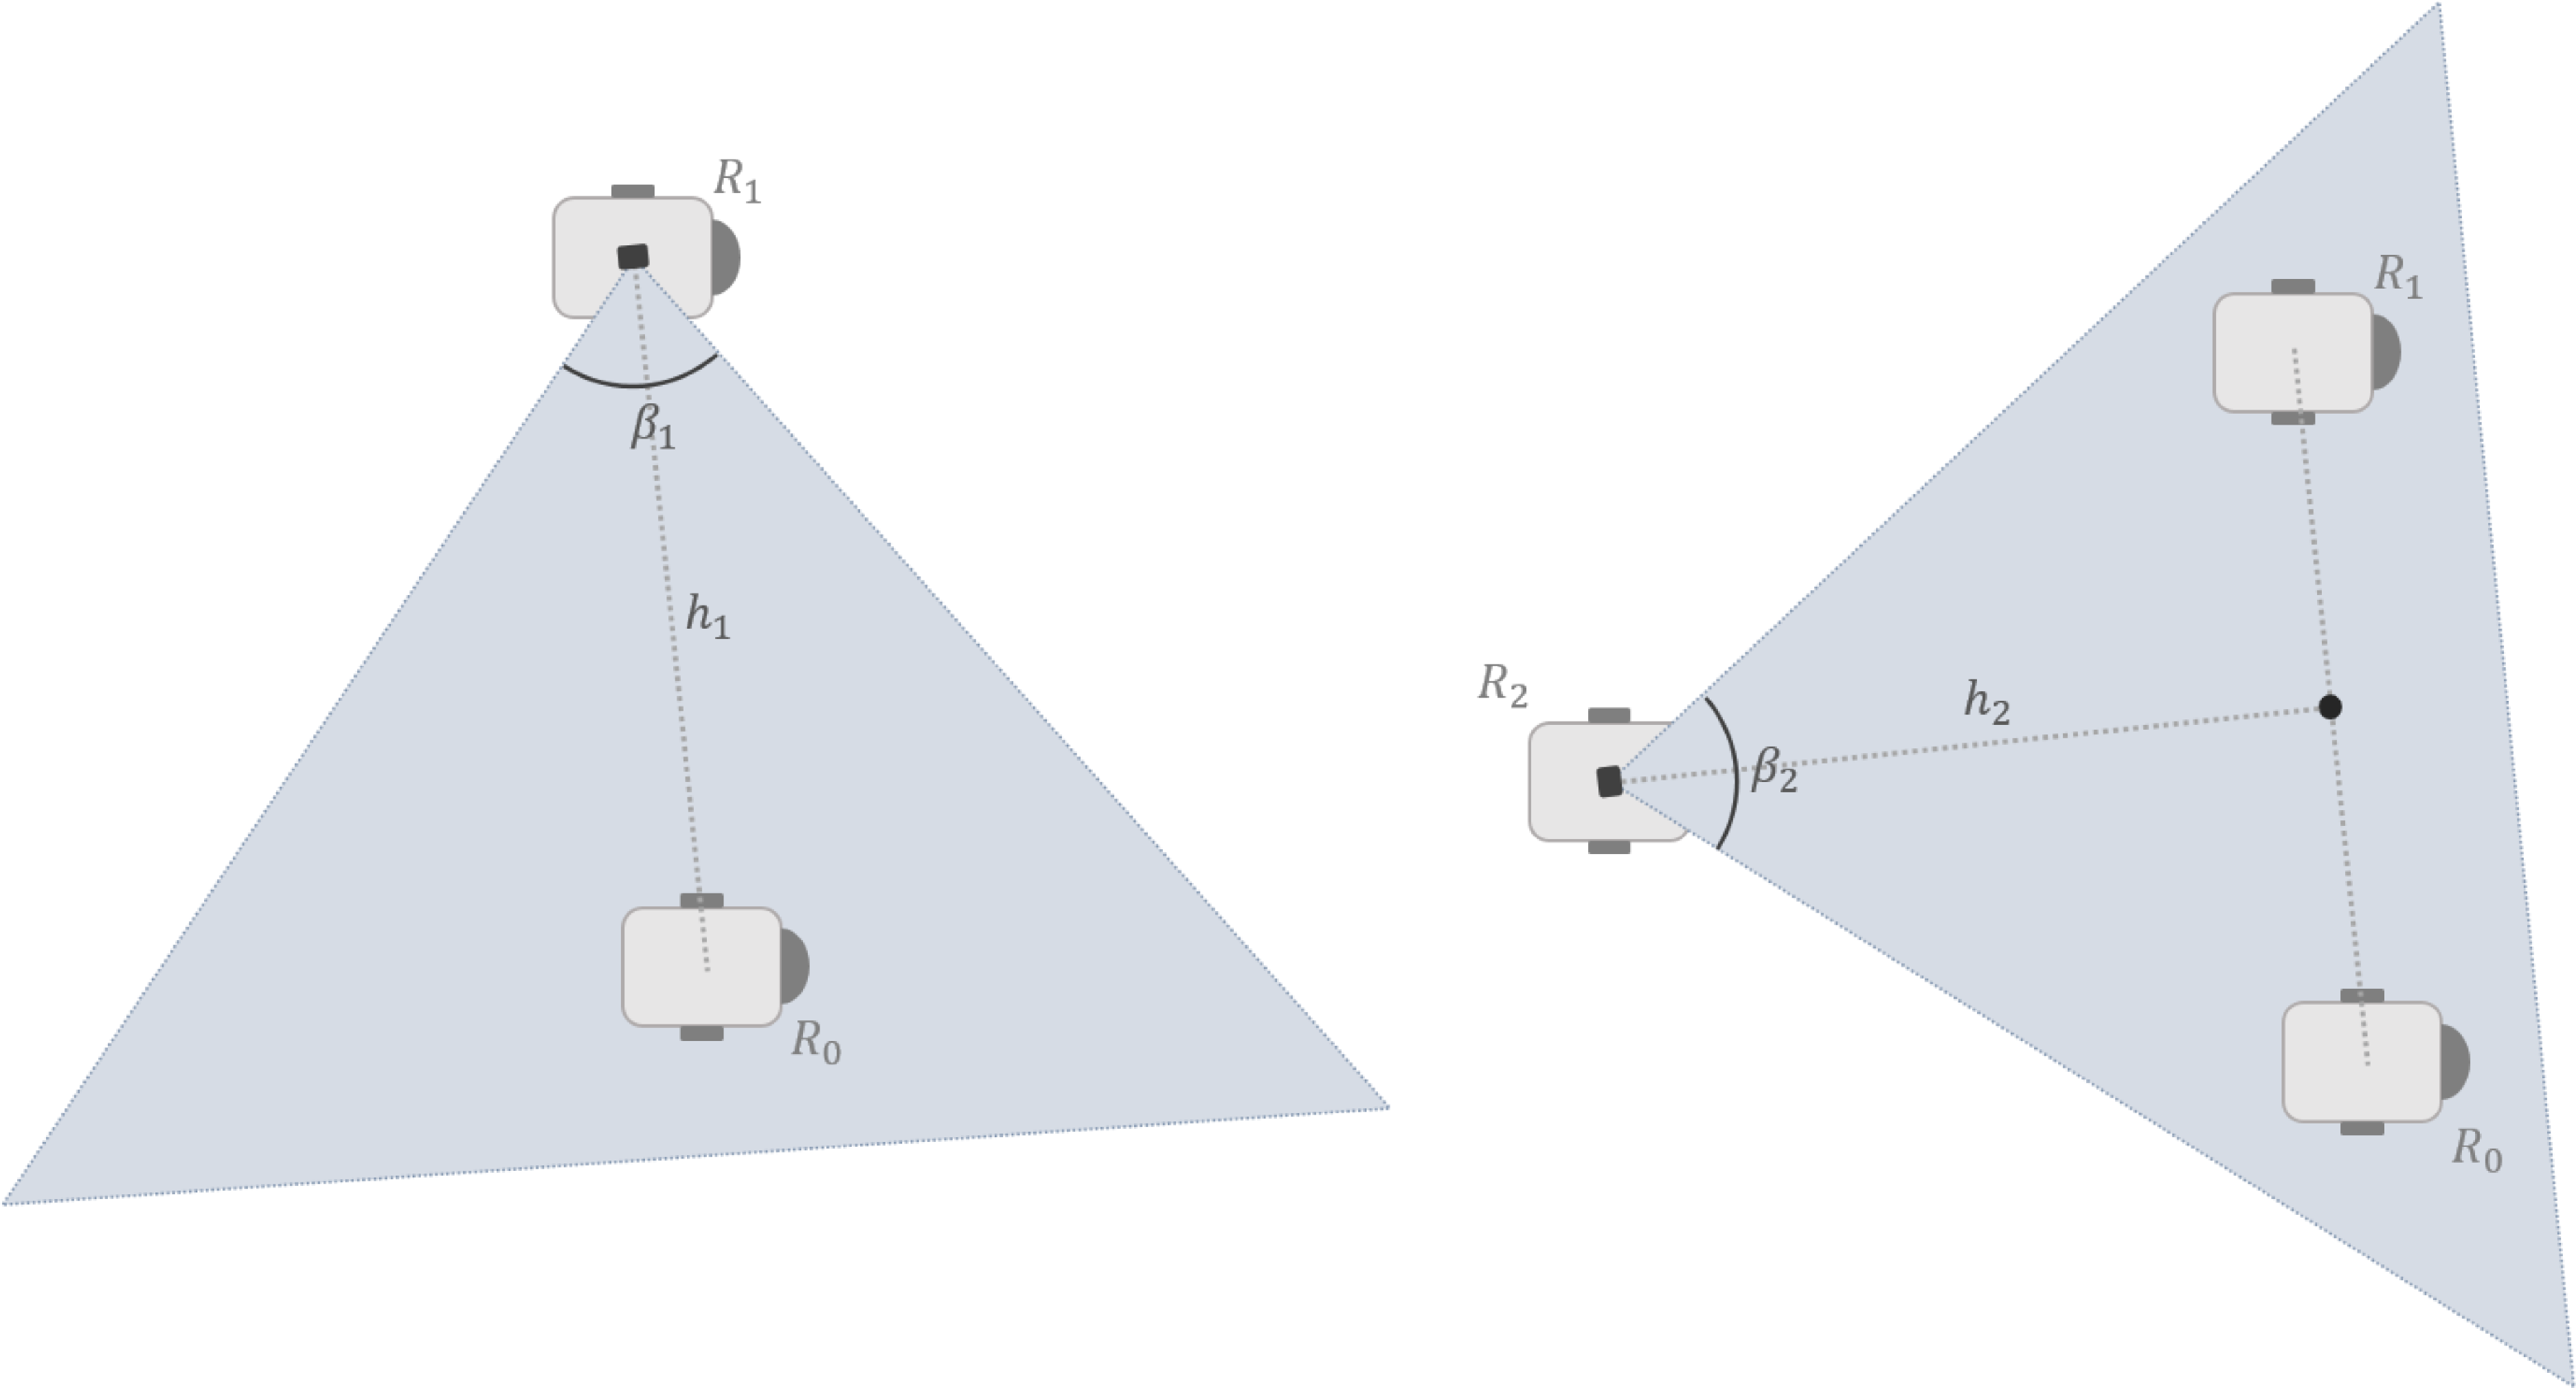
The Henneberg construction for three robots considering the visibility constraints. The robot R1 camera is directed towards its only leader, R0, while the camera of the second follower robot R2 is directed towards its two leaders, R0 and R1. The second follower robot R2 is positioned on the line perpendicular to the line segment connecting its two leaders.

We define the formation framework by
 $\mathcal {F}=(\mathcal {S},\mathcal {G},\mathcal {Q})$
, where
 $\mathcal {S}=\{R_0,R_1,\ldots, R_N\},\,N\geq 2,$
denotes the swarm formed by the robotic agents,
 $\mathcal {G}$
denotes the underlying graph among the agents, and
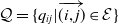 $\mathcal {Q}=\{q_{ij}|\overrightarrow {(i,j)}\in \mathcal {E}\}$
denotes the desired distance configuration. To minimize the required constraint links and the sensing requirements, the constraint graph
 $\mathcal {G}=(\mathcal {V},\mathcal {E})$
, where
 $\mathcal {V} = \{1,\ldots, N\}$
and
 $\mathcal {E} = \{\ldots, (i,j),\ldots \} \subset \mathcal {V} \times \mathcal {V}$
are respectively the set of the vertices and the edges in the graph, is designed to be minimally persistent (directed, minimally rigid, and constraint-consistent) which has the property of containing the minimum number of constraint links among the agents. A vertex
 $i\in \mathcal {V}$
represents an agent and an edge
 $(i,j)$
defines a constraint between agent
 $i$
and agent
 $j$
such that agent
 $j$
is to fulfill a relative position constraint toward agent
 $i$
while agent
 $i$
does not have any constraint regarding agent
 $j$
. The set of neighbors of agent
 $i$
is denoted by
 $\mathcal {N}_i = \{j \in \mathcal {V} | ( i,j ) \in \mathcal {E}\}.$
Minimally persistent graphs can be generated using the Henneberg construction method [Reference Anderson, Yu, Fidan and Hendrickx4]. A sample graph construction is represented in Figure 11, where one starts with the vertices
 $\mathcal {V}_0,\mathcal {V}_1$
and the edge
 $(0,1)$
and adds further vertices and the corresponding edges cumulatively. With the addition of vertex
 $\mathcal {V}_2$
, the edges
 $(0,1)$
and
 $(0,2)$
are defined from
 $\mathcal {V}_2$
to
 $\mathcal {V}_0$
and
 $\mathcal {V}_1$
, denoting the motion constraints. Then, the vertices
 $\mathcal {V}_3,\mathcal {V}_4$
and
 $\mathcal {V}_5$
are added such that each has two outgoing edges toward their leaders. One can continue building the constraint sets of the remaining follower agents so that vertex
 $\mathcal {V}_i$
has the neighbor set
 $\mathcal {N}_i = \{i-2,i-1\},\,i\in \{3,\ldots, N\}$
, resulting in a minimally persistent graph
 $\mathcal {G}$
with
 $2N-3$
edges.
The embedding of the minimally persistent graph
 $\mathcal {G}$
in the formation framework
 $\mathcal {F}$
evokes a leader-first follower-second follower (L-FF) formation. The leader robot
 $R_0$
, corresponding to vertex
 $\mathcal {V}_0$
, has no outgoing edge and possesses two degrees of freedom (2-DOF) without a mobility restriction in
 $\mathbb {R}^2$
. The second vertex
 $\mathcal {V}_1$
denotes the first follower robot
 $R_1$
with one outgoing edge connection toward
 $\mathcal {V}_0$
, which corresponds to 1-DOF in
 $\mathbb {R}^2$
, i.e., robot
 $R_1$
is desired to satisfy one constraint toward robot
 $R_0$
. Each of the remaining vertices
 $\mathcal {V}_i,\,i\in \{2,\ldots, N\}$
(the ordinary followers) has two outgoing edges toward its neighbors, which leads to 0-DOF. For instance, robot
 $R_2$
is desired to satisfy two constraints, one toward the leader
 $R_0$
and one toward the first-follower
 $R_1$
. Thus, the entire MRS can move as a single entity, i.e., the entire vertex set can have translation and rotation motion in
 $\mathbb {R}^2$
as long as all distance constraints in
 $\mathcal {Q}$
are satisfied.
To ensure that the formation
 $\mathcal {F}$
meets the requirements imposed by the sensing limitations, we integrate the FOV constraints into the Henneberg construction. Let
 $\beta _{i}$
denote the FOV of the camera of robot
 $\mathbb {R}_i,\,i\in \{2,\ldots, N\}$
. To maximize the visibility of the leader robots, the cameras are positioned so that they are directed toward their leader robots, regardless of their heading angles. The first follower robot
 $R_1$
can be positioned anywhere on the plane, and its camera is directed toward the leader
 $R_0$
. The second follower robot
 $R_2$
is positioned on the line intersecting perpendicularly to the midpoint of the line segment which connects its two leaders. Accordingly, the camera of
 $R_2$
is directed toward the midpoint of its two leaders,
 $R_{0}$
and
 $R_{1}$
, to improve the detection performance of the YOLO algorithm (Figure 12). Let
 $h_2$
denote the distance between the center of
 $R_2$
and the midpoint of the line segment connecting its two leaders. In this configuration, the visibility constraint imposes that
 $h_2^{\textrm {min}}\leq h_2\leq h_2^{\textrm {max}},$
where
 $h_2^{\textrm {min}},h_2^{\textrm {max}}$
denote the minimum and maximum limits for
 $h_2$
. The minimum
 $h_2^{\textrm {min}}$
is caused by the geometrical constraint that if
 $h_2\lt h_2^{\textrm {min}}$
, none of the leaders will be visible on the image frame. On the other hand,
 $h_2^{\textrm {max}}$
determines the maximum distance where the YOLO algorithm can detect the robots reliably. Afterward, the other second follower robots
 $\mathbb {R}_i,\,i\in \{3,\ldots, N\}$
are positioned in the same manner, and their cameras are directed toward the midpoint of their two leaders,
 $R_{i-2}$
and
 $R_{i-1}$
. Therefore, the camera visibility constraints are handled with this scheme at the expense of restricting the allowed configuration sets of the robots.
Remark. In the proposed scheme, the camera of a robot can be oriented irrespective of the robot’s heading, which provides flexibility in designing the formation shape.
Remark.
The proposed formation graph construction rules under sensing constraints apply to other static MRS formation graphs, such as line, cyclic, and undirected graphs. The primary objectives in defining these rules are
 $(i)$
placing the robot(s) to be detected in the camera image frame and
 $(ii)$
ensuring that the inter-robot distances obey the reliable detection range of the YOLO algorithm.
6.2. Base formation control laws
The non-holonomic vehicle kinematics (1) poses a challenge for the motion control design as the robot configuration dimension (
 $\mathbb {R}^3$
) is higher than the controllable DOF (
 $\mathbb {R}^2$
). Inspired by the control design of [Reference Fidan, Gazi, Zhai, Cen and Karataş9], we propose the following individual control laws for a cohesive maneuver of the swarm of non-holonomic agents. First, denote the desired velocity vector and the regulating angular velocity for agent
 $R_{i}$
by
 \begin{align} u^{d}_{i}(t)&= \begin{bmatrix} \bar {u}_{i} \cos (\theta _{i}^{d}(t)) \\ \bar {u}_{i} \sin (\theta _{i}^{d}(t)) \end{bmatrix}, \end{align}
 \begin{align} \omega _{i}(t)&=k_{\omega }(\text {mod}((\theta _{i}(t)-\theta _{i}^{d}(t))+\pi, 2\pi ) - \pi ) + \dot {\theta }_{i}^{d}, \end{align}
where
 $u^{d}_{i}$
is the control input to drive the robot to the desired state,
 $k_{\omega }\lt 0$
is a proportional gain,
 $\theta _{i}^{d}(t)=\textrm {atan}(u_{i,y}^{d}(t)/u_{i,x}^{d}(t))$
is the desired heading of robot
 $R_{i}$
,
 $\textrm {atan}(\cdot )$
is the four-quadrant arc-tangent function, and
 \begin{equation} \dot {\theta }_{i}^{d}= \begin{cases} \dfrac {\dot {u}_{y}^{d}u_{x}^{d}-\dot {u}_{x}^{d}u_{y}^{d}}{(u_{x}^{d})^2+(u_{y}^{d})^2} & \text {if $u^{d}\neq 0$}\\ 0 & \text {otherwise.} \end{cases} \end{equation}
This generic control scheme (4)–(5) can drive a point agent kinematics toward its goal location with the linear speed of
 $\bar {u}_{i}(t)=\|u^{d}_{i}(t)\|$
, while regulating its heading angle to its desired value
 $\theta _{i}^{d}$
. Before the controller derivations, we define the relative position error
 $z_{ij}\in \mathbb {R}^2$
and the distance error
 $e_{ij}\in \mathbb {R}$
as
 \begin{align} {z}_{ij} &= p_i - p_j \quad \forall (i,j) \in \mathcal {E} \end{align}
 \begin{align} {e}_{ij} &= ||z_{ij}||^2 - {d}_{ij}^2 \quad \forall (i,j) \in \mathcal {E}, \end{align}
where
 ${d}_{ij}$
is the desired constraint-consistent distance between robot
 $i$
and robot
 $j$
. The purpose of the follower robots is to steer the distance errors to zero, i.e., when
 $e_{ij}(t)=0$
for all
 $(i,j) \in \mathcal {E}$
, the cohesive flocking objective is achieved up to translation and rotation. In the following, we derive the distributed control laws for each of the three agent types by modifying the control law (4)–(5) for non-holonomic agents.
6.2.1. Leader
In the proposed leader-follower graph, the leader
 $R_0$
has two DOF, which means it has no directed distance constraints to other robots in the swarm. Therefore, to invoke a flocking motion, the leader is assigned a purely translational motion with constant speed, i.e.,
 $\bar {u}_{0}=\alpha, \,\omega _{i}=0$
, where the design constant
 $\alpha \gt 0$
is the flocking constant. We assume that
 $\alpha$
is not known by the follower robots.
6.2.2. First follower
With one DOF, robot
 $R_1$
has one outer degree constraint in the framework. Thus, it needs to maintain the desired distance constraint to the leader robot
 $R_0$
, by utilizing the UWB distance measurements and the bearing measurements obtained from the vision sensor. We propose to use the following controller in robot
 $R_1$
:
 \begin{align} \bar {u}_{1}(t)&=\|u^{d}_{1}(t)\|=\|k_{v}e_{01}(t)z_{01}(t)\|, \end{align}
along with (5), where
 \begin{align*} \theta _{1}^{d}(t)&=\theta _{1}(t)-\phi _{01}(t)+\theta _{\mathrm {off}}, \end{align*}
 $k_{v}\lt 0$
is the proportional gain,
 $\phi _{01}\in [{-}\pi, \pi )$
is the bearing angle derived from the object detection, and
 $\theta _{off}\in [{-}\pi, \pi )$
is a constant value that represents the offset between the robot body frame and the camera frame. The offset parameter
 $\theta _{\mathrm {off}}$
allows the sensor to have a different orientation than the robot body frame.
6.2.3. Second follower(s) (SF)
Having zero DOF, the robot
 $R_i$
has two motion constraints in the constraint graph
 $\mathcal {G}$
and aims to maintain the distance constraints
 $d_{i-2,i}$
and
 $d_{i-1,i}$
toward robots
 $R_{i-2}$
and
 $R_{i-1}$
, respectively. We use the following control law for
 $R_{i}$
:
 \begin{align} \bar {u}_{i}(t)&=\|u^{d}_{i}(t)\|=\|k_{v}\sum _{j\in \mathcal {N}_{i}}e_{ij}z_{ij}\| \end{align}
along with (5), where
 \begin{align*} \theta _{i}^{d}(t)&=\sum _{j\in \mathcal {N}_{i}}\left (\theta _{i}(t)-\phi _{ij} (t)\right ) +\theta _{off}, \end{align*}
 $k_{v}\lt 0$
is the proportional gain,
 $\mathcal {N}_i$
is the neighbor set of
 $R_i$
in the graph
 $\mathcal {G}$
, and
 $\phi _{ij}\in [{-}\pi, \pi )$
is the bearing angle between
 $R_i$
and
 $R_j$
measured in the body frame of the second follower
 $R_i$
.
7. System evaluation
Our experimental investigation comprehensively assesses the efficacy of the proposed framework on a four-robot system
 $\mathcal {S}=\left \lbrace R_0,R_1,R_2,R_3\right \rbrace$
through both simulations and real-world experiments. Notably, this setup is scalable, allowing for seamless integration into larger swarms with multiple-second followers through minimal adjustments. The effectiveness of the proposed perception method and formation configuration setup was assessed with regard to accomplishing Objectives 2 and 3.
7.1. Simulation
Webots simulation platform was employed with ROS2 for a detailed performance evaluation. It facilitates the realistic emulation of robot kinematics and various environmental dynamics with its advanced physical engine (Figure 13a). Our experimental setup consisted of four Turtlebot3 robotic agents, each equipped with an RGB camera sensor. They relied on CNN-based detection from the RGB cameras, and the inter-robot distance measurements were emulated within the simulation by adding Gaussian noise to the GPS signals provided by Webots.
First, to specifically evaluate the performance of the Gaussian Mixture Probability Hypothesis Density (GM-PHD) filter, we tested a leader-follower scenario with robots
 $R_{0}$
and
 $R_{1}$
, where the follower robot
 $R_{1}$
was programed to maintain a predetermined distance (
 $1.5$
m) from the leader
 $R_{0}$
. The relative position estimation on the
 $x$
-axis and
 $y$
-axis, as well as the relative distance
 $d_{01}$
, are shown for
 $37$
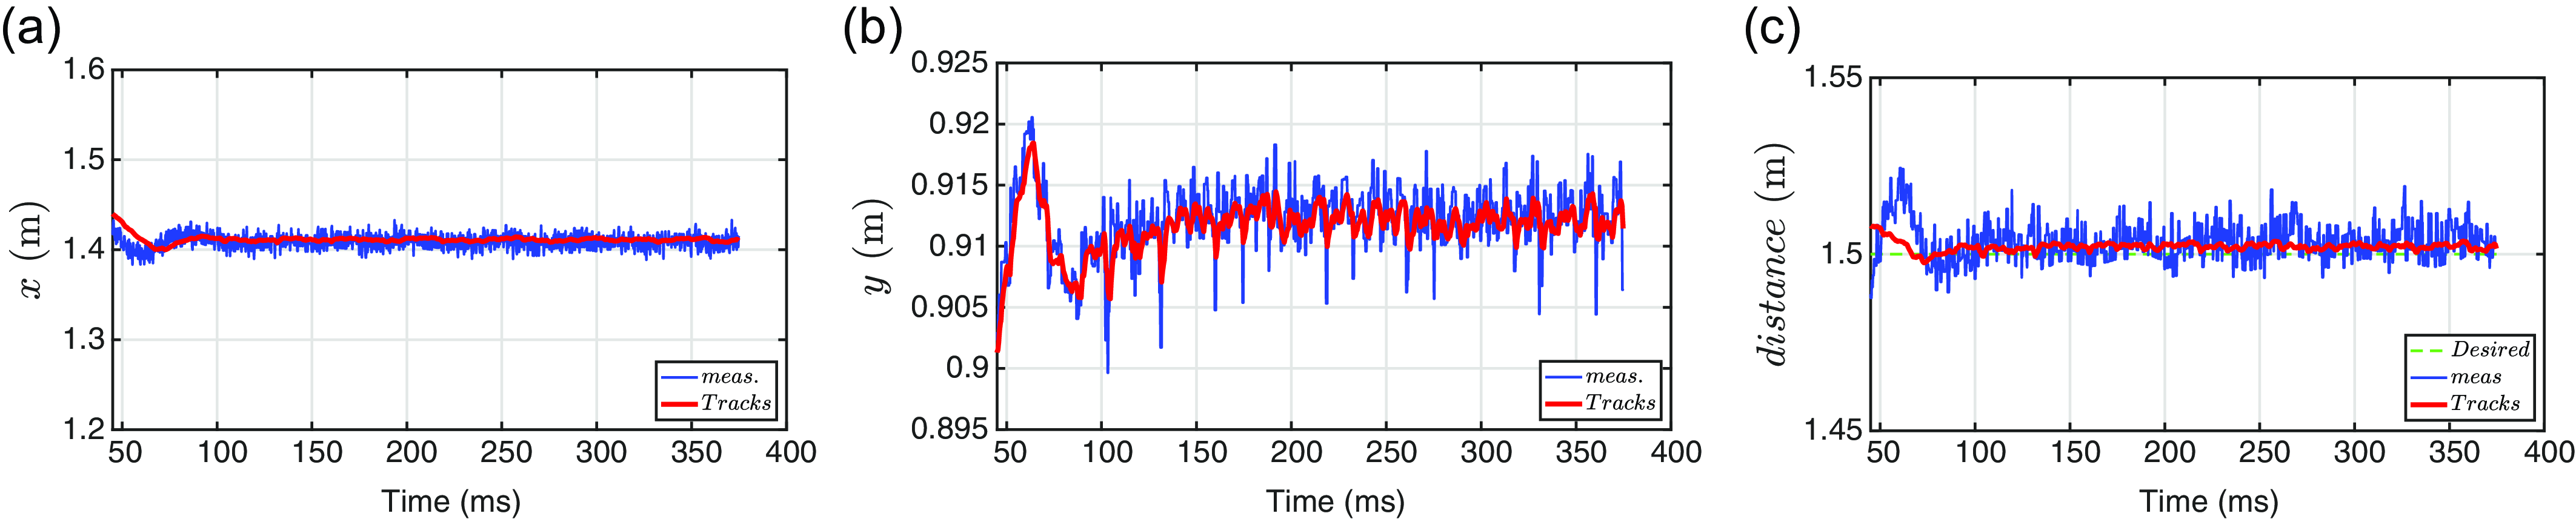
seconds in Figure 14. The results clearly demonstrated that the GM-PHD filter effectively filtered and smoothed out noise from the measurements, leading to more accurate and stable tracking of the relative position. This scenario underscores the GM-PHD filter’s efficacy in enhancing measurement precision in dynamic leader-follower interactions.
Leader-Follower task with Gaussian mixture probability hypothesis density: a)-b) The measurement and prediction of the leader position on the relative
 $x$
and
 $y$
axes, respectively; c) The measurement of the relative distance, its desired value, and the filter output.

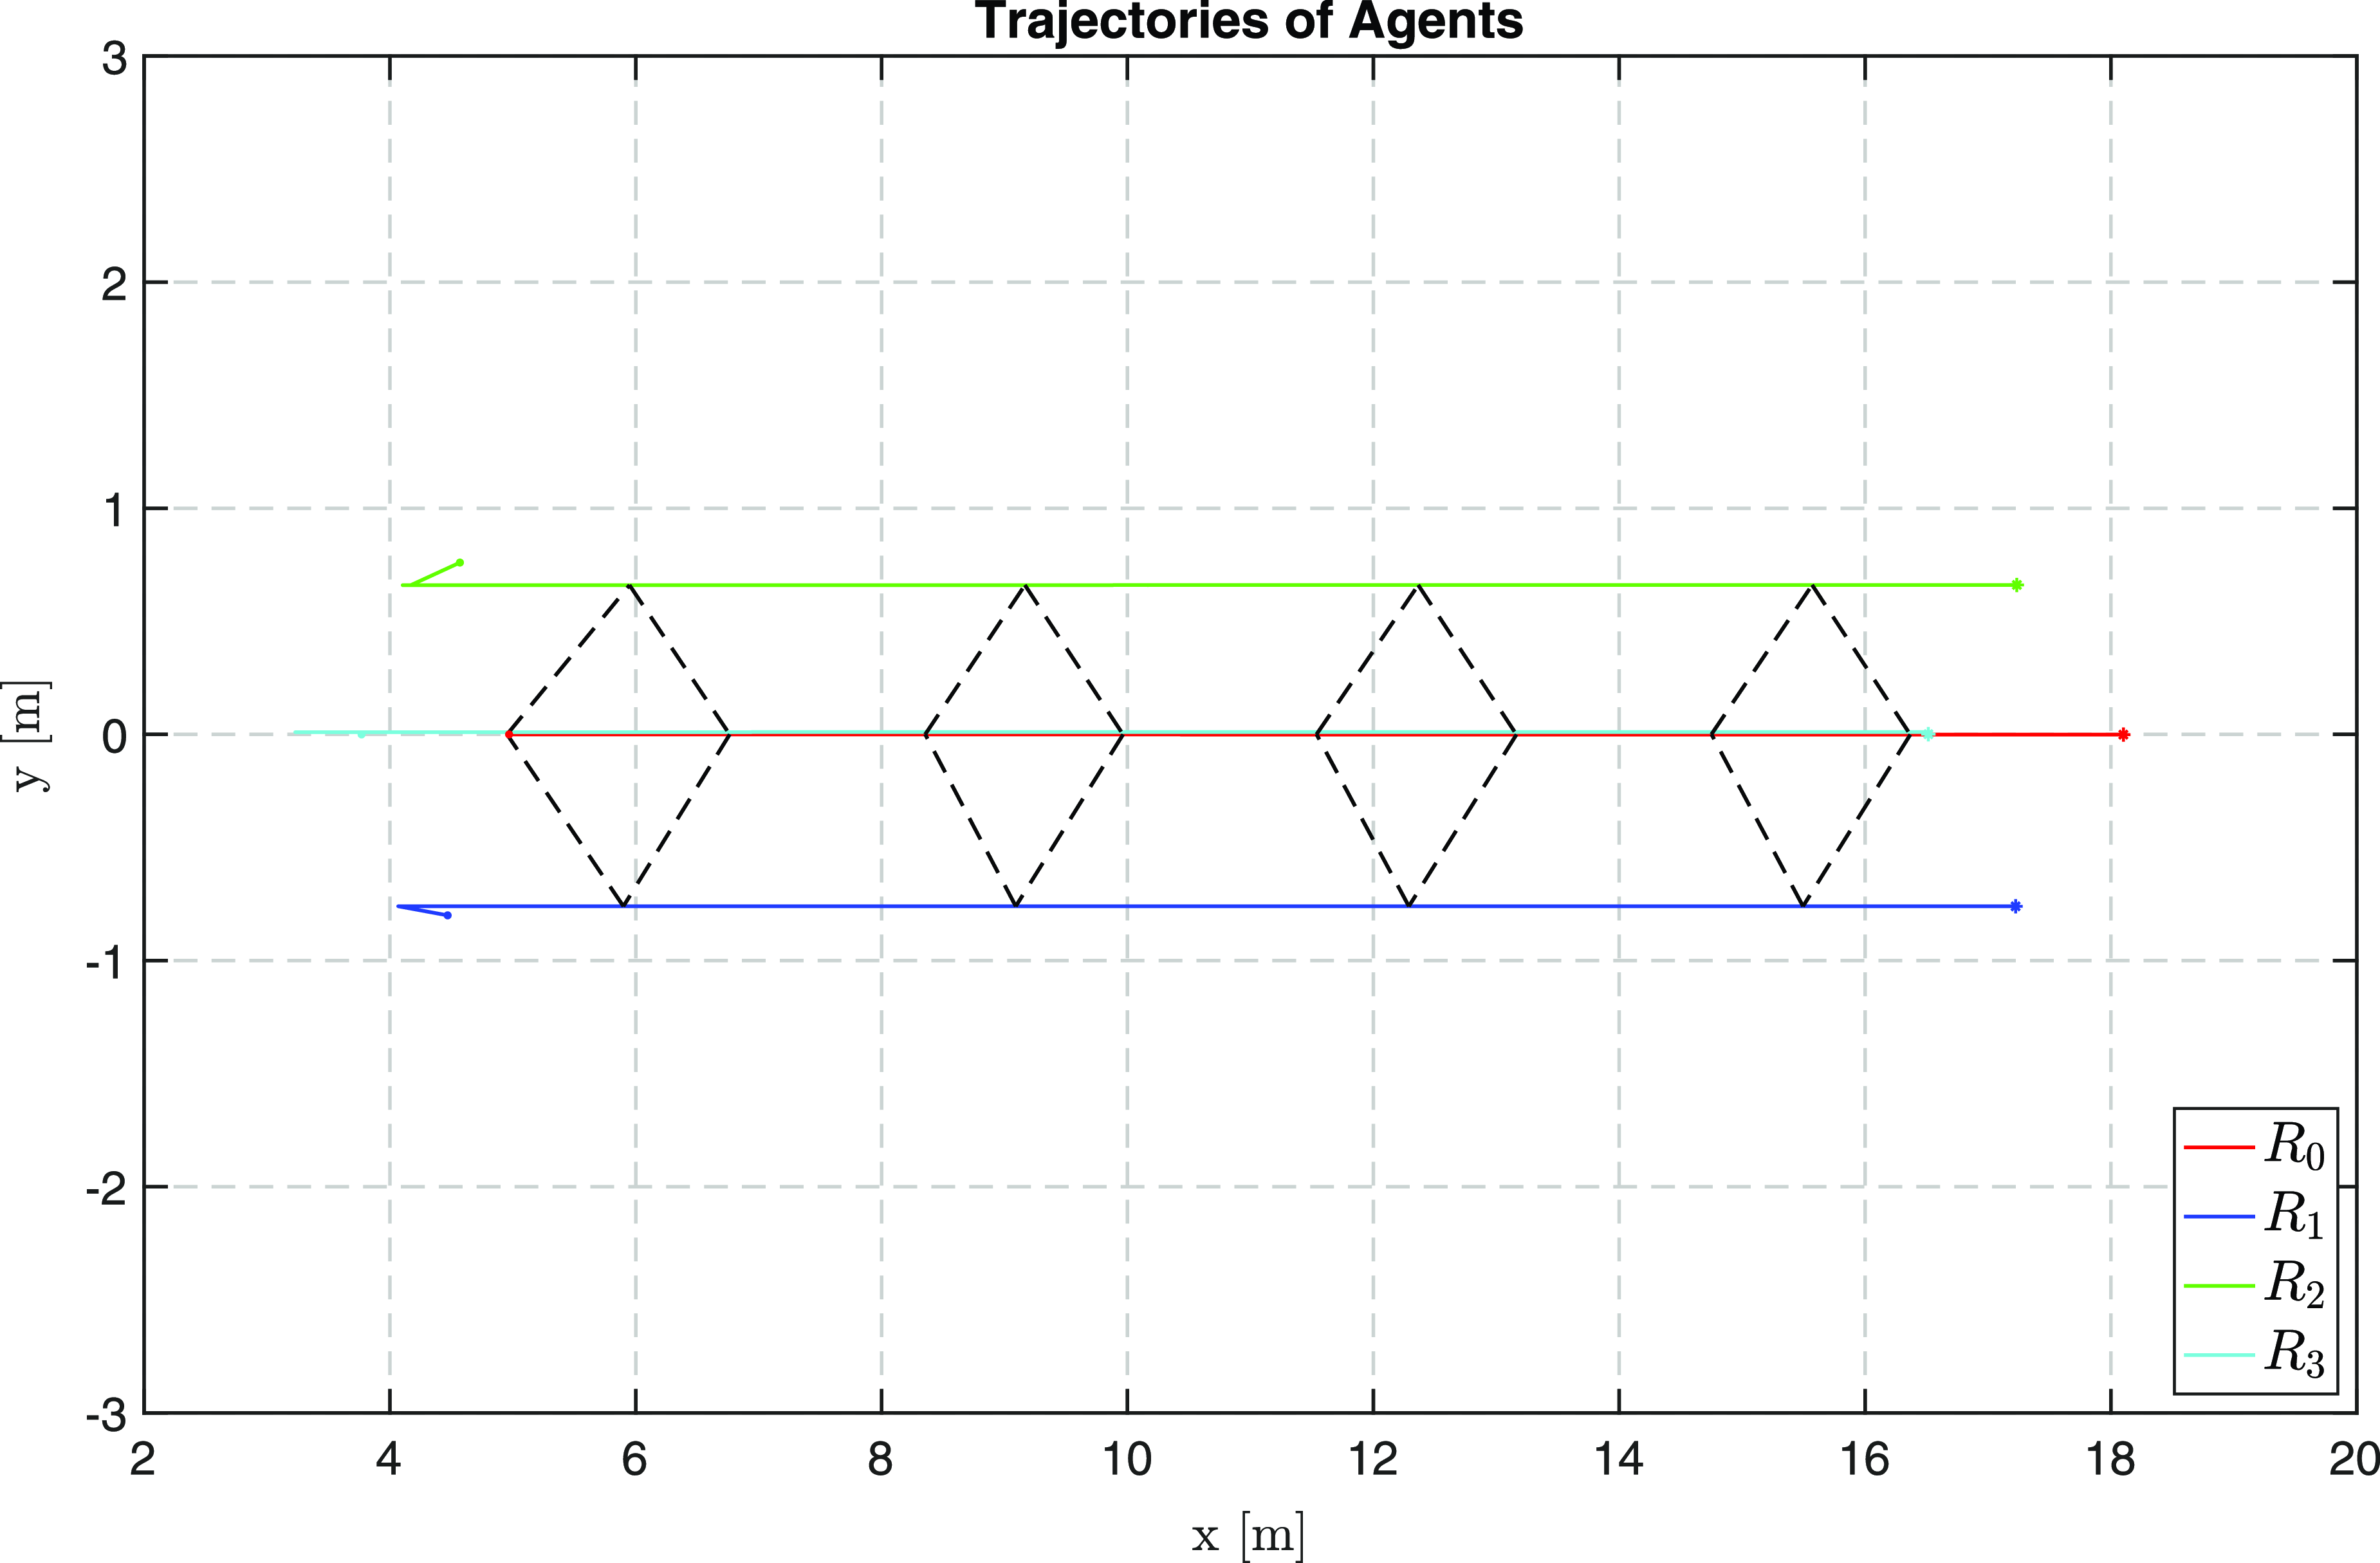
The trajectories of the agents in the simulations.

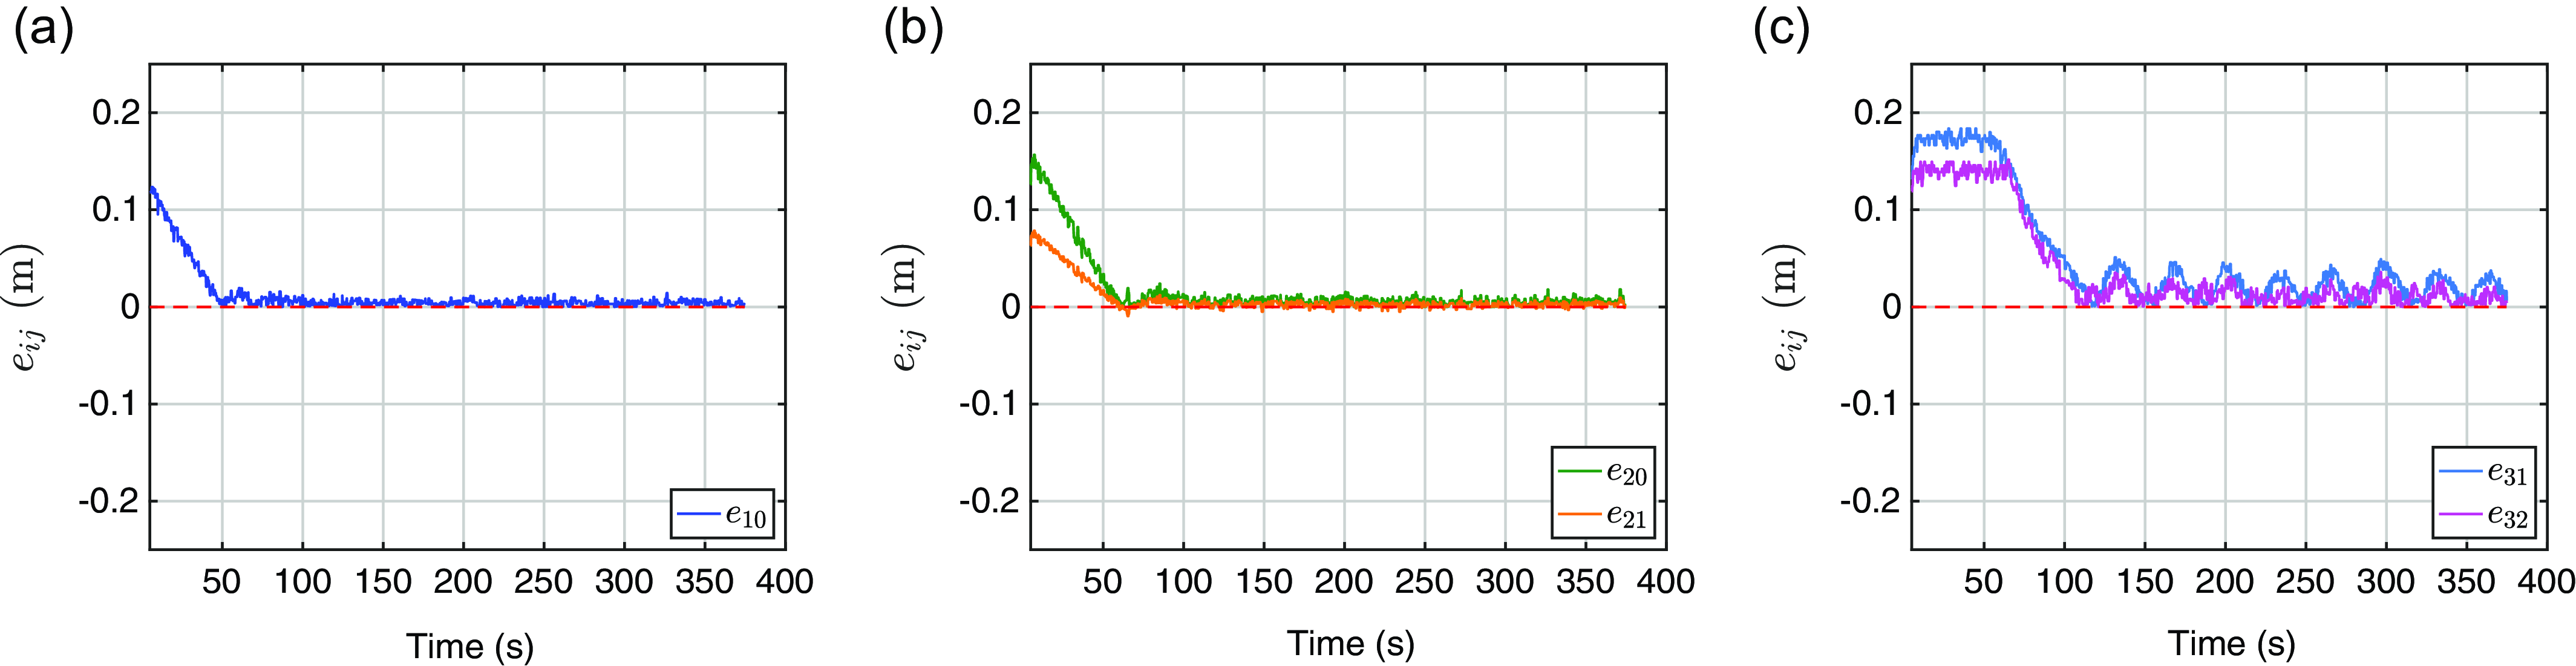
The next task involved a formation maneuver performed by the four robots, where they were required to maintain the specified formation constraints while executing a linear motion path. This ensured that the robots adhered to both the desired spatial relationships and the non-holonomic motion requirements of the formation. The trajectories generated by the robots during this maneuver are depicted in Figure 15, which confirms that the agents successfully achieved formation acquisition and subsequently maintained the predetermined distance constraints. Furthermore, the convergence of the error metrics is demonstrated in Figure 16, which clearly indicates a rapid compliance with the necessary constraints. Notably, although the robots’ initial positions were slightly off of the desired inter-robot distances (up to
 $0.2$
m), the errors converged in the first few seconds.
Significantly, the framework demonstrated robust adaptability across various tests involving different speeds and initial conditions. These tests consistently showed that the robots were capable of both achieving and maintaining formation, provided the follower robots could detect their leaders within the camera’s field of view. This robust performance under diverse conditions underscores the practical effectiveness of our framework in managing formation maneuvers.
Simulation results: a) The error
 $e_{10}$
between the First Follower
 $R_1$
and the leader
 $R_0$
; b) The errors
 $e_{20}$
,
 $e_{21}$
; and c) The errors
 $e_{31}$
,
 $e_{32}$
.

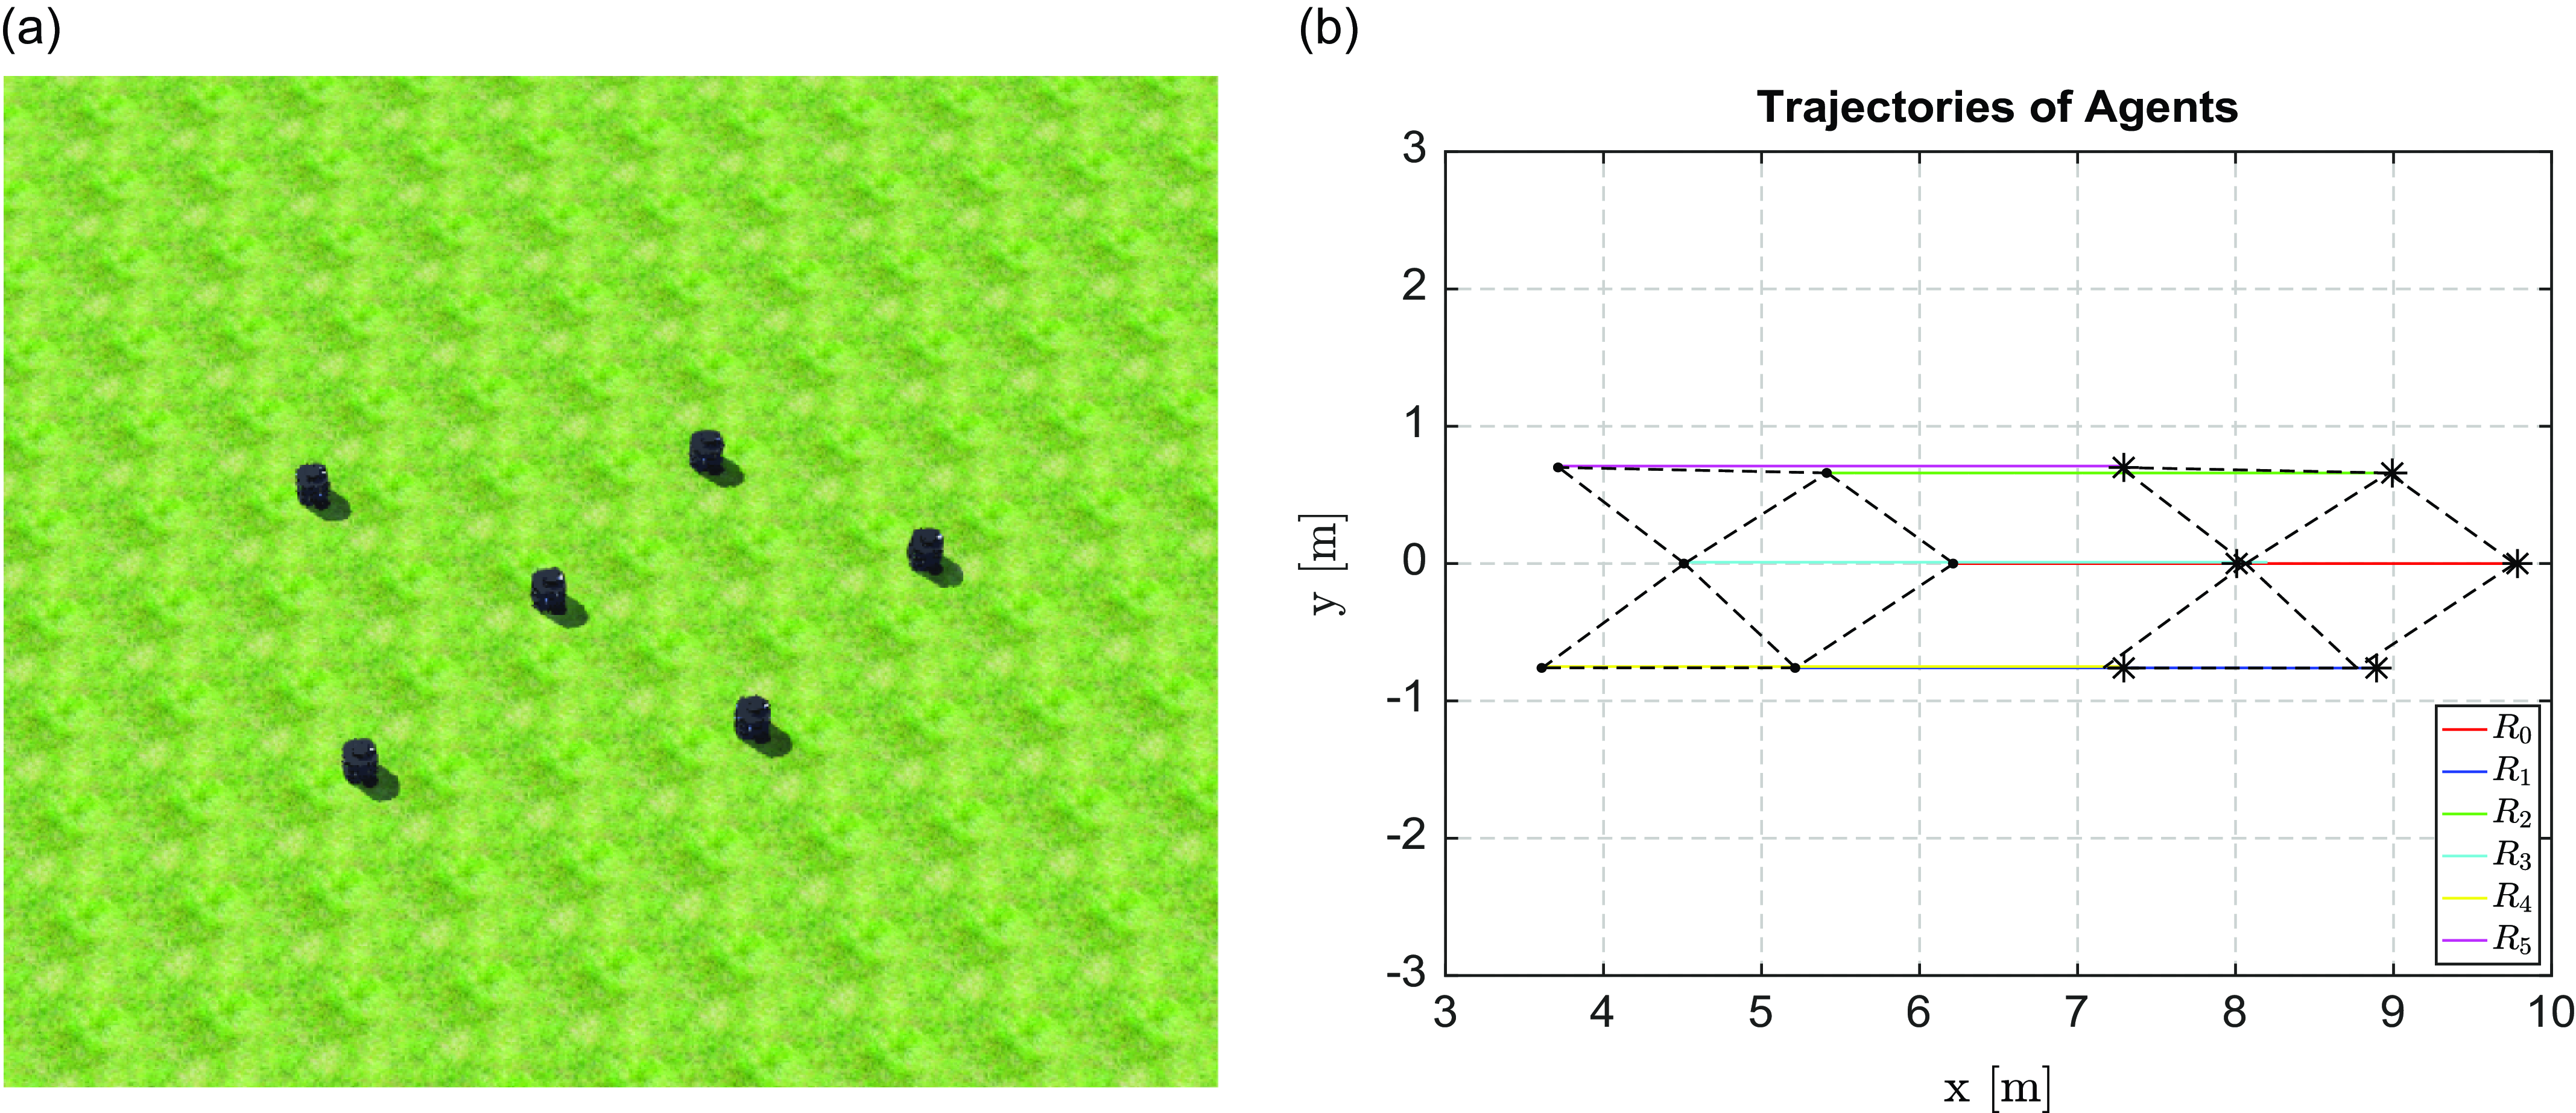
Finally, the scalability of the proposed framework was evaluated by a six-robot system, where the formation graph was generated employing the proposed Henneberg construction technique (Figure 17a). This scenario positioned the agents at their predefined locations relative to the target within the swarm. The primary task involved a coordinated formation maneuver, with the swarm’s leader assigned a velocity of
 $\bar {u}_{0}=0.1$
. The effectiveness of this scenario is evident in the trajectories depicted in Figure 17b. Here, it is observable that the agents successfully maintained their formation constraints throughout the maneuver. This demonstration validates our framework’s scalability and highlights its robustness in managing larger swarms while adhering to precise formation dynamics.
a) The agents in the Webots simulation environment; b) The trajectories of the agents in the simulations with six robots. The dotted lines are the edges of the graph at the starting and end positions of the robots.

7.2. Indoor experiments
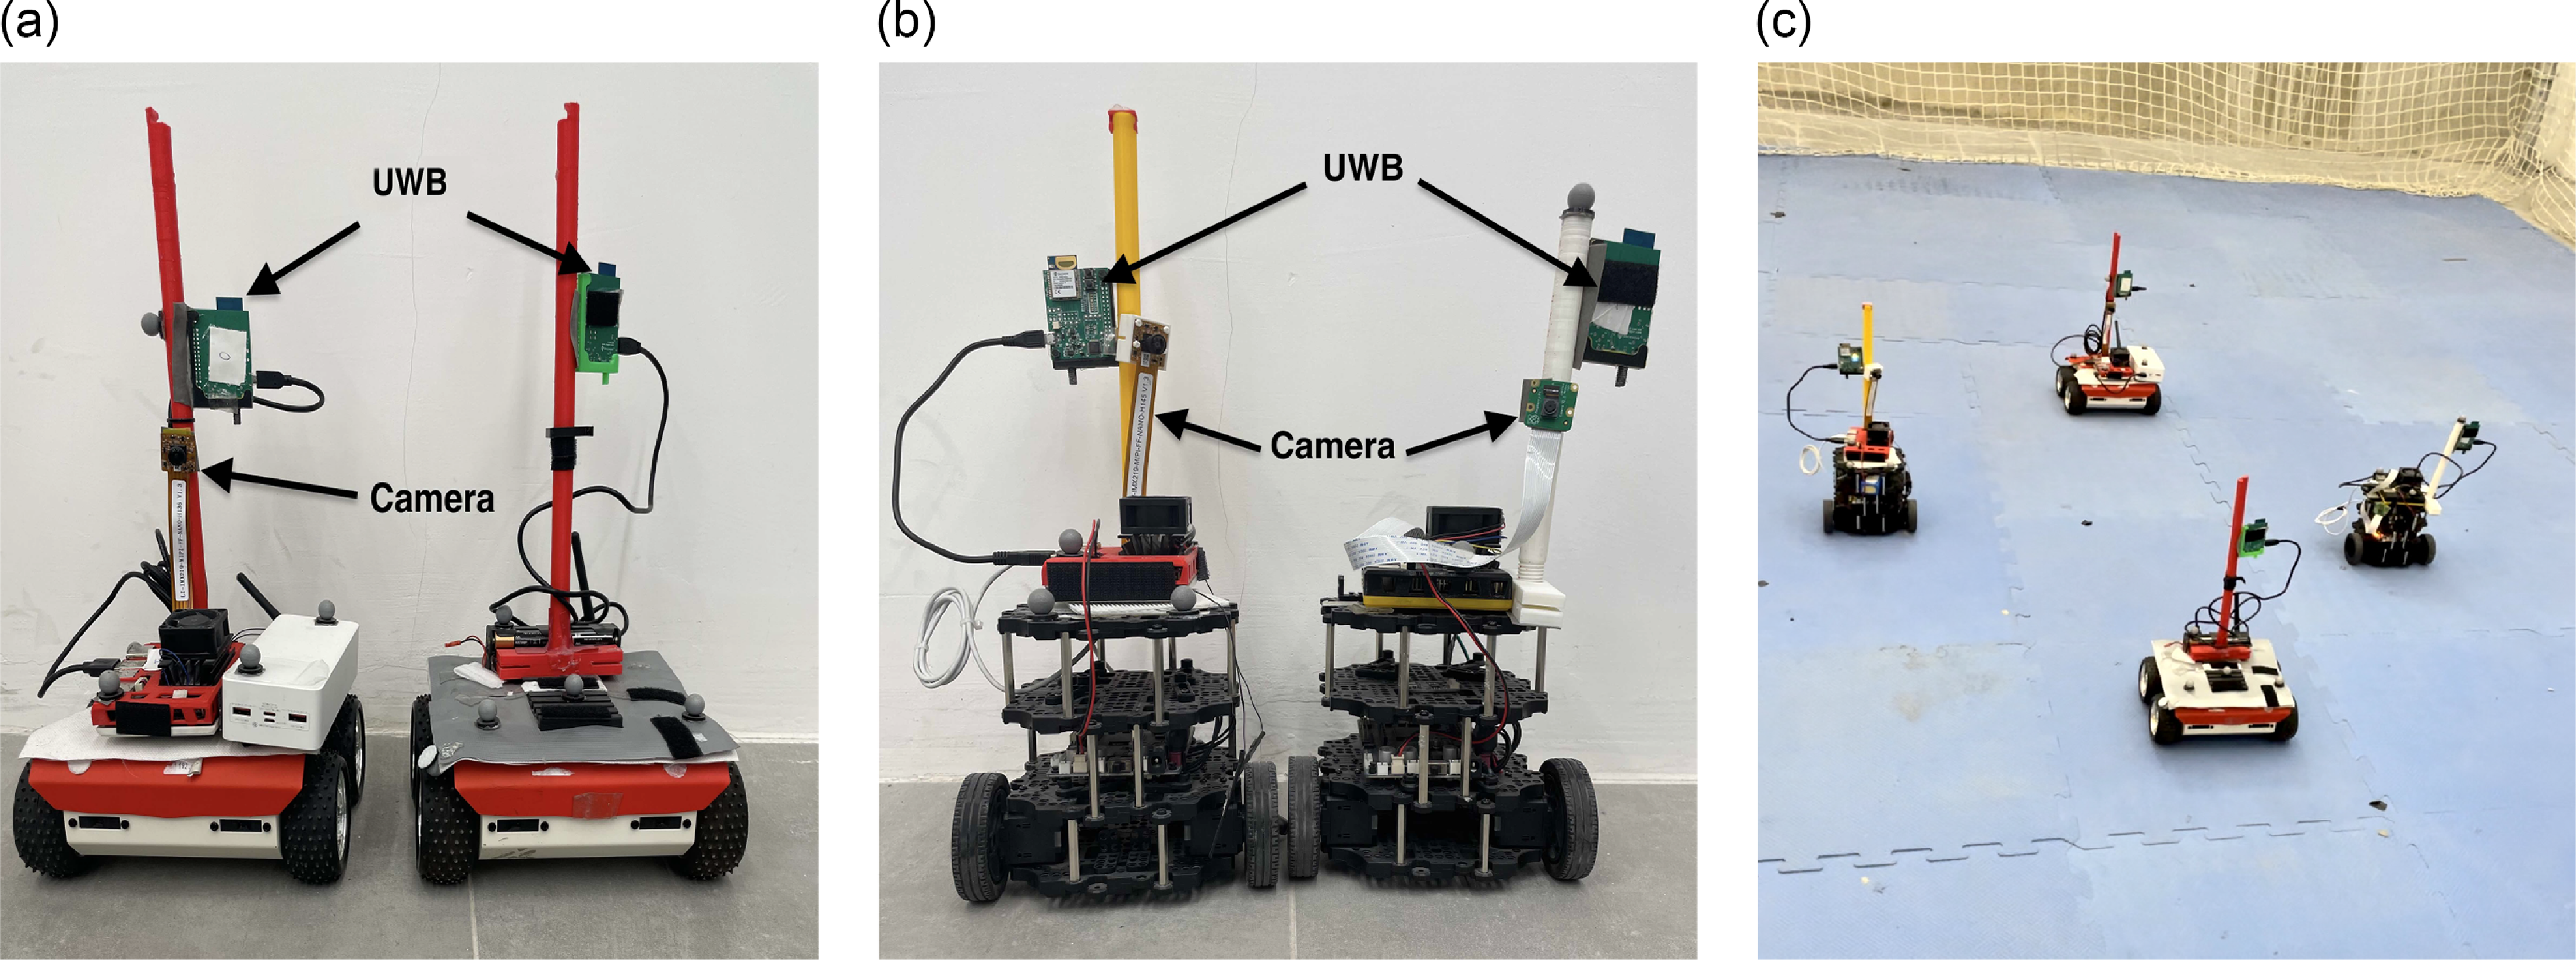
The robots used in the experiment: a) The leader with no camera and the last follower with a camera and UWBs. b) Two Turlebots with ultrawidebands, Jetson Nano, and camera. c) The four agents in formation in an experiment.

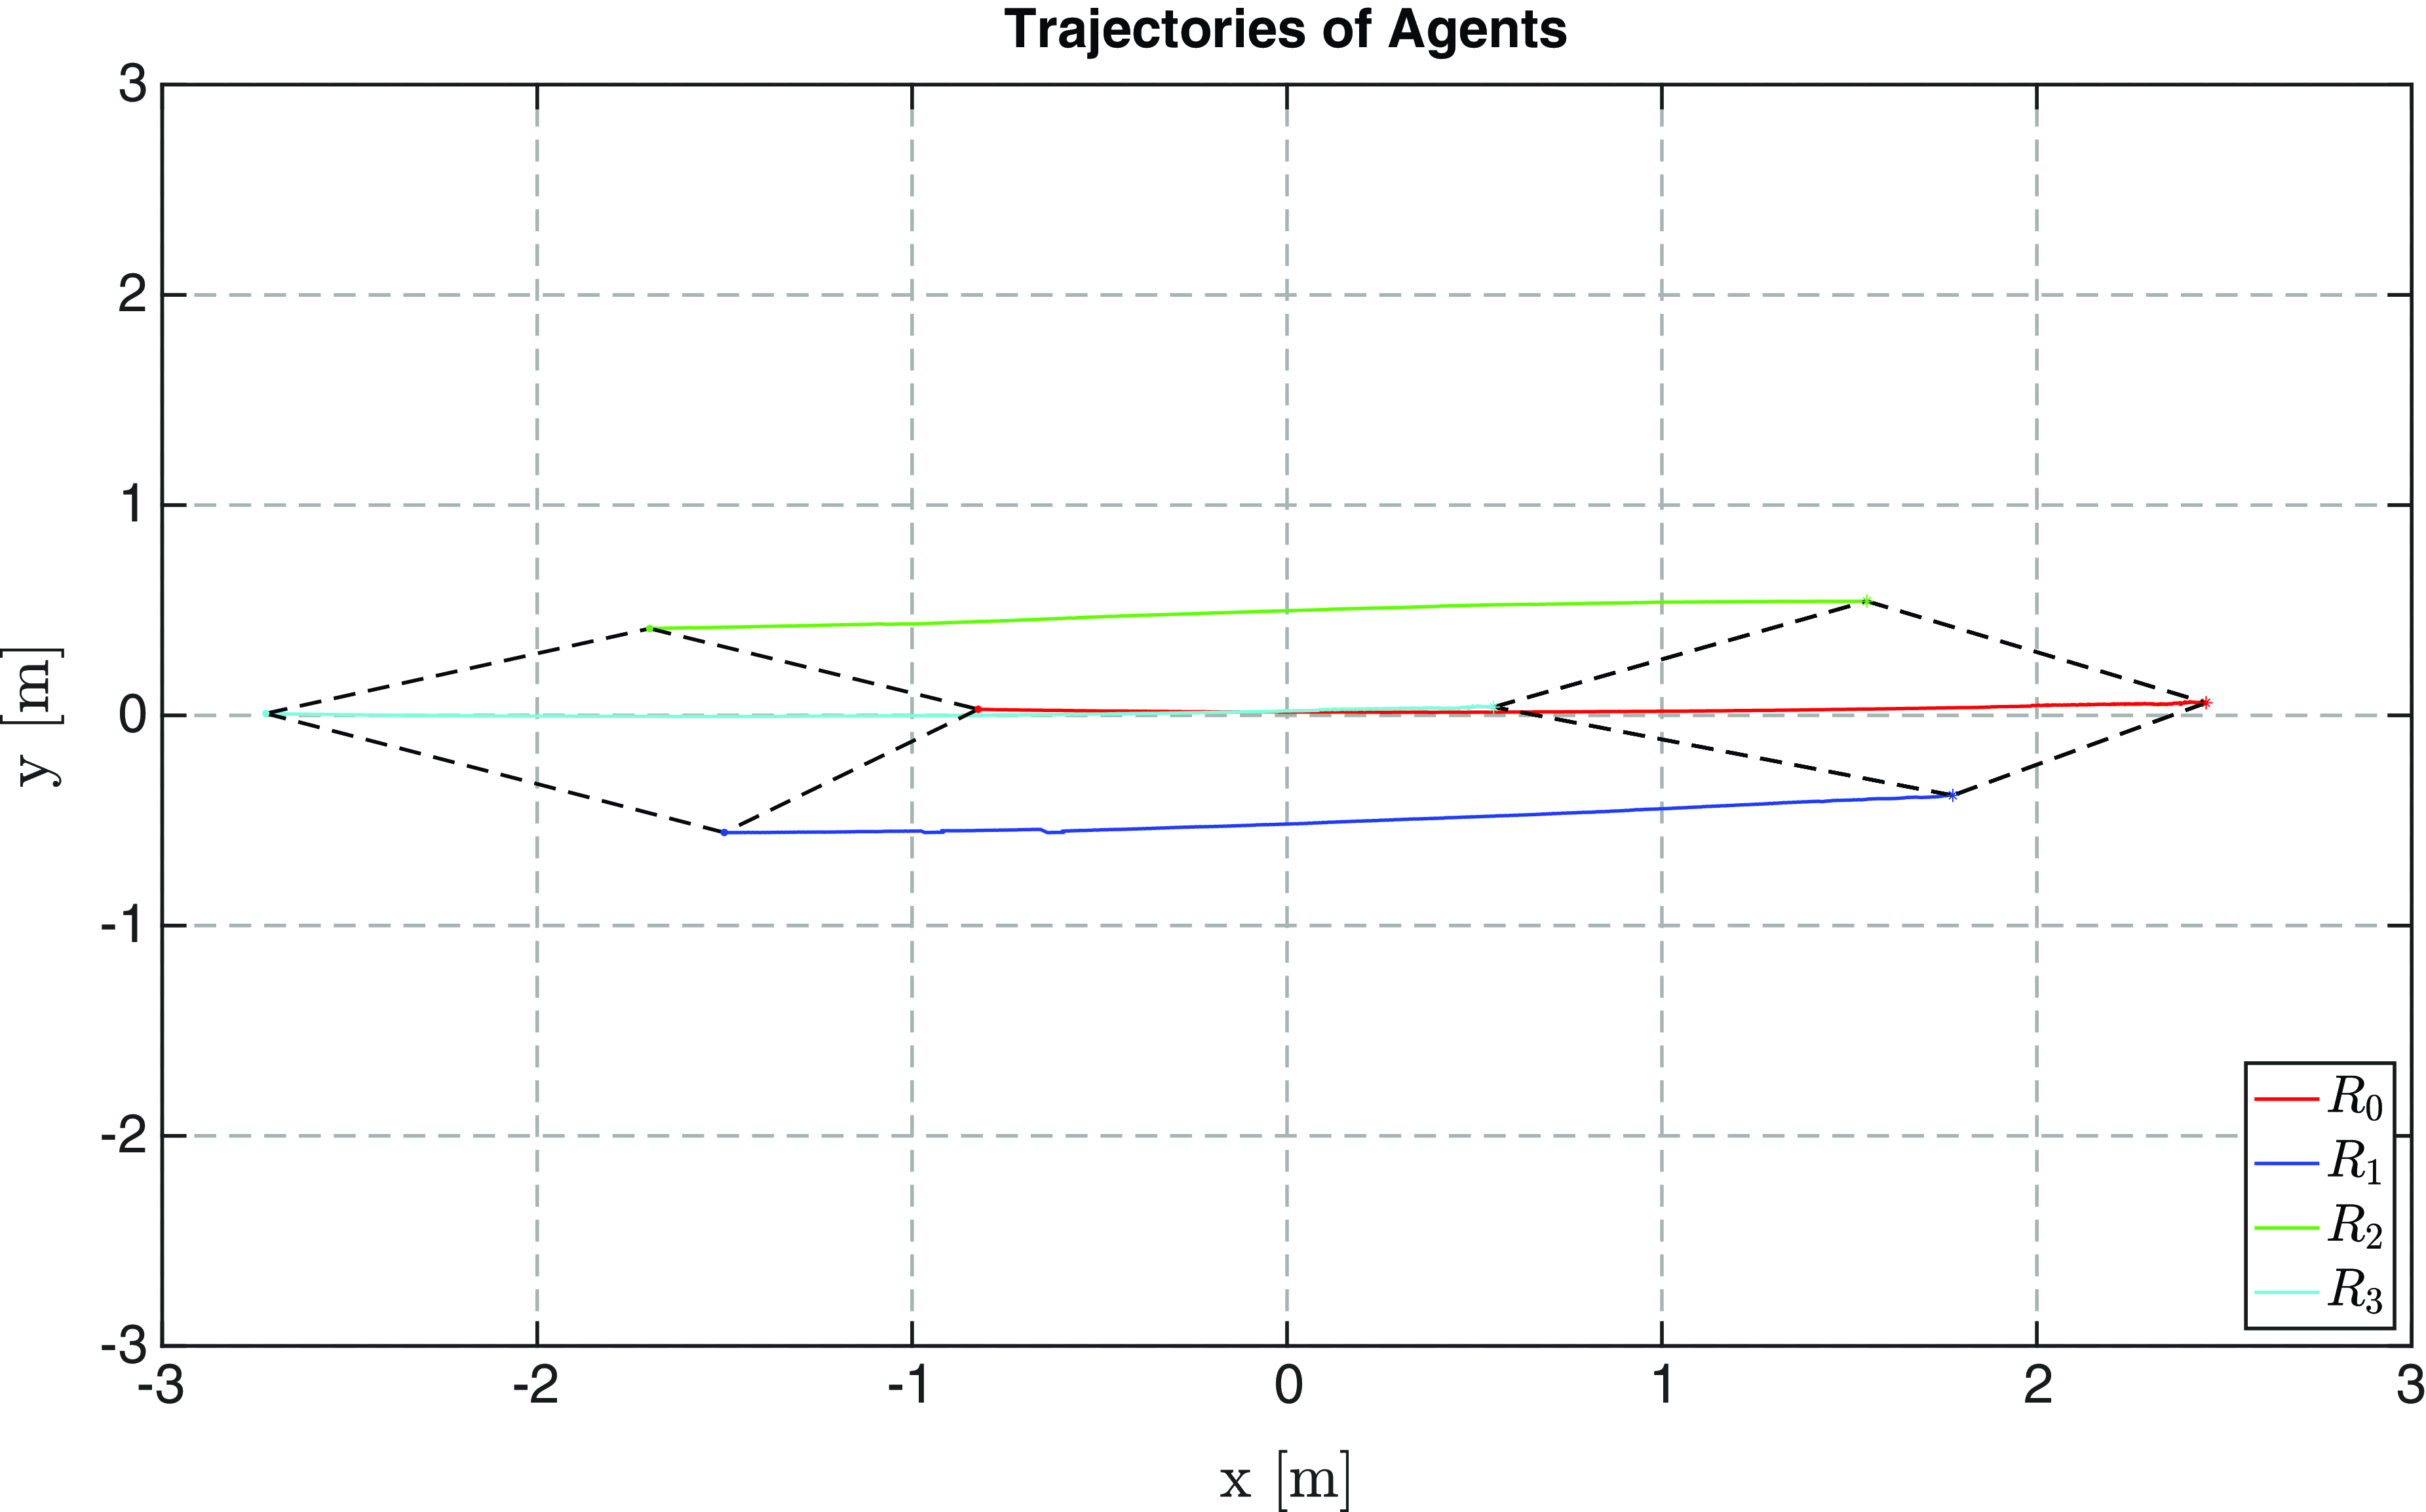
The trajectories of the agents during the indoor experiment. The dotted lines are the edges of the graph at the starting and end positions of the robots.

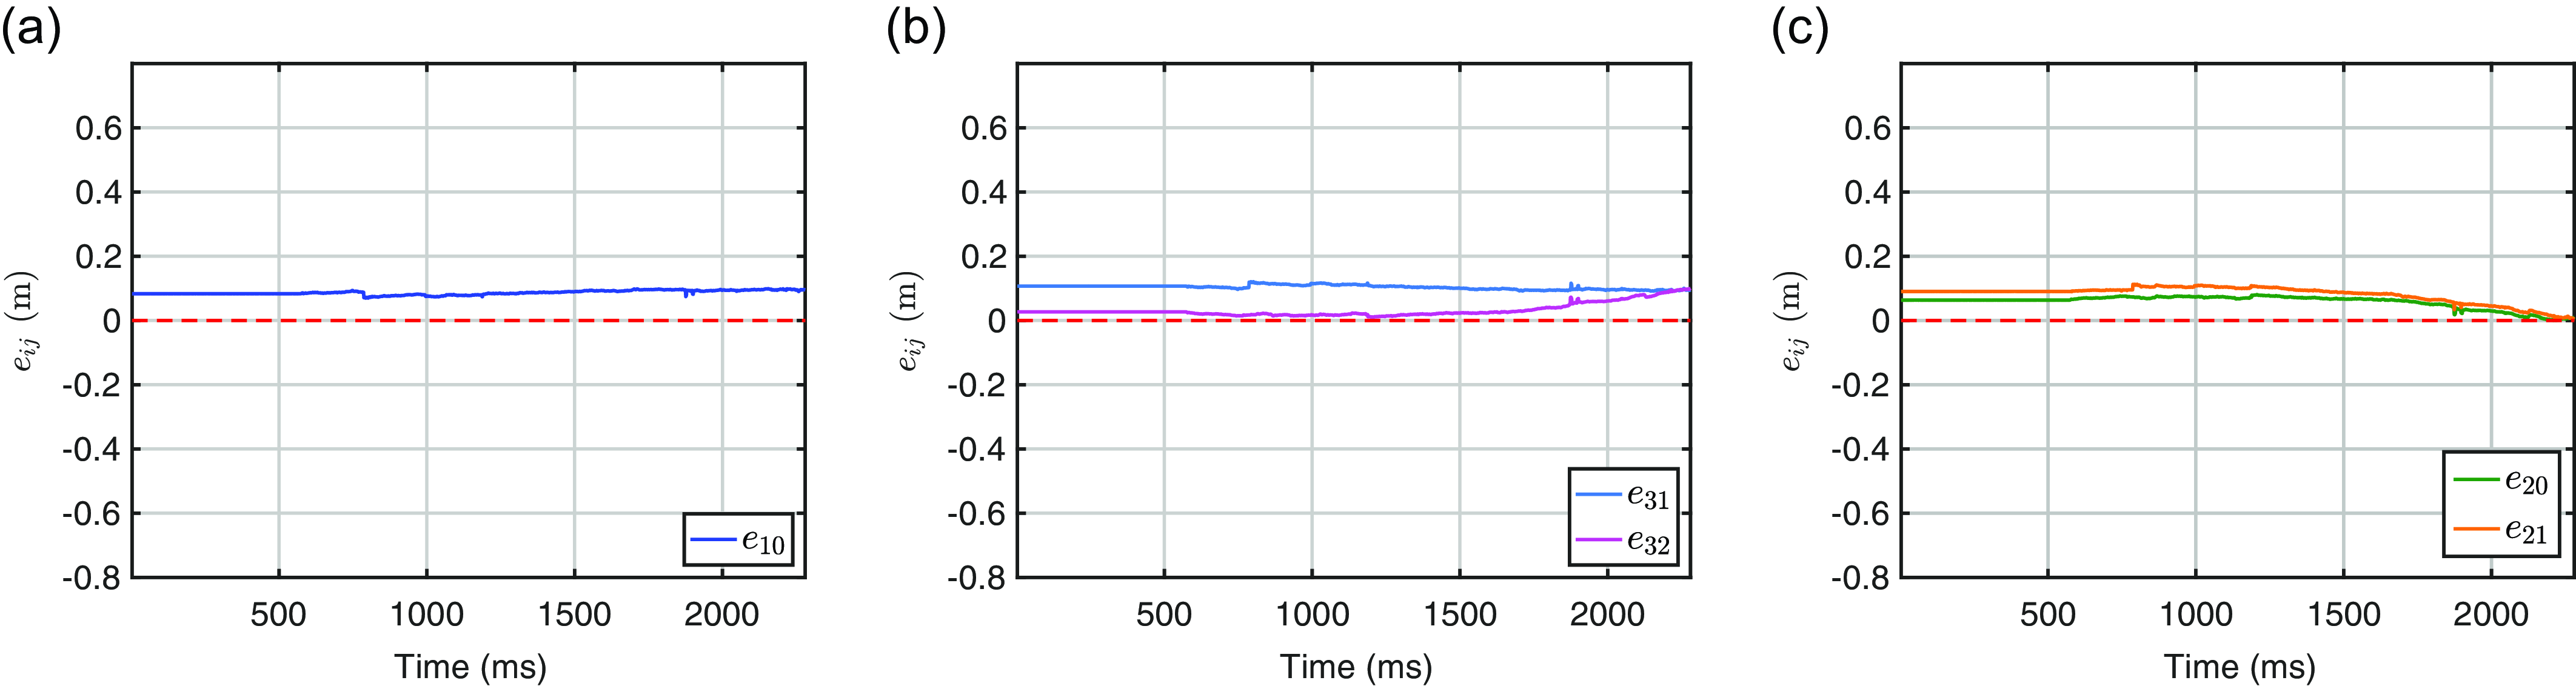
The errors during the simulations: a) The error between the First Follower
 $R_1$
and the leader
 $R_0$
, b) The plot
 $e_{20}$
,
 $e_{21}$
during the indoor experiment c) The plot
 $e_{31}$
,
 $e_{32}$
during the indoor experiment.

To ascertain the practicality of our proposed framework, we executed a series of experiments in an indoor space of dimensions 4.5 m
 $\times$
5.5 m. Our setup comprised a heterogeneous ensemble of four non-holonomic robots: a RosBost equipped with an Asus Tinker board and Rockchip RK3288 as the leader (
 $R_0$
), a Turtlebot3 Burger robot as the first follower (
 $R_1$
), another Turtlebot3 Burger as the second follower (
 $R_2$
), and a second RosBost with identical specifications as the ordinary follower (
 $R_3$
) Figure 18. The sensor suite in our experimental setup was meticulously chosen to optimize performance. It comprised four Decawave UWB modules and three monocular cameras, each enhanced with a Jetson Nano board integrated into the RosBot and Turtlebot systems. This addition was specifically aimed at accelerating the convolutional neural network inference process.
To ensure the highest accuracy in our visual data, all monocular cameras have undergone a thorough calibration process. This step was crucial to eliminate distortions in the final visual outputs and was accomplished using the ROS perception package.Footnote 4 Additionally, our approach to range sensing involved a meticulous calibration process to establish the initial measurement noise, commonly referred to as the bias. The inherent noise present in UWB sensors was addressed through a series of precise measurements. This process enabled us to approximate and subsequently correct the noise impact, ensuring the accuracy of the projected range values. This comprehensive calibration and correction methodology was instrumental in enhancing the overall reliability and precision of our sensor configuration. For ground truth validation, a Vicon mocap camera system was used to track the robots’ absolute positions within a global frame in the experimental arena. It is important to note that the mocap system was solely for validation purposes and not integrated into the robots’ onboard control mechanisms. This setup allowed for precise and accurate ground truth measurements, essential for a rigorous assessment of our system’s performance.
In our tests, we predefined specific desired inter-robot distances:
 $d_{10} = 0.9$
m,
 $d_{20} = 1.2$
m,
 $d_{21} = 1.4$
m,
 $d_{31} = 1.5$
m, and set a linear velocity for the leader
 $R_0$
at
 $\bar {u}_{0}=0.08$
m/s. The results, as depicted in Figures 19 and 20, demonstrate successful convergence of the robots to the flocking motion, adhering to the distance constraints. Overall, our experiments validate the proposed framework’s viability for controlling swarm motion, notably achieved without reliance on any specific positioning infrastructure. This aspect underscores the framework’s adaptability to various indoor and outdoor environments.
8. Discussion and applications
8.1. Qualitative comparison
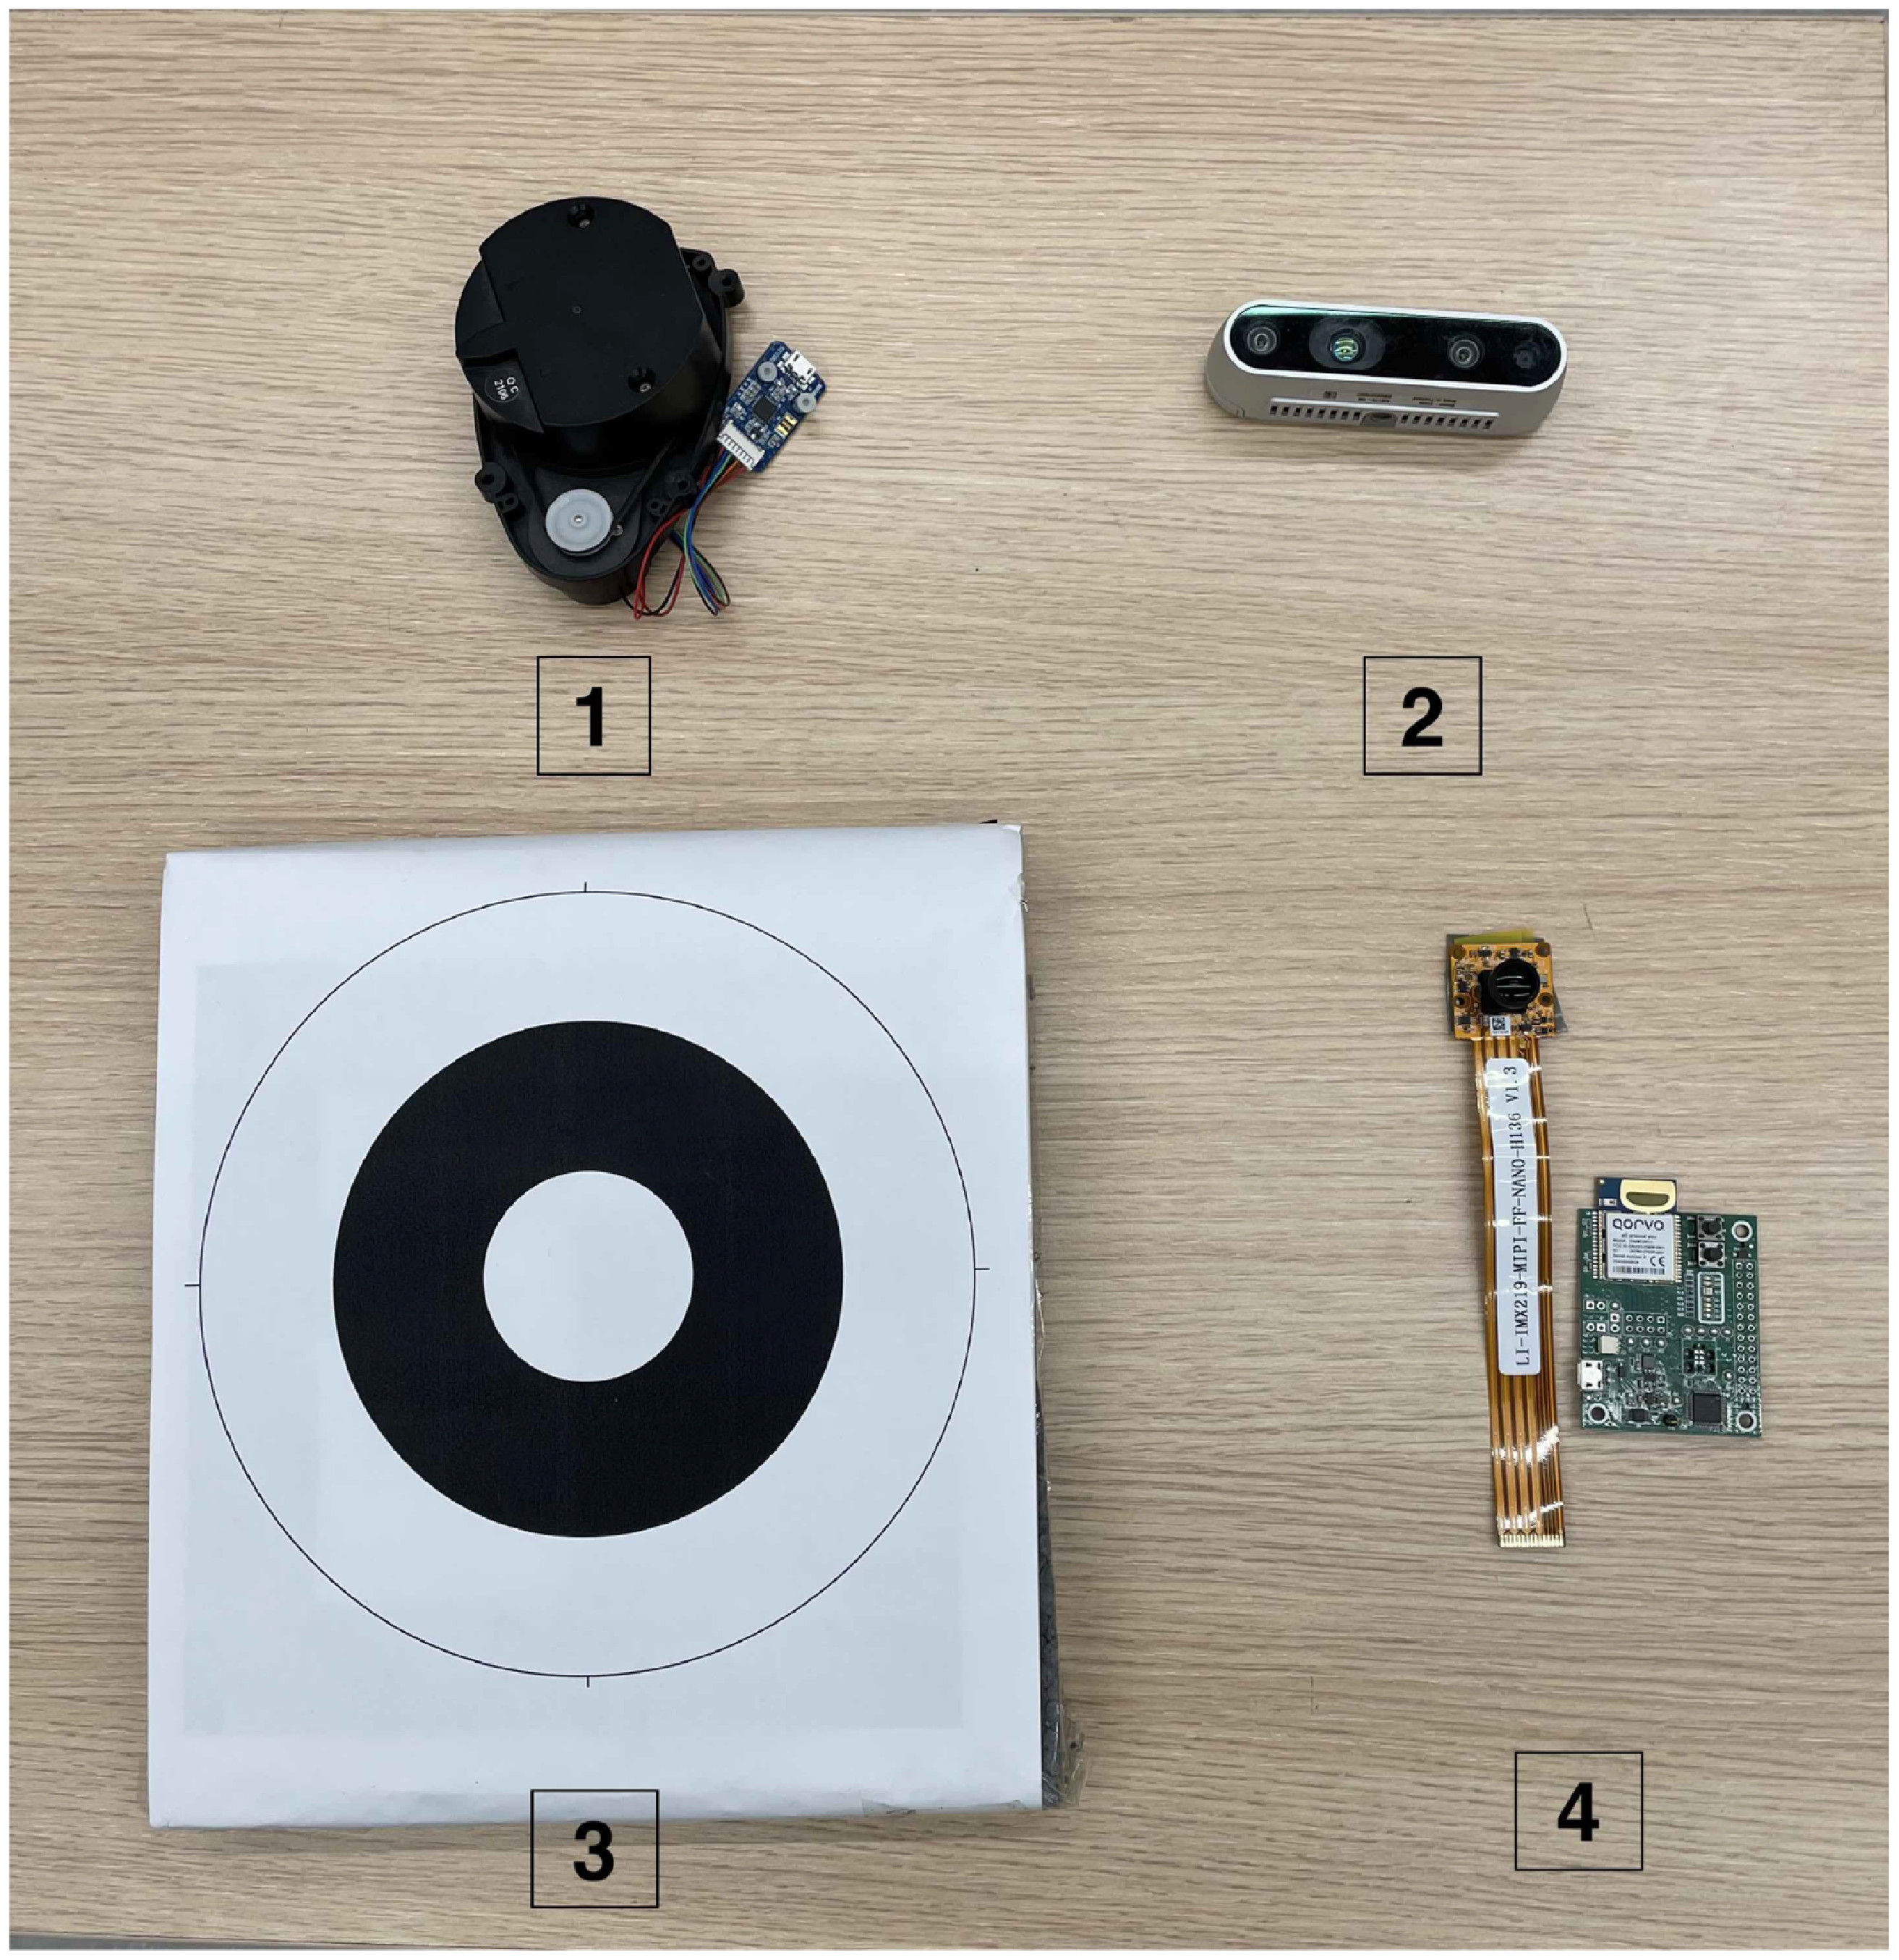
The Comparison and applications: a) The sensors and methods used in the comparison: 1-LDS Lidar, 2-Intel RealSense Depth Camera D435i, 3-A whycon circular marker 4 -Ours: A camera and UWB.

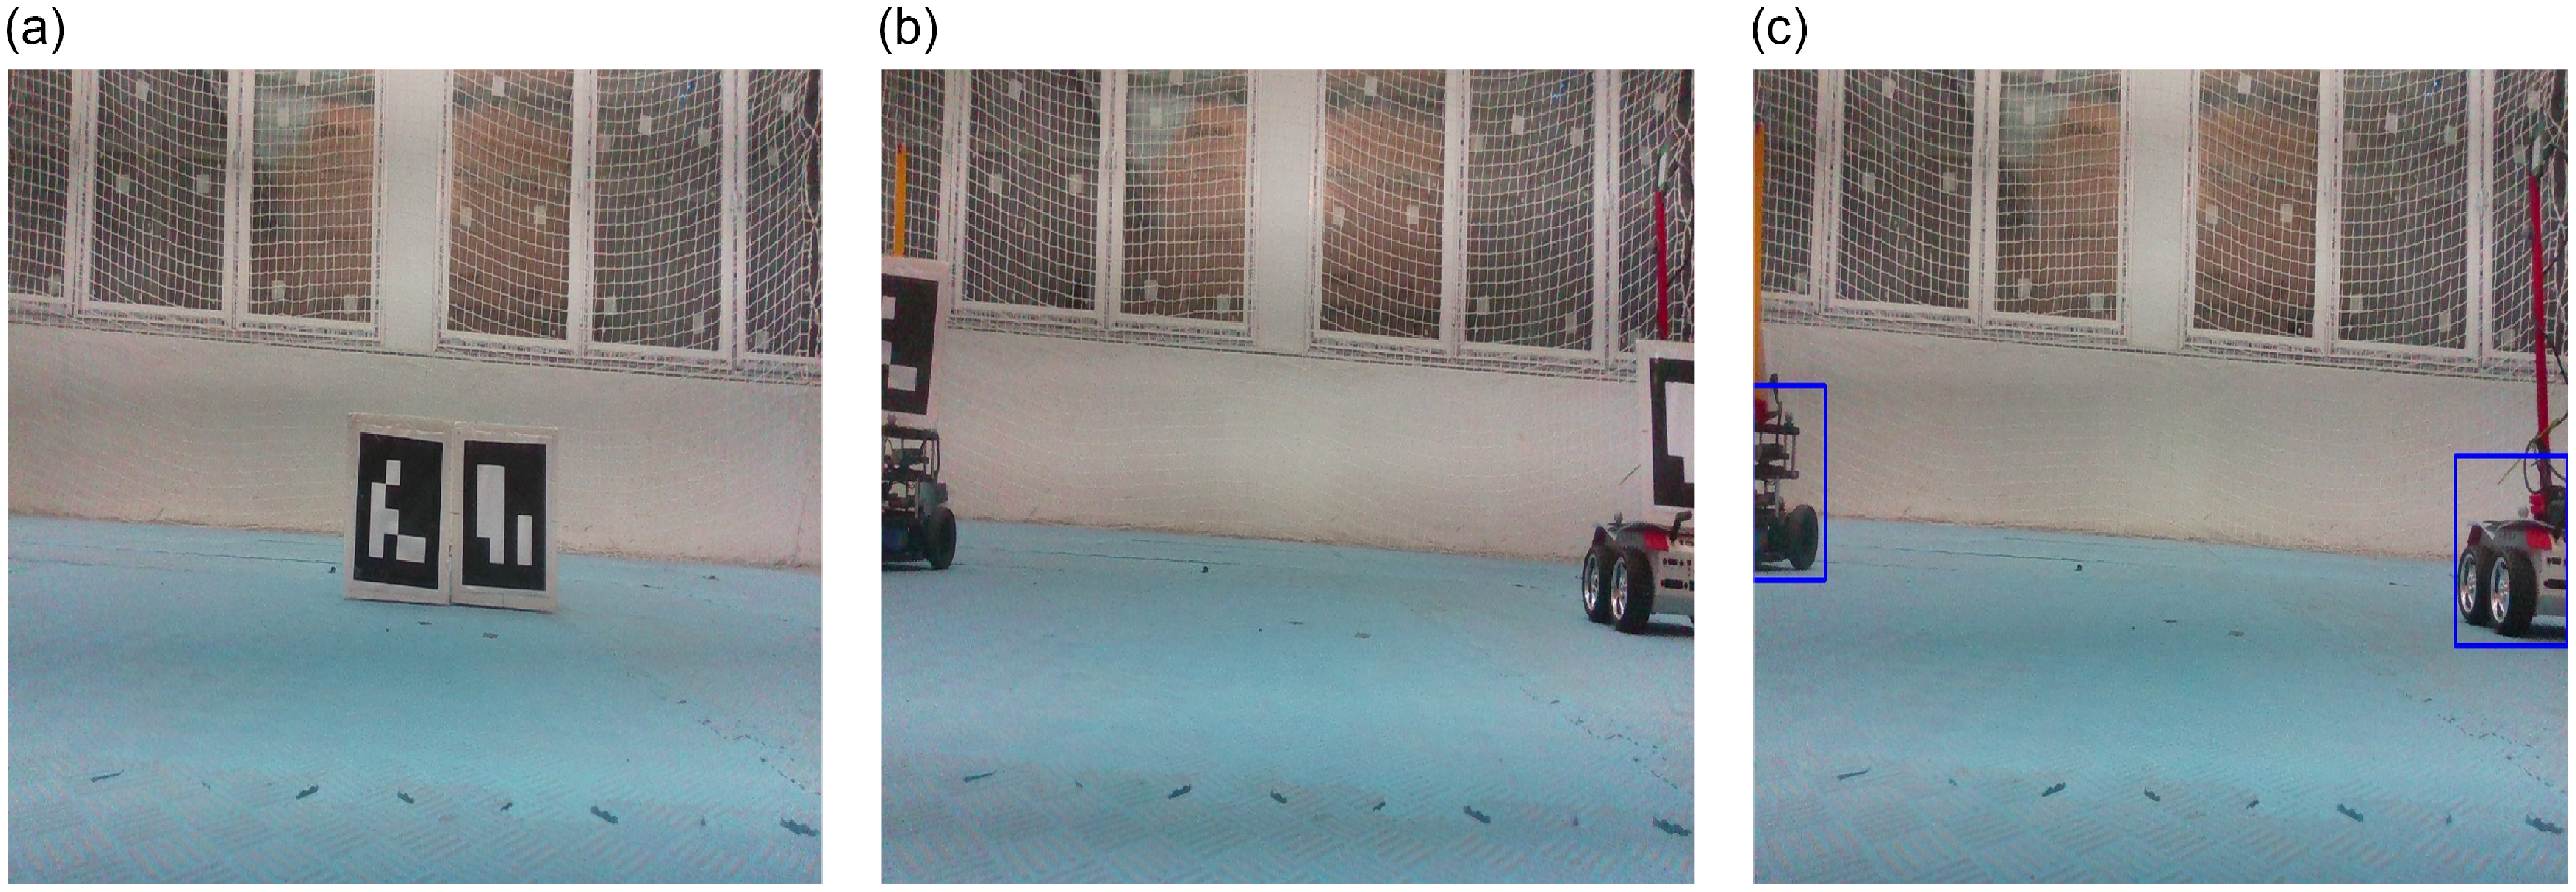
Comparison of our detection against Aruco marker: a) Two Aruco markers, b) The result from Aruco-based approach. C) The detection from a convolutional neural networks-based approach.

This section shows a comparative analysis of our localization framework against prevalent existing methods, elucidating our approach’s distinctive advantages and applicability (Figure 21).
A widely used onboard method is the visual marker-based technique, where each robot is outfitted with a distinct marker carrying an encoded ID and a specific size. This information facilitates relative localization among agents. Nonetheless, this method poses practical challenges, particularly in scenarios involving multiple agents. It necessitates individual marker assignment and customization for each agent, which becomes cumbersome and less feasible, especially in swarm operations. Moreover, while effective in controlled laboratory settings, the marker-based approach encounters significant hurdles when transitioning to real-world environments. For instance, reference [Reference Saska, Baca, Thomas, Chudoba, Preucil, Krajnik, Faigl, Loianno and Kumar18] utilized circular markers to differentiate between agents, a process that may not be as straightforward in diverse operational settings. Our framework, however, employs a marker-free approach, leveraging robust deep-learning detection techniques. This method seamlessly adapts to various environments and scales efficiently to larger numbers of agents without the need for additional markers.
Another limitation of marker-based systems is their reliance on the camera’s field of view (FOV). The effectiveness of these systems is contingent upon having the entire marker within the camera’s FOV, as partial marker visibility impedes accurate data extraction (Figure 22b). In contrast, our deep learning-based detection demonstrates resilience in scenarios of partial visibility, still accurately providing relative positioning information (Figure 22c).
Furthermore, our proposed sensor network approach offers significant advantages in terms of hardware efficiency. Traditional methods, such as those detailed in refs. [Reference Guler, Abdelkader and Shamma10,Reference Nguyen, Qiu, Cao, Nguyen and Xie16], often require redundant hardware for effective operation. For example, [Reference Guler, Abdelkader and Shamma10] employed a leader-follower model necessitating multiple ultra-wideband (UWB) sensors for range measurements. Scaling such a system to include more agents leads to a proportional increase in the required hardware. Our framework, conversely, necessitates only a single range measurement between each target and follower, thereby ensuring a more streamlined and cost-effective solution.
8.2. Quantitative comparison
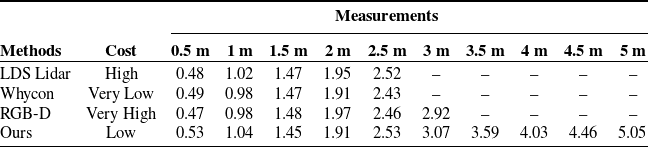
We further conducted a quantitative comparison to assess the efficacy of our approach against some established localization methods (Table I). Our focus was on sensors commonly used in mobile robot localization. We selected two primary sensors and a marker-based method for this comparison, replicating the system described in ref. [Reference Saska, Baca, Thomas, Chudoba, Preucil, Krajnik, Faigl, Loianno and Kumar18].
The first sensor evaluated was the 2D LIDAR, a popular choice for non-holonomic vehicles such as Turtlebots and Rosbots. 2D LIDARs, like the LDS-01, are preferred in small-sized robots for their practicality, offering minimal payload impact and low energy consumption. The LDS-01 features a 360-degree angular range and a
 $1^{\circ }$
angular resolution. We implemented a method to convert LIDAR scans into point clouds, subsequently clustering them to determine object distances [Reference Kabore and Güler12].
The second sensor in our evaluation was the Intel RealSense D435i depth camera, which provides both image and pixel range data. This camera was used to calculate distances between agents, using its RGB capabilities for object detection and point cloud depth for distance measurements.
The quantitative comparison between methods.

For the marker-based approach, we replicated the method available at,Footnote
5
using markers with an outer diameter of 122 mm and an inner diameter of 50 mm. The same camera employed in our framework was used for marker detection. Measurements were conducted at various distances, specifically at
 $d = \{0.5, 1.0, 1.5, 2.0, 3.0, 3.5, 4.0, 4.5, 5.0\}$
m, to thoroughly assess each sensor and the marker-based system’s performance. The cost is defined in terms of the financial expenditure required to acquire and replicate the system.
Our analysis demonstrates that our framework not only provides a more economical solution but also achieves a superior operational range compared to the methods we evaluated. Specifically, the LDS lidar and the Whycon system were limited to a maximum range of
 $2.5$
m, and the depth camera’s effectiveness did not extend beyond
 $3$
m. In contrast, our approach shows potential for effective performance at distances exceeding
 $5$
m, provided that it is supported by datasets encompassing long-range images. For this study, we focused on a dataset capturing mobile robots at distances up to
 $5.5$
m.
9. Conclusion
We have proposed a decentralized, marker-free localization and formation maneuvering framework, applicable to diverse environments. Our contribution lies in the applicability of the proposed mechanism. Particularly, we have provided a scalable relative localization framework for MRS based on two sensing modalities, a formation graph construction method that considers the localization constraints, and proof-of-concept evaluation results. This approach has been validated through simulations and real-world experiments, demonstrating its effectiveness and robustness. Additionally, the provision of an open-source dataset for ground robots marks a significant step toward fostering further research in this field. Overall, our work enhances the capabilities of MRS, paving the way for more efficient and versatile robotic collaborations.
Author contributions
The authors contributed equally to this work, on the design, experiment, and redaction of the manuscript.
Financial support
This work was supported by the 2232 International Fellowship for Outstanding Researchers Programme of TÜBİTAK (Grant No: 118C348)
Competing interests
The authors declare no conflicts of interest exist.
Ethical approval
Not applicable.