Introduction
Cognitive abilities are not static entities, but rather are sculpted by an individual's life experiences. Playing video games, being a professional musician, and mastering chess have all been shown to leave discernible effects on cognition (e.g., Bialystok & DePape, Reference Bialystok and DePape2009; Bialystok, Reference Bialystok2006; Reingold, Charness, Pomplun & Stampe, Reference Reingold, Charness, Pomplun and Stampe2001). In this vein, numerous studies over the past two decades have examined the influence of everyday bilingualism on cognition. Few studies, however, have explored the cognitive effects of perhaps the most demanding bilingual experience, namely, simultaneous interpretation (SI). Simultaneous interpretation is a learned skill that requires an individual to simultaneously comprehend speech in one language, transform the meaning into another language, and produce the resulting output. This skill, similar to playing the violin or chess, likely sculpts the brain of the individuals who practice it.
Simultaneous interpretation lies in a unique position as it is both a form of bilingualism and a learned skill. Thus the cognitive profile associated with interpretation may be reflective of both of these sources. From the literature on bilingualism there is some evidence which suggests that bilinguals are advantaged on tasks that require conflict resolution, attentional control, and shifting between mental sets (e.g., Bialystok, Craik & Luk, Reference Bialystok, Craik and Luk2008; Costa, Hernández & Sebastián-Gallés, Reference Costa, Hernández and Sebastián-Gallés2008; Prior & MacWhinney, Reference Prior and MacWhinney2010; but see Hilchey, Saint-Aubin & Klein, Reference Hilchey, Saint-Aubin, Klein and Schwieter2015; Paap & Greenberg, Reference Paap and Greenberg2013; Paap, Johnson & Sawi, Reference Paap, Johnson and Sawi2015, for contrasting results). These benefits are thought to emerge as the result of the language control necessitated by the parallel activation of a bilingual's two languages (see Kroll, Dussias, Bice & Perrotti, Reference Kroll, Dussias, Bice and Perrotti2015 for a review). To control interference between the languages and produce the intended language, bilinguals are posited to rely on domain-general cognitive control mechanisms (Bialystok et al., Reference Bialystok, Craik and Luk2008; Green, Reference Green1998). The theory is that the experience of managing two languages may lead to enhancements of the domain-general processes involved in directing attention, managing competition, and resolving conflict.
Simultaneous interpretation may be considered to require extreme bilingual language management. Though all bilinguals experience parallel activation of their two languages, in most contexts only one of the languages is in use at any given moment. During SI, however, it has been estimated that about 70% of the time that interpreters are producing output in one language, they are also comprehending input in the other language (Chernov, Reference Chernov, Lambert and Moser-Mercer1994). With this large overlap between the languages, interpreters likely experience greater interference from the non-target language than other bilinguals do. Additionally, the quality of an interpretation depends in part on the production of ‘pure’ target language output. As a result, the negative consequences associated with non-target language intrusions are greater for interpreters than other bilinguals. Thus, interpreters must manage greater levels of interference while producing fewer language errors.Footnote 1 To manage these increased demands, interpreters may further hone their skills in directing attention, managing competition, and resolving conflict. As it is practice with these processes that is posited to lead to enhanced cognitive abilities in bilinguals compared to monolinguals, even further enhancements may be evident among interpreters.
In addition to these quantitative differences, simultaneous interpretation presents demands that render it qualitatively different from other bilingual contexts. As mentioned above, all bilinguals must control the interference created by the availability of two languages. In many bilingual contexts this interference may be controlled through inhibition of the unused language (Dijkstra & van Heuven, Reference Dijkstra, van Heuven, Grainger and Jacobs1998; Green, Reference Green1998). Interpreters, however, must comprehend the input language while monitoring their output in the other language, effectively requiring simultaneous comprehension of both languages. It therefore may not be possible for them to rely solely on inhibition as a method of language management. Instead, interpreters may utilize a language management process in which both languages remain active. Such a hypothesis is supported by Ibáñez, Macizo and Bajo (Reference Ibáñez, Macizo and Bajo2010). In that study bilinguals and translators (with at least two years of interpretation experience) were asked to read and repeat sentences in Spanish and English which included cognate and matched control words. The translators showed faster processing of the cognate words than the control words in both languages, while the bilinguals showed no difference between cognate and control words. Faster processing of cognates is typically understood to indicate the simultaneous activation of two languages. Thus, the translators, but not the bilinguals, appeared to have maintained both languages active.
Simultaneous interpretation additionally recruits a number of processes beyond those strictly involved in language control. SI places a large burden on short-term and working memory. Interpreters must store the content of the input until it can be reformulated and store the reformulation until it is produced. To further complicate matters, oral production is ongoing during these memory processes, preventing the use of the phonological loop for rehearsal. To reduce these seemingly incredible demands on memory, interpreters employ various strategies. Chief among these is the prediction of coming input based on contextual cues (e.g., Seeber & Kerzel, Reference Seeber and Kerzel2011). Finally, interpreters must maintain a high level of alertness to ensure that they do not miss any content.
Thus, similar to experts in other acquired skills, interpreters may show specific enhancements in these areas which are unique to and heavily burdened during SI. Specifically, one may hypothesize that an interpreter advantage, compared to bilinguals, may be discernible in processes which support the active maintenance of two languages, in short-term and working memory abilities, in response to relevant cues, and in alertness. Such findings would suggest enhancements in cognitive abilities that are unique to interpreters. As with other acquired skills, the advantages could be developed through skill learning or be the cause of greater skill attainment.
Previous evidence
Of the relatively few studies on the cognitive abilities of interpreters, the majority focus on verbal memory. The overwhelming result is that professional interpreters have larger verbal working memory and short-term memory spans than various control groups (Bajo, Padilla & Padilla, Reference Bajo, Padilla, Padilla, Chesterman, Gallardo San Salvador and Gambier2000; Christoffels, de Groot & Kroll, Reference Christoffels, de Groot and Kroll2006; Padilla, Bajo, Cañas & Padilla, Reference Padilla, Bajo, Cañas, Padilla and Tommola1995; Signorelli, Haarmann & Obler, Reference Signorelli, Haarmann and Obler2011; Stavrakaki, Megari, Kosmidis, Apostolidou & Takou, Reference Stavrakaki, Megari, Kosmidis, Apostolidou and Takou2012; Yudes, Macizo & Bajo, Reference Yudes, Macizo and Bajo2011, Reference Yudes, Macizo and Bajo2012; but see Köpke & Nespoulous, Reference Köpke and Nespoulous2006). Additionally, effects of interpretation experience are evident on tasks of articulatory suppression. Articulatory suppression is the process of blocking rehearsal of information in the phonological loop of working memory by repetition of unrelated speech during a memorization task. The typical finding is that recall is hindered by articulatory suppression; interpreters, however, show near equivalent recall with and without articulatory suppression (Bajo et al., Reference Bajo, Padilla, Padilla, Chesterman, Gallardo San Salvador and Gambier2000; Padilla, Bajo & Macizo, Reference Padilla, Bajo and Macizo2005; Padilla et al., Reference Padilla, Bajo, Cañas, Padilla and Tommola1995; Yudes et al., Reference Yudes, Macizo and Bajo2012; but see Köpke & Nespoulous, Reference Köpke and Nespoulous2006). These studies support a view of enhanced verbal memory among professional interpreters; however, they do not address the potential of a domain-general benefit in memory or of enhancements in other processes recruited during SI.
Three studies have begun to address the possibility of enhancements in processes beyond memory, specifically those which have previously evidenced bilingual advantages. Yudes and colleagues (Reference Yudes, Macizo and Bajo2011) examined monolinguals, bilinguals, and professional interpreters on the Simon task and found no differences between the groups. Although, group differences were apparent on a card sorting task, which has previously shown bilingual advantages among children (e.g., Bialystok & Martin, Reference Bialystok and Martin2004; Carlson & Meltzoff, Reference Carlson and Meltzoff2008), but not adults (Kousaie, Sheppard, Lemieux, Monetta, & Taler, Reference Kousaie, Sheppard, Lemieux, Monetta and Taler2014). In another study, the Attention Network Test for Interaction-Vigilance (ANTI-V) was used to assess professional intepreters and bilinguals (Morales, Padilla, Gómez-Ariza & Bajo, Reference Morales, Padilla, Gómez-Ariza and Bajo2015). The conflict resolution measure yielded no group differences, though differences were seen in the orienting network where the interpreters consistently made use of a visual cue and the bilinguals only when an alerting tone was present. Finally, in Köpke & Nespoulous (Reference Köpke and Nespoulous2006), professional interpreters, students of interpretation, and bilinguals were tested on color-word Stroop tasks in English and French. No differences between the groups were seen on the unilingual versions; one of the bilingual versions (words written in L2 English, respond in L1 French) did show an advantage for the students of interpretation.
While these three studies found a general absence of differences between professional interpreters and bilinguals, factors other than interpretation experience may have contributed to the null results. The interpreters tested by Yudes and colleagues (Reference Yudes, Macizo and Bajo2011) were significantly older than the bilinguals, who were in their mid-twenties. Thus, an effect due to SI experience may be obscured by a confounding effect of age. Similarly, an age difference was present between the students of interpretation and the professional interpreter and bilingual groups in Köpke & Nespoulous (Reference Köpke and Nespoulous2006). Additionally, the Stroop paradigm used in that study calculated the number of correct responses given in 45 seconds. This measure is less sensitive than the typically-used Stroop effect or overall response time measures, on which a bilingual advantage has previously been seen. Finally, in all three studies, the control group was composed of individuals who spoke two languages (i.e., bilinguals). Interpreters, on the other hand, often speak three or more languages (European Commission, 2014). To make a valid comparison between the groups, biographical factors including age and the number of languages spoken should be matched.
The Present Study
The present study investigated how experience with simultaneous interpretation sculpts the human mind. Specifically, we aimed to understand whether interpreters exhibit enhancements which are an extenstion of previously-seen benefits of bilingualism or if they display enhancements that are unique to the interpretation experience. Further we sought to validate previous findings in the SI literature using a better-matched control group. To this end, we tested professional simultaneous interpreters and a group of multilinguals matched on biographical and language factors on a battery of tasks focused on memory and executive functioning. Both verbal and spatial memory were tested allowing us to replicate and extend the advantage in memory. Executive functioning was tested with three tasks selected to examine both previously noted bilingual benefits and potential benefits unique to SI.
The Stroop task has been widely used to examine executive control and conflict resolution. Previous studies focused on bilingual differences have found a smaller Stroop effect for bilinguals compared to monolinguals (e.g., Bialystok et al., Reference Bialystok, Craik and Luk2008; Hernández, Costa, Fuentes, Vivas & Sebastián-Gallés, Reference Hernández, Costa, Fuentes, Vivas and Sebastián-Gallés2010).
In the non-linguistic domain, the flanker task has often been employed to explore executive control and conflict resolution. Bilinguals have shown both a smaller difference between congruent and incongruent trials and overall faster responses than monolinguals on this paradigm (e.g., Costa, Hernández, Costa-Faidella & Sebastián-Gallés, Reference Costa, Hernández, Costa-Faidella and Sebastián-Gallés2009; Costa et al., Reference Costa, Hernández and Sebastián-Gallés2008; Luk, De Sa & Bialystok, Reference Luk, De Sa and Bialystok2011; but see Antón, Duñabeitia, Estévez, Hernández, Castillo, Fuentes, Davidson & Carreiras, Reference Antón, Duñabeitia, Estévez, Hernández, Castillo, Fuentes, Davidson and Carreiras2014; Paap & Greenberg, Reference Paap and Greenberg2013; Paap, Johnson & Sawi, Reference Paap, Johnson and Sawi2014). A modified version of the traditional flanker task, the Attention Network Test (ANT; Fan, McCandliss, Sommer, Raz & Posner, Reference Fan, McCandliss, Sommer, Raz and Posner2002), allows the examination of the alerting and orienting networks in addition to the executive control network. Unlike the executive control network, bilingual advantages have not typically been seen in the orienting (e.g., Antón et al., Reference Antón, Duñabeitia, Estévez, Hernández, Castillo, Fuentes, Davidson and Carreiras2014; Costa et al., Reference Costa, Hernández, Costa-Faidella and Sebastián-Gallés2009, Reference Costa, Hernández and Sebastián-Gallés2008; Hernández et al., Reference Hernández, Costa, Fuentes, Vivas and Sebastián-Gallés2010; Paap & Greenberg, Reference Paap and Greenberg2013) and alerting networks (e.g., Antón et al., Reference Antón, Duñabeitia, Estévez, Hernández, Castillo, Fuentes, Davidson and Carreiras2014; Costa et al., Reference Costa, Hernández, Costa-Faidella and Sebastián-Gallés2009; Paap & Greenberg, Reference Paap and Greenberg2013; Poarch & van Hell, Reference Poarch and van Hell2012; but see Costa et al., Reference Costa, Hernández and Sebastián-Gallés2008). The orienting and alerting networks may, however, reveal advantages specific to SI due, respectively, to the strategy of predicting future input and the high level of alertness required.
The final task considered was a non-linguistic task-switching paradigm. Completion of this paradigm involves the use of two dissociable control processes: transient (or local) control and sustained (or global) control (Braver, Reynolds, & Donaldson, Reference Braver, Reynolds and Donaldson2003; Koch, Prinz, & Allport, Reference Koch, Prinz and Allport2005; Kray & Lindenberger, Reference Kray and Lindenberger2000). Transient control, measured by the switching cost, is recruited on a trial-by-trial basis to switch between task sets. On the other hand, sustained control, measured by the mixing cost, involves the active maintenance of multiple task sets and attentional monitoring for task changes (Braver et al., Reference Braver, Reynolds and Donaldson2003). Some previous studies conducted with adults have noted bilingual advantages in transient control, while few studies have seen differences in sustained control (Garbin, Sanjuan, Forn, Bustamante, Rodriguez-Pujadas, Belloch, Hernandez, Costa & Ávila, Reference Garbin, Sanjuan, Forn, Bustamante, Rodriguez-Pujadas, Belloch, Hernandez, Costa and Ávila2010; Prior & Gollan, Reference Prior and Gollan2011; Prior & MacWhinney, Reference Prior and MacWhinney2010; Wiseheart, Viswanathan & Bialystok, Reference Wiseheart, Viswanathan and Bialystok2014; but see Hernández, Martin, Barceló & Costa, Reference Hernández, Martin, Barceló and Costa2013; Paap & Greenberg, Reference Paap and Greenberg2013). A unique interpreter advantage may be expected in sustained control, however, given the need to maintain multiple languages in parallel during simultaneous interpretation as suggested by Ibáñez and colleagues (Reference Ibáñez, Macizo and Bajo2010).
These three tasks allowed us to examine the possibilities of both increased bilingual benefits in interpreters and benefits specific to simultaneous interpretation. If interpreters are expert bilinguals and continue to garner bilingual benefits due to increased language control practice we expect to see differences between the interpreters and multilinguals in conflict resolution on the Stroop and ANT tasks and in transient control on the task-switching paradigm. If interpreters, similar to other skilled professionals, develop abilities unique to SI we expect that group differences might emerge in the alerting and orienting networks in the ANT or in sustained control in the task-switching paradigm. Benefits of both types may also be seen as they are not in principle mutually exclusive. Finally, on the tests of memory, we expected to see an advantage among interpreters on the verbal memory tasks and a possible advantage on spatial memory as well.
Methods
Participants
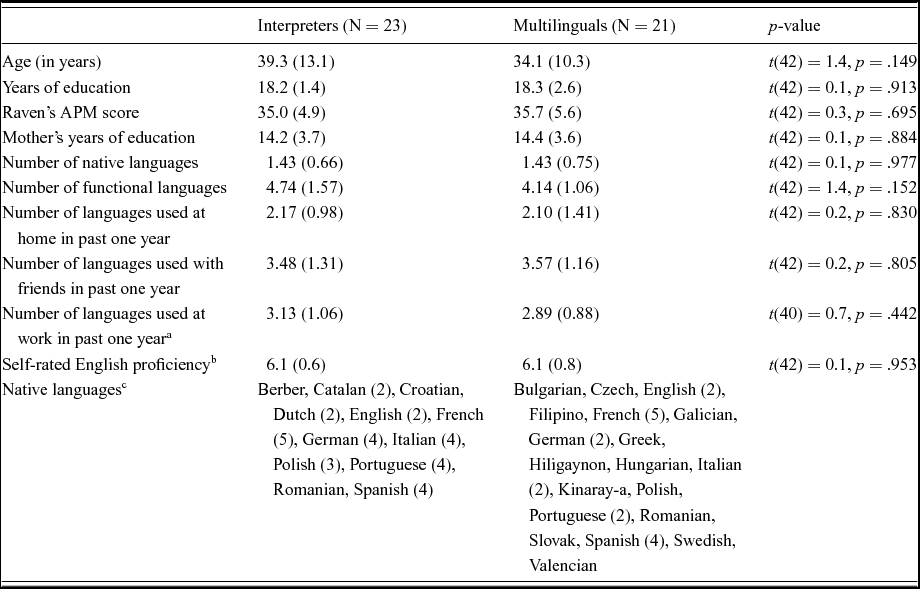
Twenty-three professional interpreters (18 females) and twenty-one multilinguals (17 females) participated in the study. All participants had normal or corrected-to-normal vision and reported no history of neurological or psychological problems. Additionally, participants were required to speak English since that was the language chosen for testing and consent. All participants reported normal color vision, which was confirmed for all but one participant with the Ishihara Color Test (Ishihara, Reference Ishihara1972). One multilingual participant had a below normal score on the Ishihara Color Test, however his data were not excluded because he was not identified as an outlier from his group on any task. Additionally, his performances on the color and shape tasks in the task-switching paradigm were comparable. All participants were living and working in the Brussels area at the time of testing. The professional interpreters’ group was formed of individuals working in simultaneous interpretation at the time of testing with a minimum of one year of experience (mean = 13 years, range 1–42 years) and forty-five working days per year (mean = 149 days, range 45–234 days). The multilingual individuals were professionals who used at least two languages on a daily basis and reported no experience with simultaneous interpretation. Importantly, the two groups were matched on a number of biographical factors to ensure that any differences seen were due to experience with interpretation and not due to other underlying causes. These factors included age, years of education, intelligence (measured with Raven's Advanced Progressive Matrices; Raven, Raven & Court, Reference Raven, Raven and Court1998), and socioeconomic status (using the proxy of mother's years of education; Gottfried, Gottfried, Bathurst, Guerin & Parramore, Reference Gottfried, Gottfried, Bathurst, Guerin, Parramore, Bornstein and Bradley2003; Noble, McCandliss & Farah, Reference Noble, McCandliss and Farah2007; Stevens, Lauinger & Neville, Reference Stevens, Lauinger and Neville2009; see Table 1).
Biographical factors

Notes: Values reported are means with standard deviations in parentheses. aThe data from three participants were not available as they had not worked in the year prior to testing. bThe average across the four skills areas is reported. cThe number of participants with each native language is reported in parentheses. The total is greater than the number of participants as some participants had more than one native language.
The groups were additionally matched on factors related to their language experience. These data were collected through an in-house language history questionnaire. Participants provided information about all the languages they knew and/or studied. For each language they were asked to detail how and when they learned the language and to provide a self-rating in the areas of reading, writing, speaking, and understanding on a 7-point Likert scale. Participants were also asked to evaluate how often they switched between languages within a conversation using a 7-point Likert scale. This was considered in periods throughout their lifetime at home, with friends, and at work (each situation evaluated separately), as well as within the year prior to testing for the following situations: thinking, dreaming, talking to oneself, and expressing anger and affection. Finally, they were asked to quantify, using percentages, how much they used each language in the above periods and situations and some additional situations evaluated in the year prior to testing.
Based on these data, the two groups were matched on their number of native languages (defined as languages learned and used regularly in the first four years of life) and functional languages at the time of testing (defined as languages receiving an average self-rating across the four areas of at least 4). By matching these factors we avoided potential confounds; some previous research has suggested that advantages in executive functioning may appear in early bilinguals compared to late bilinguals (e.g., Bialystok, Craik & Luk, Reference Bialystok, Craik and Luk2012; Luk et al., Reference Luk, De Sa and Bialystok2011; Tao, Marzecová, Taft, Asanowicz & Wodniecka, Reference Tao, Marzecová, Taft, Asanowicz and Wodniecka2011; but see Paap et al., Reference Paap, Johnson and Sawi2014) and multilinguals compared to bilinguals (e.g., Bialystok, Craik, Green & Gollan, Reference Bialystok, Craik, Green and Gollan2009; Kavé, Eyal, Shorek & Cohen-Mansfield, Reference Kavé, Eyal, Shorek and Cohen-Mansfield2008). Additionally, the two groups were matched on their switching frequency in most situations. They differed on only three period-situation pairs: with friends after age 25 (t(38) = 2.2, p = .031), with friends in the year prior to testing (t(42) = 3.4, p = .001), and marginally at work in the year prior to testing (t(39) = 1.8, p = .071). In all three cases, the multilingual group reported a higher rate of switching than the interpreters. Further, the groups were matched on the number of languages they used (calculated from the percent usage questionnaire counting languages assigned at least 5%) at home, with friends, and at work across all time periods (ts < 1, ps ≥ .324). Finally, there was no difference in English proficiency between the groups (t(42) = 0.1, p = .953), which was on average very high (mean = 6.1, range 4–7). Indeed, all of the interpreters used English as one of their interpretation languages (either passively or actively) and all of the multilinguals reported using English at least 20% of the time at work in the year prior to testing (mean = 54%, range 20% - 92%).
All participants gave written informed consent and were offered compensation for their time. The study was approved by the Bioethical Committee of Azienda Ospedaliera of Padova and the ethical committee of the Faculty of Psychological Sciences and Education at the Université Libre de Bruxelles.
Tasks and Procedure
Memory tests
Short-term memory (STM) was assessed in the verbal and spatial domains using computerized versions of the letter span and matrix span tasks (Kane, Hambrick, Tuholski, Wilhelm, Payne & Engle, Reference Kane, Hambrick, Tuholski, Wilhelm, Payne and Engle2004). These tasks were comparable in their format; participants viewed a sequence of items of variable length and were asked to recall the items in the order they were presented at the end of each sequence. Three sequences of each length were presented with the length selected randomly on each trial. The to-be-recalled items in the letter span task were twelve consonants. Each item was presented for 1000 ms and the length of sequences ranged from three to eight items. In the matrix span task the items consisted of a 4x4 grid with one square colored red; the position of the red square was the to-be-recalled item. Each item was presented for 650 ms and sequences contained two to seven items. For both tasks performance was measured by the sum of items in perfectly recalled sequences, denoted the absolute score by Engle and colleagues (Engle, Tuholski, Laughlin, & Conway, Reference Engle, Tuholski, Laughlin and Conway1999).
Verbal and spatial working memory (WM) were assessed using the automated operation span task and the automated symmetry span task, respectively (Unsworth, Heitz, Schrock, & Engle, Reference Unsworth, Heitz, Schrock and Engle2005). These tasks followed the same format. Similar to the STM tasks, participants were asked to recall sequences of items of varying length; however, prior to each item of the sequence an intervening task was presented. Participants were trained on each task component separately and together before completing the test sequences. In the operation span task the to-be-recalled items were the twelve consonants used in the letter span task. The intervening task was an arithmetic operation (e.g., (2x6) - 4 = ?). Sequences consisted of three to seven operation-letter pairs. The to-be-recalled items in the symmetry span task were identical to those in the matrix span task. The intervening task required a symmetry judgment. Sequences contained two to five symmetry-square pairs. In both tasks three sequences of each length were presented with the length randomly selected on each trial. In addition to the absolute score, the number of errors on the intervening task was also recorded. This included incorrect responses and responses that required a much longer than average response time (calculated during intervening task training).
Color-word Stroop task
This task was a translated and shortened version of the task presented in Puccioni and Vallesi (Reference Puccioni and Vallesi2012). Stimuli consisted of four English color words (BLUE, RED, GREEN, YELLOW) presented individually in ink of one of the four colors (blue, red, green, yellow). English was chosen as the language for this task since it was a guaranteed common language among the participants. Additionally, since the two groups did not differ in English proficiency (see Participants section), any potential group differences should not be due to differences related to proficiency level. Participants were asked to ignore the word and identify the ink color by pressing the correspondingly colored button on a Cedrus RB-834 response pad (www.cedrus.com; the color-button mappings were counterbalanced across participants) as quickly and accurately as possible. Each stimulus was categorized as congruent (e.g., BLUE presented in blue ink) or incongruent (e.g., BLUE presented in red ink). Roughly half of the trials were congruent and half incongruent. Only complete alternation sequences were employed, meaning that neither the ink color nor the word color used in trial n was used in either way (ink or word) in trial n+1, thus minimizing both positive and negative priming confounds (see Puccioni & Vallesi, Reference Puccioni and Vallesi2012 for details).
The task comprised two blocks of 64 trials each with a short rest break between the blocks. Trials consisted of stimulus presentation in the center of the screen for 500 ms, a 2000 ms blank response screen, and an additional blank screen beyond the response time limit, which lasted randomly and continuously between 250 and 700 ms. Prior to the experimental blocks participants completed a training block to ensure that all participants understood the task. This training block was composed of 16 items representing all possible word-ink combinations. Items were presented on screen until a response was made. Feedback about accuracy and speed followed the response and lasted on screen for 1200 ms, followed by a 500 ms inter-trial interval. All participants reached the criterion (10 correct trials out of 16) to move onto the experimental trials in one run of the training block.
The primary comparison to be drawn from this task was the difference in accuracy and response time to congruent and incongruent trials, termed the Stroop effect. This difference gave a measure of conflict resolution.
ANT
This task was adapted from Costa and colleagues (Reference Costa, Hernández and Sebastián-Gallés2008, Reference Costa, Hernández, Costa-Faidella and Sebastián-Gallés2009). The target stimuli consisted of five arrows situated either above or below a central fixation cross. The four ‘outside’ arrows pointed in a uniform direction, while the central arrow could point in either the same direction as the others (congruent) or the opposite direction (incongruent). A balance of 75% of trials congruent and 25% incongruent was selected to increase the sensitivity of the conflict effect (Costa et al., Reference Costa, Hernández, Costa-Faidella and Sebastián-Gallés2009). Participants were asked to indicate the direction of the central arrow using the leftmost and rightmost buttons on a Cedrus RB-834 response pad. Prior to each target stimulus a cue appeared which belonged to one of four types: no cue, central cue, double cue, and spatial cue. In no cue trials the fixation cross remained throughout the cue period. The central cue was an asterisk in the place of the fixation cross. The double cue was the fixation cross plus asterisks at both potential locations of the central arrow (above and below the fixation cross). The spatial cue was the fixation cross plus an asterisk at the location where the central arrow would occur (either above or below the fixation cross). The cue types were equally distributed across the congruent and incongruent trials.
The task included two blocks of 128 trials each with a short rest break between the blocks. Each trial began with a 400 ms fixation cross followed by the cue (no cue, central cue, double cue, or spatial cue), which appeared for 100 ms, followed by fixation for another 400 ms. The target then appeared and remained on screen until the end of the trial which was marked by the participant's response or the expiration of 1700 ms. Participants completed 8 practice trials prior to the experimental blocks.
This task allowed the examination of three attentional networks devoted to executive function, alerting, and orienting. The executive function network was measured with the conflict effect which is the difference in accuracy or response time between congruent and incongruent trials. The difference between trials with no cue and those with a double cue provided a measure of the alerting network. Finally, the orienting effect was calculated as the difference between trials with a spatial cue and trials with a central cue.
Task-switching paradigm
The paradigm was a modified version of the paradigm used in Rubin and Meiran (Reference Rubin and Meiran2005). Stimuli were red and blue hearts and stars presented individually on a white background. On each trial participants were asked to respond to either the color or the shape of the stimulus. The task to be completed was indicated by a visual cue located above the stimulus. To limit the use of linguistic information graphic cues were used. The color task cue consisted of three colored rectangles (purple, orange, and yellow) arranged linearly. Similarly, the shape task cue consisted of three black shapes (triangle, circle, and square) arranged linearly. Participants were required to make a choice response to each trial using the leftmost and rightmost buttons on a Cedrus RB-834 response pad. The four possible response-to-button mappings (left: red/heart, right: blue/star; left: red/star, right: blue/heart; left: blue/heart, right: red/star; left: blue/star, right: red/heart) were counterbalanced across participants.
Trials began with a fixation cross presented for 1500 ms followed by cue presentation. Two cue-to-target intervals (CTI) were employed (100 or 1000 ms), which were distributed randomly and equally across trials. This choice allowed the examination of potential differences in endogenous and exogenous task reconfiguration (Meiran, Reference Meiran1996; Rogers & Monsell, Reference Rogers and Monsell1995). Following the CTI, the stimulus was presented in the center of the screen, below the cue, which remained onscreen. The trial concluded when the participant gave a response. Incorrect responses were followed by a 100 ms beep.
Participants completed five blocks of trials which formed a sandwich design. Blocks 1, 2, 4, and 5 were single-task blocks in which only one task (color or shape) was presented for the entire block. One task was presented in blocks 1 and 5 and the other task in blocks 2 and 4; the specific assignment was counterbalanced across participants. The single-task blocks each consisted of 6 practice trials and 24 experimental trials. Block 3 was a mixed-task block with half of the trials requiring a color judgment and the other half a shape judgment. This block included 10 practice trials followed by 192 experimental trials with a short rest break at the halfway point. Half of the trials were repetition trials in which the task to be completed was the same as on the previous trial and half were switch trials in which the task was different from on the previous trial.
The three trial types (switch, repetition, and single-task) led to two main comparisons. The comparison of the switch and repetition trials in the mixed-task block was informative about the transient control needed to switch tasks. The difference in response time (RT) or accuracy between these trial types is termed the switching cost. Comparing the repetition trials in the mixed-task block and trials in the single-task block provided a gauge of the sustained control needed in the mixed-task block. This difference in RT or accuracy is referred to as the mixing cost.
Data analyses
Performance on the four tests of memory was analyzed using independent samples t-tests. The two groups were compared on their absolute scores on each of the tests and their number of errors on the two working memory tests.
The three remaining tasks all followed the same data trimming and analysis procedure. First, participants who were identified as extreme outliers based on their accuracy rate (more than 3 interquartile ranges below the 1st quartile) were excluded from analyses on that task. For all analyses on accuracy the first trial in each block was not considered. Since accuracy data were not normally distributed, non-parametric tests were used for their analysis. Mann-Whitney U tests were used to compare the same measure between the two groups and Wilcoxon Signed Rank tests were used to compare two conditions within a group. For the analysis of response time (RT) data, the first trial in each task block and error trials were excluded. Additionally, for each participant, trials with an RT more than 3 standard deviations (SD) from their individual mean (block-type mean on the task-switching paradigm) were excluded. Finally, trials following an error were excluded to avoid post-error slowing confounds (Burns, Reference Burns1965) and mis-categorization in the task-switching paradigm. The resulting RT data were analyzed using ANOVAs with the conditions as within-subjects factors and group as a between-subjects factor. On tasks that allow the analysis of multiple processes, each process was analyzed using a separate ANOVA.
Results
Memory tests
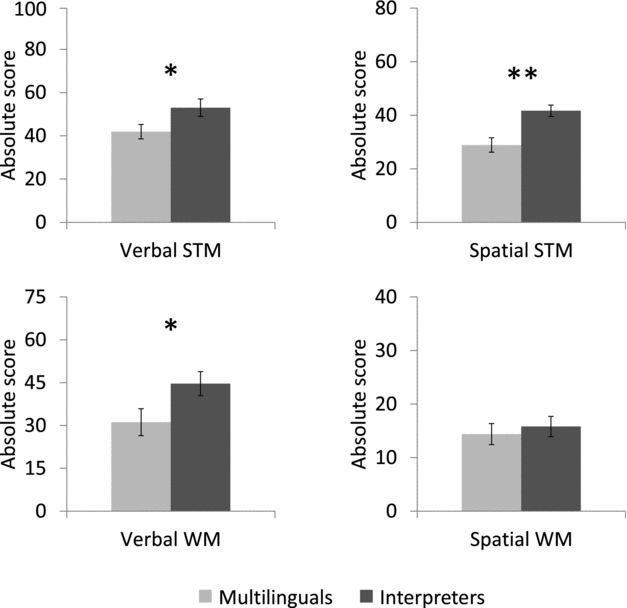
The interpreters performed better on both the verbal and the spatial short-term memory tasks than the multilinguals (t(42) = 2.1, p = .041, d = .639; t(42) = 3.7, p < .001, d = 1.133, respectively; see Figure 1). Additionally, the interpreters recalled more items on the verbal working memory task than the multilinguals (t(42) = 2.1, p = .039, d = .582; see Figure 1), but the groups did not differ in the number of errors (t(42) = 0.9, p = .329, d = .301). There were no differences between the groups on the task of spatial working memory (ts < 1.1, ps ≥ .299, d ≤ .297).
Performance on tests of memory by group. Error bars represent standard errors of the mean. The number of items, and therefore maximum score, for the memory tests were as follows: Verbal STM – 99; Spatial STM – 81; Verbal WM – 75; Spatial WM – 42. *p < .05, **p < .001

Color-word Stroop
Two participants (both male interpreters) were identified as outliers on this task and their data were excluded from all analyses. Their exclusion, however, did not change the matching of the two groups on the abovementioned biographical variables. The above-described data trimming procedures resulted in the exclusion of 5.3% of all trials.
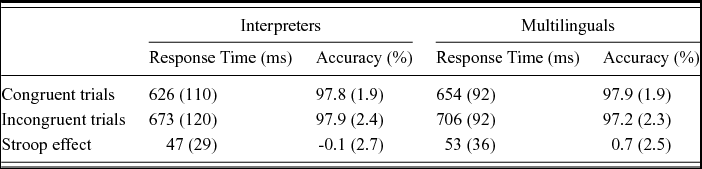
Analyses on the accuracy data revealed that the groups did not differ on congruent (U = 236, Z = 0.3, p = .693) or incongruent trials (U = 173.5, Z = 1.2, p = .230). Further the groups showed no difference on the accuracy Stroop effect (U = 257.5, Z = 0.9, p = .351). A two-way ANOVA on RTs with trial type (congruent, incongruent) and group as factors revealed a main effect of trial type (F(1,40) = 96.2, p < .001, ηp 2 = .706). No differences were seen between the groups either overall (F(1,40) = 0.9, p = .345, ηp 2 = .022) or in the size of the Stroop effect (F(1,40) = 0.3, p = .570, ηp 2 = .008; see Table 2).
Color-word Stroop: mean response times and accuracy by group

Note: Standard deviations are presented in parentheses.
ANT
Data from one participant (a male interpreter) were excluded from analyses due to his outlier status. His exclusion, however, did not change the matching of the two groups on the abovementioned biographical variables. The data trimming procedure resulted in the exclusion of 4.2% of trials on this task.
Conflict effect
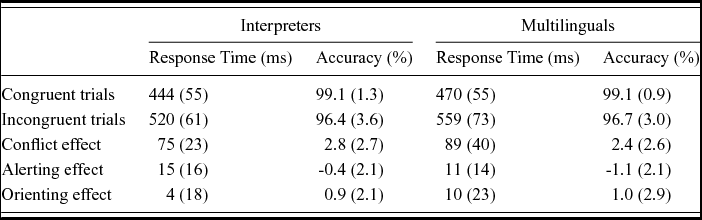
The conflict effect evaluates the difference between congruent and incongruent trials. The two groups did not differ in accuracy on either the congruent (U = 186.0, Z = 1.1, p = .256) or incongruent trials (U = 239.5, Z = 0.2, p = .834). Further, there was no difference between the groups on the accuracy conflict effect (U = 205.5, Z = 0.6, p = .535), though both groups showed a reliable difference between congruent and incongruent trials (Ws ≤ 22, Zs ≥ 3.0, ps ≤ .002). A two-way ANOVA on RTs with trial type (congruent, incongruent) and group as factors revealed a main effect of trial type (F(1,41) = 276.0, p < .001, ηp 2 = .871). The interpreters showed marginally faster RTs (F(1,41) = 3.2, p = .078, ηp 2 = .074; see Table 3), but did not differ from the multilinguals in the size of the conflict effect (F(1,41) = 1.9, p = .170, ηp 2 = .045).
ANT: mean response times and accuracy by group

Note: Standard deviations are presented in parentheses.
Alerting effect
The alerting effect was defined as the difference between trials cued with the double cue and those with no cue. The two groups showed no difference in the accuracy alerting effect (U = 189.0, Z = 1.0, p = .296). A three-way ANOVA on RTs with cue type (double, no), trial type (congruent, incongruent) and group as factors assessed the alerting network and its interaction with the executive control network. A main effect of cue type was revealed (F(1,41) = 15.023, p < .001, ηp 2 = .268), indicating longer RTs to uncued trials than double cued trials. However, no interactions between cue type and the other factors were significant (Fs < 1.4, p ≥ .245, ηp 2 ≤ .033).
Orienting effect
The orienting effect was defined as the difference between central cue trials and spatial cue trials. The two groups showed no difference in the accuracy orienting effect (U = 236.0, Z = 0.1, p = .902). To assess the orienting network and its interaction with the executive control network a three-way ANOVA with cue type (central, spatial), trial type (congruent, incongruent) and group as factors was computed on RTs. A main effect of cue type was revealed (F(1,41) = 7.0, p = .011, ηp 2 = .147), with shorter RTs on spatially cued trials than centrally cued trials. The cue type factor, however, did not significantly interact with the other factors (Fs < 1.9, p ≥ .187, ηp 2 ≤ .042).
Task-switching paradigm
Two participants (one male interpreter and one female multilingual) were identified as outliers and their data were excluded from the following analyses. Their exclusion did not change the matching of the two groups on the abovementioned biographical variables. The data trimming procedures lead to the exclusion of 6.9% of all trials.
Before analyzing the switching and mixing costs, the color and shape tasks were compared. Accuracy rates were comparable for the two tasks within each group (Ws ≥ 129, Zs ≤ 1.6, ps ≥ .122). A two-way ANOVA on RTs revealed no main effect of task (color, shape) and no interaction with group (Fs < 1.6, ps ≥ .220, ηp 2 ≤ .037). Therefore the data for the two tasks were collapsed for all further analyses.
Switching costs
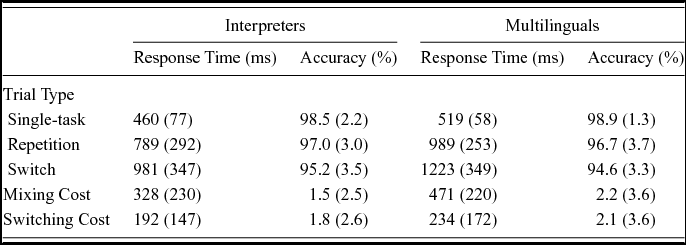
Switching costs represent the difference in performance on switch trials and repetition trials in the mixed-task block. The two groups did not differ in accuracy on either the switch (U = 194.5, Z = 0.6, p = .521) or the repetition trials (U = 223, Z = 0.1, p = .940). Additionally, there was no difference between the groups on the accuracy switching cost (U = 182.5, Z = 0.9, p = .345), though both groups showed a reliable cost (Ws ≤ 40.5, Zs ≥ 2.1, ps ≤ .028; see Table 4). A three-way ANOVA on RTs with CTI length and trial type (switch, repetition) as within-subjects factors and group as a between-subjects factor showed main effects for all three factors. Responses were faster on long compared to short CTI trials (F(1,40) = 358.9, p < .001, ηp 2 = .900) and on repetition compared to switch trials (F(1,40) = 75.9, p < .001, ηp 2 = .655). Additionally, these factors interacted, revealing a smaller switching cost on long CTI trials than on short CTI trials (F(1,40) = 32.5, p < .001, ηp 2 = .449). The interpreters were overall faster than the multilinguals (F(1,40) = 5.6, p = .022, ηp 2 = .124). The group factor did not interact with CTI length (F(1,40) = 1.1, p = .299, ηp 2 = .027) or with trial type (F(1,40) = 0.6, p = .411, ηp 2 = .017) suggesting that the interpreters and multilinguals did not differ in switching cost. The three-way interaction was also not significant (F(1,40) = 0.4, p = .526, ηp 2 = .010).
Task-switching paradigm: mean response times and accuracy by group

Note: Standard deviations are presented in parentheses.
Mixing costs
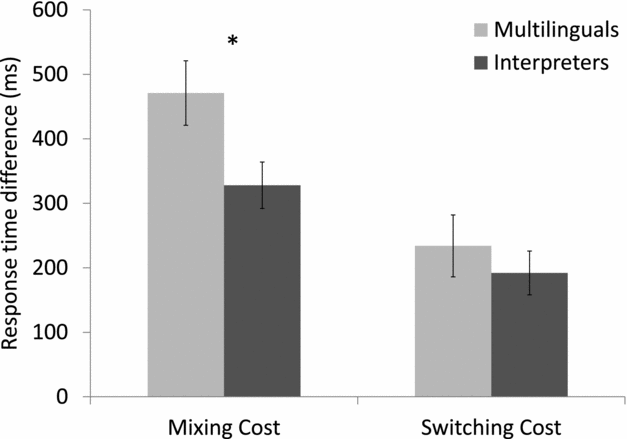
Mixing costs represent the difference in performance on repetition trials in the mixed-task block and trials in the single-task blocks. The two groups did not differ in accuracy on either the repetition (U = 223, Z = 0.1, p = .940) or single-task trials (U = 225.5, Z = 0.1, p = .883). Additionally, there was no difference between the groups on the accuracy mixing cost (U = 218, Z = 0.1, p = .960), though both groups showed a reliable cost (Ws ≤ 159, Zs > 2.0, ps ≤ .041; see Table 4). A three-way ANOVA on RTs with CTI length and trial type (repetition, single-task) as within-subjects factors and group as a between-subjects factor showed main effects for all three factors. Responses were faster on long compared to short CTI trials (F(1,40) = 272.2, p < .001, ηp 2 = .872) and on single-task trials compared to repetition trials (F(1,40) = 132.1, p < .001, ηp 2 = .768). These two factors interacted, showing a smaller mixing cost on trials with a long CTI than with a short CTI (F(1,40) = 172.7, p < .001, ηp 2 = .812). The interpreters were overall faster than the multilinguals (F(1,40) = 6.5, p = .014, ηp 2 = .141). Additionally, group interacted with trial type (F(1,40) = 4.2, p = .046, ηp 2 = .096, see Figure 2), indicating a smaller mixing cost for interpreters. The group factor also interacted with CTI length (F(1,40) = 4.2, p = .047, ηp 2 = .095), showing that the difference between the groups was larger with a short CTI (144 ms vs. 111 ms). The three-way interaction, however, was not significant (F(1,40) = 1.2, p = .270, ηp 2 = .030).
Mixing and switching costs by group. Error bars represent standard errors of the mean. *p < .05

To further explore the origins of the mixing cost difference between the groups we completed three additional analyses on these data. First, to verify that the difference in mixing cost was not due to the difference in overall speed we computed a proportional mixing cost ([repetition – single-task] / [repetition + single-task]). The interpreter advantage was maintained when considering this proportional mixing cost (t(40) = 2.0, p = .045, d = .640), thus suggesting the difference was not a side effect of differences in overall speed.
Second, we explored the evolution of the mixing cost across the mixed-task block to account for the influence of potential differences in sustained attention between the groups.Footnote 2 To this end we divided the mixed-task block into four bins of 48 trials (half of which were repetition trials). We then computed a mixing cost for each bin which compared the repetition trials in the bin to all single-task trials. A two-way ANOVA on these mixing costs with bin and group as factors revealed a significant main effect of bin (F(2.1,86.4) = 11.7, p < .001, ηp 2 = .228), due to a decrease in mixing cost across the bins. A main effect of group was also evident (F(1,40) = 4.1, p = .047, ηp 2 = .095), replicating the previous result. However, there was no interaction between the factors (F(2.1,86.4) = 1.8, p = .160, ηp 2 = .044), suggesting that differences in sustained attention did not underlie the mixing cost difference.
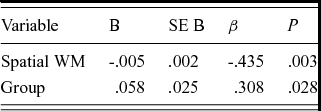
Finally, previous studies have suggested that the mixing cost is due in part to the increased memory load of the mixed-task block (Meiran, Reference Meiran1996; Rogers & Monsell, Reference Rogers and Monsell1995). Thus, the larger memory spans of interpreters could underlie the group difference seen in mixing cost. To disentangle the effects of memory and interpretation experience on the mixing cost, we completed a stepwise multiple regression analysis. Proportional mixing cost was selected as the dependent variable to mitigate differences in overall speed. Group, Raven's APM score, and the performance scores from the four tests of memory were entered as potential variables (age did not warrant inclusion because its correlation with proportional mixing cost was not significant). A model including only spatial working memory explained 17.0% of the variance in mixing cost (F(1,40) = 9.3, p = .004). A second model, which added group as a predictor, explained 24.9% of the variance, significantly more than the first model (R 2 change = .095, F(1,39) = 5.1, p = .028; see Table 5). No other variables significantly improved the model's predictive power.
Multiple regression results

Discussion
This study examined the memory and cognitive control abilities of professional simultaneous interpreters compared to a well-matched group of multilinguals. Memory was investigated using tests of short-term and working memory in the verbal and spatial domains. On these tests, the interpreters showed larger verbal STM, spatial STM, and verbal WM spans than the multilinguals. The color-word Stroop, ANT, and task-switching paradigms were employed to explore group differences in cognitive control. No differences were seen in conflict resolution measured with the Stroop and ANT tasks. However, on the task-switching paradigm the interpreter group showed greater sustained control (i.e., smaller mixing cost) than the multilingual group, though no difference was seen in transient control (i.e., switching cost). A regression analysis on the mixing cost revealed that both spatial working memory and interpretation experience contributed to the magnitude of the mixing cost.
Are interpreters expert bilinguals?
Previous studies have shown advantages for bilinguals, compared to monolinguals, on tasks which employ conflict resolution, typically on Stroop tasks, the Simon task, and flanker paradigms (e.g., Bialystok, Martin & Viswanathan, Reference Bialystok, Martin and Viswanathan2005; Costa et al., Reference Costa, Hernández and Sebastián-Gallés2008; Hernández et al., Reference Hernández, Costa, Fuentes, Vivas and Sebastián-Gallés2010). When seen, these benefits have been attributed to the need to manage multiple language sets, specifically the need to select between competing items. A benefit in conflict resolution may then be predicted for interpreters due to their management of languages in more demanding situations and greater need to produce target language output. For the most part, however, this prediction was not borne out, as no group differences in the conflict effect were seen on the Stroop and ANT tasks in the current study. This general absence of differences in conflict resolution between the groups is in line with the results from three previous studies which examined professional interpreters (Köpke & Nespoulous, Reference Köpke and Nespoulous2006; Morales et al., Reference Morales, Padilla, Gómez-Ariza and Bajo2015; Yudes et al., Reference Yudes, Macizo and Bajo2011). The interpreters in the present study did, however, show marginally faster overall RTs. A few previous studies in the bilingualism literature have found global RT advantages among bilinguals and suggested they represent an enhancement in monitoring for changes (Bialystok, Reference Bialystok2006; Costa et al., Reference Costa, Hernández, Costa-Faidella and Sebastián-Gallés2009; but see Hilchey et al., Reference Hilchey, Saint-Aubin, Klein and Schwieter2015; Paap et al., Reference Paap, Johnson and Sawi2015). However, in the present study faster RTs among interpreters were also evident in the task-switching paradigm, on all three trial types. As no trial type changes can be expected during the single-task blocks in that task, the faster responses evidenced in the present study may indicate generally faster information processing among interpreters rather than an advantage in monitoring.
The lack of enhanced conflict resolution abilities in interpreters has various possible explanations. First, while interpreters experience greater interference between languages and a greater need to produce target language output, these demands may not result in a honing of the same language control mechanisms used by other bilinguals, but rather a qualitative change in language management. A second possibility is that interpreters have honed their control abilities, but that enhancements are not linearly related to ability level or have a ceiling. In this case the greater control abilities would not add significantly to the enhancement that the interpreters already have due to their multilingual status.
An absence of increased benefits among interpreters was also observed in transient control, where a bilingual advantage has been occasionally noted (Garbin et al., Reference Garbin, Sanjuan, Forn, Bustamante, Rodriguez-Pujadas, Belloch, Hernandez, Costa and Ávila2010; Prior & Gollan, Reference Prior and Gollan2011; Prior & MacWhinney, Reference Prior and MacWhinney2010; but see Hernández et al., Reference Hernández, Martin, Barceló and Costa2013; Paap & Greenberg, Reference Paap and Greenberg2013; Paap et al., Reference Paap, Johnson and Sawi2015). The advantage among bilinguals is thought to stem from the fact that switching between tasks and switching between languages rely on the same domain-general processes. Bilinguals, then, exercise these processes to a greater extent than monolinguals due to their experience switching between languages. Given this origin of the bilingual advantage, interpreters may not be predicted to show larger benefits. Simultaneous interpretation does not require switching between languages, but rather producing output in a consistent language and comprehending two languages simultaneously. Thus, unlike conflict resolution, interpreters do not experience more demanding practice switching between languages than other multilinguals. The absence of a difference between the groups may reflect this specific detail of the processes entailed in simultaneous interpretation.
The explanations presented above are based on the acceptance of a bilingual advantage in conflict resolution and transient control; however, recent evidence suggests that bilinguals are not generally advantaged in these abilities (Hilchey et al., Reference Hilchey, Saint-Aubin, Klein and Schwieter2015; Paap et al., Reference Paap, Johnson and Sawi2015). Thus, a final explanation for the lack of an interpreter advantage in both conflict resolution and transient control is that practice with language control does not lead to enhancements in these abilities. Regardless of the explanation, these results indicate that experience with interpretation does not lead to enhancements in conflict resolution and transient control.
Are interpreters unique bilinguals?
The interpreters did distinguish themselves from the multilinguals in areas where bilingual benefits have not typically been seen. In particular, the interpreters displayed advantages on verbal short-term and working memory as well as spatial short-term memory. In the verbal domain, the superiority of the interpreters replicates the findings of previous studies (e.g., Bajo et al., Reference Bajo, Padilla, Padilla, Chesterman, Gallardo San Salvador and Gambier2000; Christoffels et al., Reference Christoffels, de Groot and Kroll2006; Köpke & Nespoulous, Reference Köpke and Nespoulous2006; Padilla et al., Reference Padilla, Bajo, Cañas, Padilla and Tommola1995). Verbal memory is a critical component in simultaneous interpretation. Both short-term and working memory are burdened during SI to store content from input to output and to rehearse pre-output translations. Further, SI requires simultaneous comprehension and production, and therefore may be considered a dual-task situation, similar to the working memory paradigm used in this study. Thus, the interpreters’ advantage in verbal short-term and working memory is reasonable given the nature and demands of simultaneous interpretation, and expected based on previous evidence.
The difference in spatial short-term memory, however, is the first evidence that interpreters have improved memory beyond the verbal domain as no previous study has included measures of non-verbal memory. At first blush, this advantage in the spatial domain is surprising given the verbal nature of SI. The advantage could arise from increased general memory ability, analogous to benefits seen in bilinguals on non-linguistic tasks of executive function (e.g., Costa et al., Reference Costa, Hernández, Costa-Faidella and Sebastián-Gallés2009, Reference Costa, Hernández and Sebastián-Gallés2008; Garbin et al., Reference Garbin, Sanjuan, Forn, Bustamante, Rodriguez-Pujadas, Belloch, Hernandez, Costa and Ávila2010; Luk et al., Reference Luk, De Sa and Bialystok2011; Prior & Gollan, Reference Prior and Gollan2011; Prior & MacWhinney, Reference Prior and MacWhinney2010). However, the lack of an advantage on spatial working memory draws this explanation into question. Alternatively, we may speculate that the advantage could be rooted in the strategies used during SI. A distinction has been drawn between two interpreting strategies: a transcoding (or word-based) strategy and a meaning-based strategy (e.g., Anderson, Reference Anderson, Lambert and Moser-Mercer1994; Fabbro & Gran, Reference Fabbro, Gran, Lambert and Moser-Mercer1994). In transcoding interpretation, the interpreter recodes individual words or multi-word units of the input into the target language. Recoding can occur at the phonological, morphological, syntactic, and semantic levels (Paradis, Reference Paradis1994). In all cases though, verbal short-term memory would be employed to retain the content between input and output. In meaning-based interpretation, the interpreter fully comprehends the input, retains it at a non-verbal conceptual level, and then recodes the meaning in the target language for production (Fabbro & Gran, Reference Fabbro, Gran, Lambert and Moser-Mercer1994). When using this strategy the short-term memory store which is taxed may be non-verbal. Thus, the benefit seen in spatial short-term memory, a type of non-verbal memory, may be related to the use of this meaning-based strategy. It is important to note that the two strategies are not mutually exclusive, so an individual interpreter may use both strategies and show associated benefits in both verbal and non-verbal short-term memory.
The professional interpreters additionally showed a specific advantage in sustained control during the mixed-task block of the task-switching paradigm. This task block resembles simultaneous interpretation in that both require the maintenance of two (or more) ‘task sets.’ In the case of the task-switching paradigm, these sets are the stimulus-response rules, whereas in simultaneous interpretation they are the input and output languages. Thus the interpreters’ enhancement may be due to the extensive practice they have in maintaining two task sets. This would further imply that interpreters recruit, at least in part, domain-general processes to keep both languages active. This account of the results, which appears to be supported by inclusion of the group factor in the regression analysis, suggests that there is a direct effect of SI experience on the (reduced) size of mixing costs.
Alternatively, the difference in mixing cost between the groups could be due to the difference in their memory spans. Examination of the regression analysis revealed that spatial working memory and group membership were the only significant predictors of mixing cost. Interestingly, spatial WM is the only memory measure in which no interpreter advantage was seen. Thus, it may be that all four memory types influence the mixing cost, but that the other three are represented cumulatively with the group variable. This account would suggest that SI experience has an indirect effect on the size of mixing costs. Regardless of the path that the influence takes, SI experience is uniquely associated with enhanced sustained control.
While it is clear that interpretation is associated with increased memory and enhanced sustained control, it should be noted that the direction of causation remains unclear. Practice with interpretation (including initial training) may lead to these enhancements. Additionally, individuals who have better memory and increased ability to maintain two languages may self-select into the profession or be more successful in the long-run. Longitudinal studies offer the best possibility of clarifying the direction of effects. We are aware of one such study; however, results from that study do not offer conclusive evidence. Macnamara and Conway (Reference Macnamara and Conway2013) examined students earning a degree in American Sign Language (ASL) interpretation during their first and fourth semesters of training. Improvements were seen in task-switching, mental flexibility, number-letter sequencing, and backward digit span, but not in reading span and operation span tasks. It should be noted, however, that this study did not include a control group, so it is unclear if the improvements are due to training in interpretation or test-retest effects. Future longitudinal studies may be of assistance in clarifying this point.
On future studies
Simultaneous interpretation is a demanding linguistic and cognitive skill that has the potential to inform our understanding of human cognitive abilities; however it remains relatively understudied, particularly in comparison to bilingualism. Researchers wishing to examine SI face the difficulty of small sample sizes and finding well-matched control groups. The latter of these issues can be addressed by drawing participants from communities where multilingualism is common and supported, as we have done in the present study. The characteristic small sample size, on the other hand, may be addressed in part by the use of replication studies to verify the cognitive profile of interpreters. The present study provides replication of the previous findings of increased verbal memory and no differences in conflict resolution. The findings on spatial memory, transient control, and sustained control, however, are novel and would benefit from replication. This is particularly true for results with small effect sizes, such as the mixing cost advantage, where a larger sample size is needed to gain sufficient power. Additionally, regarding spatial memory, other types of non-verbal memory should be examined as well to better understand the provenance of that benefit (e.g., how domain-general it is).
Working memory and mixing costs
Finally, the influence of spatial working memory span on the mixing cost in the task-switching paradigm is in and of itself notable. Previous authors have theorized that mixing costs arise in part due to the greater memory load of the mixed-task blocks (Meiran, Reference Meiran1996; Rogers & Monsell, Reference Rogers and Monsell1995). When directly explored by Rubin and Meiran (Reference Rubin and Meiran2005), however, this influence of memory load on the mixing cost was not confirmed. The present results approach this relation between working memory and mixing cost from the opposite side. That is, we showed that individuals with larger working memory spans exhibit smaller mixing costs. These data support the notion that increased memory load contributes to mixing costs.
Conclusion
The present study demonstrates that professional interpreters do not show bilingual benefits quantitatively beyond those seen in multilinguals. Instead interpreters have a unique set of benefits that are related to the processes recruited during simultaneous interpretation. These benefits include increased verbal and spatial memory and enhanced sustained control. This specificity of the interpreter advantage to processes required during simultaneous interpretation echoes the finding of a recent study on the attentional control networks (Morales et al., Reference Morales, Padilla, Gómez-Ariza and Bajo2015). Future studies in this area will greatly add to our knowledge, not only of the cognitive effects of simultaneous interpretation, but also of the cognitive effects of skill learning in adulthood generally.