If Puerto Rico were a U.S. state, it would have the lowest income (GNI) per capita in the nation, by far. Yet Puerto Rico was once a “miracle” economy. Income per capita increased from 17 percent of the mainland's in 1950 to 33 percent in 1971, leading William Baumol and Edward Wolff (Reference Baumol and Wolff1996) to claim the island as the “Fifth Tiger.” The growth spurt faded in the early 1970s, and the island lost ground relative to the mainland. Recent years have seen hard times with a “lost decade,” a government default, a decline in population, a devastating hurricane, and calls for a change in political status.
The economic history of Puerto Rico has received little attention. Yet we cannot hope to understand its current predicament or its future options without knowledge of its past. The Puerto Rican experience is also relevant for wider questions. Arising from Stanley Engerman and Kenneth Sokoloff (Reference Engerman, Sokoloff and Haber1997), Daron Acemoglu, Simon Johnson, and James Robinson (Reference Acemoglu, Johnson and Robinson2001, Reference Acemoglu, Johnson and Robinson2002), and others, an influential literature argues that colonization produced different institutions for different locations and institutions persisted over time determining long-run development. Puerto Rico is a good case study for this thesis since it went from Spanish to United States and then to home rule. How did U.S. rule differ from Spanish rule? Did it stimulate growth and institutional change for the island or did it retard progress?Footnote 1 After the Great Depression, Puerto Rico switched from the limited government of the colonial regime to a development state using innovative policies to attract outside investment. Since then, it has enjoyed seven decades of government sponsored development efforts along with massive transfers from the mainland. All, it seems, to little avail. Why was income convergence so rapid after 1950, and why did it stall in the early 1970s? More generally, can colonial experience explain Puerto Rico's performance in its American century?
After all, Puerto Ricans are U.S. citizens, and their story is part of the American experience. Puerto Rico is the only Latin region of the United States. It is the only region where income convergence ceased at a relatively low income level. To date, however, there are few attempts to answer the “big questions” of Puerto Rican development. Rather, research concentrates on micro topics such as the effect of social programs on labor force participation. This article seeks to redress the balance by examining Puerto Rico's record after annexation with a focus on aggregate living standards.
To grapple with the central issues of Puerto Rican history, we must close two gaps. First, the early years of direct American rule are without satisfactory measures of national income or price and wage indices. Yet, these years witnessed economic and social transformations, which shaped Puerto Rican society to the present. Second, for recent decades flaws in the island's national accounts have led to potentially incorrect policy prescriptions. In brief, transfer pricing, the reliance on outdated 1954 prices, and the neglect of changes in the terms of trade distort the national accounts; therefore, we have at best a blurred view and at worst a false view of the island's economy.Footnote 2
My goal is to close part of the gap in the historical record by providing improved measures of income and consumption and thereby to place Puerto Rico in sharper comparative perspective. I have two contributions. First, I provide a new GDP index for 1900 to 1940 showing that standard views, which see the period as one of stagnation and during which Puerto Rico suffered greatly in the Great Depression, are mistaken (Devereux Reference Devereux2019). Rather, income per capita grew consistently. In addition, Puerto Rico fared better during the Great Depression than the mainland or other Latin economies.
The second part of the article re-examines the Puerto Rican record after home rule. I begin by documenting crippling flaws in its national accounts. Next, I provide revised estimates of income. Finally, I compare Puerto Rican income and consumption to the United States and to other Latin economies using the International Comparison Program (ICP) of the World Bank. The standard view sees Puerto Rico as very poor. After all, nominal GNI per capita for the island is low relative to the mainland or relative to middle-income Latin American countries. Moreover, large portions of the population are below U.S. poverty lines, 38 percent for 2016.
I argue that this narrative understates the island's progress, as the New Deal created a divergence between income, measured by GNI, and living standards as measured by household consumption. Puerto Rico fares better using consumption measures. This is hardly surprising. What is surprising is the scale of the difference. Over the last seven decades, the gap between relative consumption and relative income ranges from 30 to 60 percent in favor of Puerto Rico's consumption. To underline this point, I compare Puerto Rico with U.S. states and with Latin economies. Before the recent crisis, per capita consumption levels for Puerto Rico were 60 percent of poor southern states. This may not impress, yet it is not terrible either. In fact, the island's economy looks better in international comparisons. Currently, per capita consumption exceeds all Latin American economies and is close to Portugal or South Korea. More generally, since the 1950s Puerto Rico has enjoyed the highest or close to the highest consumption level among Spanish-speaking societies. In sum, Puerto Rico could, and perhaps should, have done better after home rule, but its economy is not a poverty-stricken failure. From certain vantage points, the island's economy might even be judged a success.
PUERTO RICO 1900–1940: A STRICKEN LAND?
Puerto Rico became a U.S. possession in 1898 after the Spanish-American War. Initially, the island had a governor selected by the United States with a popularly elected lower house. The Jones Act of 1917 extended U.S. citizenship to Puerto Ricans, but it was not until 1947 that Puerto Ricans received the right to elect their governor. In 1949, Luis Muñoz Marín became the first elected governor from the island and home rule began.
Puerto Rico had a small government before the New Deal. The priorities of U.S. colonial administrators were infrastructure, education, and healthcare. For the most part, sugar and foreign (American) ownership dominated policy debates. The New Deal brought two important changes. First, it introduced new social programs and increased transfers from the mainland. Second, starting with the appointment of Rexford Tugwell as governor in 1941, the policy focus switched to directly fostering industrialization as the authorities formed state enterprises for cement, glass, and shoes, as well as paper and clay products. These years saw the creation of the Puerto Rico Industrial Development Company, the Puerto Rico Planning Board, and the Government Development Bank, which played central roles over the following decades, as the island became an early example of a development state. After home rule, the authorities privatized government enterprises and shifted gears to an indirect approach using tax incentives to attract mainland investment, called Operation Bootstrap. The authorities continued to emphasize infrastructure (particularly electrification) as well as education and healthcare.Footnote 3
What were conditions like during direct U.S. rule? The island saw impressive improvements in life expectancy and other social indicators. Life expectancy was in the low 30's before American rule. By 1940, it was 46.Footnote 4 For literacy, the census showed 22 percent of the population above age ten in 1899 was literate. By 1940, it was 60 percent. Direct American rule brought progress in other areas too. For example, improved roads went from 100 kilometers in 1900 to 2500 kilometers by 1940 (Economic Report of the Governor various issues).
The impact of U.S. rule on living standards is less obvious as there are no real wage indices and income measures are crude. In addition, there are no production indices for agriculture or manufacturing. The received wisdom among social scientists is that living standards were low and stagnant. Puerto Rico was a “stricken land” as suggested by the title of a book by the last mainland governor Rexford Tugwell (Reference Tugwell1947), where population growth overwhelmed improvements in infrastructure and education.Footnote 5 In addition, there is a widespread belief that Puerto Rico suffered greatly during the Great Depression.Footnote 6 These views were deeply entrenched by the late 1950s. Consider the following passage from the distinguished Latinist Werner Baer (Reference Baer1959, p. 450).
“Until the 1940's the island of Puerto Rico was a typical example of a stagnant backward economy with no raw material base and a very low per capita income ….Although the development of the sugar industry increased the island's income and provided more job opportunities, this growth was not fast enough to keep up with the population explosion which was taking place….In the 1930's the economy plunged into absolute despondence. Two hurricanes which destroyed most of the sugar crops of 1928 and 1932, followed by the depression which resulted in substantial curtailments of markets and low price levels, drastically slashed the island's income.”
Are claims of stagnation correct? A useful starting point is national income. Daniel Creamer (Reference Creamer1947) provided the first set of national income accounts for the island beginning with 1940. The Puerto Rican authorities continued his work. Unfortunately, there are no satisfactory income measures before 1940. Dudley Smith (Reference Smith1943) provided a nominal series that approximates net national income from 1929 to 1940. Rafael De Jesús Toro (Reference De Jesús Toro1982) revised Smith (Reference Smith1943) and extended income to 1901. He also provided an income deflator. As discussed in the Online Data Appendix, these pioneering estimates, though valuable in many ways, are flawed. Their estimates of incomes outside export agriculture are conjectural and difficult to verify. The De Jesús Toro (Reference De Jesús Toro1982) GDP deflator is close to an export price index, which is a poor proxy for an income deflator. He also ignores terms of trade changes, which are crucial for the island.
This article provides a new Puerto Rican GDP index from 1900 to 1940. I construct GDP using an industry of origin measure following the examples of Charles Feinstein (Reference Feinstein1972) for the United Kingdom and the industrial production index of Joseph Davis (Reference Davis2004) for the United States.Footnote 7 In common with Davis (Reference Davis2004), I rely on quantity data available on a consistent annual basis. The island had a simple economic structure with a relatively small population (one million at annexation), where export staples (sugar, coffee, and tobacco) account for most of agriculture and virtually all of manufacturing. In these circumstances, the GDP index should track broad trends in income. There is one key difference with work cited earlier. For small open economies, real GDP measures can mislead with changes in the terms of trade. Indeed, ignoring the terms of trade for Puerto Rico produces large errors.Footnote 8 To set the stage for the terms of trade adjustment, I provide a brief discussion of the relationship between the external terms of trade and measured real GDP.
Measuring GDP and Consumption with Changes in the External Terms of Trade
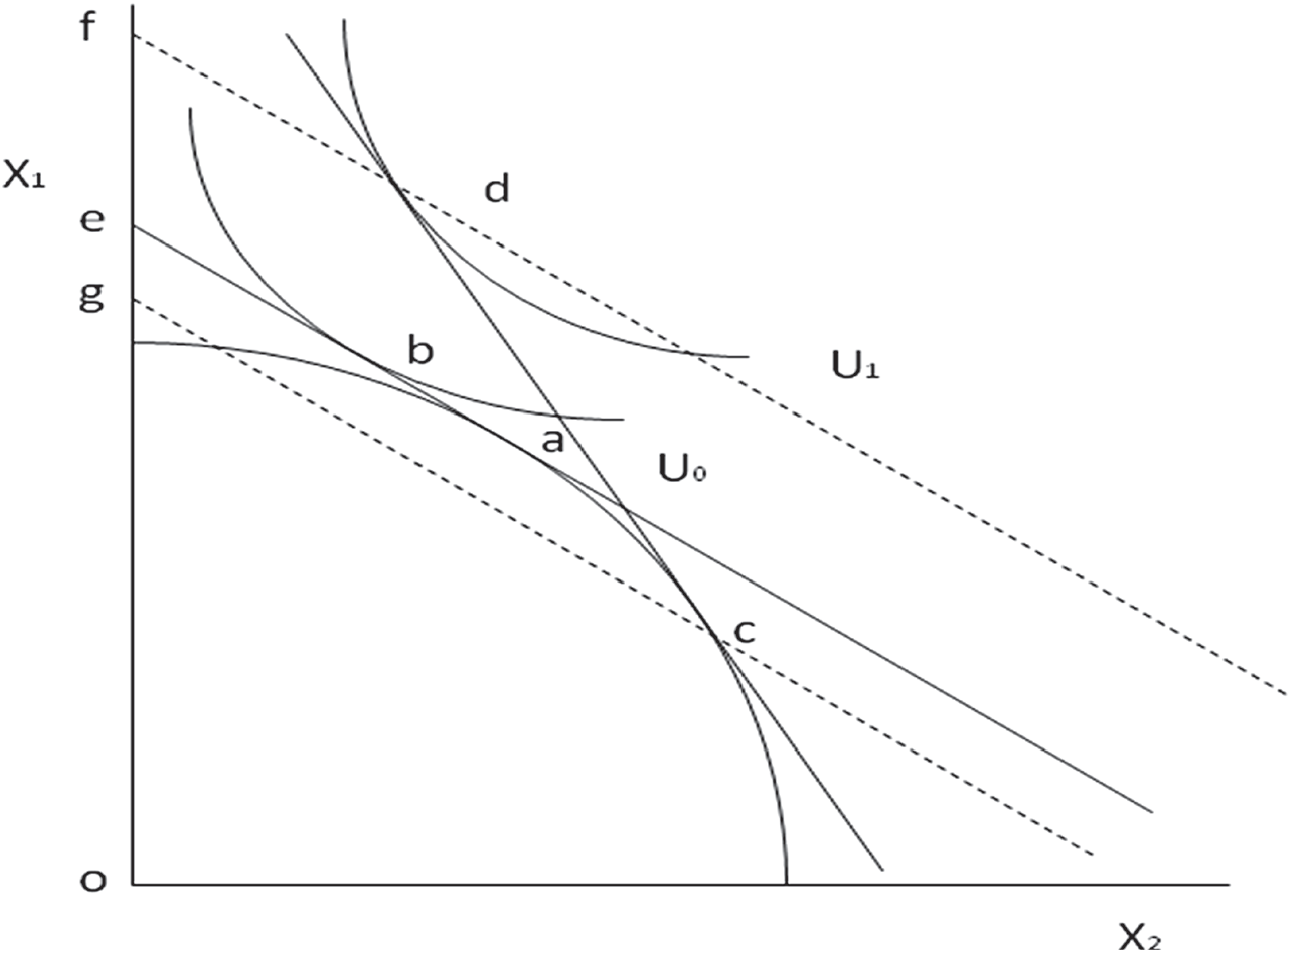
Figure 1 uses the familiar two-good textbook model of trade. The economy produces X 1 and X 2 and is small in world markets where X 2 is the export good. Trade is balanced. Initially, the economy produces at point a and consumes at point b. I measure real consumption and real GDP using initial relative prices.
I focus on an improvement in the external terms of trade. The increase in the world price of exportables shifts production from a to c, consumption increases to d, while welfare improves from U0 to U1. The increase in consumption in constant prices is the distance ef measured on the X 1 axis. Paradoxically, real GDP falls for this model when the terms of trade improve. The decline in GDP is the distance eg. To summarize, real consumption captures the improvement in welfare, but real GDP does not. The intuition behind the result is straightforward. In this example, real GDP equals real consumption plus the real trade balance. The improvement in the terms of trade raises real consumption. It is easy to show that it worsens the trade balance in constant prices and hence reduces GDP. In other words, real GDP misleads for this case because the model requires trade to balance in constant prices. That is, it forces the economy along the gc line in Figure 1, whereas the correct constraint is that trade must balance in current prices along dc. The model of Figure 1 is a simple one. The finding that we should adjust GDP to reflect command over resources with changes in the terms of trade is, however, completely general (Kohli Reference Kohli2004).
GDP PER CAPITA 1900–1940
The GDP index, given by Equation (1), is a quantity index with fixed 1940 prices, where p refers to prices and Q to quantities.
 $$Q({Q^{1940}},{Q^t},{p^{1940}}) = \sum {{p^{1940}}} {Q^t}/\sum {{p^{1940}}} {Q^{1940}}$$
GDP, CONSUMPTION, AND THE TERMS OF TRADE

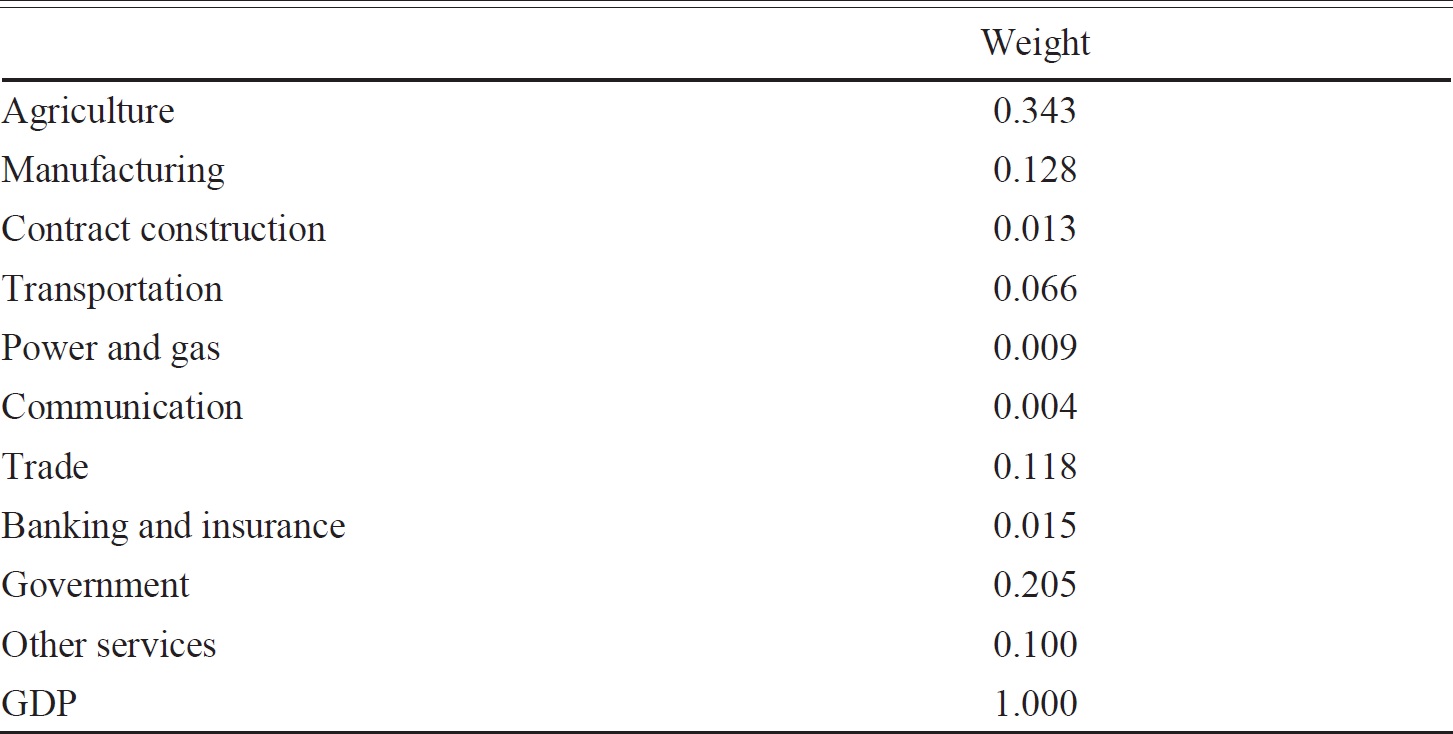
I construct sectoral indices and then aggregate to form GDP with 1940 value added weights. I chose 1940 because it is the first year with enough information to form satisfactory weights. Table 1 provides weights. Agriculture has the largest share in GDP at 34 percent while manufacturing and trade account for 12 percent of GDP. Government is 20 percent of GDP. This is double the share for the mainland, reflecting the effects of the New Deal.
I provide sectoral indices along with details of construction in the Online Data Appendix. In brief, I construct indices using physical quantities, such as tons of sugar. Most of the data are from official sources, such as the Annual Report of the Governor of Puerto Rico and related reports from other government agencies, along with the census. For Puerto Rico, such reports provide reliable annual data for broad sections of the economy.
Before considering the results, I should emphasize some caveats. The first is interpolation. The population and labor force estimates interpolate between census benchmarks. I have annual quantity data for the agricultural staples, for manufacturing and for wholesale and retail trade, but I use interpolation for some components of other indices.Footnote 9 While the GDP index should capture trends across census benchmarks, year-to-year changes must be used carefully. Second, the 1940 weights likely understate growth from 1900 to 1940 through the “Gerschenkron effect” described later. Finally, Puerto Rico faced significant hurricane damage, most notably for 1899, 1928, and 1932. By construction, GDP captures crop losses due to natural disasters. It does not measure other impacts, such as damages to housing and other parts of the capital stock. The Online Data Appendix provides further discussion of these points.

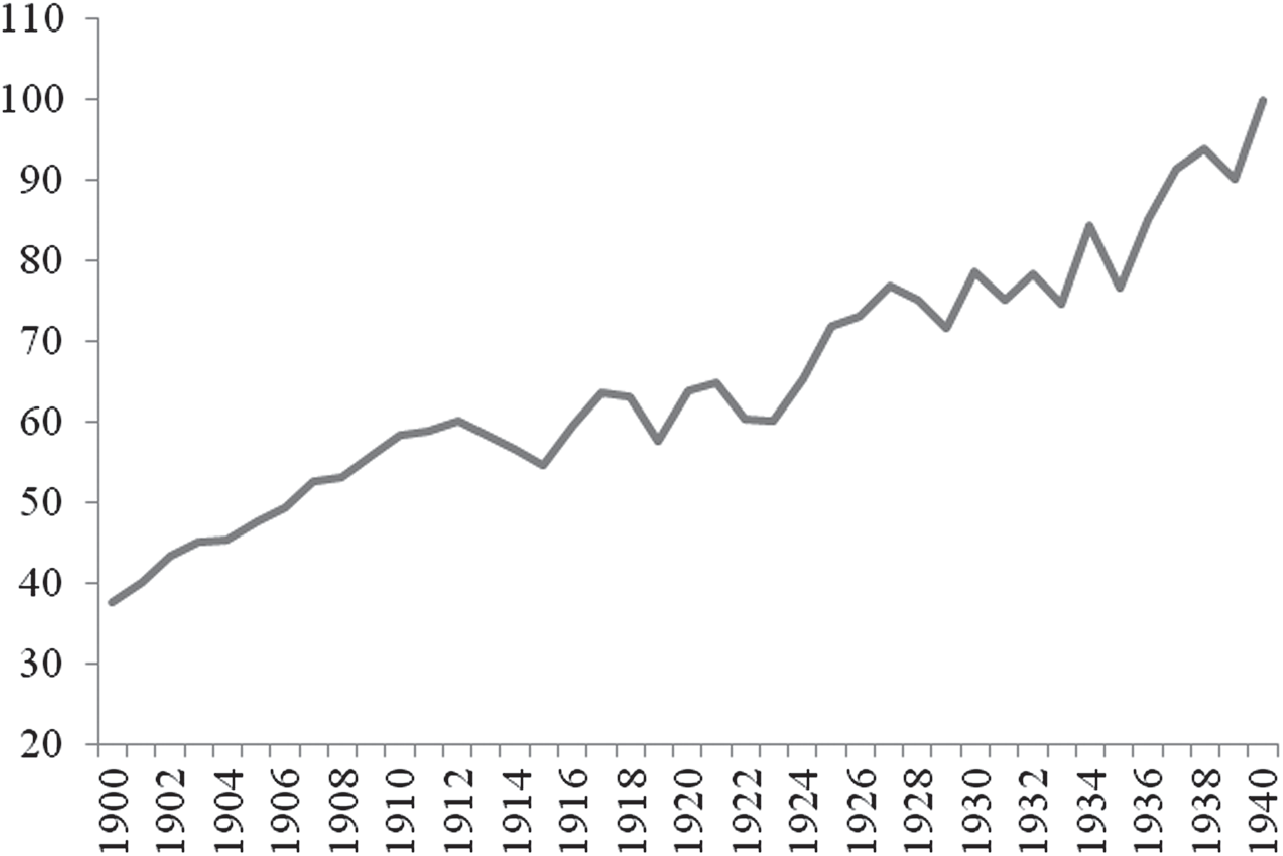
Figure 2 graphs GDP per capita from 1900 to 1940 in 1940 prices. The estimates cover the fiscal year (July–June). The annual GDP estimates are in the Online Data Appendix along with population and the labor force.
GDP PER CAPITA 1900–1940 1940 = 100

Over the entire period, GDP per capita grew at 2.5 percent. As a result, income per capita in 1940 was 2.7 times higher than 1900. Output per worker grew at 3.0 percent. The difference between per capita and per worker growth is due to the drop in the ratio of the labor force to population. The ratio drops from 0.35 in 1910 to 0.27 in 1940 as rapid population growth reduced average age. Growth was faster for the first decade, partly reflecting a recovery from the San Ciriaco hurricane (see Schwartz Reference Schwartz1992) for an account) and from the disruptions of the Spanish American conflict. Growth slowed during the second decade but picked up thereafter.
The fact that income per capita grew consistently over four decades counters claims that Puerto Rico was stagnant during direct American rule. Rather, the island experienced the structural changes associated with modern economic growth in the Kuznets sense.Footnote 10 From census data, urbanization went from 14.5 percent in 1899 to 30.3 in 1940 (Marien 2018). Employment in agriculture fell from 62.8 percent of the labor force in 1899 to 44.7 in 1940, while manufacturing employment went from 7.3 to 19.7 percent.
Also noticeable from Figure 2 is considerable GDP volatility. This is partly a function of extraordinary swings in the Puerto Rican terms of trade, discussed later. Volatility also results from weather shocks such as the hurricanes of 1899, 1928, and 1932. In addition, disease struck sugar after WWI. Lastly, GDP volatility reflects policy shocks, such as the imposition of the U.S. minimum wage in 1938, which reduced textile exports and agricultural policy changes for sugar after 1934.
The final feature Figure 2 is that Puerto Rico fares relatively well during the 1930s. Despite depression on the mainland and devastating hurricanes in 1928 and 1932, GDP held up well from 1929 to 1933, and it grew rapidly towards the end of the decade. Indeed, GDP per capita increased from an index value of 75 in 1928 to 100 in 1940. GDP per capita fell in 1931, 1933, 1935, and 1939, but it recovered quickly. The finding that Puerto Rico partly escaped the Great Depression is unexpected.Footnote 11 After all, the received wisdom is that the island suffered terribly. Is this finding a consequence of ignoring the terms of trade? To answer, the next section adjusts the GDP volume index for the terms of trade.
Adjusting GDP for Changes in the External Terms of Trade
National income accountants use Equation (2) to adjust GDP for changes in the external terms of trade. In Equation (2), Q(⋅) is the GDP volume index, p is a trade deflator, px and pm are the export and import price deflators and x and m are volumes of exports and imports. Applying the terms of trade adjustment to GDP, yields Gross Domestic Income (GDI) in the United Nations system of national accounts.Footnote 12 Following the convention in the U.S. national accounts, I use the import price index (pm) as the trade deflator.
 $$GDI = {Q^t}({Q^{1940}},{Q^t},{p^{1940}}) + x\left( {{{px} \over p} - 1} \right) + m\left( {1 - {{pm} \over p}} \right)$$
To gain intuition, note that GDI removes the trade balance in constant prices from GDP and replaces it with the trade balance in current prices deflated by a trade deflator, in this case the import deflator. For the simple model of the earlier section, trade is balanced so GDI equals real consumption.
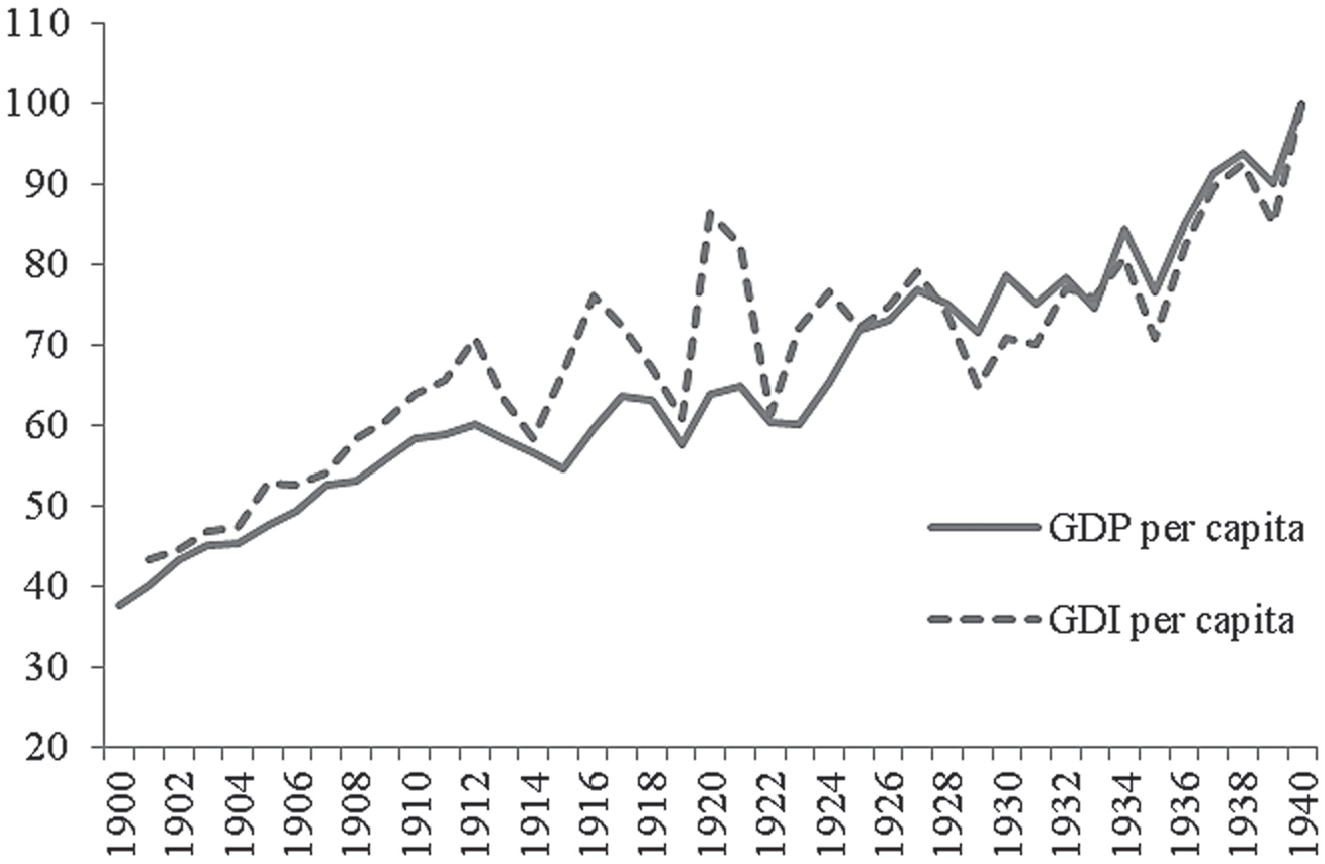
Figure 3 compares GDP in 1940 prices with the terms of trade adjusted income measure, GDI. Annual GDI estimates are in the Online Data Appendix.
GDP AND GDI PER CAPITA 1940 = 100

As shown in the Online Data Appendix, there are large swings in the terms of trade from 1900 to 1940. The terms of trade peak during the sugar boom after WWI and decline from the late 1920s onwards. In addition, volatility falls in the 1930s as U.S. sugar programs insulate Puerto Rican sugar prices from world markets.
The terms of trade adjustment in Figure 3 is often large. Most notably, it increases income during the sugar booms of WWI and the early 1920s. The volume of GDP per capita rises by 10 percent with record sugar prices of 1920, but GDI increases by 40 percent. GDI also shows that Puerto Rico did relatively well during the Great Depression. The terms of trade declined from 1928 to 1931 reducing income, so these years saw hardships. Thereafter, GDI recovered. The terms of trade fell in 1934, but this is short lived.
To sum up, the terms of trade adjustment is important for Puerto Rico, as GDP growth rates are often a misleading measure of changes in living standards. That said, GDI does not modify earlier findings that Puerto Rico grew consistently during direct American rule and that Puerto Rico did relatively well during the Great Depression.
Why did real income hold up during the 1930s? A look at the components of GDP reveals the strong showing occurred for three reasons. First, sugar exports increased during the early 1930s, with Puerto Rican access to the protected U.S. market. From 1928 to 1934, sugar production increased by 50 percent, and the agricultural output index increased by 26 percent due to sugar, despite a collapse in coffee production after the 1928 hurricane. For the mainland, agricultural output fell by 12 percent during these years (Kendrick Reference Kendrick1961, Table B1, p. 362). Second, textile exports surged during the first part of the 1930s. The index of textile production increased from 43 in 1928 to 98 in 1934. Between 1928 and 1934, manufacturing, driven by textiles and sugar, increased by 51 percent whereas U.S. manufacturing output fell by 30 percent, (Kendrick Reference Kendrick1961, Table D-II, p. 465).
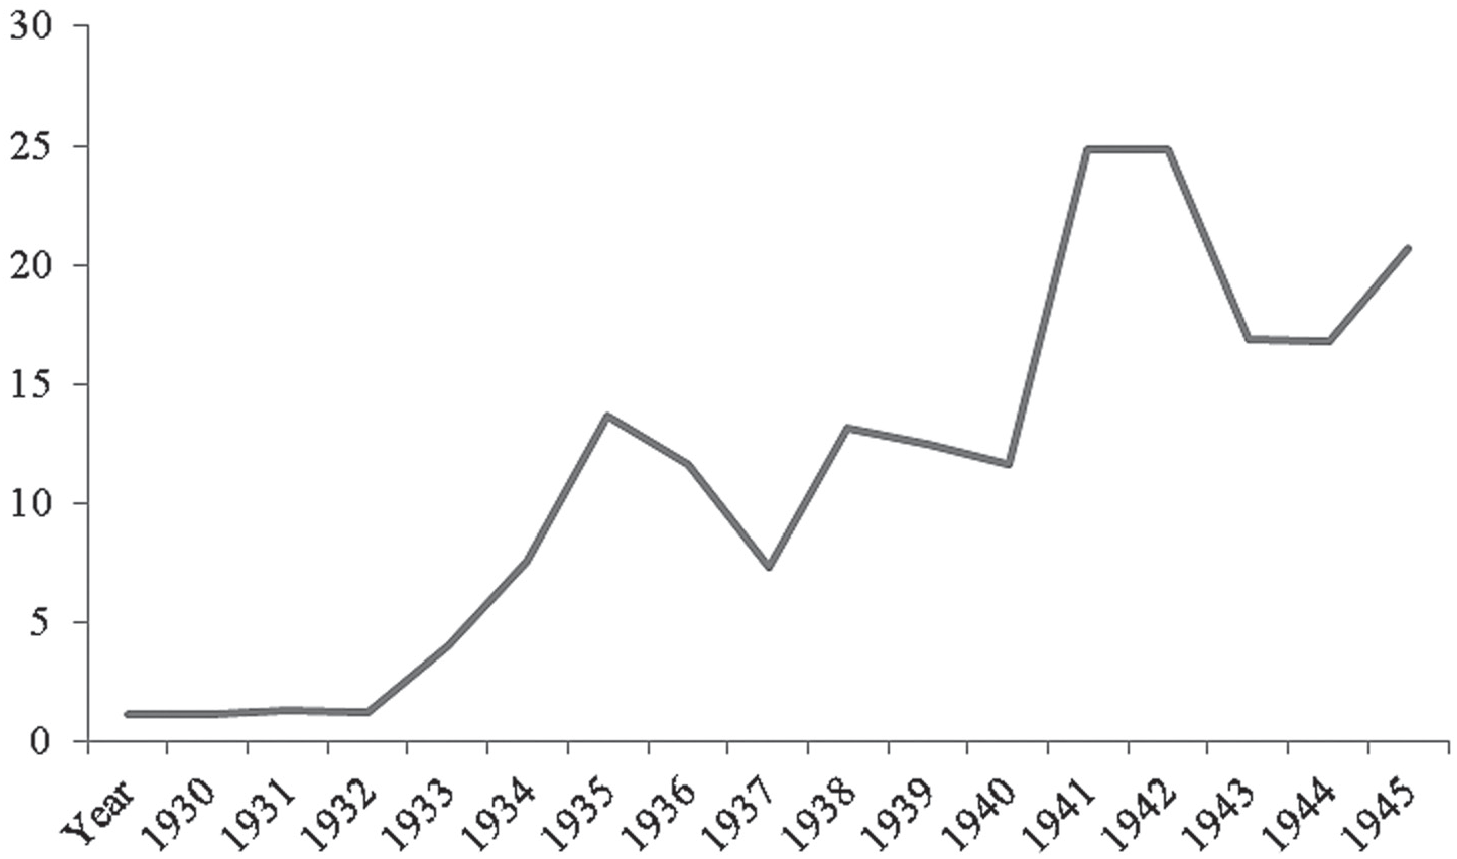
The third reason is the New Deal. To illustrate the impact of the federal government, Figure 4 gives the ratio of federal spending to nominal Puerto Rican GDP from 1930 to 1944. The growth in spending after the New Deal is remarkable. It averaged 1.5 percent of nominal income during the early 1930's. It climbed to 8 percent in 1935.Footnote 13 By 1936, it was 14 percent. The war years saw higher expenditures associated with the military build-up. In sum, after 1934 federal spending is as important as sugar to the Puerto Rican economy.
FEDERAL SPENDING AS A SHARE OF PUERTO RICAN GDP: 1930 TO 1945

The infirmities of historical data make crosschecks essential for historical GDP measures. The Online Data Appendix gives per capita quantity indices for clothing, food, and food imports. The results provide independent evidence of a significant improvement in living standards. The per capita clothing consumption index doubled from the mid 1900s to 1940. The per capita food intake index increased from 65 in the mid 1900s to 100 in 1940. Accordingly, Puerto Ricans were better off after American rule, although by 1940 they remained poor compared to the mainland.
The clothing, food and food import indices are consistent with the GDP index for the overall period and for sub-periods. Most notably, food and clothing imports did not fall after 1929, and they were considerably higher by the end of the 1930s. Other crosschecks are possible. For example, it is easy to show that the broad trends in GDP are consistent with data on property values and excise tax receipts contained in the Annual Report of the Governor.
Summing up, 1900–1940
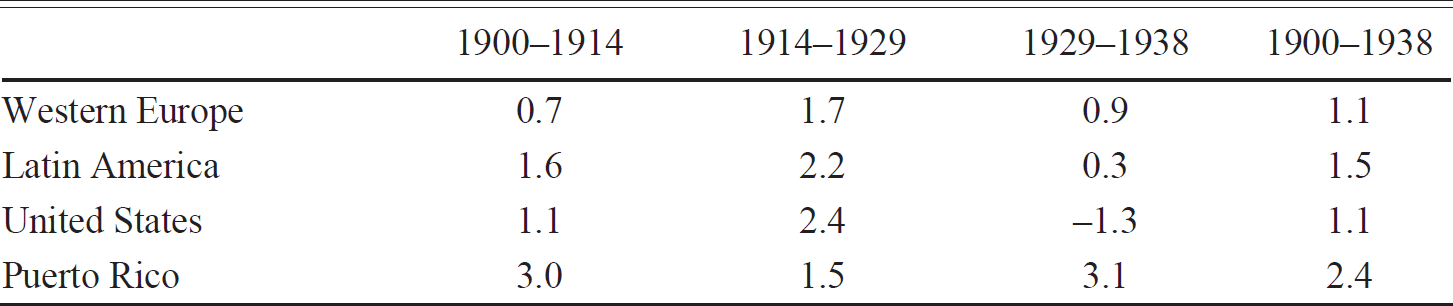
By recent standards, growth rates of 2.5 percent for income per capita are not spectacular. We should, however, see Puerto Rico in proper context. To do so, Table 2 compares Puerto Rican growth rates from 1900 to 1940 with Europe and Latin America using data from Angus Maddison (Reference Maddison2007).Footnote 14
COMPARING GROWTH: 1900 TO 1938

Sources: Maddison (Reference Maddison2007) as updated by the Maddison project at http://www.ggdc.net/maddison/maddison-project/data.htm. The Puerto Rico growth rates are from the Online Data Appendix.
The table shows that Puerto Rico's economy did well in the first decade after annexation; then, growth slowed. The difference in favor of Puerto Rico for the 1930s is also noteworthy. Overall, the Puerto Rican economy grew consistently and in line with Latin America and Europe. There was convergence with the United States, but the evidence is fragile. As shown in the Online Data Appendix, Puerto Rico grew faster for two periods, the years immediately after annexation and the 1930s. Special factors were at work in both cases. On the other hand, there is good reason to suppose output per worker did converge since it grew at a rate of 3.0 percent per year from 1900 to 1938 for Puerto Rico compared to 1.3 percent for the mainland (Kendrick Reference Kendrick1961, Table A—XXII, p. 333).Footnote 15
The GDP index measures GDP in constant 1940 prices. As a crosscheck, I also measured GDP using rough 1909 weights; the results are in the Online Data Appendix. As expected, early period weights lead to higher growth estimates (3.2 percent for per capita income from 1900 to 1940). In sum, the four decades of American rule saw steady improvements in living standards and modest convergence to the mainland.Footnote 16
HOME RULE EXPLOSIVE GROWTH, STAGNATION AND A “LOST DECADE”
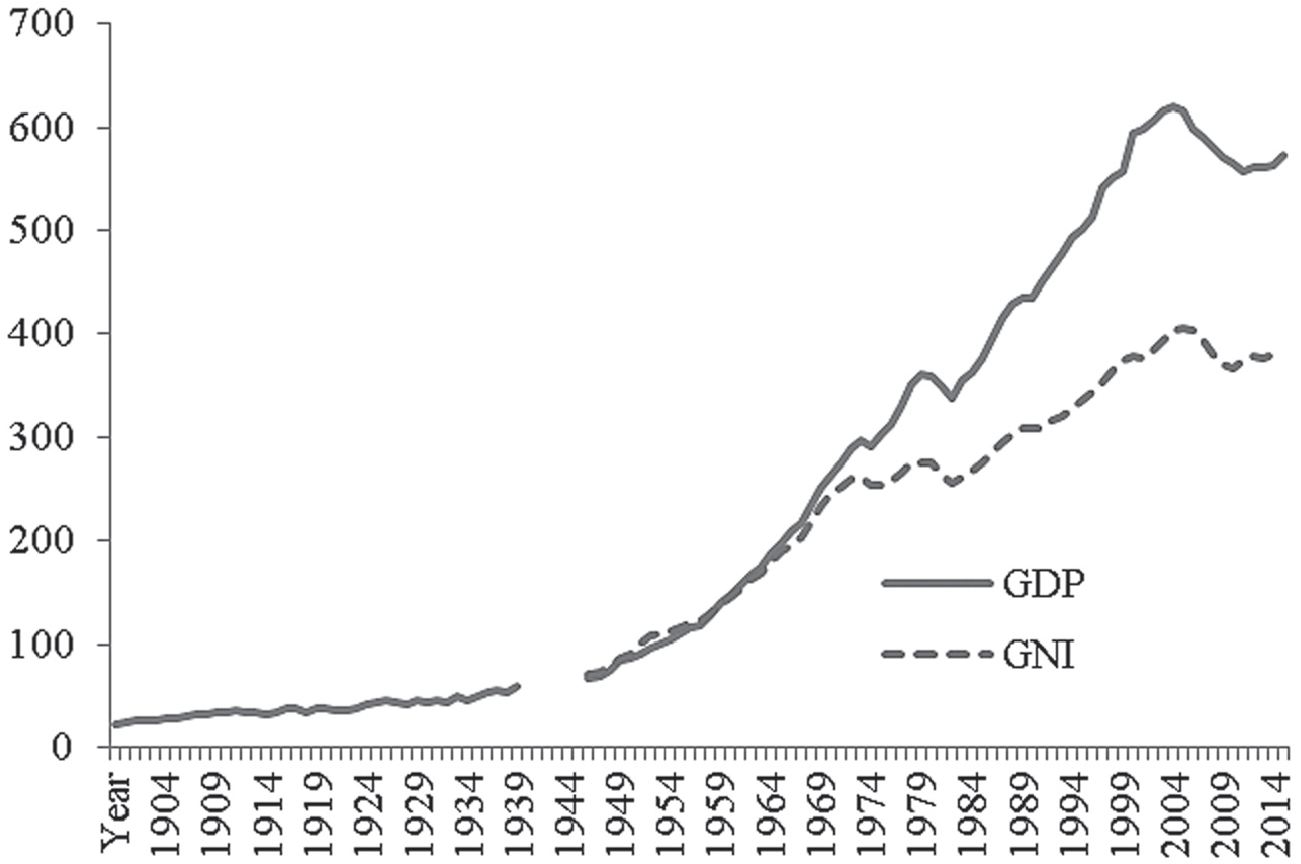
The remainder of the article discusses the period after 1950. To provide a long run perspective, Figure 5 traces real GDP per capita from 1900 to date using the GDP index of the previous section and the official Puerto Rican national accounts from 1940. After 1950, I also provide GNI. Recall that GDP is the market value of goods and services produced within a country's borders while GNI is the market value of goods and services produced by factors supplied by domestic residents. The relationship between GDP and GNI is GNI = GDP + NIA, where NIA is net factor income from abroad.
REAL INCOME PER CAPITA—1900–2016 1954 = 100

The graph captures the three epochs of Puerto Rican growth. GDP per capita grew from 1900 to 1940 at a respectable 2.5 percent annum. The second phase begins with the policy changes of the New Deal. After Operation Bootstrap, the island grew at exceptionally fast rates to the early 1970s, the convergence boom. Real GDP per capita increased at a rate of 5.3 percent between 1950 and 1974, as the island became the “Fifth Tiger.” Real GNI per capita increased at a slightly lower rate of 4.6 percent.
The third phase began with a deep recession after the first oil crisis. Growth faltered. GDP per capita grew at 1.6 percent from 1974 to 2016 while GNI per capita grew at only 0.9 percent. Per capita real GNI growth was half the GNI growth rate for the U.S. mainland over the period (1.8 percent per capita from the BEA national accounts), suggesting that Puerto Rico is now diverging. Real GNI per capita fell after 2006 and did not recover as Puerto Rico entered its “lost decade.” Since population fell by 10 percent from 2007 to 2016, overall GNI declined by 15 percent as the island faced its deepest crisis since American rule.
As Figure 5 shows, the GNI versus GDP distinction matters. For most countries, GDP and GNI are similar, but Puerto Rico is an exception with a ratio of GNI to GDP of 0.65 for recent years. The differences between GDP and GNI reflect repatriated earnings from U.S. firms, specifically repatriated earnings from firms in the pharmaceutical and medical device industries that partly locate to Puerto Rico to avail of differential tax treatment. The prevailing view is that transfer pricing exaggerates factor payments because U.S. firms overstate the profits of their subsidiaries for tax purposes. Barry Bosworth and Susan Collins (Reference Bosworth, Collins, Collins, Bosworth and Soto-Class2006) provide compelling evidence for transfer pricing by comparing factor shares and output per worker for industries in Puerto Rico and the United States. A simpler way to grasp the possible scale of measurement error is by examining manufacturing value added. Puerto Rico shows a ratio of manufacturing value added to GDP of 0.47 for 2014, the highest in the world. The next highest ratios are 0.30 for China and Korea (2017 World Development Indicators). For Puerto Rico, household income from the census and BEA personal income are in line with GNI per capita, but not with GDP. For my purposes, GNI is therefore the better income measure because I am interested in the welfare of Puerto Ricans on the island. On the other hand, by using GNI, I understate the productivity of Puerto Rican workers. Not all factor payments are transfer pricing.
As noted, real GNI per capita for Puerto Rico is diverging from the mainland. A simple calculation shows relative Puerto Rican to U.S. real GNI per capita is now at early 1960s levels (see the Online Data Appendix). The income divergence is a puzzle given that Puerto Rico converged across most other dimensions. By 2016, life expectancy for Puerto Rico equaled that of the mainland at 79 years. Average years of education for Puerto Rico reached 11.8 years by 2012 (Fuentes-Ramírez Reference Fuentes-Ramírez2014), below the mainland to be sure (13.2 years), but above economies such as France (11.0), Belgium (11.2), and Spain (9.5).Footnote 17 As shown later, stocks of consumer durables are at mainland levels, too. Put differently, Puerto Rico converged to the United States except for income. Is real income mis-measured for Puerto Rico? The next section shows it is.
Adjusting GNI for the External Terms of Trade
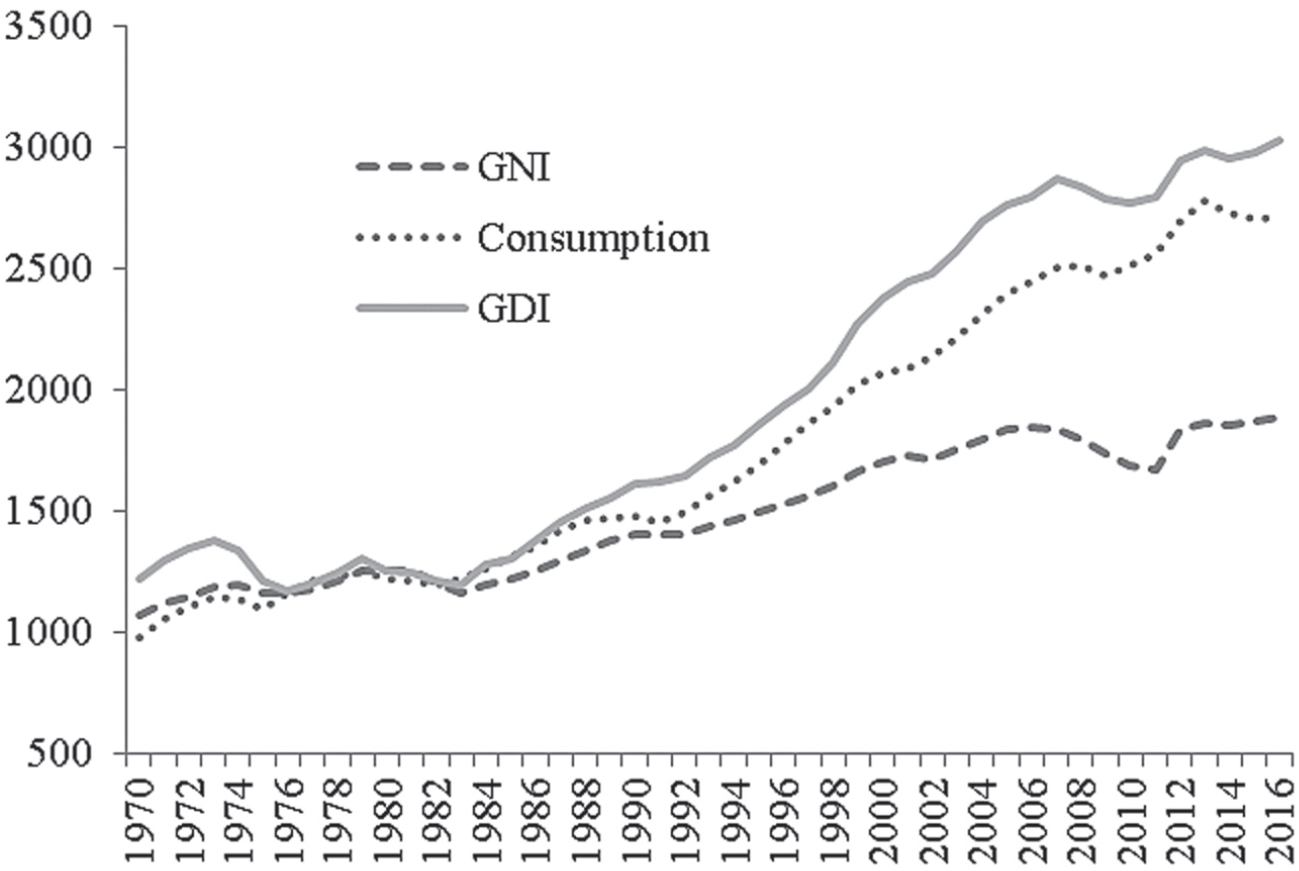
The Puerto Rican national accounts contain a remarkable paradox. This is shown by Figure 6, which compares GNI, GDI, and consumption per capita in constant 1954 prices.
INCOME AND CONSUMPTION PER CAPITA 1970 TO 2016 IN 1954 PRICES

Real consumption is 90 percent of GNI in 1970. Consumption per capita grew at 2.2 percent to 2016 while real GNI grew at only 0.9 percent. As a result, consumption for 2016 is 45 percent above GNI. The figure also shows consumption per capita recovers after 2006 unlike income. In other words, there is no “lost decade” for per capita consumption.
What explains the different behavior of consumption and real GNI? As it turns out, the series diverge because of a large and sustained improvement in the terms of trade. Figure 6 also provides GDI, which is GNI adjusted to reflect changes in the external terms of trade.Footnote 18 As should be clear from the figure, GDI and consumption move together. Why are the terms of trade effects on GDP so large? There are two reasons. First, the terms of trade increase by 60 percent since 1990; the Online Data Appendix provides a further discussion. Second, Puerto Rico's economy is one of the most open in the world, with a share of trade close to twice GNI. The high trade share combined with the large improvement in the terms of trade effect produced the exceptionally large terms of trade effect in Figure 6.
GDI therefore resolves the consumption paradox as its trajectory is in line with real consumption with an average annual growth rate of 2.0 percent from 1970 to 2016. This is double the growth rate for GNI, and it is slightly above growth for the mainland.Footnote 19 By 2016, GDI is 70 percent above GNI. In sum, there is no lost decade in per capita terms as GDI and consumption recover after the slowdown in 2006.Footnote 20
The lesson for economists interested in Puerto Rico is that they ignore GDI at their peril. To date, however, GDI does not appear in the policy literature. It is not in the Brookings volume of Susan Collins, Barry Bosworth, and Miguel Soto-Class (Reference Bosworth, Collins, Collins, Bosworth and Soto-Class2006), in the Federal Reserve report of Jaison Abel et al. (Reference Abel, Bram and Deitz2012), or the influential Anne Krueger, Ranjit Teja, and Andrew Wolfe (Reference Krueger, Teja and Wolfe2015) policy study. The neglect of GDI is unfortunate. After all, GDI per capita and real consumption have grown consistently since the mid 1980s. By concentrating on a deeply flawed measure, GNI, the policy literature provides a bleaker picture of Puerto Rico's economy than is merited.
Should we conclude Puerto Rico kept pace with the mainland and the “lost decade” for per capita living standards is a statistical artifact? Alas, this is not possible because the national accounts suffer from a second distortion, one that overstates growth, which makes it difficult to reach definitive conclusions.
Gerschenkron in the Tropics
Remarkably, Puerto Rico calculates real GNI and real GDP with fixed 1954 prices. I say remarkably, as there appears to be no other country using fixed prices for the entire post-war era. The standard practice changes prices at regular intervals. Most countries change prices every five years or so. The United States changes prices every year. The implications of measuring Puerto Rican growth with outdated prices appear to have escaped notice; the only exception I found is Bureau of Economic Analysis (BEA) 2011. The problem is that fixed prices lead to a classic index number problem, which is known as the “Gerschenkron effect,” after Alexander Gerschenkron (Reference Gerschenkron1947). The Gerschenkron effect states that measuring GDP with early prices raises measures of growth while using prices from a late year reduces growth. The bias arises because of the negative correlation between prices and quantities. Intuitively, early prices exaggerate growth because they value faster growing sectors at higher relative prices. The use of early prices over long spans creates other difficulties too. Consider new goods. How do we value an iPhone in 1954 prices?
Do fixed 1954 prices distort the Puerto Rican record? Yes, as shown in the Online Data Appendix, they overstate growth. The Appendix provides a tentative chained GDI index using a modified consumption deflator. This index is 80 percent of the GDI series for recent years implying that the Island has done quite well in per capita terms since 1974, though not as well as GDI in constant 1954 prices would suggest.
To sum up, flaws in the Puerto Rican national accounts make comparisons of growth rates between Puerto Rico and other countries, as in the classic work of Baumol and Wolfe (Reference Baumol and Wolff1996), a fraught exercise. They make it difficult to calculate the capital stock or total factor productivity along the lines of Bosworth and Collins (Reference Bosworth, Collins, Collins, Bosworth and Soto-Class2006) in any meaningful way. The upshot is we are in the dark after 1970 where Puerto Rican economic performance is concerned. Did Puerto Rico stagnate after the first oil shock or did it keep pace with the United States? We do not know with any certainty. The remainder of this section provides a simple alternative to real GNI and GDI measures. Puerto Rico measures nominal GNI with reasonable accuracy. I use this fact to compare income and consumption first to the United States and then to the wider world. The results provide a clearer view of comparative living standards, suggesting that Puerto Rico's economy, in some respects, might be considered a partial success after 1970.
An American Mirror
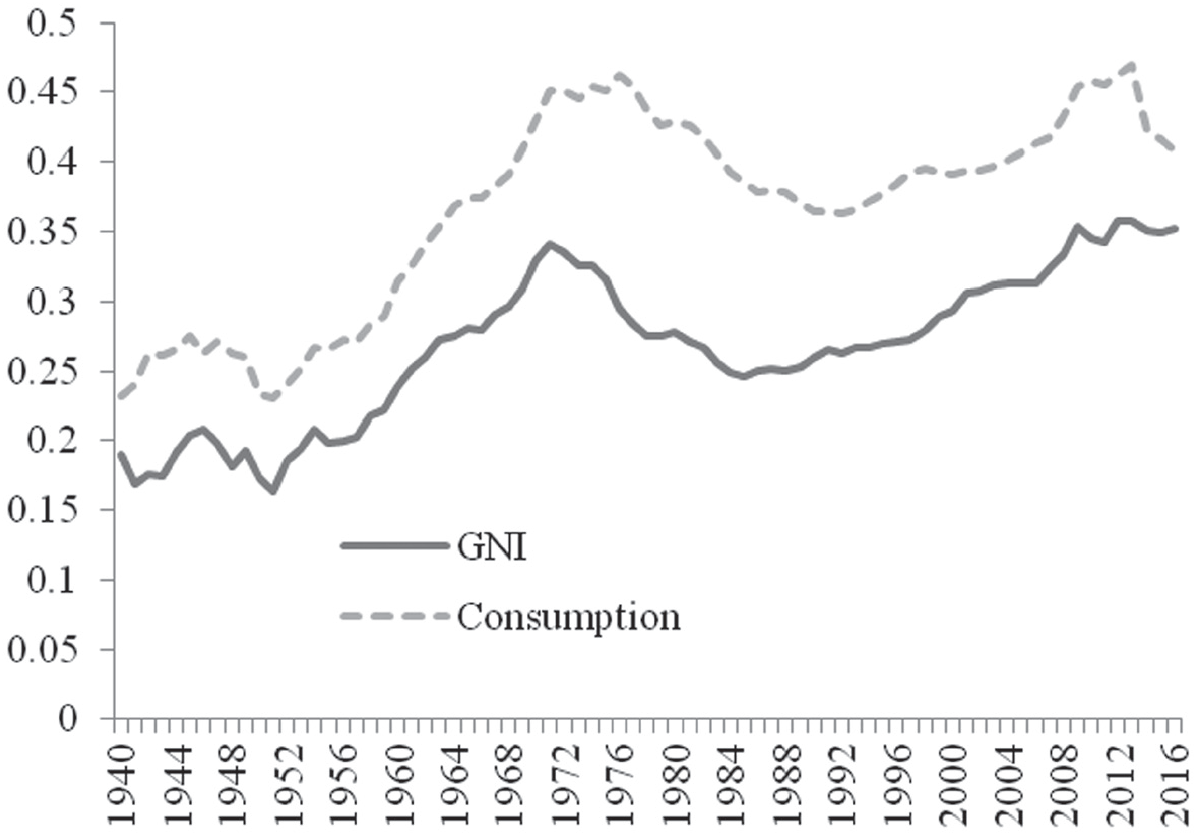
Figure 7 compares relative Puerto Rican and U.S. GNI and household consumption per capita from 1940 to 2016 in current dollars.
RELATIVE GNI AND CONSUMPTION PER CAPITA—1940 TO 2016 US = 1.00

For the approach to make sense, Puerto Rican and U.S. price levels must be equal. As discussed in the next section, the assumption holds at least approximately. I also distinguish between income and welfare, where GNI measures income and consumption measures welfare.
I start with income. The evidence from a previous section showed modest income convergence between 1900 and 1940. Figure 7 suggests that convergence ceased in the 1940s as the ratio of GNI per capita in nominal terms is constant. The ratio then doubled from 0.17 in 1950 to 0.34 in 1971—the convergence boom. Over the next decade, Puerto Rico lost ground relative to the mainland. During these years, the island experienced large shocks including the first and second oil crisis and the raising of the minimum wage to mainland levels between 1974 and 1983, as well as the extension of various social programs, most notably food stamps, to Puerto Rico. After 1985, relative nominal per capita income recovered, which is consistent with trends in real GDI per capita discussed earlier. Indeed, Puerto Rico grew faster than the United States and relative GNI in nominal terms regained the 1970s peaks, supporting earlier findings that the “lost decade” for income per capita is partly a statistical mirage. While Puerto Rican income per capita has not converged to the mainland after 1970, it has not fallen behind either. Bear in mind, however, that the improvement after 2006 occurs alongside an absolute decline in population and the labor force.
Comparisons of nominal GNI for Puerto Rico and the United States are commonplace in the policy literature. There is less interest in consumption, and I did not find any previous comparison. To compare consumption, I follow the convention in the international comparison literature by defining household consumption as private consumption from the national accounts (NIPA consumption) plus government provided education and healthcare. I term the broader measure “ICP consumption.” The expanded measure is necessary because any difference in the public provision of healthcare and education across the United States and Puerto Rico will distort comparisons.
Figure 7 reveals a large gap between relative income and relative consumption, with consumption higher for all years. The differences range from 30 to 60 percent, with the largest post-war gaps in the 1970s. Puerto Rico began in the early 1940s with consumption at 25 percent of U.S. levels as compared to 20 percent for income.Footnote 21 The gap increased during the 1970s, as consumption improved up to 1976, while relative income fell. The rise in consumption is due to increased transfers from the mainland. The consumption ratio peaked at 46 percent in 1976, well above the GNI ratio. The standing of Puerto Rico in terms of relative consumption dropped from the late 1970s, but there was a strong recovery after 1990. By 2013, per capita consumption was 47 percent of U.S. levels. This is again contrary to notions of a “lost decade” at least for per capita magnitudes. The ratio falls as the crisis intensifies.
I also compared Puerto Rico to U.S. states, using BEA state income and consumption data, as well as personal income.Footnote 22 For poorer southern states, relative Puerto Rican consumption ratios are higher. In the case of Mississippi and Arkansas, they are 60 percent before the crisis.Footnote 23 In addition, I compared Puerto Rico to the mainland using housing and stocks of consumer durables. The results support claims the island is no longer very poor. Consider housing. Data from the American Community Survey (ACS) for 2016, suggests in terms of rooms per person, kitchen, and toilet facilities, and average age of structure, the Puerto Rican housing stock is comparable to that of the mainland. Consumer durables tell a similar story. The ACS for 2016 shows 84 percent of households in Puerto Rico have at least one vehicle, 30 percent have two, and 9 percent have three or more. These levels are a little below the mainland, and the average vehicle age is likely higher, but this is hardly indicative of extreme poverty. At a deeper level, the differences between GNI and consumption in Figure 7 reflect the flow of resources from the mainland allowing insular expenditures to exceed income. Since the New Deal, remittances, government and private borrowing, and most importantly, federal transfers to individuals and to the Puerto Rican government ensured that nominal spending (C+I+G) exceeded nominal GNI.Footnote 24
To summarize, Puerto Rico living standards, as measured by consumption, are higher than is generally understood. While Puerto Rico has not converged to the United States, after 1970, it has not fallen further behind either. Nonetheless, overall consumption per capita is well below even the poorest southern states. Suppose, however, that Puerto Rico is best seen as a separate Latin society, albeit one receiving large transfers from the U.S. mainland. The relevant comparison then becomes other Latin economies.
A LATIN MIRROR
There are two reference groups for international comparisons. The first is Iberia and Latin America. Their relevance is obvious as they share a common cultural and linguistic heritage. The second reference group is comprised of the rich market economies of Europe, that is, Belgium, Demark, France, Germany, Greece, Italy, Ireland, the Netherlands, Norway, and the United Kingdom. These are countries with standards of living to which Puerto Rico might aspire.
The approach of the last section required price levels to be equal across the United States and Puerto Rico. The claim is difficult to verify, as the island has not participated in the International Comparison Program (the ICP). There is, however, evidence from other sources. The most important indicators come from the price comparisons of the COLA program, the Non-Foreign Cost of Living Allowance, compensating federal bureaucrats posted to Puerto Rico, Hawaii, Alaska, and other outlying areas for differences in the cost of living. The Online Data Appendix shows that the COLA studies, as well as other evidence, suggest slightly lower price levels for the island. To simplify, I assume price levels are equal which likely overstates Puerto Rican prices and understates Puerto Rican living standards. COLA covers recent decades. To provide an anchor for an earlier comparison, the Online Data Appendix presents a direct 1950 Puerto Rico U.S. income comparison correcting for price level differences along the lines pioneered by Milton Gilbert and Irving Kravis (Reference Gilbert and Kravis1954, Reference Gilbert and Kravis1958), the forerunner to the ICP.
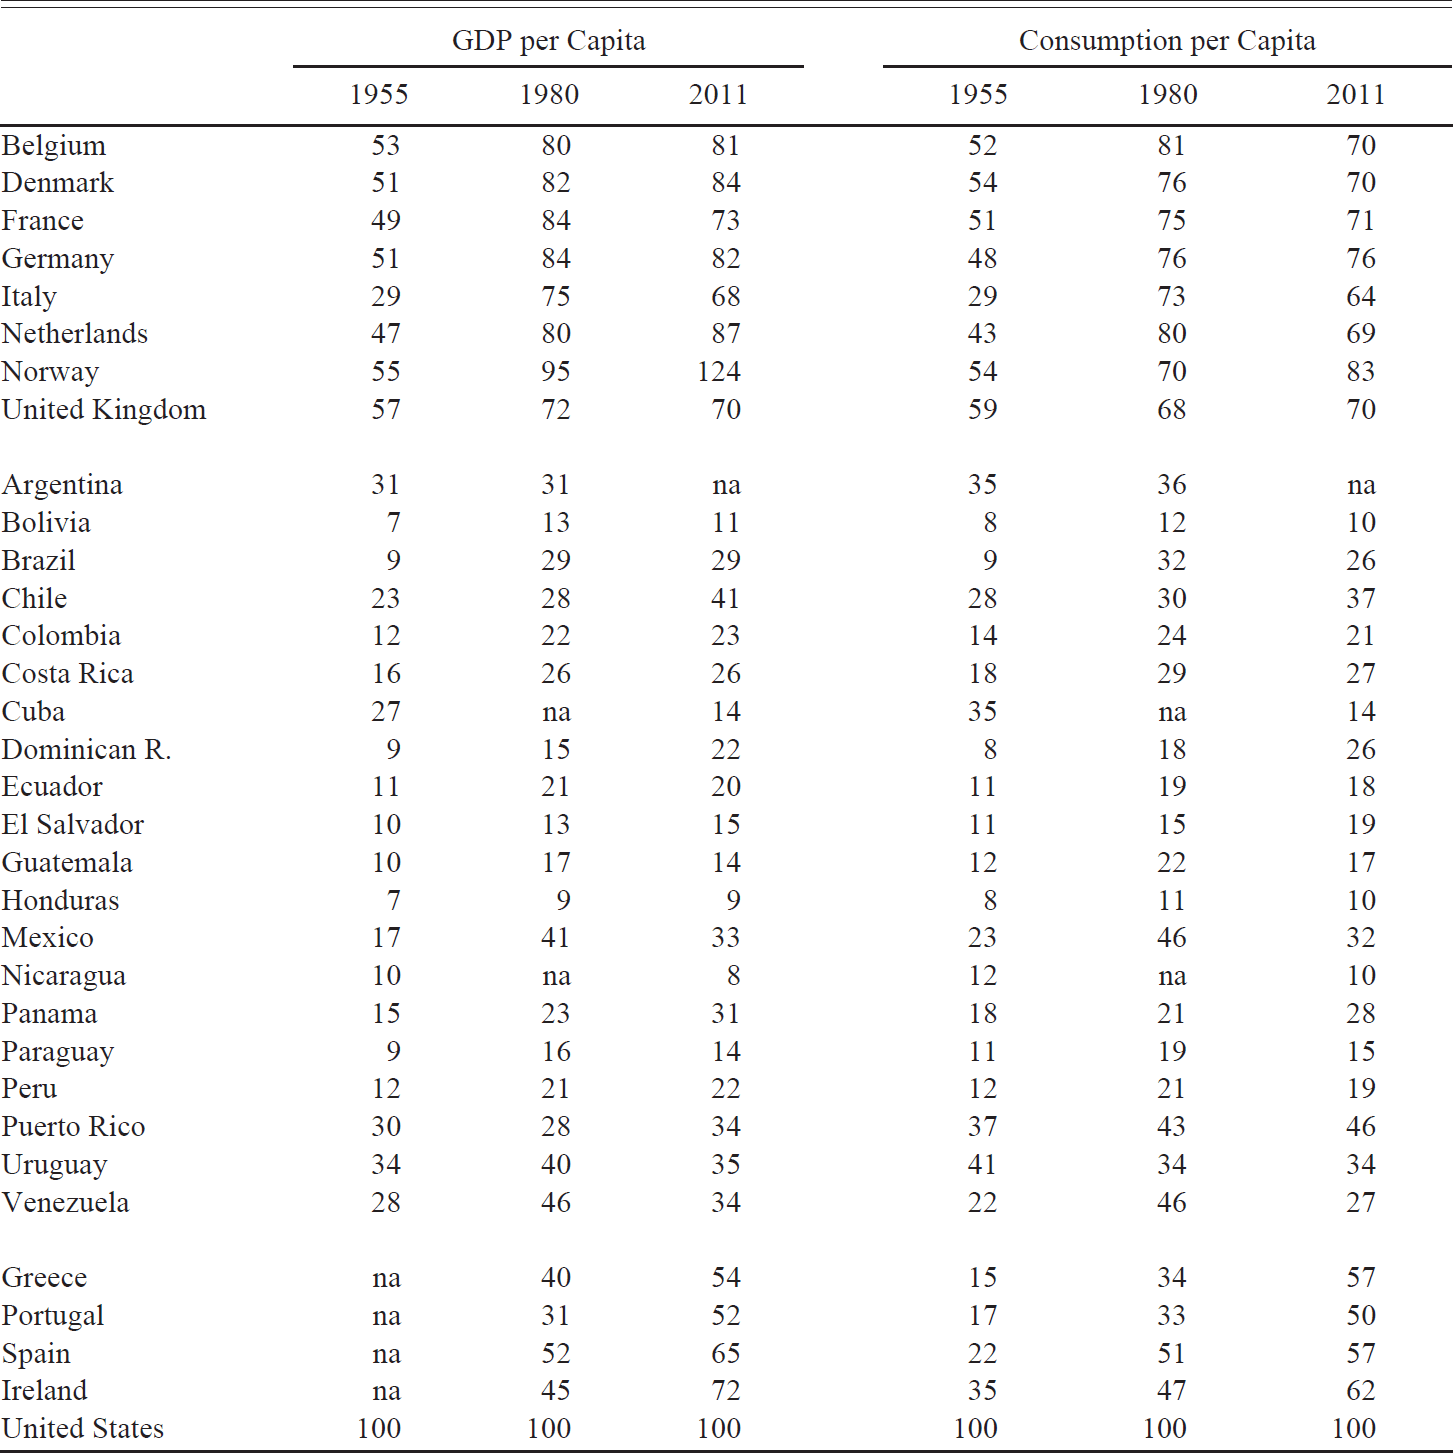
I compare income and consumption for Puerto Rico to the comparison economies for three years, 1955, 1980, and 2011. I chose the years because of good coverage for Latin America. The measures compare income with disaggregated price and expenditure data. For 1980 and 2011, I rely on ICP data. For 1955, I use Stanley Braithwaite (Reference Braithwaite1968) for Latin America while the European estimates are from Gilbert and Kravis (Reference Gilbert and Kravis1958) and James Dewhurst, John Coppock, and Larmarartine Yates (Reference Dewhurst, Coppock and Yates1961). For Puerto Rico, I project the Puerto Rican/U.S. 1950 estimates from the Appendix to 1955 with the national accounts. I compare GDP for all countries save for Puerto Rico and Ireland where I use GNI. The comparisons are bilateral Fisher Ideal indices for 1955 and 1980 and generalized Fisher Ideal indices for 2011.
The results are in Table 3. They show the United States with a commanding lead in 1955. Western European income and consumption averages 50 to 60 percent of U.S. levels. Next are middle-income economies such Argentina, Cuba, Puerto Rico, and Uruguay in Latin America along with Ireland and Italy from Europe where income/consumption averages 30 to 35 percent of the United States. Judged by consumption, the Puerto Rico of 1955 is already a middle-income economy. At 37 percent of the United States, consumption is close to Argentina, pre-Castro Cuba, Uruguay, and Ireland. It is above Italy, Greece, Spain, and Portugal in Europe. Thus, Puerto Rico shared with the Southern Cone the highest consumption level among Spanish speaking societies. Income per capita for the island, at 30 percent of the United States, is less impressive.
GDP AND CONSUMPTION PER CAPITA—1955, 1980, AND 2011 US = 100

Notes: The table compares real income and consumption with prices from comparisons years. For example, I use 1980 prices to compare income and consumption for 1980 and so on. Consequently, the income comparisons do not equal those of Maddison (Reference Maddison2007) as he compares income for all years with fixed 1990 prices. The estimates are consistent, however, with the latest version of the Penn World Tables (PWT). Over its lifetime, the PWT adopted various approaches. The latest edition, version 9.0, compares income using the prices from the nearest ICP benchmark see Feenstra, Inklaar, and Timmer (Reference Feenstra, Inklaar and Timmer2015). In this regard, the PWT has followed the example of economic historians such as Prados De la Escosura (Reference Prados de la Escosura2000). The estimates in the table are, however, consistent with the latest version of the Maddison project, which provides a series for income using current prices. The ICP uses GDP per capita. For Ireland and Puerto Rico, I replace GDP with GNI as GDP exaggerates income. While GDP is the preferred measure, GNI makes more sense for these economies. Replacing GDP with GNI for other countries does not change the outcomes. The 1955 and 1980 comparisons are Fisher Ideal indices while 2011 is a multilateral generalization of the Fisher Ideal Index called the Elteto Koves and Szulc (EKS) index.
Sources: The 1955 benchmarks are from Ward and Devereux (Reference Ward and Devereux2012) with the following exceptions. For Puerto Rico, I use the 1950 U.S./Puerto Rico benchmark described in the Online Data Appendix projected to 1955 using the national accounts. For Greece, Ireland, Spain, and Portugal I use Dewhurst, Coppock, and Yates (Reference Dewhurst, Coppock and Yates1961). This source provides relative consumption prepared for, but not published in, Gilbert and Kravis (Reference Gilbert and Kravis1958). I construct the 1980 comparisons from detailed ICP price and expenditure data at http://www.rug.nl/research/ggdc/data/pwt/pwt-9.0 where I assume price levels are equal across the US and Puerto Rico. Finally, as data necessary to calculate the Fisher Ideal for 2011 are not available I take the 2011 estimates from http://www.worldbank.org/en/programs/icp#5. For Cuba in 2011, I use the estimate for UN Human Development Report for 2015. I again assume U.S. and Puerto Rican price levels are equal.
By 1980, Western Europe had edged closer to the U.S. frontier, Italy had joined the rich economies, and Spain moved up the world income distribution. For Puerto Rico, consumption was 43 percent of the United States, a little below Spain and Ireland, but ahead of the Southern Cone, Greece, and Portugal. The standing for income is lower at 28 percent of the United States, below Argentina, Brazil, Mexico, Uruguay, and Venezuela.
The 2011 comparison brings us to date. The United States still leads in consumption while Norway leads in income. The Western European economies have slipped relative to 1980, but Spain and Ireland are closer to the Western European frontier. For consumption, Puerto Rico has fallen behind Greece, Spain, and Ireland and to a lesser extent Portugal. Yet, Puerto Rico is still above all of Latin America. The next Latin economy is Chile where consumption is only 80 percent of Puerto Rico. The contrast of consumption with income remains, as Puerto Rican income is stuck at the level of Uruguay and Venezuela, which is well below that of Chile.
To sum up, from 1955 to 2011, Puerto Rico's economy fared worse than that of Greece, Spain, or Ireland. Nevertheless, judged by consumption Puerto Rico is a fairly prosperous country, roughly at the level of Portugal or Korea, countries not usually viewed as impoverished. The high levels for consumption are reflected in stocks of consumer durables. Consider private transport vehicles per capita.Footnote 25 For 2011, Puerto Rico had 611 vehicles per 1,000 people. This is below the mainland (786), but it is above almost all developed economies. It is double the ratio for Korea and the Southern Cone.
CONCLUSION
Puerto Rico's economic development is a remarkable case, as it is a Spanish speaking society that for many purposes acts as a U.S. state. Its economic history remains largely unexplored. To fill part of the gap, this article examines the record for income and consumption from annexation until now. The first part of the article provides a new GDP index for the years of direct U.S. rule. The results challenge claims that Puerto Rico was stagnant before the New Deal. In fact, income grew at impressive rates. Nor, as is widely believed, did Puerto Rico suffer disproportionately during the Great Depression. Relative to its starting point, it did better than the mainland.
The second part of the article considers the years after Puerto Rico gained home rule. The results for income are disappointing, but what matters for economic welfare is consumption. Judged by consumption, Puerto Rico is a middle-income developed economy as its consumption per capita is above all of Latin America and is close to a country like Portugal. Furthermore, since the 1950s, Puerto Rico has had the highest or close to the highest consumption level of any Latin society. Seen in this light, Puerto Rico's economy might have done better in its American century, but it is not a disaster either.
The more general point is that an evaluation of Puerto Rico depends on how we view the island. The view from the mainland sees Puerto Rico as a de-facto U.S. state, albeit speaking Spanish. Puerto Ricans, or so the argument goes, are Americans sharing a fixed exchange rate and a common monetary policy with the mainland and receiving large transfers from the federal government. It follows that we ought to evaluate Puerto Rico as we would evaluate a poor southern state such as Arkansas. There is merit in this view. But against it is the fact Puerto Rico has a different history and a different language. Its culture and traditions differ from the U.S. mainland. If Puerto Rico is compared to other countries, its economy appears more successful. It has a standard of living that exceeds other Latin societies, a standard of living, moreover, that is partly disconnected from the income of its citizens. This, to be sure, is a Puerto Rican paradox worth exploring.