The etiology, typical progression, accurate assessment, and effective treatment of personality disorders (PDs) have been challenging to establish, contributing to suboptimal patient outcomes. This is because PDs are heterogeneous and highly comorbid with other forms of psychopathology (Bateman et al., Reference Bateman, Gunderson and Mulder2015; Silverman and Krueger, Reference Silverman, Krueger, Livesley and Larstone2018). Moreover, within the Diagnostic and Statistical Manual of Mental Disorders (DSM; American Psychiatric Association, 2013), PDs continue to be conceptualized as discrete categories despite strong evidence of limitations of this approach and benefits of a dimensional perspective (Krueger et al., Reference Krueger, Hopwood, Wright and Markon2014; Hopwood et al., Reference Hopwood, Kotov, Krueger, Watson, Widiger, Althoff, Ansell, Bach, Michael Bagby and Blais2018). Although DSM diagnoses were organized around key clinical processes, such as contextualized and dynamic symptoms (Wright and Hopwood, Reference Wright and Hopwood2016), efforts to integrate a dimensional perspective into clinical settings, as exemplified by the ‘Alternative Model for Personality Disorder’ (AMPD) in the latest version of the DSM, have significant potential to accommodate the inherent heterogeneity in manifestations of personality pathology. An important step toward this goal is to determine how an empirically-based dimensional model of personality can capture within-person processes that underlie traditional diagnostic groupings.
Structuring dimensionality: temporal network approaches to personality
Mental disorders may be fruitfully represented as a network of ‘interacting symptoms’ (Fried et al., Reference Fried, Van Borkulo, Cramer, Boschloo, Schoevers and Borsboom2017), composed of a set of elements (‘nodes’) and the connections (often referred to as ‘edges’) between those elements. A variety of network models are widely used in other fields (reviewed in Bringmann and Eronen, Reference Bringmann and Eronen2018) and differ in suitability for research questions, inferences that can be made, and statistical accuracy (Boccaletti et al., Reference Boccaletti, Latora, Moreno, Chavez and Hwang2006).
Person-specific temporal network models are especially appealing to PD research. They leverage intensive longitudinal data (many observations per person) to represent person-specific dynamic psychological processes, and contrast with structural models of psychopathology that are based on cross-sectional data and do not distinguish between exacerbations and diminutions of pathology over time (Forbes et al., Reference Forbes, Wright, Markon and Krueger2017). Although PDs (and pathological traits as described in the AMPD) have demonstrated long-term stability across individuals (i.e. rank order, mean-level change) (Morey and Hopwood, Reference Morey and Hopwood2013; Wright et al., Reference Wright, Calabrese, Rudick, Yam, Zelazny, Williams, Rotterman and Simms2015b; Hopwood and Bleidorn, Reference Hopwood and Bleidorn2018), expressions of PDs and pathological traits exhibit short-term fluctuation within individuals (Wright et al., Reference Wright, Beltz, Gates, Molenaar and Simms2015a; Wright and Simms, Reference Wright and Simms2016). Indeed, the person-specific, dynamic nature of PDs is key to treatment, as clinicians seek to understand the mechanisms of symptom expression to determine when and how to interrupt these processes for a unique individual (Wright and Hopwood, Reference Wright and Hopwood2016). Person-specific temporal network models speak to this, producing an individualized symptom-level structure of personality pathology dynamics, which could then be used to better predict behavior and clinical outcomes.
To capture PD symptom dynamics, researchers can use study designs that incorporate frequent real-time data collection in an individual's natural environment (i.e. ambulatory assessments). Daily diaries or Ecological Momentary Assessment (EMA) approaches are characterized by a series of repeated measurements (often via phone, tablet, or computer) of current experiences (including emotional states and behaviors) while participants engage in normal daily activities (Trull and Ebner-Priemer, Reference Trull and Ebner-Priemer2013). For example, Wright et al. (Reference Wright, Beltz, Gates, Molenaar and Simms2015a) examined daily covariation among domains of internalizing (i.e. negative affect and detachment) and externalizing (i.e. hostility and impulsivity) behavior in individuals with personality pathology via an online survey every day for 100 days. They modeled associations among these daily manifestations of PDs using a person-specific temporal network approach called unified structural equation modeling (uSEM; Kim et al., Reference Kim, Zhu, Chang, Bentler and Ernst2007; Gates et al., Reference Gates, Molenaar, Hillary, Ram and Rovine2010). uSEMs combine traditional SEM and vector-autoregressive (VAR) approaches in order to model contemporaneous (i.e. domains predicted by domains on the same day; from SEM) and lagged (i.e. domains predicted by domains on previous days; from VAR models) connections. The resulting networks provided insight into how the domains predicted one another on the same and different days uniquely for each participant; these inter-relations were not evident from the descriptive data typically used in group-level analyses, such as item means (Wright et al., Reference Wright, Beltz, Gates, Molenaar and Simms2015a).
Although person-specific temporal networks can illuminate heterogeneous phenomena, there is clear clinical value in being able to understand homogenous processes to the extent that they exist. Thus, ideal models of PDs and psychopathology should be able to generalize somewhat across individuals, while leaving room for personalized elements (Wright et al., Reference Wright, Beltz, Gates, Molenaar and Simms2015a; Wright and Zimmermann, Reference Wright, Gates, Arizmendi, Lane, Woods and Edershile2019). Indeed, research has begun to demonstrate the utility of person-specific temporal approaches in understanding psychopathology (e.g. Fisher et al., Reference Fisher, Reeves, Lawyer, Medaglia and Rubel2017; Epskamp et al., Reference Epskamp, Van Borkulo, Van Der Veen, Servaas, Isvoranu, Riese and Cramer2018). For instance, in an illustrative analysis, Beltz et al. (Reference Beltz, Wright, Sprague and Molenaar2016) used group iterative multiple model estimation (GIMME; Gates and Molenaar, Reference Gates and Molenaar2012) to generate network maps for 25 participants with PDs representing daily dynamic processes of a network including the same four personality pathology domains examined by Wright et al. (Reference Wright, Beltz, Gates, Molenaar and Simms2015a). GIMME implements uSEMs with a grouping element to account for both homogeneity (in group-level connections) and person-specific heterogeneity (in individual-level connections). Beltz et al. (Reference Beltz, Wright, Sprague and Molenaar2016) identified two contemporaneous group-level connections between domains (i.e. disinhibition predicted hostility; negative affect predicted detachment), which can be interpreted as evidence for homogeneity in network functioning, even among participants with differing diagnoses and demographic characteristics. Yet, there was also considerable heterogeneity in network functioning across participants, as represented by unique individual-level connections between domains within individuals' maps (Beltz et al., Reference Beltz, Wright, Sprague and Molenaar2016). Taken together, this exemplar paper demonstrated that GIMME can successfully integrate group- and individual-level features of dimensional personality pathology, with potential clinical implications.
GIMME: a temporal network model of homogeneity and heterogeneity
Features of GIMME networks, including connections (represented by regression coefficients), can be extracted to characterize meaningful psychological processes. For instance, nodes (domains in the studies above) in the networks of some individuals can have significant auto-regressive coefficients, which indicate time-lagged self-prediction (e.g. yesterday's negative affect predicts today's negative affect). Positive auto-regressive coefficients may reflect a clinical ‘inertia,’ or the extent to which emotional states are resistant to change, which has been associated with maladjustment and psychopathology (Houben et al., Reference Houben, Van Den noortgate and Kuppens2015). Additionally, the number of connections into and out of a node, referred to as ‘degree centrality,’ reflect the extent to which a domain predicts or is predicted by others. For example, certain domains can be identified as having particularly high ‘in-degree’ (i.e. predicted by other domains), whereas other domains may have particularly high ‘out-degree’ (i.e. predicting other domains) (Boccaletti et al., Reference Boccaletti, Latora, Moreno, Chavez and Hwang2006). Thus, GIMME captures differential patterns of temporal network functioning and the person-specific organization of personality pathology. Further research is needed to examine the utility of GIMME in a larger, more heterogonous sample – beyond illustrative and exemplar studies (Wright et al., Reference Wright, Beltz, Gates, Molenaar and Simms2015a; Beltz et al., Reference Beltz, Wright, Sprague and Molenaar2016). Moreover, no studies have examined whether GIMME network features reflect traditional PD symptomatology or provide insight into daily outcomes typically assessed by clinicians to understand risk, such as stress.
Current study
Here we take an empirically-based dimensional approach to the study of heterogeneity in personality pathology by employing GIMME to examine person-specific, day-to-day phenomenology of personality pathology measured by the ‘big-4’ of personality pathology (i.e. negative affect, detachment, impulsivity, and hostility; Widiger and Simonsen, Reference Widiger and Simonsen2005). In a large, heterogeneous sample of individuals with prior PD diagnoses, we leveraged the GIMME demonstration of Beltz et al. (Reference Beltz, Wright, Sprague and Molenaar2016) and extend the person-specific models of Wright et al. (Reference Wright, Beltz, Gates, Molenaar and Simms2015a). We then determined whether temporal network characteristics were differentially associated with traditional PD symptomatology (beyond average levels of the ‘big-4’) and whether they have predictive utility for understanding daily variation in clinically-relevant phenomena like stress.
Methods
Data came from a daily diary study in a sample of individuals with personality pathology, as discussed above (Wright et al., Reference Wright, Beltz, Gates, Molenaar and Simms2015a; Beltz et al., Reference Beltz, Wright, Sprague and Molenaar2016). Other data from this study have also been published in work with different research aims. Lane et al. (Reference Lane, Gates, Pike, Beltz and Wright2019) was primarily a simulation study to validate the subgrouping component of GIMME aiming to map the core features of borderline personality disorder (BPD), and only included participants from this sample who met the clinical threshold for BPD. Wright et al. (Reference Wright, Gates, Arizmendi, Lane, Woods and Edershile2019) also used the subgrouping component of GIMME aiming to map the interplay among stress, interpersonal behavior, and affect. The current manuscript is conceptually and methodologically distinct from this past work: We used the multiple solutions version of GIMME and variables concerning the broader forms of personality pathology aiming to go beyond network mapping by using network features to predict PD symptoms and daily stress.
Participants
Participants were 91 individuals (62.6% female) with a PD selected from the daily diary portion of a parent study aimed at refining measurement in personality pathology (Wright et al., Reference Wright, Beltz, Gates, Molenaar and Simms2015a). All procedures contributing to this work comply with the ethical standards of the relevant national and institutional committees on human experimentation and with the Helsinki Declaration of 1975, as revised in 2008. Participants completed online diaries including clinically-relevant behaviors for 100 consecutive evenings. Although 116 participants attended a baseline assessment, only participants providing at least 60 days of data were included in the present analyses to ensure reliable parameter estimates (n = 95), based on simulation-derived cut-offs (Lane et al., Reference Lane, Gates, Pike, Beltz and Wright2019). An additional four participants were excluded due to low variance in item endorsement (i.e. consistently marking only ‘0’ for relevant items).
The final sample of 91 participants primarily reported being either White (83.5%) or African American (13.2%), and had a mean age of 45.13 years (s.d. = 13.37). They were heterogeneous in PD diagnoses: 56% avoidant, 6.6% dependent, 48.4% obsessive-compulsive, 18.7% narcissistic, 39.6% borderline, 4% histrionic, 7.7% antisocial, 36.3% paranoid, 16.5% schizotypal, and 13.2% schizoid. The average number of PD diagnoses per participant was 2.5. Additionally, 63.7% were diagnosed with mood disorders, 72.5% with anxiety disorders, 9.9% with psychotic disorders, and 23% with substance/alcohol use disorders. Participants provided a mean of 97.19 data points (i.e. 97.19 completed daily diaries; s.d. = 6.82). Detailed demographics are presented in Table 1. Participants received financial compensation for their participation: see Wright et al. (Reference Wright, Beltz, Gates, Molenaar and Simms2015a).
Sample demographics

M, mean; s.d., standard deviation. Sample size of 91.
Measures
Daily domains of PD
Four factor-analytically derived domains of daily personality pathology were created from 16 daily diary items that were designed to capture day-to-day expressions of PDs (Wright et al., Reference Wright, Beltz, Gates, Molenaar and Simms2015a). Briefly, participants rated items on an eight-point response scale (0 = ‘Not at all’; 7 = ‘Very much so’). The statements were designed to reflect the personality facets of negative affect, detachment, disinhibition, and hostility. Scores were created by averaging relevant items. When participants were missing a data point, the score was typically imputed by averaging the scores from the previous and following 2 days (online Supplementary Materials); when the amount of missing time series data is low (<20%), imputation method has little influence on results (Rankin and Marsh, Reference Rankin and Marsh1985). The resulting four-variate time series were used in subsequent analyses.
Baseline PD symptom counts
PD symptom counts were determined from clinical diagnostic interviews conducted at the baseline assessment. On average, the time between diagnostic interview and the first diary in this study was 1.4 years (s.d. = 0.16 years). Although 11 PDs were assessed in this sample, we specifically focused on disorders with higher prevalence rates in the current study (>15%) to ensure sufficient representation: avoidant, obsessive-compulsive, narcissistic, borderline, paranoid, and schizotypal.
Stress
A latent factor score was computed using seven stress indicators reported daily. Each indicator captured broad experiences of stress (e.g. ‘Did you have an argument or disagreement with anyone since this time yesterday?’) and was estimated as a product of the number of events occurring in that category and the severity rating for that category on a four-point response scale (0 = ‘Not at all’; 3 = ‘Very’).
Data analysis
First, the 91 time series were submitted to GIMME-MS, a version of GIMME that generates multiple solutions in order to facilitate the accurate estimation of the direction of prediction among variables (Beltz and Molenaar, Reference Beltz and Molenaar2016). Within GIMME, two connections can equally improve model fit at a given iteration. To address this, multiple solutions are generated, each following a path originating at one of the equal connections. For instance, if the contemporaneous connection from variable A to variable B would improve model fit as much as the contemporaneous connection from B to A, then one solution would estimate the A-to-B connection and continue to iterate, while a separate solution would estimate the B-to-A connection and continue to iterate. A single solution is then selected based on the AIC (online Supplementary Materials; Beltz and Molenaar, Reference Beltz and Molenaar2016). At the group level, the standard 75% criterion was used: A connection between two domains was required to be significant (according to a χ2 difference test with one degree of freedom for an individual's model) for at least 69 (of 91) participants to be estimated for everyone in the sample. At the individual level, an optimal solution – when multiple were generated – was selected according to the Akaike Information Criterion (AIC; Akaike, Reference Akaike1974); see online Supplementary Materials. Final maps (containing group- and individual-level connections for each participant) were evaluated with alternative fit indices, with two of four required to meet cut-offs to indicate excellent fit (Brown, Reference Brown2014): root mean square error of approximation (RMSEA) ⩽0.05, standardized root mean square residual (SRMR) ⩽0.05, comparative fit index (CFI) ⩾0.95, and non-normed fit index (NNFI) ⩾0.95. White noise tests were conducted on each map to determine whether all temporal information was captured by the modeled connections (i.e. whether residuals were uncorrelated white noise); see online Supplementary Materials.
Extraction of network features
We extracted several features from the individual-level networks to characterize person-specific patterns of connections among the domains that could be linked to diagnoses and daily behavior.
Auto-regressive coefficients. For each participant, we examined whether a given domain had a relatively large first-order auto-regressive coefficient. The presence of a positive, significant auto-regressive coefficient can be interpreted as temporal stability in that domain.
Degree. For each participant, we calculated the within-internalizing degree (i.e. total number of connections between negative affect and detachment regardless of their direction or whether they were contemporaneous or lagged), within-externalizing degree (i.e. between impulsivity and hostility), and between internalizing and externalizing degree (i.e. total number of connections between an externalizing domain and an internalizing domain). Within-degree reflects the extent to which facets within the same domain influence one another. For example, a higher within-internalizing degree would indicate that levels of negative affect and detachment are highly dependent on one another. The degree between internalizing and externalizing, instead, represents cross-talk across internalizing and externalizing domains.
Regressions
We tested associations between PD symptomatology and network features to determine whether associations between externalizing and internalizing domains uniquely underlie diagnoses; specifically, the goal was to determine whether network features predict dimensional symptoms above and beyond average levels of the ‘big-4’ typically used in clinical research. A multiple regression model was run for each network feature (predictor) and symptom count (outcome), with age and average daily ratings for each domain included as covariates; see Table 2 for zero-order correlations among covariates and PD symptom counts. The daily ratings statistically control for levels of externalizing and internalizing domains, and therefore isolate the effects of the dynamic interplay among the domains, as represented by the network features. There were no significant differences between male and female participants for any of the symptom counts, and thus, sex was not covaried. The resulting standardized β weights are interpreted as dimensional indices of the strength and direction of the relation between a symptom and a given network feature. We note results that are statistically significant at p < 0.05 (uncorrected), but focus on the variation of the indices because we did not have a priori hypotheses.
Bivariate correlations between average ratings of daily domains of personality pathology, age and baseline personality disorder symptom counts

***p < 0.001; **p < 0.01; *p < 0.05.
Multilevel models
We examined whether network features were predictive of stress to illustrate the utility of network features for understanding daily processes linked to clinically-relevant outcomes. We used multilevel growth models (with an unstructured covariance matrix of the random effects) to examine changes in stress across the course of the study, and the extent to which daily stress was predicted by dynamics within and between internalizing and externalizing domains. Age and average domain levels were time-invariant covariates. Gender was also a time-invariant covariate because of sex differences in stress experiences and responses (Kudielka and Kirschbaum, Reference Kudielka and Kirschbaum2005; Bale and Epperson, Reference Bale and Epperson2015). Day was nested within participants (using unstructured covariance matrix of the random effects), and both random intercepts and slopes were modeled.
Results
GIMME
Final network models generally fit the data well (average: χ2 = 15.49, df = 17.93, CFI = 1.00, NNFI = 0.99, RMSEA = 0.01, SRMR = 0.05). However, a small percentage of models (7.69%) only met standards of acceptable fit (i.e. only one index met criteria for excellent fit). Interestingly, GIMME-MS did not detect any group-level connections; that is, there were no identical connections of the same directionality present across the majority of the sample. Thus, GIMME-MS only mapped person-specific connections.
GIMME-MS results were manually reviewed for multiple solutions (see online Supplementary Materials) to identify the best-fitting model (using primarily the AIC as validated in Beltz and Molenaar, Reference Beltz and Molenaar2016). Selected models for each individual were then submitted to a posteriori model validation to ensure that their temporal order (i.e. the covariation accounted for by the contemporaneous and lag 1 connections) was sufficient for capturing sequential dependencies. Specifically, if residuals were not white noise, lag 2 or lag 3 connections were fit to the data (online Supplementary Materials).
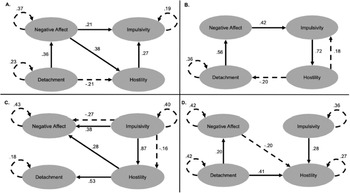
Final models contained between 1 and 12 connections (M = 6.24, s.d. = 1.89), with all models including contemporaneous connections (range: 4–9) and most including lagged connections (range: 0–6). Figure 1 depicts individual-level maps from four participants selected to represent networks at high levels of paranoid (Fig. 1a), borderline (Fig. 1b), narcissistic (Fig. 1c), and obsessive-compulsive symptoms (Fig. 1d). These participants had at least one auto-regressive component, suggesting some day-to-day stability in domains; this also was evident in the full sample (range of first-order auto-regressive coefficients: 0–4). The majority of auto-regressive coefficients (98.7%) across all participants had positive β weights (n = 2 significant negative auto-regressive coefficients), consistent with the interpretation that these coefficients reflect temporal stability. Except for participant C, the depicted participants also had connections within the internalizing domains (i.e. negative affect and impulsivity were related); this was true for nearly the entire sample (94.5% had within-internalizing connections). Additionally, the depicted participants had connections within the externalizing domains (i.e. detachment and hostility were related) and between the internalizing and externalizing domains; this was also true for nearly all the sample (90.1% had within-externalizing connections; 95.6% had between internalizing and externalizing connections).
Final GIMME networks for four participants with differing levels of personality pathology symptomatology. Solid lines depict contemporaneous connections and dashed lines depict lagged connections. There was no group-level structure; thus, all lines depict individual-level connections (uniquely estimated for the participant) that also have associated β weights. All four models had excellent fit and were of the first order (i.e. only lag 1 connections estimated). (a) Participant with notable paranoid symptomatology (8 symptoms; range in the sample 0–8); model fit: χ2 = 9.67, df = 14, CFI = 1.00, NNFI = 1.00, RMSEA = 0.00, SRMR = 0.04. (b) Participant with notable borderline symptomatology (15 symptoms; range in the sample 0–15); model fit: χ2 = 6.28, df = 16, CFI = 1.00, NNFI = 1.00, RMSEA = 0.00, SRMR = 0.03. (c) Participant with notable narcissistic symptomatology (11 symptoms; range in the sample 0–12); model fit: χ2 = 13, df = 13, CFI = 1.00, NNFI = 1.00, RMSEA = 0.00, SRMR = 0.04. (d) Participant with notable obsessive-compulsive symptomatology (8 symptoms; range in the sample 1–9); model fit: χ2 = 11.20, df = 14, CFI = 1.00, NNFI = 1.00, RMSEA = 0.00, SRMR = 0.05.

Associations among personality networks and symptomatology
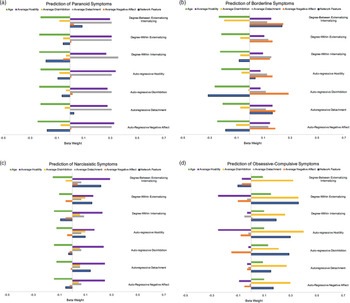
Multiple regression analyses revealed unique temporal network signatures for different PD symptoms; see online Supplementary Table S1. Average R 2 for models predicting each symptom count were as follows: borderline = 0.17, narcissistic = 0.13, avoidant = 0.24, obsessive-compulsive = 0.09, paranoid = 0.30, schizotypal = 0.12. Results are shown in Fig. 2 and online Supplementary Figs S1 and S2, which include all β weights from each model, depicting the differential prediction of each PD symptom by age, average levels of the domains, and the network features. For instance, Fig. 2a depicts the prediction of paranoid symptomatology. After controlling for age (green) and average levels of detachment (gray), negative affect (orange), disinhibition (yellow), and hostility (purple), network features (blue and listed on the y-axis) still uniquely predicted symptoms, specifically connections within the internalizing domain. Bars to the left represent negative prediction magnitudes; bars to the right represent positive prediction magnitudes.
Temporal network signatures of personality disorders. (a) Temporal network signature of paranoid symptomatology. (b) Temporal network signature of borderline symptomatology. (c) Temporal network signature of narcissistic symptomatology. (d) Temporal network signature of obsessive-compulsive symptomatology. Each panel includes the resulting standardized β weights of the associations between the six predictor variables (i.e. network feature: blue bar; average daily level of negative affect: orange bar; average daily level of detachment: grey bar; average daily level of disinhibition: yellow bar; average daily level of hostility: purple bar; age: green bar) and the criterion (i.e. PD symptom count). Each panel includes the results for seven separate models (i.e. one model for each network feature, indicated by the vertical labels).

The network features uniquely predicted four of the six PD symptoms considered. First, paranoid symptomatology (Fig. 2a) was uniquely predicted by lower within-internalizing degree, suggesting that reduced cross-talk between negative affect and detachment is linked to higher levels of mistrustfulness. Second, borderline symptomatology (Fig. 2b) was uniquely predicted by disinhibition auto-regression, such that greater symptomatology was linked to the absence of this connection in the network, reflecting greater variability in disinhibition across time. Symptoms were also uniquely predicted by greater degree between internalizing and externalizing domains, potentially reflecting dynamic interpersonal processes, such as reactive aggression in response to feelings of anxiety within the disorder (Hopwood, Reference Hopwood2018). Third and similar to borderline symptomatology, narcissistic symptomatology (Fig. 2c) was uniquely predicted by degree between internalizing and externalizing domains, which may underlie fluctuations between expressions of vulnerability and grandiosity. Fourth, obsessive-compulsive symptomatology (Fig. 2d) was uniquely predicted by the presence of disinhibition and hostility auto-regressive coefficients, as well as by greater within-externalizing degree.
Covariates
As expected, there were numerous significant bivariate associations among age, average domain levels, and PD symptoms (Table 2). For the most part, when included as covariates in models of network features predicting symptomatology, however, the influence of average domain levels was reduced and not significant (Fig. 2). There were two notable exceptions, such that avoidant symptoms were significantly associated with greater average levels of negative affect in most models, and paranoid symptoms were significantly associated with greater average levels of detachment. Additionally, age was significantly negatively associated with three symptom counts: borderline, avoidant, and paranoid personality symptoms (i.e. being younger was associated with more symptoms in this sample).
Associations among personality networks and daily stress
Multilevel model results are shown in Table 3. Person-specific network features for connections within internalizing and externalizing domains predicted between-person variation in the rate of change in stress over time. Interestingly, significant interactions with day revealed opposite patterns for within-internalizing compared to -externalizing degree. Specifically, more connections within externalizing domains were related to increased stress over time, while more connections within internalizing domains were related to decreased stress over time. Inter-individual variation in connections between internalizing and externalizing domains did not account for differences in stress over time.
Multilevel model analyses for person-specific prediction of stress from within-degree network features

**p < 0.01; *p < 0.05; no adjustments for multiple tests and robust standard errors are reported for all estimates. Intercept values reflect day 1 scores. Random effects are estimated for the intercept and slope; all other parameters were fixed.
Discussion
The aim of this study was to characterize the heterogeneity in personality pathology by leveraging intensive longitudinal data consisting of about 100 daily reported detachment, negative affect, disinhibition, and hostility ratings from 91 individuals with PDs. Person-specific temporal networks captured the daily interplay among these four domains of personality pathology, and features of the networks predicted paranoid, borderline, narcissistic, and obsessive-PD symptom counts, even above average levels of the domains. Both internalizing and externalizing network features also predicted daily stress. Findings are especially noteworthy because detected associations span methods (i.e. interview and self-report; cross-sectional and intensive longitudinal) and are separated by some length of time; thus, estimates of effects are likely quite conservative. Taken together, the current study outlines an approach for quantifying the behavioral processes underlying personality pathology and has potential clinical utility.
The networks were detected with GIMME-MS, a person-specific network modeling technique that maps contemporaneous and lagged connections among domains. Although GIMME-MS can detect group-level connections, no connections common across participants were detected, likely reflecting the sample's heterogeneity (e.g. high and differential patterns of comorbidity). Thus, a unique temporal network map was estimated for each participant, and these maps generally fit each person's data well. As GIMME-MS produces sparse networks through a data-driven method, only statistically meaningful connections were included in each individual's network.
Differential prediction of network features
Although GIMME-MS has been previously applied to a subset of these data (n = 25) in order to illustrate how to map dynamic processes between internalizing and externalizing behaviors (Beltz et al., Reference Beltz, Wright, Sprague and Molenaar2016), the current study extends this work to the full sample and demonstrates how network features map on to traditional clinical data. For example, both borderline and narcissistic symptomatology were associated with a greater degree between externalizing and internalizing, such that detachment or negative affect predicted or was predicted by disinhibition or hostility. This is consistent with clinical descriptions of these disorders, noting that expressions of negative affect are strongly linked to expressions of hostility (American Psychiatric Association, 2013; Hopwood, Reference Hopwood2018). Moreover, borderline symptomatology, which is uniquely characterized by emotional dysregulation and unpredictability, was also linked to instability of disinhibition levels (i.e. absence of disinhibition auto-regressive coefficients). In contrast, paranoid symptomatology, which includes hostile aloofness and hypersensitivity to criticism and threat, was uniquely predicted by increased daily levels of detachment but lower within-internalizing degree (i.e. fewer connections between detachment and negative affect). Finally, obsessive-compulsive symptomatology, which is characterized by inflexibility, stubbornness, and reactive anger in response to loss of control or need for compromise, was associated with the presence of externalizing auto-regressive coefficients, reflecting greater stability of externalizing domains, and greater within-externalizing degree, reflecting more cross-talk between disinhibition and hostility. Thus, associations between network features from GIMME-MS models and traditional PD symptom counts were in line with clinical conceptualizations of the disorders.
Importantly, network features were predictive of personality pathology even when accounting for average daily levels of externalizing and internalizing domains, as well as age. Daily levels of some domains and age predicted some symptoms, though. Younger participants were more likely to have higher levels of avoidant, paranoid, and borderline symptoms, consistent with the age range in the sample (i.e. 19–79; M = 45.13) and evidence that PD symptomology tends to decline in middle adulthood (age 40s) (Skodol, Reference Skodol2008). Additionally, higher average levels of negative affect predicted avoidant symptoms and higher average levels of detachment predicted paranoid symptoms, consistent with the characteristics of negative emotionality and anxiety within avoidant PD and social withdrawal within paranoid PD. Thus, domain levels seemed to predict specific sets of symptoms, while network features predicted across symptom sets (e.g. degree between internalizing and externalizing was predictive of both narcissistic and borderline symptoms, perhaps revealing novel commonalities between them).
Models that included network features, average daily levels, and age predicted 9–30% of the variance in symptom counts. Network feature prediction suggests that the dynamics they reflect provide important information beyond average levels of pathology, which are typically used in clinical research and practice. Network features may therefore uniquely reflect some behavioral processes underlying clinical diagnoses of personality pathology and serve as effective targets for intervention within treatment settings. To this point, network features also predicted rates of change in daily stress, a key experience that is often assessed in clinical settings and has been shown to negatively impact both daily functioning and long-term outcomes (Lupien et al., Reference Lupien, Mcewen, Gunnar and Heim2009). It was measured, in part, using counts of daily stressful events here. Interestingly, greater cross-talk among externalizing domains predicted increases in stress, but greater cross-talk among internalizing domains predicted decreases in stress. Greater cross-talk between negative affect and detachment may result in increased isolation and withdrawal, limiting exposure to stressful events (Foster et al., Reference Foster, Hicks and Zucker2018). In contrast, greater cross-talk between hostility and impulsivity could increase the likelihood of provoking stressful events.
Taken together, we used an exploratory approach to illustrate how person-specific networks of personality that capture the dynamic interplay between domains of personality pathology can be linked to clinical data, revealing novel insights. Of note, our four-factor structure of personality was derived from between-person analyses. Although these four factors are meaningful at the within-person level (Wright et al., Reference Wright, Beltz, Gates, Molenaar and Simms2015a), in future studies, it will be important to verify this structure for each participant. Additionally, we did not have strong a priori hypotheses, and thus, do not make claims about significance in the context of null hypothesis testing. Network results do, however, seem to have important clinical implications for understanding and treating PDs, and thus warrant further hypothesis-driven examination. Further, in future work, GIMME could be used to map the interplay among clinical features (e.g. personality pathology and stress). An example application of GIMME-MS in testing personality theory hypotheses using intensive longitudinal data is provided in the online Supplementary Materials.
Conclusion
This study illustrates an under-used and novel way to collect and analyze clinically-relevant data that reflect the dimensional, dynamic, and heterogeneous nature of personality pathology, drawing from an emerging body of work on the clinical utility of such behavioral processes (Beltz et al., Reference Beltz, Wright, Sprague and Molenaar2016; Bringmann et al., Reference Bringmann, PE, Vissers, Ceulemans, Borsboom, Vanpaemel, Tuerlinckx and Kuppens2016; Fisher and Boswell, Reference Fisher and Boswell2016). Using daily assessments of internalizing and externalizing domains, we applied a temporal network mapping approach to identify unique individual-level behavioral processes. These processes were associated with both traditional diagnostic categories and aspects of daily functioning (i.e. stress). In fact, these processes predicted outcomes above and beyond daily domain levels. Findings emphasize the importance of leveraging models that capture person-specific, dynamic processes in concert with traditional approaches that rely on averages.
Supplementary material
The supplementary material for this article can be found at https://doi.org/10.1017/S0033291719002563.
Financial support
Funding for this research was provided by grants from the National Institute of Mental Health (F32 MH097325, L30 MH101760, A.W.; F31 AA023121, K.F.; R01 MH080086, L.S.). The first author is supported by a National Science Foundation Graduate Research Fellowship. The content is solely the responsibility of the authors and does not necessarily represent the official views of the funding sources.
Conflict of interest
None.