
Introduction
To reduce the dependency on natural reserved fossil fuels use and the consequences of their practices, finding alternatives to save our planet is one of the most challenging and exigent tasks to the scientific community working in the energy sciences.[Reference Porter, Wu, Quan and Fang1–Reference Rizo, Sebastian, Lazaro and Pastor3] Fuel cells (FCs) have become one of the important technologies as an alternative to fossil fuels on account of producing clean energy with least harmful emissions to the environment and keep environment friendly for all organisms with the minimization of global warming.[Reference Rizo, Sebastian, Lazaro and Pastor3–Reference Yang, Zhou, Pan, Zhou, Fu, Wai, Du, Zhu and Lin5] Direct ethanol fuel cells (DEFCs) among different types of FCs are progressively studied due to high current density and conversion efficiency at low temperature, easy availability and fast refilling, low-cost and facile storage, and non-toxicity.[Reference Yang, Zhou, Pan, Zhou, Fu, Wai, Du, Zhu and Lin5–Reference Zhang, Xu, Yan, Wang, Gu and Du8] DEFCs involve oxidation reaction at anode side of FCs requiring suitable catalysts to perform the oxidation of ethanol by complete cleavage of C–C bond in C2H5OH.[Reference Zai, Hu, Sun and Zhu7]
So far, platinum (Pt) is the best choice among catalysts for both sides of FCs, but main challenges with Pt, such as sluggish kinetics, readily poisoned at anode, high cost, and shortage, make an obstacle to the wider viability.[Reference Shen, Zhao, Xu and Li6, Reference Zhang, Xu, Yan, Wang, Gu and Du8, Reference Matin, Lee, Kim, Yoon and Kwon9] To overcome the existing problems associated with Pt, the studies have suggested the formation of alloys, core–shells, phase-segregated, and other nanostructured materials with transition metals and Pt that show an enhancement in catalytic development.[Reference Porter, Wu, Quan and Fang1, Reference Zhong, Luo, Fang, Wanjala, Njoki, Loukrakpam and Yin4, Reference Zhang, Xu, Yan, Wang, Gu and Du8, Reference Mukherjee, Bagchi, Dutta and Battacharya10–Reference Jin, Ma, Zhang, Huo and Dong14] Many researchers have reported on bi-phasic catalysts with PtZn (Zn-rich/lean-content) and Pt-other transition metals, which are called as intermetallic alloy nanoparticles (NPs)/compounds or random/disorder alloy NPs synthesized with different methods.[Reference Gregoire, Kostylev, Tague, Mutolo, van Dover, DiSalvo and Abruna15–Reference Chen, Zhang, Jia, Jiang, Xie and Zheng21] Among them, Zhu et al.[Reference Zhu, Zheng, Wang, Wu, Han, Lin, Xin and Wang16] studied on the synthesis of the series of PtZn/C (Zn-rich/lean) by the impregnation reduction at the temperature of 300–700 °C in which x-ray diffraction (XRD) patterns on PtZn/C at 1:1 and PtZn/C at (3:10) seem essentially similar with PtZn/C (1.75) at (1:2.8) and PtZn/C (0.5) at (1:2.9), respectively, and they found the ordered intermetallic/disordered alloy phases based on the fluctuation in the synthesis temperature. On the other hand, Kang et al.[Reference Kang, Pyo, Ye, Gordon and Murray19] worked on the synthesis and shape control of PtZn nanocrystals with two compositions (Pt:Zn) of 1:1 and 3:1, and found PtZn fairly alloy with only face-centered cubic structure (fcc) structure and Pt3Zn intermetallic with fcc and hexagonal close-packed (hcp) structures, and Sasaki et al.[Reference Sasaki and Maeda20] reported on Pt–Zn intermetallic compounds and Zn-rich alloys (84.4–92% Zn) synthesized by isopiestic vapor pressure in which XRD patterns on them are almost similar with our PtZn/C system. According to the Pt–Zn phase diagram,[Reference Moser22–Reference Hansen, Anderko and Saizberg25] the elements of Pt and Zn form alloys in the compositional range of ~88–90 at.% of Zn with Pt that can produce different structures at a temperature range of ~432–900 °C. Chen et al.[Reference Chen, Neyman, Gordienko and Rosch26] carried the density functional study on PdZn and PtZn alloy formation to evaluate their surface structure and stability with the lattice parameters of a = 3.92 and 3.89, a = 2.6649 and c = 4.9468 A, for Pt and Pd (fcc), and Zn (hcp) structures, respectively, and their study suggests that Pt and Zn are very miscible and form alloys in a broader range of compositions where different compositions can have different structures. However, literature studies[Reference Maya-Cornejo, Carrerra-Cerritos, Sebastian, Ledesma-Garcia, Arriaga, Arico and Baglio13, Reference Gregoire, Kostylev, Tague, Mutolo, van Dover, DiSalvo and Abruna15–Reference Hansen, Anderko and Saizberg25, Reference Hsieh, Hung, Chen and Lin27–Reference Pech-Rodriguez, Gonzalez-Quijano, Vargas-Gutierrez, Morais, Napporn and Rodriguez-Varela29] agree with the alloy formation of Pt and Zn at different conditions and temperatures with various synthetic methods for a large range of compositions. These Pt catalysts have been synthesized by numerous methods such as co-precipitation, impregnation, sputtering, colloidal, and electrodeposition protocols. Some methods require high temperature, pH adjustments, surfactant and multiple steps, and other need specific techniques to attain NP shapes and sizes when those NPs are prepared at high temperature. As a result, laboratory faces an increased disposable production cost and environmental consequences/hazards.[Reference Matin, Kumar, Bhosale, Saad, Almomani and Al-Marri30, Reference Matin, Jang and Kwon31] Moreover, the preparation of active, robust, and low-cost catalysts is among few challenges precluding ultimate commercialization of FCs.[Reference Zhong, Luo, Fang, Wanjala, Njoki, Loukrakpam and Yin4, Reference Qiao and Li32] So, a reliable method is required to decrease the production cost of electrocatalysts to play an important role in their widespread commercialization. The concept of self-propagating high-temperature synthesis (SHS) has been studied by Merzhanov in 1967 for economically synthesizing advanced functional materials via self-sustained exothermic reactions.[Reference Merzhanov33] However, SHS application in catalysis has been limited due to high temperature of synthesis process resulting in low surface area. The method is further developed by Kingsley and Patil in combination with wet chemistry resulting in the so-called solution combustion synthesis (SCS).[Reference Kingsley and Patil34] Slowly SCS has become a popular synthetic method for various nanostructured materials with applications in the electronic and magnetic, and energy conversion and storage areas.[Reference Cross, Kumar, Wolf and Mukasyan35–Reference Varma, Mukasyan, Rogachev and Manukyan41]
Previously, the synthesis of bi- (PdZn/NiAl) and multi-component-nanostructured (CuNiFe/CuFeZn) catalysts by SCS method is used for hydrogen production from reforming/decomposition/electrocatalysis of light natural gases/alcohols.[Reference Matin, Kumar, Bhosale, Saad, Almomani and Al-Marri30, Reference Cross, Kumar, Wolf and Mukasyan35, Reference Kumar, Mukasyan and Wolf36] In this work, two PtZn NP electrocatalysts of PtZn (1.75) and PtZn (0.5) are synthesized by SCS where glycine fuel is varied with a fixed ratio of Pt and Zn precursors at 1:1. PtZn NP electrocatalysts are employed for the electro-oxidation of C2H5OH. We found that PtZn electrocatalysts have shown an improved electrocatalytic activity in comparison with commercial Pt NP electrocatalyst in terms of the reduction of Pt amount in the catalysts, a decrease in C2H5OH oxidation potential, and improvement in current density as well as stability on ethanol oxidation reaction (EOR).
Experimental
Chemicals
Pt (IV) nitrate solution [Pt(NO3)2, 15%], zinc (II) nitrate hexahydrate [Zn(NO3)2 6H2O, 98%], glycine (99.7%), Nafion solution (5 wt.%), and ethanol (≥99.8%) were obtained from Sigma-Aldrich (Intertrade Technical Supplies, Qatar). Pt/C (40 wt.%), carbon black (VXC72, 179.4 m2/g), and potassium hydroxide (KOH, 85%) were acquired from FuelCellStore, Cabot Corporation, and Riedel-de Haen, respectively. Ultrapure water (Millipore, 18.2 MΩ cm) was used for the whole work. Without any further purification, all reagents were used for all experiments involved in this work.
Synthesis of Zn-enriched PtZn NPs
Pt(NO3)4 (67.88 mg/mL), Zn(NO3)2 6H2O (45.72 mg/mL), and glycine were weighed and poured into a 25 mL of de-ionized water (DIW) of a 250 mL beaker that was put on an ultrasonic vibrator until a clear homogeneous solution was made. Thereafter, the beaker is placed on a hotpot at 250 °C. The water started evaporating with time and the catalyst nanopowders were collected at the end of self-initiated (after ~30 min) combustion reactions. For uniform particle size, mortar and pestle were used followed by sieving. In this way, two catalysts were synthesized in which the starting ratios of the metal precursors of [Pt(NO3)4:Zn(NO3)2] were kept at 1:1. The glycine amount was added in the mixture by the calculation of the glycine to oxidizer ratio φ defined in the literature.[Reference Cross, Kumar, Wolf and Mukasyan35, Reference Kumar, Mukasyan and Wolf36, Reference Varma, Mukasyan, Rogachev and Manukyan41] The reactants ratio in the two samples [Pt(NO3)4:Zn(NO3)2:glycine (φ)] were 1:1:1.75 for PtZn (1.75) and 1:1:0.5 for PtZn (0.5), respectively. A 100 mg mixture of 40% of synthesized catalyst power and 60% of carbon support was prepared in a 7 mL DIW of a 50 mL beaker and then the mixture was heated at 125 °C until the evaporation of the water is completed. After the addition of catalyst materials on carbon support, these two electrocatalysts (PtZn) are named as PtZn/C (0.5) for fuel-lean (0.5) and PtZn/C (1.75) for fuel-rich (1.75), respectively.
Formation of PtZn NPs with SCS
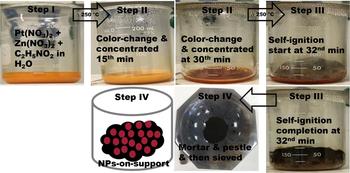
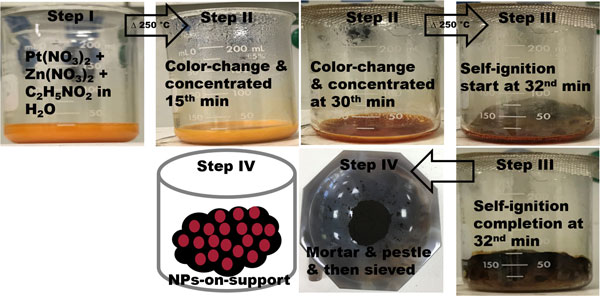
Figure 1 depicts a schematic diagram of the SCS techniques at the time of the experiment for the synthesis of PtZn/C (1.75). In step I, we can see a homogeneous solution made of two starting materials (Pt and Zn precursors) and glycine fuel in H2O. The beaker was placed on a hotpot where temperature was maintained at ~250 °C. After ~15 min, changes in the solution color observed at the step II indicates the redox reaction taking place of the changes in oxidation state of the metal ions into metallic forms. In step III, the nanopowder of catalysts was obtained after self-ignition occurs in an open-air atmospheric condition upon the concentration of the color-changed solution with time. A considerable amount of exothermic energy is produced once self-ignition takes place leading to combustion reaction. The steps from I to III takes ~32 min. For EOR, a physical mixture of NPs and carbon (as support) is made in the step IV.
A schematic diagram of SCS technique.

Characterization techniques
XRD data were recorded with a mini desktop diffractometer [Rigaku MiniFlexII, Cu Kα radiation (λ = 1.54056 Å)]. For the morphologic analysis on the samples with a transmission electron microscopy (TEM; using FEI F20 TEM, TECNAI G2), a homogeneous dispersion of PtZn/C NPs was made ultrasonically in an ethanol solution and then NP dispersed solution was deposited dropwise on a carbon-coated Cu grid that was dried under ambient conditions. High-angle annular dark field (HAADF)–scanning transmission electron microscopy (STEM, FEI F200X) attached to the energy-dispersive x-ray spectroscopy (EDS system, FEI SuperX) was used to obtain elemental distribution in NPs. The elemental composition analysis and morphologic studies of the NPs in the samples were conducted by an EDS coupled to a field-emission scanning electron microscopy (SEM, Nova Nano 450, FEI). X-ray photoelectron spectroscopy (XPS; using Kratos AXIS Ultra DLD XPS) was conducted to obtain the oxidation states of elements in the samples, and the reported binding energies (BEs) from XPS are calibrated values with respect to C 1s at 284.8 eV.
Electrode preparation
A 15 mg of the catalyst sample was dispersed ultrasonically in 5 g of DIW that was used as an ink for electrode preparation. A 20 µL of the catalyst ink was deposited on a glassy carbon-rotating disc electrode (PINE Research Instruments, RDE, d = 5.0 mm and geometric area, A = 0.196 cm2) with the help of a calibrated micro-pipette and dried under an ambient condition. Afterwards, a 20 µL of 0.1 wt% Nafion solution was dropped on the top of RDE to prevent falling of electrode materials from RDE surface.
Measurements of electrochemical properties
The electrochemical activities were evaluated using a standard three-electrode electrochemical cell [Pine instruments biopotentiostat (WaveDriver 20)] with a glassy carbon RDE with the deposited catalyst as a working electrode, a reference electrode [Hg/Hg2SO4 in K2SO4 (4 M)], and a Pt-coil counter electrode in all the electrochemical measurements. The working electrode was electrochemically pre-treated with a scan rate of 500 mV/s for 50 cycles in the potential range from 0.1 to −0.6 V prior to each measurement. The cyclic voltammograms (CVs) measurements were performed in an aqueous solution of 1 M KOH using a potential range from −1.2 to 0.2 V and a scan rate of 50 mV/s under a N2-purged ambient. The electrocatalytic activities for EOR were measured by CVs in a 1 M KOH containing 2 M C2H5OH at a scan rate of 50 mV/s in the potential range from −0.9 to 0.9 V. The stability test was performed by chronoamperometry at 0.2 V in the same electrolyte with RDE (rotation speed = 350 rpm) under an N2 ambient for 2 h.
All of the electrochemical measurements were carried out under an ambient pressure at room temperature using fresh electrolytes bubbled by N2 purging for 45 min. The current densities are further normalized before reporting, with respect to the electrode geometric surface area (RDE). Pt amount, total metal, and electrochemical surface areas (ECSAs) by CVs on each sample were used to normalize the currents obtained from CVs on EOR and the potentiostatic current densities were normalized by only Pt amount in the samples, respectively.
Results and discussion
Compositional and structural analyses
We synthesized Zn-enriched PtZn NPs using SCS method in the reaction precursors of Pt(NO3)4 solution, Zn(NO3)2 6H2O, and glycine in H2O where glycine functions as a fuel. We have compared the physiochemical and electrochemical properties of synthesized PtZn/C with Pt/C, and with the same method, we also synthesized Zn NPs in which the ratio of Zn precursor and glycine was 1:1.75 for making comparison with the XRD patterns of Zn in PtZn/C.
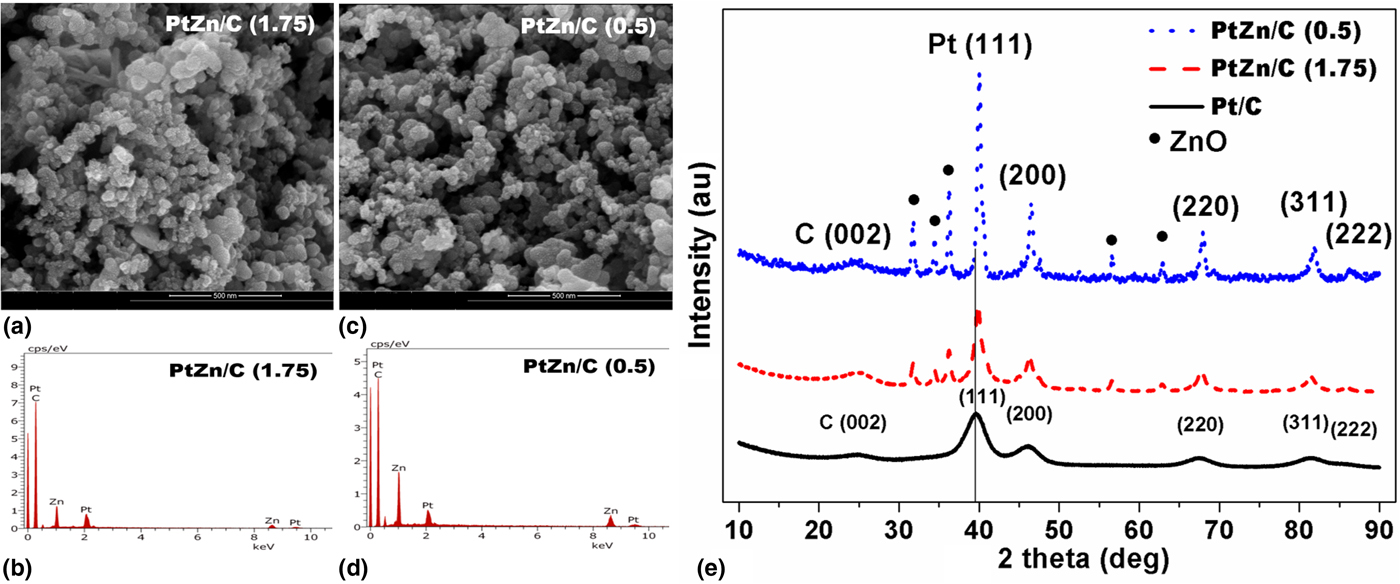
To obtain the elemental composition in PtZn/C samples supported on carbon, SEM analysis was carried out. The elemental composition on PtZn/C was measured for three times at different regions and then averaged data were numerated in Table S1. An image and its spectrum from each are shown in Figs. 2(a)–2(d). The reaction yield calculated by SEM analysis was almost quantitative (75.6–80.97) based on the total weight of Pt and Zn (Table S1) and the atomic ratios (in %) of Pt and Zn in the samples were 25.6:74.4 (PtZn2.9) for PtZn/C (0.5) and 26:3:73.7 (PtZn2.8) for PtZn/C (1.75), respectively. SEM analysis suggests that PtZn/C samples were Zn-enriched in both PtZn/C samples, and the conversion of Pt precursors into metallic Pt in PtZn/C (1.75) is slightly higher than that of PtZn/C (0.5) which is dependent on the fuel amount used during the synthesis, playing a key role in the dispersion of Zn-rich/-lean content in the samples.
SEM images on (a) PtZn/C (1.75) and (c) PtZn/C (0.5), and spectra of (b) PtZn/C (1.75) and (d) PtZn/C (0.5) for the compositional analysis, and (e) XRD patterns on Pt/C, PtZn/C (1.75), and PtZn/C (0.5).
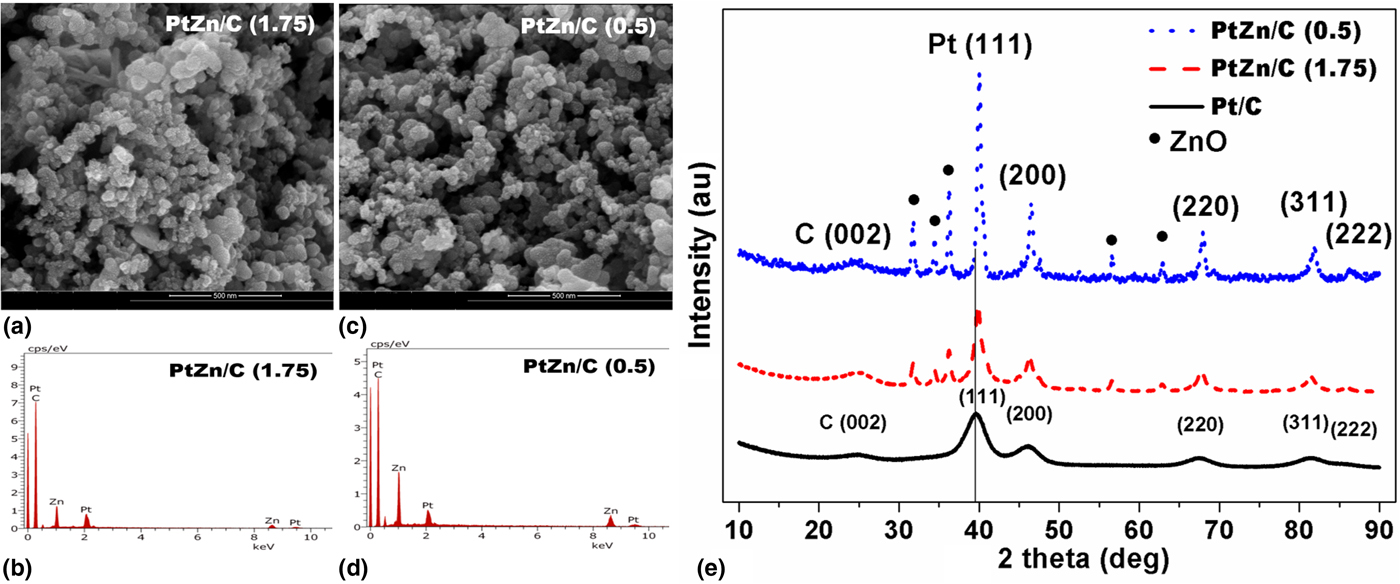
Figure 2(e) compares XRD patterns among Pt/C and PtZn/C samples. The peak positions at 2θ of 39.68°, 46.13°, 67.59°, 81.22°, and 86.3° are attributed to the planes of (111), (200), (220), (311), and (222) on Pt/C of the fcc, respectively. The peak position at 2θ of ~24.5–25° belongs to the plane of C (002) for all samples. Pt XRD patterns on PtZn/C show similar characteristic patterns with each other of PtZn/C and Pt/C, but the peak positions for Pt on PtZn/C samples are more positively shifted by 0.315° in comparison with Pt/C. Other identifiable peaks are at 2θ of 31.9°, 34.46°, 36.3°, 56.8°, and 62.9° for the planes of (100), (002), (101), (110), and (103) of Zn species in PtZn/C samples, respectively. These XRD patterns match with the planes of ZnO (Fig. S1) synthesized in the same method as for PtZn/C samples and agree with the literature.[Reference Matin, Kumar, Bhosale, Saad, Almomani and Al-Marri30, Reference Zak, Majid, Abrishami and Yousefi42] The positive shift of XRD patterns suggests an incorporation of Zn into Pt lattice to form an alloy, agreeing with the reports on Pt alloyed with Zn and other transition metals.[Reference Maya-Cornejo, Carrerra-Cerritos, Sebastian, Ledesma-Garcia, Arriaga, Arico and Baglio13, Reference Hsieh, Hung, Chen and Lin27–Reference Pech-Rodriguez, Gonzalez-Quijano, Vargas-Gutierrez, Morais, Napporn and Rodriguez-Varela29] As discussed earlier, based on the literature and phase diagram,[Reference Maya-Cornejo, Carrerra-Cerritos, Sebastian, Ledesma-Garcia, Arriaga, Arico and Baglio13, Reference Gregoire, Kostylev, Tague, Mutolo, van Dover, DiSalvo and Abruna15–Reference Hansen, Anderko and Saizberg25, Reference Hsieh, Hung, Chen and Lin27–Reference Pech-Rodriguez, Gonzalez-Quijano, Vargas-Gutierrez, Morais, Napporn and Rodriguez-Varela29] the elements of Pt and Zn can form an alloy by various methods where the wider composition and temperature are in line with our composition (73.7–74.4 at.% of Zn in PtZn/C) and the temperature is risen to ~600 °C during the synthesis of PtZn samples in an open-air atmospheric condition. We believe that the presence of other crystalline phases assigned to Zn-oxide phase in XRD observation is dependent on an orderly alloy formation and the Zn content in the samples. We have calculated crystallite sizes of the PtZn/C samples along with Pt/C at the plane of (111) using Schererr's equation[Reference Pech-Rodriguez, Gonzalez-Quijano, Vargas-Gutierrez, Morais, Napporn and Rodriguez-Varela29] (Table S1). The trend of crystallite sizes is PtZn/C (0.5) > PtZn/C (1.75) > Pt/C. It would be noted that the fuel amount has affected particle size among PtZn/C samples.
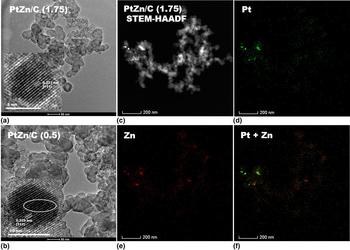
TEM images of PtZn/C samples are shown in Figs. 3(a) and 3(b). PtZn NPs are well distributed on the carbon but PtZn (0.5) NPs are more agglomerated than PtZn/C (1.75) on the carbon support. Less agglomeration in PtZn/C (1.75) NPs is possibly due to high fuel amount in the synthesis as it has been observed in other cases as well.[Reference Matin, Kumar, Bhosale, Saad, Almomani and Al-Marri30] Agglomeration belongs to one of inherent properties of NPs prepared by the SCS technique. High-resolution TEM (HRTEM) images [inset in Figs. 3(a) and 3(b)] show PtZn NPs that are highly crystalline on both compositions and particle shapes seem truncated octahedra at the plane of (111) Pt lattice. In case of PtZn/C (0.5) NPs, the stacking fault marked by circle in the inset is seen in the sequence of fcc structure. No such stacking fault in the sequence is prominently observed in HRTEM image of PtZn/C (1.75) NP. HRTEM images on PtZn/C NPs show no intermetallic evidence which can match with those reports in the literature.[Reference Qi, Xiao, Liu, Goh, Zhou, Maligal-Ganesh, Pei, Li, Curtiss and Huang18, Reference Chen, Zhang, Jia, Jiang, Xie and Zheng21] Based on HRTEM images, alloy formation is more orderly arranged with elements for PtZn NPs (1.75) than that in PtZn NPs (0.5) due to the variation of fuel amount in PtZn/C system. We have chosen PtZn/C (1.75) NPs of PtZn/C system in which STEM–HAADF coupled to EDS was conducted to investigate the elemental distribution throughout aggregated NPs [Figs. 3(c)–3(f) and clear observation in Fig. S2]. As observed in Fig. 3(f), mostly Pt signals matching with Zn signals indicate that PtZn NPs are alloyed. Some Pt signals are scattered from the carbon support where signals of ZnO are abundant in Fig. S2(g). It seems that Pt atoms are supported on ZnO or alloyed with them. Overall observation on elemental maps also advises that PtZn NPs are not only supported on carbon but also some of PtZn or Pt NPs may be supported on ZnO or alloyed with them.
TEM images on (a) PtZn/C (1.75) and (b) PtZn/C (0.5); insets are HRTEM images, and STEM–HAADF image on (c) PtZn/C (1.75) and STEM–EDS maps on the elements of (d) Pt, (e) Zn, and (f) Pt + Zn (clear observation in Fig. S2).

Electronic state in elements
XPS spectra of PtZn/C along with Pt/C samples are depicted in Fig. 4 (numerical values in Table S2). XPS spectra on Pt/C appears at BEs of 71.23 and 74.58 eV for Pt° 4f 7/2 and 4f 5/2, respectively, which is in accordance with Refs.[Reference Zai, Hu, Sun and Zhu7–Reference Matin, Lee, Kim, Yoon and Kwon9, Reference Maya-Cornejo, Carrerra-Cerritos, Sebastian, Ledesma-Garcia, Arriaga, Arico and Baglio13, Reference Kim, Matin and Kwon43] No other peaks are observed on Pt/C because of freshly purchased Pt/C. In case of PtZn/C samples, these peaks are shifted to negative BEs by 0.11–0.18 eV in comparison with Pt/C. This is due to the charge transfer (ligand effect) from Zn to Pt [electronegativity factors of Pt (2.3) and Zn (1.6)], agreeing with other works in the literature.[Reference Zhang, Xu, Yan, Wang, Gu and Du8, Reference Zhu, Zheng, Wang, Wu, Han, Lin, Xin and Wang16, Reference Matin, Kumar, Bhosale, Saad, Almomani and Al-Marri30, Reference Matin, Jang and Kwon31] Other peaks are seen on Pt species in PtZn/C samples at 72.18 and 76.73 eV BEs for Pt (II) and Pt(IV) species in PtZn/C (1.75), and 72.25, 75.67, and 79.09 eV BEs in PtZn/C (0.5) for Pt (II) and Pt(IV) species, respectively, in correlation with the reports.[Reference Rizo, Sebastian, Lazaro and Pastor3, Reference Zhang, Xu, Yan, Wang, Gu and Du8, Reference Maya-Cornejo, Carrerra-Cerritos, Sebastian, Ledesma-Garcia, Arriaga, Arico and Baglio13, Reference Kim, Matin and Kwon43] There are no separated peaks for Zn° (at 1021.7 eV) in PtZn/C samples but Zn species in PtZn/C samples are detected and the peak positions for Zn species at 1022.04 and 1045.17 eV for PtZn/C (1.75) and 1021.95 and 1045.05 eV for PtZn/C (0.5) are ascribed to ZnO, respectively, which are in those works of the literature.[Reference Gregoire, Kostylev, Tague, Mutolo, van Dover, DiSalvo and Abruna15, Reference Biesinger, Lau, Gerson and Smart44] In addition, one can expect that the formation of orderly NPs with Pt and Zn can give rise to different electronic interaction from that of disorderly NPs [inset in Figs. 3(a) and (b)]. However, the nature of samples and the magnitude of charge transfer can affect the BEs of Pt and Zn species in PtZn/C samples. Since charge transfer is evidenced by XPS data of Pt in the PtZn/C system, it can shift Pt d-band center down based on the d-band model theory studied by Hammer and Norskov.[Reference Hammer and Norskov45] This can induce Pt-adsorbate interaction that may weaken the physio-chemisorption of intermediate species produced during the electrocatalysis of small organic molecules on catalyst surfaces. Independently, two reports[Reference Kibler, El-Aziz, Hoyer and Kolb46, Reference Zhang, Ge, Ma, Liao, Lu and Xing47] show that a down-shift of the d-band center can enhance the electrocatalysis of small organic molecules.
XPS spectra of Pt 4f in (a) Pt/C, (b) PtZn/C (1.75), and (c) PtZn/C (0.5), and Zn species in (d) PtZn/C (1.75) and PtZn/C (0.5).

Electrocatalytic properties
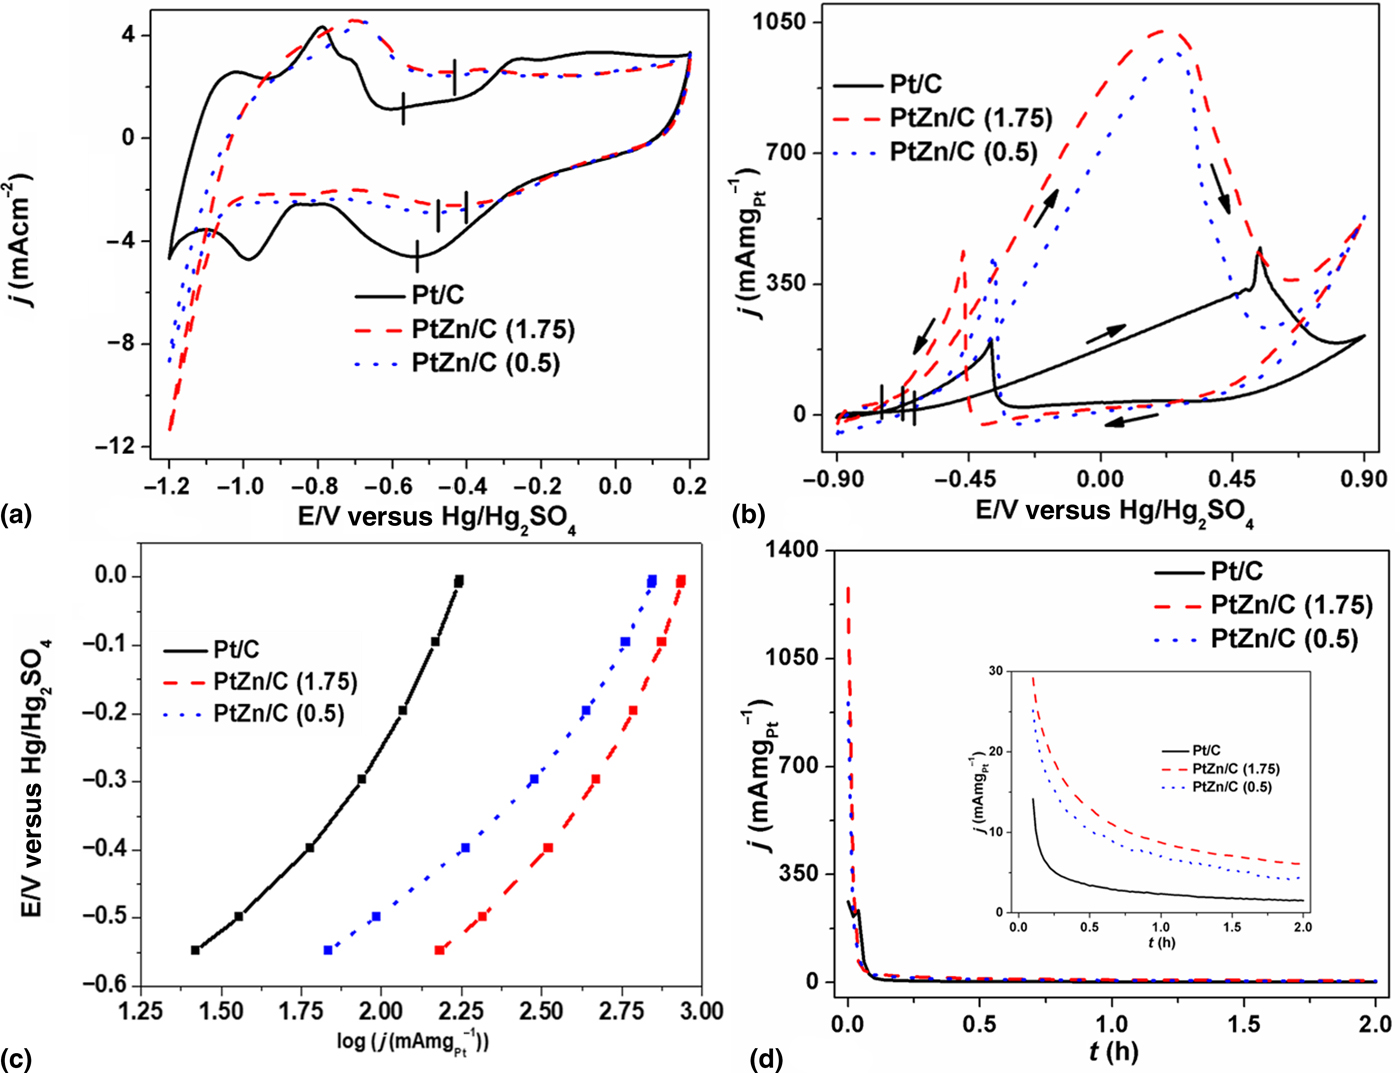
Figure 5(a) demonstrates CV curves on PtZn/C along with Pt/C electrocatalysts. As observed in Fig. 5(a), CVs of PtZn/C and Pt/C show a typical characteristic response of electrocatalysts containing Pt.[Reference Yang, Zhou, Pan, Zhou, Fu, Wai, Du, Zhu and Lin5, Reference Zhang, Xu, Yan, Wang, Gu and Du8, Reference Mukherjee, Bagchi, Dutta and Battacharya10, Reference Switzer, Olson, Datye, Atanassov, Hibbs and Cornelius11, Reference Pech-Rodriguez, Gonzalez-Quijano, Vargas-Gutierrez, Morais, Napporn and Rodriguez-Varela29] CV peaks on PtZn/C are directed positively by the potentials 84 and 118 mV for the desorption, and 180 and 94 mV for oxide formation at the anodic sweeps, and 84 and 98 mV for decomposition at cathodic sweeps on both PtZn/C (1.75) and PtZn/C (0.5), respectively, in comparison with Pt/C. CV peaks on Pt/C are well defined compared with PtZn/C, suggesting the incorporation of Zn into Pt lattice, and hydrogendesorption and oxide formation/decomposition among PtZn/C electrocatalysts may vary with different phases/degrees of alloying in electrocatalysts. Positive onset potentials for oxide formation/decomposition of PtZn/C prevent the chemisorption of hydroxyl/oxygenated species on the catalyst surface, which is correlated to the down-shift of Pt d-band center. The adsorbed hydroxyl/oxygenated species on catalyst surface blocks the active site, thus impeding the oxidation of small organic molecules such as ethanol, methanol, and formic acid. This study agrees with the reports.[Reference Matin, Kumar, Bhosale, Saad, Almomani and Al-Marri30, Reference Matin, Jang and Kwon31, Reference Zhang, Ge, Ma, Liao, Lu and Xing47, Reference Zhang, Wan, Ma, Chen, Zhou, Tang and Lu48] The formation of hydroxyl/oxygenated species is suppressed on PtZn/C surface observed in CVs. Hence, it can contribute in enhancing the electrocatalysis of C2H5OH. ECSAs calculated using hydrogen desorption regions of each electrocatalyst are numerated in Table S1. The trend of ECSAs [Pt/C (13.505 cm2) > PtZn/C (1.75) (8.228 cm2) > PtZn/C (0.5) (6.438 cm2)] follows crystallite sizes calculated from the XRD data.
CV curves on (a) Pt/C, PtZn/C (1.75), and PtZn/C (0.5) measured in an electrolyte of 1 M KOH at 50 mV/s, (b) EOR on Pt/C, PtZn/C (1.75), and PtZn/C (0.5) measured in an electrolyte of 1 M KOH containing 2 M C2H5OH at 50 mV/s in an N2 environment, (c) Tafel curves on EOR and (d) chronoamperometric curves on Pt/C, PtZn/C (1.75), and PtZn/C (0.5) measured in an electrolyte of 1 M KOH containing 2 M C2H5OH at the applied potential of 0.2 V in an N2 environment. Inset is the magnified view on a period of 0.08–2 h.
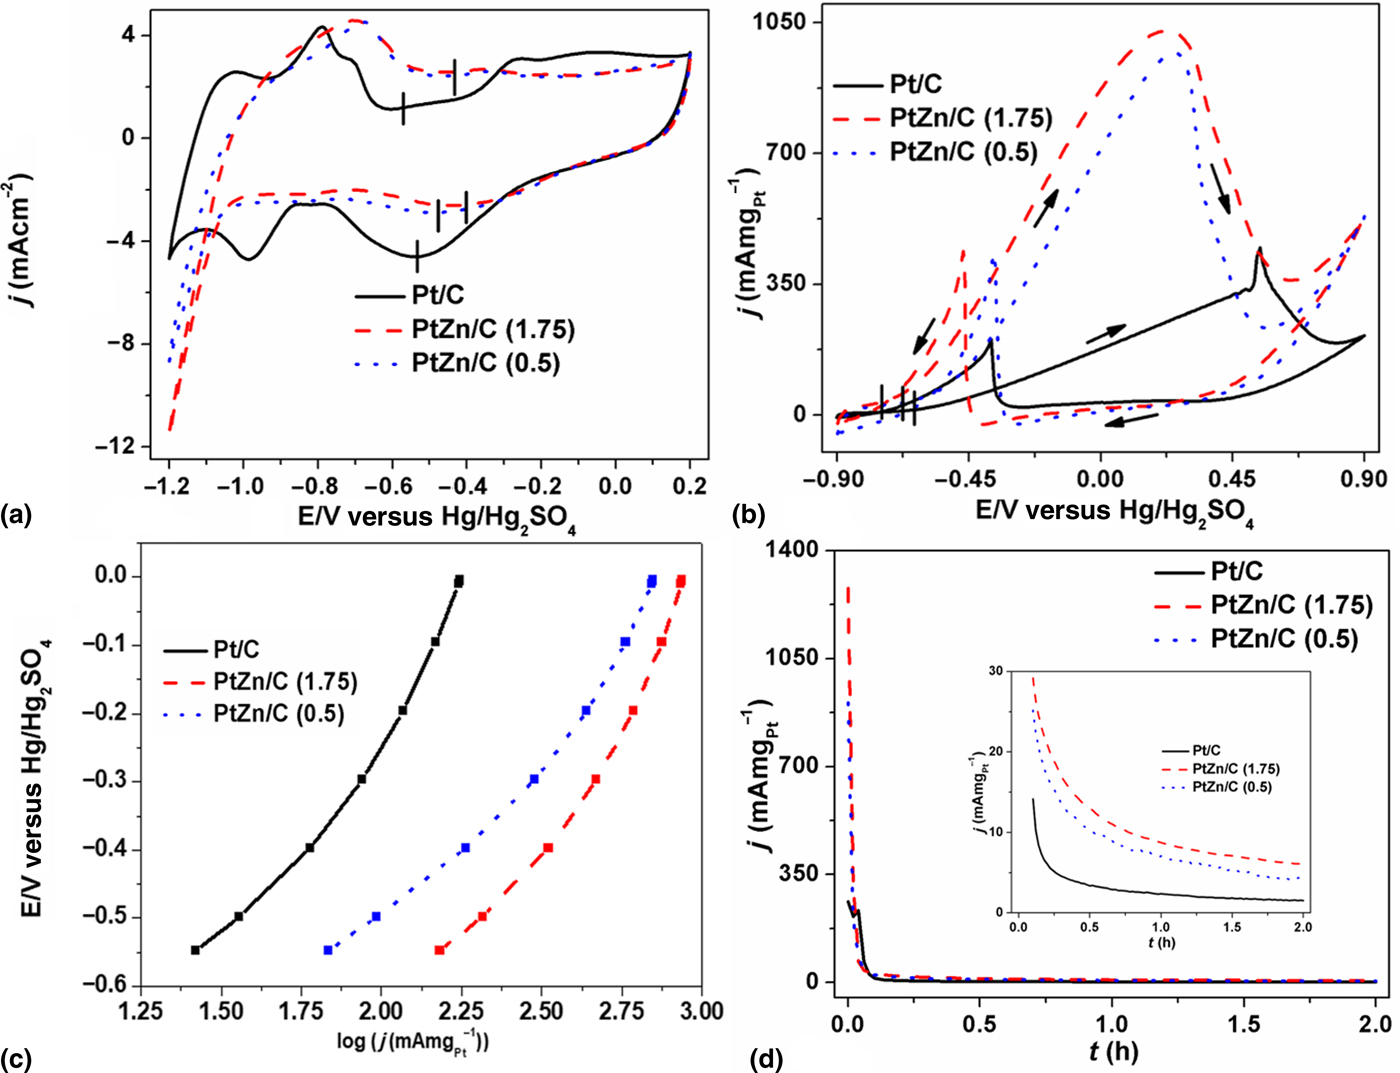
To test the electrochemical activity of PtZn/C and Pt/C on EOR, CVs were recorded in an electrolyte of 1 M KOH containing 2 M C2H5OH at a scan rate of 50 mV/s in an N2 environment. As seen in Fig. 5(b), the onset potentials of EOR on PtZn/C (0.5) and Pt/C commence at the potentials ~−0.671 and ~−0.632 V, whereas that on PtZn/C (1.75) at −0.747 V is more negatively shifted by 76 and 115 mV on PtZn/C (0.5) and Pt/C, respectively. Clearly it means that PtZn/C system is highly active for C2H5OH oxidation than Pt/C via the complete cleavage of C–C bond in C2H5OH. The calculated ratios of forward (I f) and backward (I b) currents are ~2.4 on PtZn/C (1.75), ~2.3 on PtZn/C (0.5), and ~2.2 on Pt/C, respectively. In general, this ratio of I f and I b can evaluate the tolerance of the catalyst against poisoning by intermediate species and the backward current is ascribed to these species produced during the oxidation of small molecules.[Reference Qi, Xiao, Liu, Goh, Zhou, Maligal-Ganesh, Pei, Li, Curtiss and Huang18] PtZn/C are less susceptible to intermediates. The reaction kinetics of PtZn/C for the ethanol oxidation [Fig. 5(c)] is largely improved in comparison with Pt/C. Based on the kinetic studies in the literature,[Reference Wang, Markovic and Adzic49, Reference Wang, Zhang and Adzic50] the dissociation of oxygenated species such as O and OH are the rate-limiting steps for the redox reaction of small molecules. If NPs are less oxophilic, one can expect that those NPs can dispose of the rate-limiting species more easily on their surface, thus regenerating the catalyst surface faster. Oxide formation/decomposition peaks discerned in CVs on PtZn/C at higher potentials over the Pt/C indicate that PtZn/C NPs are less oxophilic in nature than Pt/C. This could arise in more active sites being available for further adsorption of C2H5OH on bimetallic NP surfaces. The down-shift of Pt d-band center in XPS analysis infers that intermediates produced in EOR are less chemisorbed on catalyst surface. Carbon monoxide (CO) is one of the major issues formed during the oxidation of small organic molecules, which poisons the catalysts readily by a strong bond between CO and active metal, thus leading to an increased coverage of the catalyst surface. Therefore, the number of active sites is reduced for C2H5OH adsorption. According to Igarashi et al.,[Reference Igarashi, Fujino, Zhu, Uchida and Watanabe51] a down-shift of Pt d-band center would precede to a smaller back-donation of the Pt 5d electrons to 2π* CO orbital, which decreases the chemisorption of CO (CO–Pt bonding). This results in a decrease of CO coverage and an increase in CO-free sites that are available for further C2H5OH adsorption. Furthermore, transition metals, themselves, are oxophilic in nature and they are reported to facilitate the release of the reaction intermediates based on their mechanism.[Reference Yang, Zhou, Pan, Zhou, Fu, Wai, Du, Zhu and Lin5, Reference Zai, Hu, Sun and Zhu7–Reference Mukherjee, Bagchi, Dutta and Battacharya10, Reference Feng, Bin, Yan, Du, Majima and Zhou52] This is how the kinetics is enhanced in the electrocatalysis of C2H5OH on PtZn/C over the Pt/C.
The current densities (Table S1) are normalized by the Pt amount used in each electrocatalyst of the EOR activity. The electrocatalytic activity on PtZn/C shows an improved performance by a factor of ~2.3 for PtZn/C (1.75) (1029.71 mA/mg at 0.223 V) and ~2.2 for PtZn/C (0.5) (968.97 mA/mg at 0.259 V) in comparison with Pt/C (448.64 mA/mg at 0.543 V) at the forward peak potential. The electrocatalytic activity on PtZn/C system is better than many reports[Reference Zai, Hu, Sun and Zhu7, Reference Switzer, Olson, Datye, Atanassov, Hibbs and Cornelius11, Reference Maya-Cornejo, Carrerra-Cerritos, Sebastian, Ledesma-Garcia, Arriaga, Arico and Baglio13, Reference Jin, Ma, Zhang, Huo and Dong14] in alkaline and acidic media where their electrocatalysts contain high amount of Pt. This is a noticeable step achieved in this work for the application of DEFCs by considering the reduction (~4 times) of Pt amount in the catalyst and the decrease in the higher potential for EOR, and the current density over the Pt/C. Other normalization factors are prevalent in calculating current density such as geometric surface area of the electrode, ECSAs from CVs, and total metal in catalyst by which the obtained current densities are shown in Fig. S3. Each factor affects the order on the current density normalized by other factors among electrocatalysts. However, our experimental results are highly promising because Pt high cost is one of the bottlenecks encumbering the widespread application of the FCs.
One of the substantial factors for the implementation of FCs is the stability of the catalysts in electrochemical environment. The stability tests on all electrocatalysts were measured by chronoamperometry in an electrolyte of 1 M KOH containing 2 M C2H5OH for a period of 2 h in an N2 environment. Chronoamperometric curves in Fig. 5(d) demonstrate that EOR begins at higher current density on PtZn/C than Pt/C electrocatalysts. The potentiostatic current density decays rapidly and becomes the smallest in 0.08 h. This rapid decay in chronoamperometric curves at the very beginning could be due to the adsorption of the intermediates generated during C2H5OH oxidation, other hydrogen and oxygen species released from the electrolyte, or possible dissolution/leaching of some Zn and bilayer discharge. These phenomena are found in numerous reports in which the oxidation of the small organic molecules is studied in acidic as well as alkaline media.[Reference Rizo, Sebastian, Lazaro and Pastor3, Reference Yang, Zhou, Pan, Zhou, Fu, Wai, Du, Zhu and Lin5, Reference Zhang, Xu, Yan, Wang, Gu and Du8–Reference Mukherjee, Bagchi, Dutta and Battacharya10, Reference Jin, Ma, Zhang, Huo and Dong14, Reference Zhu, Zheng, Wang, Wu, Han, Lin, Xin and Wang16, Reference Qi, Xiao, Liu, Goh, Zhou, Maligal-Ganesh, Pei, Li, Curtiss and Huang18, Reference Kang, Pyo, Ye, Gordon and Murray19, Reference Feng, Bin, Yan, Du, Majima and Zhou52, Reference Chen, Cai, Chen and Oyama53] After 0.08 h, the decay in the current density decreases monotonously with time, indicating that Zn element is going to leach out of alloying with Pt or the dissolution to electrolyte. As a consequence, Pt-active sites occupied with Zn elements are exposed to contact with the electrolyte solution containing C2H5OH and intermediate species produced in the intervening time. After 1.5 h, it seems that Pt/C is going to be stable earlier than PtZn/C in the electrochemical environment. However, the stability trend among electrocatalysts is observed in the order of PtZn/C (1.75) > PtZn/C (0.5) > Pt/C in 2 h, which follows the trend for EOR seen in CVs where the amount of Pt is used as a normalization factor.
Conclusions
We have successfully synthesized Zn-enriched PtZn NPs supported on the carbon by the SCS technique for EOR. NP electrocatalysts are characterized with XRD, TEM, and SEM for the crystallite size, particle distribution, and composition, respectively. The elemental distribution maps obtained by STEM–EDS show that mostly NPs are composed of Pt and Zn elements in random alloy state. The electronic structure analyzed by XPS shows that the ligand effect is dominant in the samples that confirm the down-shift of Pt d-band center. PtZn NPs are applied for the electro-oxidation of C2H5OH, and their electrochemical results show better electrocatalytic activity than Pt/C in terms of current density, onset potential of EOR, Pt amount used in the catalyst, and stability. We found that the variation of fuel amount in the synthesis affect particle size, electronic structure, and electrochemical properties in the samples. Our experimental results have made the significant step ahead in DEFCs applications.
Supplementary material
The supplementary material for this article can be found at https://doi.org/10.1557/mrc.2018.62
Acknowledgments
This publication was made possible by NPRP grant (NPRP8-509-2-209) from the Qatar National Research Fund (a member of Qatar Foundation). The statements made herein are solely the responsibility of the author(s). The authors also gratefully acknowledge the Gas Processing Centre (GPC) and the Central Laboratory Unit (CLU) at the Qatar University and the Qatar Environment and Energy Research Institute (QEERI) at the Qatar Foundation for services related to XPS, TEM, and STEM–HAADF–EDS analyses, respectively.