Introduction
Clay minerals and organic matter are among the most reactive components of sediments during burial diagenesis. Identification of exchange processes that involve light elements such as hydrogen, lithium, boron, and oxygen, therefore, has interesting potentials for tracing their interactions during burial-induced organic maturation and associated clay-material alteration. As temperature inceases with burial, the magnitude of the isotopic fractionation and exchange of light elements between pore fluids and minerals or organic matter induces concomitant decreasing isotope compositions of the authigenic illite-smectite mixed layers for an assumed constant fluid composition.
Theoretically, composition changes of interstitial fluids or of fluids driven by local thermal events can also modify the fluid isotopic compositions, as the isotopic fractionation between fluid and mineral/organic rock components remains constant at a given temperature. Thus, no isotopic trend implies either constant temperatures or no isotopic exchanges between solid and liquid phases. Apart from consideration of an equilibrated stable isotope partitioning in mineral–water systems, more attention has been focused on rates of isotope exchange over long periods of time at low temperature (e.g. Savin & Lee, Reference Savin and Lee1988; Kyser & Kerrich, Reference Kyser and Kerrich1991) rather than on very short time periods, as in the pyrolysis experiments. Even if the practical reasons for this are understandable (e.g. O’Neil & Kharaka, Reference O'Neil and Kharaka1976; Bird & Chivas, Reference Bird and Chivas1988), a reasonable expectation is that some oxygen and an extensive hydrogen isotope exchange occurs between fluids and smectite and other <2 μm components, under the conditions of the pyrolysis experiments at temperatures approaching 300°C and above.
Although natural mineral–organic systems are not strictly reproduced by hydrous-pyrolysis experiments, the interest in studying such experimental processes is mainly in reconstructing interactive reactions, even if incomplete (e.g. Clauer et al., Reference Clauer, Lewan, Dolan, Chaudhuri and Curtis2014; Lewan et al., Reference Lewan, Dolan and Curtis2014). Hydrocarbons that are expelled from source rocks during natural reactions driven by temperature increase are expected to have interactions with the associated minerals, especially the very reactive clay crystals that are far from being well understood. An intuitively important concept is that, as the oil expelled during hydrous pyrolysis is compositionally similar to natural crude oil expelled from source rocks into the interstitial water of the adjacent pore space (Lewan et al., Reference Lewan, Winters and McDonald1979), this aspect potentially can be traced by documenting the isotopic partitioning of light elements occurring in both the organic and mineral components of hydrocarbon-bearing sedimentary rocks. Furthermore, because K-carrying clay minerals of illite-smectite types are known to crystallize and interact with crude oils of reservoirs, it becomes essential to know if such isotopically datable clay material crystallized before, during, or after crude-oil expulsion, allowing, in turn, the precise dating of the respective processes. Because the evolution of that crude oil is heavily dependent on the interactions with its clay material, precise evaluation of such interactions is required, e.g. through the study of light elements occurring in both the organic and naturally associated minerals.
Oil generation resulting from a thermal stress has been shown (Hunt, Reference Hunt1996) to convert kerogen into bitumen that breaks down further into oil. The catagenetic conversion of kerogen as a poly-condensed structure can, then, be considered to represent the onset of the petroleum generation (Tissot & Welte, Reference Tissot and Welte1984). The objectives of the presently study were to analyze hydrogen, lithium, boron, and oxygen isotope compositions in such an oil-generation context by studying these light elements of smectite-rich clay material subjected to pyrolysis, and to decrypt the rare-earth elemental repartition in a whole rock and its <2 μm clay-rich fraction that consists mainly of organic-inorganic materials mixed intimately. The hypothesis tested was that hydrous-pyrolysis experiments of various size fractions of illite-smectite mixed-layers would cause isotopic changes in these minerals potentially recording the changing fluid chemistry as a function of temperature. The crystal chemical changes may then reflect the concomitant organic maturation accompanied by corresponding cation exchange with the organic-related fluids.
Materials and Methods
The reference sample N1 used for the pyrolysis experiments was collected at an outcrop known as Skunk Hollow, which is located north of Coalinga in California, on the western border of the San Joaquin Basin (Fig. 1). Taken below a discolored saprolite horizon (Lewan, Reference Lewan1980), it belongs to the outcropping Eocene Kreyenhagen Shale, an oil-prone source rock of the San Joaquin Basin (Peters et al., Reference Peters, Pytte, Elam and Sundaraman1994; Lillis & Magoon, Reference Lillis, Magoon and Sheirer2007). The unweathered character of the material collected was confirmed petrographically by the presence of well-developed pristine pyrite (Lewan, Reference Lewan1980). In fact, the impact of continental weathering on the sample is difficult to evaluate, one hypothesis being that the climate was permanently about that occurring present, but it could also have changed with respect to the covering saprolite layer. In turn, as the sample collected was subjected to pyrolysis, this alteration step was ignored because its impact, especially on the organics, had to be very limited due to the low-temperature atmospheric environment. This view implies that the data generated have to be considered as present-day information. Furthermore, the mineral assemblage examined yielded a total organic content (TOC) of 9.4 wt.% with a Rock-Eval hydrogen index (HI) of 258 mg/g TOC at a maximum temperature (T max) of 407°C. The atomic hydrogen/carbon (H/C) ratio of 1.13 and the oxygen/carbon (O/C) ratio of 0.22 for the isolated kerogen indicate that it is a thermally immature Type-II kerogen. The sample was crushed to gravel-sized chips (0.5–2.0 cm) that were mixed thoroughly to ensure the best homogeneity, from which the whole-rock aliquots were taken for the aqueous-pyrolysis experiments.
Sketch of the San Joaquin Basin, south of San Francisco, California, USA (modified after Peters et al., Reference Peters, Magoon, Valin, Lillis and Scheirer2007) and location of the Kreyenhagen Shale sample collected at the Skunk Hollow Outcrop and identified as N1 in the sketch

Hydrous-pyrolysis Experiments
Aqueous (hydrous) pyrolysis was conducted in accordance with the Lewan (Reference Lewan, Engle and Macko1993) procedure for which several aliquots of the crushed outcrop whole rock were heated in the presence of liquid water. Each experiment involved 377 g of the outcrop reference N1 whole rock that was loaded into a 1-L stainless-steel reactor with 297 g of distilled water. These proportions of water and rock ensured a thorough contact of the rock powder with the liquid before, during, and after the experiments. After evacuation of the loaded reactor, the container headspace was filled at 7000 kPa with He and checked for leaks. The He pressure was then reduced to 241 kPa and the reactors were heated isothermally after an initial heat-up time of 105 min to 270, 290, 310, 330, 349, and 365°C, and held at these successive temperatures for 72 h. In accordance with other hydrous pyrolysis experiments (Lewan, Reference Lewan, Engle and Macko1993), these conditions represent the full range of petroleum generation including kerogen decomposition into bitumen and bitumen decomposition into immiscible oil. A further experiment was conducted at 365°C for 216 h to simulate high thermal maturities beyond oil formation. Seven hydrolyzed samples were obtained that were numbered P1, P2, P3, P4, P6, P9, and P10 for the temperatures and durations described above. After the reactors cooled to room temperature, the generated gas, expelled immiscible oil, reacted water, and spent shale were collected as described by Lewan (Reference Lewan, Engle and Macko1993). The spent rock was recovered after vacuum drying at 60°C for 18 h and the <2 μm fraction was separated following a classical settling procedure in distilled water for its mineral contents and its chemical and isotopic analyses, the same being applied to the corresponding whole rock. The <2 μm fractions obtained were X-rayed; each separate being scanned twice, once air-dried and again after ethylene-glycol solvation over-night at 60°C.
Because the main concern for this study was the behavior of B and Li, and of H and O in the clay-type material, their amounts and isotope compositions in the fluids used for the pyrolysis experiments were not analyzed. These fluids were considered primarily to act as a pressurizing medium completely external to the clay and organic evolutions. Also, considering the high concentrations of B and Li associated with the black shale, any amount of deionized water added to the pyrolysis containers was considered to be negligible. As no information was available on the composition of the natural fluids that were in contact with the minerals during burial, their isotopic compositions can be calculated only by assuming equilibrium at the experimental temperatures. While results from trace-elemental amounts and isotope compositions of the fluids could be used to check the values measured in the solids at the end of the experiments, the primary interest of the present study was in the changes in the mineral compositions related to temperature.
Wet Chemical Analysis
The amounts of major, trace, and rare-earth elements in the natural and pyrolyzed whole rocks and their <2 μm separates were published by Clauer et al. (Reference Clauer, Lewan, Dolan, Chaudhuri and Curtis2014). Examined and discussed again here, recall that the amounts of some trace and of all rare-earth elements (REEs) were determined by inductively coupled plasma-mass spectrometry (ICP-MS) following the procedure of Samuel et al. (Reference Samuel, Rouault and Besnus1985). The international standards BEN-1 and GL-O were included in the analytical procedure together with the selected aliquots to constrain best the analytical accuracy and internal reproducibility. The untreated outcrop whole rock and <2 μm fraction were also duplicated to consolidate the external reproducibility. The routine precision was ±10% for the REE contents and ±5% at the 2σ level for those of the other trace elements, which was confirmed by the duplicated data.
Secondary Ion Mass Spectrometry Analysis
The analytical equipment used for the B and Li analyses was a Cameca secondary ion mass spectrometer (SIMS) IMS 6f, (CAMECA Inc., Gennevilliers, France, a business unit of AMETEK Inc., Madison, Wisconsin, USA) known to be very appropriate and very efficient for chemical and light-element isotopic analysis of small sample volumes (Williams et al., Reference Williams, Clauer and Hervig2012). Such equipment also has the advantage of eliminating the need for chemical extractions, and it can elucidate potential chemical heterogeneity associated with crystal growth by its ability to analyze nm-sized size fractions. For clay powders as used here, ~2–5 mg of the size fractions were rinsed in mannitol (C6H14O6; a polyhydric alcohol; ACS grade, Cole Parmer, Vernon Hills, Illinois, USA; www.coleparmer.com) to remove surface-adsorbed B and Li contaminants (Williams et al., Reference Williams, Clauer and Hervig2012) and suspended in 5 μL of deionized water that had been filtered through AmberLite™ IRN9687 Ion Exchange Resin, (Dupont USA https://www.dupont.com/products/amberliteirn9687lioh.html) to remove the aqueous B and Li. The surface tension of each drop orients the layer-silicates parallel to the glass slide (nominally B- and Li-free; Buehler 408011100; Lake Bluff, Illinois, USA) as water evaporates. The SIMS holds 25-mm diameter round slides so that several rock samples were mounted on one slide together with the internal reference standard, and the mounts were Au-coated to alleviate charge build-up during bombardment by the primary ion beam (Williams et al., Reference Williams, Clauer and Hervig2012). The B and Li contents and isotope compositions of the untreated reference rock material and of four pyrolyzed size aliquots were determined following this procedure. The analytical craters usually reached a depth of 2–3 μm with the beam focused to <10 μm for relatively high spatial-resolution analyses. Because the clay samples consisted of <2 μm particles, the beam was defocused to ~30 μm in order to average the chemical composition of many analyzed particles and to provide a more stable secondary ion count. Multiple analyses of samples with contents in the range of 10–100 μg/g indicated that errors were usually <3%, but for smaller contents the analytical errors approach 10%.
A standard was measured systematically between the routine analyses of unknowns to detect and correct instrumental drift. Determination of the instrumental mass fractionation for each analytical session, which varies over time due to small changes in beam alignment and instrument electronics, also helped to evaluate the instrument stability. In the present case, 3–5 analyses of each clay fraction were made; because of expected data scatter due to some heterogeneity in the material, the overall analytical precision was calculated to be ±2σ. If the standard error of a set of ratios was more than twice the predicted analytical error, which normally indicates that the sample is charging or that the analyzed area is not flat, the analysis was rejected. It is probably also appropriate to recall that the illite tetrahedral sites preferentially host B, while smectite-type interlayer sites can also host B, therefore contributing to the overall budget. To alleviate this potentially confusing addition, all interlayer B was removed by cation exchange, commonly with NH4Cl (Zhang et al., Reference Zhang, Chan and Gieskes1998). Lithium isotope fractionation appears to be similar in magnitude to that for B in illite, but Li substitutes primarily in the octahedral sites (Williams & Hervig, Reference Williams and Hervig2005). From the analytical point of view, because many laboratory chemicals contain trace amounts of Li that can potentially contaminate smectite interlayers, it is necessary to use pure reagents. Mannitol has also been used, after chemical treatment of the samples and size separates, to remove the surface-adsorbed B (Hingston, Reference Hingston1964) and Li (Teichert et al., Reference Teichert, Bose and Williams2020).
Oxygen and Hydrogen Stable Isotope Analysis
For the hydrogen isotope analyses, the <2 μm fractions were first vacuum degassed overnight at 200°C to remove the interlayer water, as well as that adsorbed at the crystal surfaces. Then, they were transferred to a previously out-gassed Pt crucible that was placed inside a quartz extraction chamber attached to the vacuum line and the whole volume was evacuated. Dehydroxylation was accomplished by radiofrequency induction heating of the crucible to 1200°C. The released water was converted to H2 by reaction with Cr at 800°C (Bigeleisen et al., Reference Bigeleisen, Perlman and Prosser1952; Donnelly et al., Reference Donnelly, Waldron, Tait, Dougans and Bearhop2000 ) in a multiple-pass system. The H2 yield was measured manometrically, and the δD was determined on a gas-source mass spectrometer calibrated via water and mineral standards. With this analytical technique, the NBS30 biotite standard gave a δD of –65‰ (V-SMOW) with an analytical precision of ±6‰ (2σ; Fallick et al., Reference Fallick, Macaulay and Haszeldine1993). The oxygen isotope composition of the clay minerals was determined by laser fluorination (Macaulay et al., Reference Macaulay, Fallick, Haszeldine and Graham2000) based on the Borthwick and Harmon (Reference Borthwick and Harmon1982) ClF3 modification of the Clayton and Mayeda (Reference Clayton and Mayeda1963) BrF5 method. The NBS28 quartz standard yielded a δ18O of 9.6‰ (V-SMOW) with a precision of ±0.6‰ (2σ). All clay isotope data are reported in per mil (‰) relative to the V-SMOW standard, no interferences being observed in the mass spectra.
MINERAL AND CHEMICAL BACKGROUND
The identification of the clay minerals from the <2 μm fraction of the outcropping rock and pyrolyzed samples was completed by X-ray diffraction (XRD) in a previous study (Clauer et al., Reference Clauer, Lewan, Dolan, Chaudhuri and Curtis2014). It is partly presented again here for easy comparison (Table 1). The illite content of the pyrolyzed separates varied between 23 and 32% with increasing experimental temperature. The amount of illite-smectite mixed layering (labeled I-S hereafter) remained between 68 and 63% with limited increases and decreases, especially without visible changes when the experimental temperature increased. Note that the full width at half maximum (FWHM) of the I-S tended to increase when the pyrolysis temperature and duration increased, suggesting some expansion of its structure. The only visible change was in the slight, systematic decrease of the smectite layers relative to those of illite in the glycolated data relative to the air-dried fractions, compensated by illite layers. The modeled content of illite layers in the I-S (Dolan, Reference Dolan1998; based on Velde & Vasseur, Reference Velde and Vasseur1992) was also found to increase from 5 to 40% with a marked illitization at the intermediate pyrolysis steps, and a less-marked increase at the two highest temperatures that suggest a decrease of available K. Because of a lack of control on these modeled amounts, and because the K-Ar data did not confirm this theoretical increase, that aspect was not addressed further here.
XRD data of the outcropping and pyrolyzed <2 μm clay fractions (modified after Clauer et al., Reference Clauer, Lewan, Dolan, Chaudhuri and Curtis2014)

nd stands for not determined, ad for air dried, gl for glycolated, FWHM for full width at half maximum, sm for smectite, and ill for illite
The XRD d 001 value of the ethylene-glycolated specimens decreased only from 16.71 Å for the outcrop N1 specimen to 13.50 Å for the P10 fraction heated at 365°C for 216 h, while a value of ~10 Å corresponds to pure illite (e.g. Pytte & Reynolds, Reference Pytte and Reynolds1989). This limited decrease highlighted an incomplete collapse of the expandable smectite-type layers, possibly due to some bitumen impregnation (Dolan, Reference Dolan1998). Such bitumen coating of the smectite particles and their interlayer surfaces potentially retarded the clay-mineral conversion and minimized the expulsion of oil generated from partial bitumen decomposition at higher thermal maturities. The R0-type Reichweite ordering of the I-S mixed-layer from the <2 μm fraction of the N1 reference rock was clearly recognizable in the P1 and P2 pyrolysis steps, while the R1-type took over in the P9 and P10 steps when some K seems to have been incorporated. The constant XRD d 001 values of the glycolated material also suggested an unaffected I-S interlayering (Table 1). The full width at half maximum height (FWHM) of the untreated d 001 peak increased from 0.16 in the N1 outcrop specimen to 0.40 in the P10 pyrolyzed specimen, suggesting a probable addition of bitumen to the interlayer positions. Although detectable in the <2 μm fraction of the N1 outcrop sample, kaolinite was almost undetectable in most pyrolyzed specimens. The outcrop N1 <2 μm fraction also contained some recognizable opal-CT and feldspar as accessory minerals.
The major elements of the outcropping and pyrolyzed <2 μm fractions were also determined in the previous study (Clauer et al., Reference Clauer, Lewan, Dolan, Chaudhuri and Curtis2014), indicating limited changes during the pyrolysis experiments. In detail and taking Al as conservative, the Ti content was the least affected with 7% gains in the experiments up to 310°C, whereas Ca showed the largest gains of between 54 and 332%, and Fe yielded the largest losses between 19 and 47%. Sodium was removed systematically in amounts from 26 to 51%, while Mg decreased by 15 and 17% in the two low-temperature experiments and increased by 10–21% in the higher-temperature steps. The TOC contents decreased when experimental temperature increased by ~27% from 270°C for 72 h to 365°C for 216 h. Prior to pyrolysis, Dolan (Reference Dolan1998) subjected whole-rock powder to an H2O2 treatment for 48 h at 50°C in order to remove the organic matter. Despite this usually well adapted treatment to remove organics, however, the <2 μm fractions still contained significant TOC contents, which explains the inability of the smectite interlayers to collapse completely after heating because of some probable bitumen-type impregnation. The K-Ar data of the illite-enriched <2 μm fraction did not change significantly after the successive pyrolysis steps (Clauer et al., Reference Clauer, Lewan, Dolan, Chaudhuri and Curtis2014), suggesting that the limited changes in the XRD data of the clay material explain the limited changes of its chemical composition. The changes detected in the elemental composition of the <2 μm fractions probably relate, therefore, to changing soluble minerals and to the volatile maturing organic matter that were released.
Results
Trace Metal Contents of the <2 μm Fractions
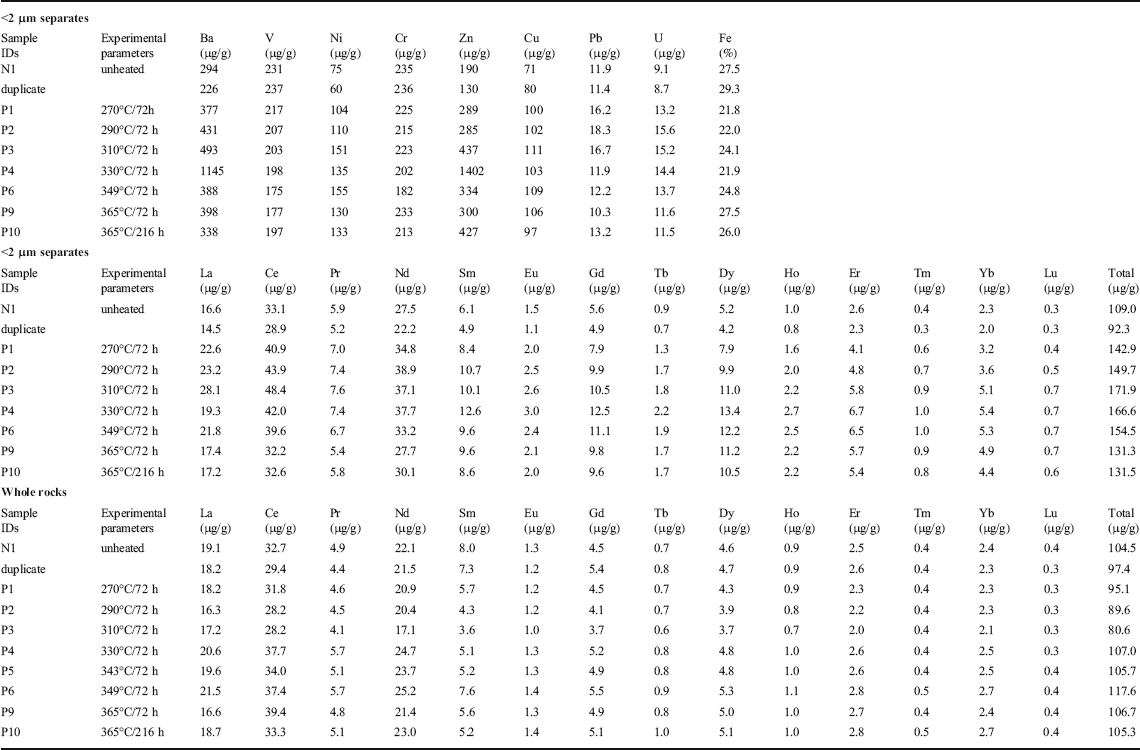
As the apparent changes induced by the pyrolysis experiments belonged mainly to bitumen occurrence in the <2 μm fractions and, as crude oil often hosts heavy metals, an evaluation of their metal contents was of interest in the present context. Metals were determined in the <2 μm fractions of the N1 outcrop reference and of the P1 to P10 pyrolyzed counterparts (Table 2). The Ba, Ni, Zn, Cu, Pb, and U contents of the pyrolyzed separates were greater than, whereas those of V, Cr, and Fe were less than those of the N1 outcropping reference separate. The former group seems not to be hosted by the organics, as their contents did not correlate with the decreasing TOC content due to increasing pyrolysis temperature. By contrast, the metals with smaller contents than those of the outcrop reference and with a marked drop at the 270°C for 72 h step that corresponded to the major release of the TOC were probably hosted by the organic matter and released during its artificial maturation. The metal contents, which were greater than those of the outcropping <2 μm fraction, are supposedly retained in mineral phases that remained unaltered during the pyrolysis experiments with some increase due to precipitation of new metal-bearing phases or exchanges with other components depleted in trace elements.
The REE and trace element contents of the outcropping and pyrolyzed <2 μm clay fraction and the REE contents of the outcropping and pyrolyzed whole rock.

REE Contents of the Whole Rocks and the <2 μm Fractions
The total REE contents of the <2 μm fractions increased from outcrop reference until the 310°C over 72 h step, and decreased thereafter including the last step at 365°C for 216 h. The REE contents remained consistently above those of the outcrop reference (Table 2). The distribution patterns of these outcropping and pyrolyzed fractions are of similar shape, with a flattening of the pattern for the initial P1 pyrolyzed fraction at 270°C over 72 h (Fig. 2a). The different distribution patterns showed an almost systematic increase for all REEs in the pyrolyzed fractions relative to the outcropping reference. The light REE (labeled LREEs) distribution at the highest temperature of 365°C over 72 h and over 216 h is within analytical uncertainty outlined by the gray area in Fig. 2. The middle REEs (labeled MREEs) increased consistently with a systematic, although not always analytically significant, positive Sm anomaly, especially at the higher temperatures. The heavy REEs (labeled HREEs) remained very fractionated with the highest ratio for Ho.
REE distribution patterns of: a the pyrolyzed <2 μm fractions, and b the whole rocks (WR) relative to the reference outcropping counterparts. The gray zones indicate the ±2σ analytical uncertainty

The REEs were also determined in the outcrop and pyrolyzed whole rocks (Table 2). The total REE contents of those pyrolyzed rocks decreased at the initial steps of 270 and 310°C for 72 h, relative to those of the reference, while increasing again at the higher temperatures toward the contents of the outcrop sample. Interestingly, most REE contents of the pyrolyzed whole rocks remained within analytical uncertainty of those from outcrop reference whole rock, but with a quite different distribution than in the <2 μm fractions (Fig. 2b). Three anomalies in the whole-rock REE pattern relative to the outcrop reference were significant analytically: the negative Sm anomaly and the positive but slight Tb and Tm anomalies.
B and Li Contents and Isotope Compositions
The B and Li contents of the outcropping and pyrolyzed <2 μm fractions were scattered narrowly by taking into consideration the analytical uncertainty, especially for the B contents of the pyrolyzed specimens (Table 3). Boron was released during the experiments, decreasing from 79 μg/g in the outcrop reference to 20–27μg/g in the pyrolyzed specimens (~70% loss). The Li contents of the same pyrolyzed separates ranged more widely, from 28 to 11 μg/g with 24 μg/g for the outcrop reference (also ~70% loss). The δ11B decreased from –2.6 to –13.9‰ when the experiment temperature increased, whereas the δ7Li decreased from –14.6 in the outcrop reference to ~ –25.5‰, with a further increase to –20.8‰ at the highest temperature. The δ11B correlated negatively with the temperature increase and positively with the TOC content measured previously (Dolan, Reference Dolan1998; Fig. 3), as did the B contents. These two correlations were not as linear for δ7Li, for which the contents, but not the δ7Li isotopic composition, decreased significantly only after the 365°C for 72 h step (Fig. 4a). The δ7Li value for the <2 μm fraction at 310°C over 72 h was also abnormally low compared to the data of the other pyrolyzed fractions (Fig. 4b).
The B and Li contents and isotope compositions with the contents of the total organic carbon (TOC) of the outcropping and pyrolyzed <2 μm clay fraction

IDs stands for identities, nd for not determined, and TOC for total organic content
a δ11B vs. B contents; b δ11B vs. total organic carbon (TOC) contents of the pyrolyzed <2 μm fractions relative to the outcropping N1 reference

a δ7Li vs. Li contents; b δ7Li vs. total organic carbon (TOC) contents of the pyrolyzed <2 μm fractions relative to the outcropping N1 reference

By using a simple mass-balance calculation based on the contents and isotopic ratios of B and Li of the outcrop reference and of the successive pyrolyzed fractions, the amounts of both elements were quantified, either incorporated in or expelled from mineral/organic residues. This calculation showed that the B contents of the pyrolyzed fractions consistently decreased by 52 to 59 μg/g after each experiment, i.e. by 66 to 75% regardless of the temperature. The δ11B of this released B was also quite constant between –1.8 and +2.4‰. Plotted in a diagram these changes allowed an estimate of the theoretical release of B at each pyrolysis step (Fig. 5a). The display showed that the δ11B value of the expelled B increased at each higher pyrolysis temperature, with an overall constant removal of ~135–140 μg/g at each step and a δ11B that shifted progressively from –2 to +9‰. Of course, the calculated amounts removed at each step need to be adjusted strictly to the amounts of the removed carbon compounds of the TOC, considering that all mobile B relates to it. In fact, not much more B is released from organics after the initial pyrolysis step at 270°C.
a Graphical presentation of the B contents removed from untreated and pyrolyzed size fractions and of their changing isotope compositions relative to the treatments; b graphical presentation of the Li contents removed and changing isotope compositions. The numbers refer to the data of the untreated and the pyrolyzed size fractions, while the numbers marked with a prime (e.g. 9’) represent the data extrapolated relative to the untreated original fractions. The gray zones in each diagram define the theoretical zone of B and Li removed throughout the whole experiment

In the case of Li, the contents remained almost stable in the two low-temperature steps with increases of only 2 and 4 μg/g, which was within analytical uncertainty. The decrease was more significant, 5 and 13 μg/g, after the next two temperature steps. Li was suggested by Williams et al. (Reference Williams, Elliott and Hervig2015) to be released from kerogen at higher temperatures than B. The graphical calculation of the changing δ7Li and Li contents after each step suggested a progressive increase of the removed Li from ~20 to 37 μg/g (Fig. 5b). The δ7Li of the expelled Li decreased progressively from –4 to –9‰, consistent with observations by Teichert et al. (Reference Teichert, Bose and Williams2020).
Oxygen and Hydrogen Isotope Compositions
The oxygen and hydrogen isotope ratios changed only moderately after the pyrolysis step at 270°C, but the changes became much more significant for δ18O above 300°C. At the 349°C for 72 h and the 365°C for 216 h steps, the water yield decreased from 2.8 to 2.0%, which corresponded to a 28.5% loss (Table 4). The δ18O also decreased significantly from 13.5 to 5.4‰ (V-SMOW), whereas the δD decreased less, from –104 to –92‰ (V-SMOW), which was almost within analytical uncertainty. Interestingly, pyrolysis of the <2 μm fraction at the 349°C and 365°C for 72 h steps provided δ18O values that were analytically identical: the highest temperature and the longest heating resulted in significantly lower δ18O values. The δ18O value also decreased significantly with the decreasing TOC content, which might indicate a correlation, at least during the initial pyrolysis step. The TOC content remained almost constant afterwards, the δ18O and δ7Li values also stayed constant.
The δD and δ18O values and the water yields of the outcropping and pyrolyzed <2 μm clay fraction

IDs stands for identities
In summary, the chemical and isotopic results point to a consistent link between the altering organic matter and the metals, B, Li, and oxygen data, at least partly, though probably with a different mechanism.
Discussion
Boron substitutes for Si in the tetrahedral sites of authigenic illite, where its equilibrium isotope fractionation was determined (Williams et al., Reference Williams, Hervig and Hutcheon2001). It can also be held in exchangeable sites of smectite interlayers, from where it can be removed by cation exchange. In contrast, Li commonly substitutes for Mg in octahedral sites of the authigenic illite layers from I-S. Some can also enter the di-trigonal cavities of the illite structure, though the coordination of Li in this site is similar to the VI coordination in the octahedral site (Sposito et al., Reference Sposito, Skipper, Sutton, Park, Soper and Greathouse1999). Its isotopic fractionation can then be assumed to be similar to the isotopic fractionation in the octahedral site (Hindshaw et al., Reference Hindshaw, Tosca, Gout, Farnan, Tosca and Tipper2019). As interlayer Li also contributes to the total-cell Li isotope composition, it must be removed before analysis. On the other hand, not much is known about specific δ11B and δ7Li ratios and contents in progressively maturing sedimentary organic matter. In the present case, the outcrop sample was leached with H2O2, which, as expected, removed some of the organic matter present, at least of the whole rock, but probably not that trapped in the interlayer sites of the smectite phase or within the smectite particles from the <2 μm fraction.
As shown previously, the clay fraction of the Kreyenhagen shale consists mainly of illite and I-S that is of concern here with its smectite-type interlayers, as well as subordinate amounts of kaolinite and/or chlorite (Clauer et al., Reference Clauer, Lewan, Dolan, Chaudhuri and Curtis2014). Apparently, the pyrolysis experiments did not affect the illite structure and the K-rich interlayers of the I-S because the sensitive K-Ar data of the whole rocks and of the <2 μm fractions were not modified beyond the analytical uncertainty by the pyrolysis experiments up to the step of 365°C for 72 h. Only the longer heating step at 365°C induced a decrease in the K-Ar age of both the whole rock and the <2 μm fraction. In detail, the behavior of the K-Ar data was opposite that for the whole rocks and the size separates: the decrease was due mainly to a K gain in the former, i.e. to a removal of the K-poor phases, while it was due to a radiogenic 40Ar loss or a K increase in the latter (Clauer et al., Reference Clauer, Lewan, Dolan, Chaudhuri and Curtis2014, Fig. 6). These results included the illite layers of the I-S. However, and based on the XRD data, the remaining amounts of smectite layers in the I-S did not collapse and can be interpreted as resulting from bitumen coating the interlayers instead of an occupancy by water molecules that were removed by the experiments. Intuitively, the bitumen coating increased the amount of organic B in the interlayers, unless the result integrates a combined volatilization of maturing TOC and smectite interlayer impregnation by the bitumen of the leftover TOC after experimental maturation by hydrolysis. Because the illite and the K-rich layers of the I-S remained unchanged by most pyrolysis experiments, the changes in the light elements (hydrogen, lithium, boron, and oxygen) could relate mainly to an alteration of the organic matter, mineral-water isotope exchanges in the I-S interlayer sites, and to the presence of some oxides, carbonates, and phosphates (Clauer et al., Reference Clauer, Lewan, Dolan, Chaudhuri and Curtis2014).
The Pb, V, Cr, and Fe contents of the N1 reference and of the successively pyrolyzed <2 μm fractions (P3, P6, P9, P10) relative to their TOC contents

The available results also point to a significant difference in the TOC decrease: from 28% for the two low-temperature steps of 270–310°C for 72 h, it decreased to 32–33% for the three high-temperature steps of 349–365°C for 72 and 216 h. This decrease confirmed an impact on the organic matter at a thermal interval between 310 and 349°C with the expected introduction of organics into the interlayers because of the lack of K usually trapped therein.
Changing Contents of the Metals
The behavior of Pb, V, Cr, and Fe has been portrayed relative to the variable contents of TOC at the successive experimental steps (Fig. 6). For Pb, with amounts in the <2 μm pyrolyzed fractions being greater than that in the untreated outcropping fraction, a significant increase was observed at the initial experimental step of 270°C for 72 h. Then the amount decreased to less than that present in the outcropping reference. This varying behavior confirmed that no potential supply of Pb by the stainless-steel vessels was available during the experiments and that the Pb contents were not connected with the TOC. The increase after the 270°C for 72 h step verified this disconnection, and the Pb decrease at the higher experimental temperatures related instead to a probable decomposition of oxides. The pattern for V showed a decrease until 365°C for 72 h and a close relationship with the TOC. The long-lasting experiment at 365°C for 216 h displayed a different behavior of V: an increase that indicated a release from minerals and/or organics depleted in V. The amounts of Cr in the pyrolyzed size fractions were less than that in the outcropping separate, except for the step at 365°C for 72 h, indicating an isolated but significant increase, which was more difficult to interpret. The Fe pattern was similar to that of V, except for the amounts, especially with a continuous decrease in the amount until the step at 365°C for 72 h. The long-lasting experiment at 365°C for 216 h also displayed increasing amounts as for V and Pb, which suggested the precipitation of various minerals stable at such high temperature that scavenge metals made available by other less stable components.
Changing REE Distribution and Organic Maturation During Aqueous Pyrolysis
The increase in the total REE contents in the pyrolyzed <2 μm fraction required dissolution of mineral and organic phases depleted in REEs during the initial experimental steps. The decrease at higher temperatures (steps at 349 to 365°C for 72 and 216 h) implied a change in the reactions with the dissolution of REE-hosting mineral phases. The fact that the REEs of the pyrolyzed whole rocks yielded distribution patterns within analytical uncertainty means that the changes induced by the experiments were minimal at the bulk-rock size. The REEs also behaved differently in the whole rocks than in the <2 μm fractions, suggesting different types of organic materials in both. As the pyrolysis experiments did not alter the K-bearing silicates (Clauer et al., Reference Clauer, Lewan, Dolan, Chaudhuri and Curtis2014), only carbonates, oxides, the organic matter, and the smectite-rich interlayer host sites of the I-S were apparently affected by the experiments.
Except for Ce and Eu, REEs are known to occur either in tetra- or divalent configurations depending on the environmental pH for Ce and the origin for Eu, while the other REEs of mineral components do not fractionate internally among each other. In contrast, the amounts and distribution of REEs in sedimentary organics may change because they may be influenced by various factors, including the type, composition, and source of the matter, as well as physical and chemical factors such as varied micro-organic populations, and complexation degree of the REEs from organic matter depending on the ligands, pH, and Eh (e.g. Wyttenbach et al., Reference Wyttenbach, Furrer, Schleppi and Tobler1998; Ozaki & Enomoto, Reference Ozaki and Enomoto2001; Cao et al., Reference Cao, Ding, Hu and Wang2002; Germund, Reference Germund2004).
The maturation of the pyrolyzed organics of the <2 μm fraction showed that the LREEs, from La to Nd, reacted most at the low pyrolysis temperatures and not much during the higher temperatures, giving a pattern characterized by a downward incurved distribution. Alternately, the MREEs and HREEs reacted more with increasing temperature, giving a progressively upward incurved trend to the patterns when the pyrolysis temperature increased. The REE Ho reacted the most with the highest fractionation ratio relative to the outcropping <2 μm fraction. Therefore, the successive down trends from La to Pr and up trends from Nd to Ho (Fig. 2) were considered to be typical for a dominant organic impact relative to that by the clay material (e.g. Semhi et al., Reference Semhi, Chaudhuri and Clauer2009). Additional data favoring this interpretation were the negative Sm anomaly of the pyrolyzed whole rocks, which is, at least partly, compensated by a positive anomaly in the <2 μm fraction, as well as the Sm, Tb, and Tm anomalies that have never, to the knowledge of the present authors, been reported in association with mineral phases before. The materials volatilized or dissolved during the pyrolysis experiments were of different composition in the rock and in its <2 μm fraction. It might be added that the REE patterns were temperature dependent, that the LREEs behaved differently from the MREEs and the HREEs, and that the HREEs characterized best the organics that were retained in the <2 μm fractions.
If the observed REE distribution patterns relate mostly to the organic matter incorporated into the smectite structure, then the 'negative' image of these patterns should be representative of the volatilized organic matter that was intuitively located within the smectite particles.
Changes in the H, Li, B, and O Isotope Compositions and in the TOC
The marked decrease in the TOC of the solid phases at the 310°C-for-72 h step was related to a marked decrease in the δ7Li values, suggesting some kind of relationship, while δ11B changed markedly at the higher 349°C-for-72 h step, where another reaction obviously took place (Fig. 7). The impact of the organic matter on the B and Li signatures was, therefore, obvious, but it seems not to be identical for all light elements. The changes of the H and O isotope ratios were most plausibly a consequence of stable isotope exchanges between the fine-grained clay and the 297 g of water added to the reaction vessels. As noted above, the extent of oxygen isotope exchange was notably greater above 300°C, in agreement with the observations of O’Neil and Kharaka (Reference O'Neil and Kharaka1976), and the δ18O of the P10 step was smaller than that of the P9 step, probably because of the increased time allowed for oxygen isotope exchange. Hydrogen isotope exchange probably continued also, although the differences in the measured values were close to the analytical precision. The different magnitudes in the δ18O and δD changes can readily be ascribed to the likely differences in these isotope ratios between the formation waters with which the <2 μm material was originally in isotopic equilibrium and the meteoric or the laboratory water used for the pyrolysis (Table 3).
a δ11B vs. δ18O and b δ7Li vs. δ18O of the pyrolyzed <2 μm fractions (P3, P9, P10) relative to the outcropping N1 reference

By calculating the δ11B and δ7Li of the expelled B and Li, the former increased progressively from –2‰ for that released at the low-temperature step to +9‰ for that released at 365°C for 216 h (Fig. 7a). The released δ7Li also increased relative to the value at the outcrop, but it remained approximately constant around –7‰ at the 310°C for 72 h step to –8‰ at the long-lasting step at 365°C for 216 h. The calculated isotope compositions relied here on the elemental contents, but they were not adjusted for the amounts of organic carbon removed at each experimental step.
On the basis of the δ11B and δ7Li data of the material remaining in the residues of the pyrolyzed fractions, calculation of the released B shows that it is not isotopically homogeneous, probably depending on how the organic matter decomposed at the successive thermal steps, and on which of its components were released (Fig. 5a). Both the δ11B and δ7Li of the hydrocarbons released successively changed at each pyrolysis step, together with the Li content.
Behavior of Bitumen-coated Smectite During Aqueous Pyrolysis
The mineralogical change of some smectite layers to R1-ordering at the 365°C for 216 h step, and the limited effect of the ethylene-glycol treatment on the remaining expandable smectite-type interlayers after the high-temperature pyrolysis experiments, pointed to a plausible changing activation energy of the cations hosted by the interlayer sites. An alternative explanation, however, is that the observed mineralogical changes could have been produced by bitumen impregnation of the expandable smectite layers that could have physically coated the interlayers. This observation raises the possibility of a confusing comparison between illite layers sensu stricto and physically dehydrated smectite layers of high charge. The existence of ‘inactive’ dehydrated smectite-type layers is known and has been reported in several circumstances, but in the present study, these layers may result indirectly from a physical bitumen coating.
Dehydrated smectite of high charge has been identified by hydrating-dehydrating experiments at 25°C (Ben Rhaeim et al., Reference Ben Rhaiem, Tessier and Pons1986; Dif & Bluemel, Reference Dif and Bluemel1991) and by thermodynamic calculations (Ransom & Helgeson, Reference Ransom and Helgeson1993). In the current study, comparison of the smectite and illite contents of the air-dried and their equivalent glycolated XRD patterns showed a systematic decrease in the global smectite layers relative to the illite layers, between 2 and 8% changes in the interlayer changes at the lower pyrolysis temperatures (from untreated up to 349°C for the 72 h experiments). Only the two steps at the highest 365°C temperature step for 72 and 216 h had larger decreases of the smectite layers of 12–13% upon glycolation (Table 1). This systematic decrease of swelling layers confirmed that some of the smectite layers became less accessible to the ethylene-glycol molecules, probably because of the occurrence of bitumen, and also, because of a limited addition of K as some R1 ordering becomes detectable at the highest-temperature steps. Mobile cations, such as Ca, Sr, and K of soluble minerals made available by the pyrolysis experiments, could also have entered smectite layers progressively due to continuous bitumen degradation during the higher-pyrolysis temperatures. Increased access by water to the alumino-silicate structure may have also enhanced the exchange of oxygen isotopes (James & Baker, Reference James and Baker1976).
In summary, the so-called dehydrated smectite of oil-field reservoirs described in the literature may consist, partly, of smectite crystals with collapsed interlayers due to hydrocarbon coating. In turn, their occurrence in source and reservoir rocks could indicate, together with the already observed abnormal illite K-Ar ages (Clauer et al., Reference Clauer, Lewan, Dolan, Chaudhuri and Curtis2014), a hydrocarbon maturation preceding illitization (e.g. Lewan et al., Reference Macaulay, Fallick, Haszeldine and Graham2014).
Conclusions
Pyrolysis experiments at increasing temperatures and over varied durations did not affect the illite structure of an outcropping sample from the oil-bearing Eocene Kreyenhagen Shale of the San Joaquin Basin in California. These illite crystals are probably of detrital origin and could even be of micaceous composition. The thermal maturation did not completely collapse the smectite-type interlayers of the illite-smectite mixed layers, only altering the soluble minerals and the organic matter. The REE patterns of the untreated whole rock and its pyrolyzed equivalents are within analytical uncertainty, meaning that the changes induced by the pyrolysis experiments were minimal at the bulk-rock size. Conversely, the changes in the REEs of the <2 μm size fraction were more significant than in the whole rock. In turn, the pyrolysis experiments did not alter the K-bearing silicates, while affecting the carbonates and the oxides, as well as the illite-smectite interlayer sites and the associated organic matter. Maturation of this organic matter from the pyrolyzed <2 μm fraction demonstrated light REEs, from La to Nd, reacting most at the low pyrolysis temperatures and not additionally during the higher temperature steps, giving a downward curved trend to the patterns. The REE patterns obtained, downward from La to Pr and upward from Nd to Ho, are, therefore, considered to be typical for a dominant organic impact relative to its associated clay material.
A bitumen coating of the smectite interlayers apparently increased the amounts of organic B in the illite-smectite interlayers. The δ11B and δ7Li of the successively released carbon changed at the increasing pyrolysis steps, together with the B and Li contents. On the basis of the δ11B and δ7Li from the pyrolyzed fractions, calculated values of the released B are not isotopically homogeneous, probably depending on: (1) how the organic matter decomposes at the successive temperature steps; and (2) which components were released. The organic-B isotopic composition released increased progressively from –2‰ at low-temperature to +9‰ at a higher temperature and over longer-duration experiments. The δ7Li released also increased relative to the initial value of the outcropping sample, but it remained almost constant from –7‰ at the 310°C for 72 h to –8‰ at the long-lasting step of 365°C for 216 h.
The δ18O value decreased significantly as pyrolysis temperature increased, presumably because of mineral-water oxygen isotope exchange, which is a function of temperature and time. The TOC content remaining almost constant afterwards, the δ18O and δ7Li values also remained consistently constant. On the basis of the pyrolysis experiments demonstrating interactions between bitumen and smectite interlayers with coating of the latter by the former, some of the smectite material often identified as dehydrated in the literature could, in fact, be bitumen-coated. Such occurrence in reservoir rocks could also be indicative, based also on the previously obtained K-Ar ages of the illite-rich fractions, of the hydrocarbon maturation timing relative to the illite crystallization or alteration.
ACKNOWLEDGMENTS
The authors thank Dr M.D. Lewan (US Geological Survey) who was part of the team that initiated and completed an earlier study also based on pyrolysis experiments. This earlier study became the basis of the present publication. NC adds his personal thanks to Robert Wendling (CGS/ULP) for the sample preparation and the clay extraction of the sample studied. The SIMS analyses for B and Li isotopic compositions were conducted at the Arizona State University SIMS Facility supported by the US National Science Foundation grant EAR 1819550. The authors are also grateful to the two anonymous reviewers for their comments and remarks, as well as to the editorial team for help improving the presentation.
Funding
Funding sources are as stated in the Acknowledgments.
DECLARATIONS
Conflict of Interest
The authors declare that they have no conflict of interest.