Introduction
In a recent article, Parcak et al. (Reference Parcak, Gathings, Childs, Mumford and Cline2016) presented the results of a study in which they used satellite imagery to evaluate looting and other damage at over one thousand heritage sites in Egypt. Assessing imagery dating between 2002 and 2013, their results indicated an increase in visible damage to sites during this period caused by looting and encroachment, which by Parcak et al.’s definition “includes building development, cemetery growth, agricultural expansion and intentional damage through targeted destruction” (2016: 190). Their findings support the work of previous authors who have documented an increase in looting and other damage to archaeological sites connected with increasing nationwide economic and political instability (e.g. Ikram Reference Ikram2013; Ikram & Hanna Reference Ikram and Hanna2013).
In general, we can agree with Parcak et al.’s identification of these trends, and their work contributes to important conversations surrounding on-going damage and threats to cultural heritage in Egypt. The overall picture that they have presented, however, is incomplete, and as a result, a number of the conclusions that they draw are potentially misleading, in particular, their predictions as to how these problems will progress over the next decades and their emphasis on looting as the most significant problem facing Egypt's heritage. In response, we will address some of these issues and offer a different perspective based on work being undertaken by the Endangered Archaeology of the Middle East and North Africa Project (EAMENA; www.eamena.org), which employs similar methodologies using satellite imagery to record and monitor damage and threats to archaeological sites.
Methodological issues
The use of satellite imagery as a key tool in monitoring the condition of heritage sites and landscapes has developed significantly over the past decade as large quantities of date-stamped, high-resolution imagery have been made available in the public domain through platforms such as Google Earth. Evidence of looting, in the form of characteristic pits, for example, is consistently identifiable on satellite imagery (e.g. Stone Reference Stone2008; Contreras & Brodie Reference Contreras and Brodie2010; Casana & Panahipour Reference Casana and Panahipour2014), and the work of Parcak et al. can be seen as a welcome effort to produce a statistically valid body of research on this basis in Egypt.
There are, however, several issues that can be identified with the ways in which Parcak et al. have interpreted and presented these data. Their study assessed 1100 archaeological ‘sitescapes’ located almost exclusively in the Nile Valley and Delta. The choice to focus only on sites in these areas was the result of a legitimate methodological decision based on the availability of appropriate imagery and archaeological data (Parcak et al. Reference Parcak, Gathings, Childs, Mumford and Cline2016: 190). Despite this clear geographic limitation, they claim that their study constitutes an analysis “across an entire country” (Parcak et al. Reference Parcak, Gathings, Childs, Mumford and Cline2016: 189), and proceed to treat their findings as if they are representative of, and applicable to, Egypt's entire archaeological heritage.
Better clarification of the chronological periods of the sites investigated would also have been useful. Of the sites affected by looting, at least 80 per cent were dated to the Roman period or earlier (Parcak et al. Reference Parcak, Gathings, Childs, Mumford and Cline2016: 198), but because the authors did not provide a full list or breakdown of the types of sites analysed, it is unclear whether they deliberately did not consider any sites beyond this time-frame, or whether this indicates that few or no sites outside these time periods were affected by looting. The distinction between the two is important. If it is the former, geographically and chronologically, that would account for only a fraction of Egypt's archaeological heritage, and the apparent exclusion of Egypt's significant Islamic heritage would be especially unfortunate. If it is the latter, this is a significant finding that would have merited explicit mention and further discussion.
Finally, in their fig. 4, they present a map that visualises the density of recorded looting damage and interpolates values for the areas between the sites analysed. While this approach could reveal interesting patterns within the Delta area, where there is a higher density of investigated sites, their interpolations extend far beyond the areas for which they have useable data, into both the Eastern and Western Deserts. These are areas that the authors explicitly stated they did not include in their investigations. As demonstrated in the next section, archaeologically speaking, and in terms of modern activities, the deserts are completely different landscapes from the Nile Valley or Delta. To expect that the results from these different regions would be comparable, both in terms of the archaeological sites and landscapes, and the types of damage and threats affecting them, is too simplistic and requires further investigation.
Egypt's gold-mining landscapes
Data collection by the EAMENA Project began early in 2015 and is still in progress, but our preliminary analyses are already highlighting significant levels of damage affecting the archaeology of the Eastern Desert. Contrary to Parcak et al.’s findings in the Nile Valley and Delta, very little of that is related to looting or encroachment as they define it. Rather, our results indicate that the major threat to heritage in the Eastern Desert is the impact of the modern mining industry.
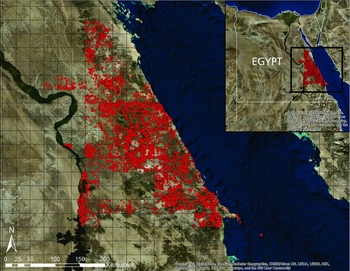
The Eastern Desert of Egypt is arguably best known archaeologically as a source of mineral deposits, particularly gold, with evidence of extraction going back far into antiquity (Klemm & Klemm Reference Klemm and Klemm2013). Using public-domain satellite imagery dating between 2002 and 2016, and primarily accessed through Google Earth and Bing Maps, members of the EAMENA team have systematically surveyed more than 50 000km2 of Egypt's Eastern Desert. We have identified more than 9000 potential archaeological sites, both previously published and newly discovered, the vast majority of which probably relate to ancient mining and quarrying industries (Figure 1). The EAMENA Project's methodology allows for individual parts or features of larger, complex sites to be documented and counted as separate, although related, records in order to make our database a useful resource for specific heritage-management purposes. Parcak et al., on the other hand, recorded their 1100 sites “according to ‘sitescapes’, sometimes comprising several geographically or historically related ancient locations and features” (Reference Parcak, Gathings, Childs, Mumford and Cline2016: 190), resulting generally in a lower overall number of ‘sites’ than might have been recorded using the EAMENA methodology. Both of these classifications are equally valid, but it is nevertheless evident that Parcak et al. have not taken the whole range of significant and abundant archaeology of the Eastern Desert into account in their analyses.
The distribution of approximately 9800 potential archaeological sites in the Eastern Desert of Egypt, identified and recorded by EAMENA (images courtesy of Esri, DigitalGlobe, GeoEye, Earthstar Geographics, CNES/Airbus DS, USDA, USGS, AEX, Getmapping, Aerogrid, IGN, IGP, swisstopo and the GIS User Community).

As with Parcak et al., where possible, EAMENA tracked changes at sites over time by comparing imagery from different dates. Analysis of satellite imagery for the Eastern Desert has revealed a widespread process of heritage damage linked to both large- and small-scale exploitation of gold deposits. These disturbances have largely taken the form of mechanised excavation of ancient mines and spoil heaps. In their exhaustive study of ancient gold mining in the Eastern Desert, Klemm and Klemm (Reference Klemm and Klemm2013: viii) briefly noted the issue of modern prospection and mining operations reworking ancient spoil deposits, but the scale of re-exploitation began to increase substantially, immediately prior to the publication of their research. Examination of satellite imagery demonstrates that 2012 was a watershed year in the targeted re-exploitation of ancient gold-mining sites. Very few sites showed damage in areas where imagery is available for 2011, but many had been damaged by 2012. This is within the time span investigated by Parcak et al., but they have not addressed any of these issues.
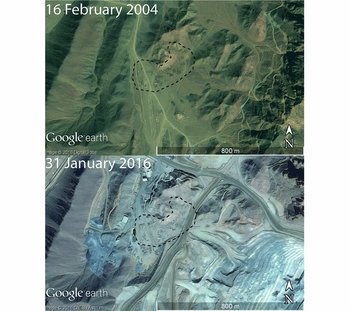
The re-working of earlier spoil heaps and mines is not a new phenomenon, with many of the gold mines in the Eastern Desert exhibiting evidence of multi-period exploitation, as at the site of Sukari (discussed below; Figure 2). Our analyses suggest, however, that the systematic destruction of these mining sites over the past several years is now taking place at an alarmingly rapid pace without any form of record or assessment to ensure the documentation or protection of the most important sites. Sukari, for example, was a significant mining complex, with evidence of activities ranging from the New Kingdom to the Islamic periods (Klemm & Klemm Reference Klemm and Klemm2013: 212–19), but it is now surrounded by an extensive modern gold-extraction and -processing plant. Some elements of the archaeological site have been preserved in the midst of the modern complex, but they are increasingly reduced by expansion of the plant, with many structures being damaged or destroyed.
The ancient mining settlement of Sukari in 2004 and 2016. The site is now only partially preserved within an extensive modern gold-mining and -processing complex (images courtesy of Digital Globe and CNES/Astrium, via Google Earth).

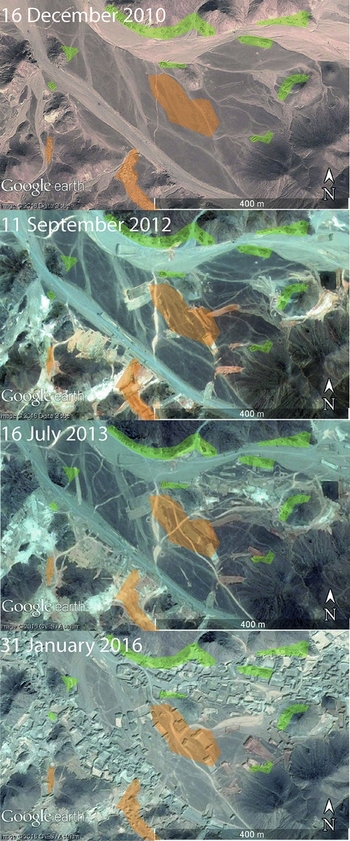
Available imagery for 2016 is already indicating that modern mining strategies are continuing to have an adverse impact on the heritage of the Eastern Desert. Some sites have been subjected to repeated episodes of damage, and, while earlier incidents often left settlements and other structures undisturbed, we have recorded an increasing amount of destruction to all forms of archaeological evidence as time has gone on. Figure 3, for example, illustrates a typical pattern, in which clusters of ancient buildings and evidence for mining activity in the form of pits and spoil heaps in the base of the valley are increasingly damaged by bulldozing.
An example of an ancient settlement (highlighted in green) and mining activity (highlighted in orange) in the Wadi Dunqash area of the Eastern Desert that has been increasingly damaged by modern, mechanised mining activity between 2012 and 2016 (images courtesy of Digital Globe and CNES/Astrium, via Google Earth).

The wider context
There are legitimate reasons for a study to focus only on a single issue such as looting, but its portrayal by Parcak et al. as the most serious problem affecting Egypt's archaeological heritage is, in our opinion, incorrect, as our work in the Eastern Desert demonstrates. Even Parcak et al.’s own analyses (Reference Parcak, Gathings, Childs, Mumford and Cline2016: tab. 1) show quite clearly that in terms of the total area of sites affected, the issue of what they have called ‘encroachment’ is a far greater problem. According to their data, from 2002–2013, the total area of archaeological sites affected by encroachment was more than nine times that represented by the looting pits. Despite this, the threats that the many and varied issues grouped together under Parcak et al.'s term ‘encroachment’ represent to Egypt's heritage are given far less attention than looting in their discussions. By essentially grouping all other forms of damage to heritage under a single term, the emphasis on the issue of antiquities theft and looting becomes clear. In doing so, however, the authors have missed what would have been a useful opportunity to understand better the scale and regional variation of different forms of encroachment and their impact on Egypt's archaeological heritage.
Of the utmost concern are the ‘predictions’ that Parcak et al. make for the future of Egypt's archaeology, particularly their conclusion that “In a worst-case scenario, if the looting identified in this study continues at its current rate (assuming no changes or unseen variables), data extrapolation indicates that all of Egypt's 1100 known archaeological sitescapes could be affected to varying extents by looting and/or encroachment by the year 2040” (Reference Parcak, Gathings, Childs, Mumford and Cline2016: 201), a statement that Parcak has also repeated elsewhere recently (e.g. May Reference May2016; Mueller Reference Mueller2016: 64). The rate at which damage inflicted by looting and encroachment has increased in recent years is indeed very serious, but, in our opinion, this estimation of the potential impact is unnecessarily inflated.
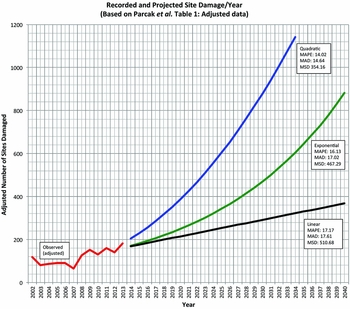
Attempting to replicate the calculations on which these predictions appear to be based, as presented by Parcak et al. in their fig. 10, demonstrates that there are alternative ways to interpret their data. The exact methods they used for their extrapolation were not detailed in the original article, but their fig. 10 plots the ‘adjusted’ number of sites affected by looting and/or encroachment each year between 2002 and 2013 (as listed in their tab. 1), and then projects a continuous increase in the number of affected sites until 2040, when they suggest that all 1100 of their sites could be affected. In Figure 4 we have re-plotted their ‘adjusted’ data from tab. 1, and then applied three different predictive ‘forecasts’; Parcak et al.’s conclusions appear to fall somewhere between the exponential and quadratic models. In fact, of the three forecasts, the quadratic model has the smallest error measurements, meaning that statistically speaking it is a better fit than the other two; according to this model, the threshold of 1100 sites would actually be reached by 2034.
Replotting of recorded and projected site damage, with quadratic, exponential and linear forecasts, with mean absolute percentage error (MAPE), mean absolute deviation (MAD) and mean squared deviation (MSD), calculated using Minitab statistical software. Each forecast shows a different potential progression of the (adjusted) number of sites affected by looting or encroachment, based on alternative interpretations of the observed data.

There are, however, several issues with these types of predictive models. All three scenarios present a situation in which, every year, more sites would be affected than had been the year before. This makes sense in terms of the cumulative number of sites that had ever been affected by damage up to and including each subsequent year, but these are not the data that Parcak et al. provided. Rather, their tab. 1 shows the actual and adjusted number of sites that had experienced damage within each year individually, a number that actually decreases or remains stable five years out of eleven. They neither specify what proportion each year were sites that had previously been affected and had experienced further damage within that year, nor the proportion of sites that had been affected by looting or encroachment for the first time. As a result, the chart they present in fig. 10 is not an accurate reflection of the rate at which the overall number of sites that were affected by looting or encroachment increased between 2002 and 2013, or of how it might progress in the future. Presenting the cumulative number of sites affected each year along with the existing data would have been very informative. This would have allowed the authors to compare the extent to which they were observing a growing number of new sites being targeted each year in their study area, as opposed to the same sites being repeatedly and increasingly damaged over time, as these are two separate problems that would potentially require very different strategies to address.
More significantly, however, attempting to predict how rates of damage, particularly looting-related damage, will increase or develop in the future is anything but straightforward. Previous studies have shown that there are many variable and unpredictable factors and motivations that contribute to the probability and extent to which particular types of sites will be looted. Parcak et al.’s predictions about how sites will be affected in coming years also appear to suggest that all types of sites will be damaged continuously until there is 100 per cent damage (2016: fig. 10), but this is not generally how site damage, particularly looting damage, operates. Rather, looters tend to target particular types of sites, such as cemeteries, where they are likely to get the greatest return for their efforts in terms of the number of saleable objects and their potential value on the black market. Once returns begin to diminish, they are much more likely to move on to other sites or areas. In addition, there is a further assumption that the market for antiquities will grow unabated, despite the impact on value that this saturation could have on it (Kersel Reference Kersel2007; Stone Reference Stone2008, Reference Stone2015; Brodie & Contreras Reference Brodie, Contreras, Lazrus and Barker2012; Kersel & Chesson Reference Kersel, Chesson, Tarlow and Stutz2013; Casana & Panahipour Reference Casana and Panahipour2014; Paul Reference Paul, Chalikias, Beeler, Pearce and Renette2016).
EAMENA's analyses of the Eastern Desert data are in progress and we therefore cannot yet offer comparable statistical observations in terms of the rates of archaeological attrition in this region. We can, however, be confident that in areas of gold deposits, the impact of modern mining will dwarf that of looting. Using the same types of data that Parcak and her team employed, it is therefore clear that any generalised conclusions and predictions about the impact of looting across the whole of Egypt must be handled with caution, and that they can only be applied within the context of Parcak et al.’s very specific study area.
Conclusions
Parcak et al. have built up a significant dataset over the Nile Valley and Delta regions that has clear heritage-management applications, and their work emphasises the scale of what can be achieved through the analysis of satellite imagery. Their presentation and interpretation of these data, however, not only raise serious questions about their methods of data interpretation and interpolation, but also have wider implications. Parcak et al. explicitly stated that their estimates were to present a worst-case scenario (Reference Parcak, Gathings, Childs, Mumford and Cline2016: 201), and this is perhaps an understandable strategy to bring attention to an important problem. They have, however, provided no evidence that the scenario they present is likely to be the case; in fact, they themselves suggest that Egypt is now in a better position to take action to address these types of problems (2016: 201–202).
If the call for greater resources to protect some of the world's most famous archaeological cultures is to be heeded, then it is essential that the data supporting the arguments for this increase be presented in a balanced, rational way. Over-estimation of looting activities and the potential threat it poses in the future is problematic, as it could encourage the targeted deployment of finite heritage-management resources towards a problem that is not the only major threat to Egypt's heritage. Parcak et al. are right to draw attention to the serious matter of looting and should be commended for their work with the Egyptian authorities to tackle this issue. Nevertheless, looting is only one of a number of complex and interrelated issues, including urbanisation, agricultural expansion, industrial development and the lack of resources to maintain and protect important sites, all of which are affecting heritage not only in Egypt but across the entire MENA region and need our attention.
Acknowledgements
The EAMENA Project is based at the Universities of Oxford, Leicester and Durham, and is generously supported by the Arcadia Fund. The authors wish to thank Robert Bewley, Andrew Wilson, Jennie Bradbury, Emma Cunliffe, Chris Green and Jean-Pierre Brun for their advice and comments, as well as the comments of the referees. Any opinions or errors remain the authors’ own.