1 Introduction
Turbulent convection involves the coupling between an active temperature field transported by a turbulent flow in the presence of gravity. Within this general framework, different examples of turbulent convection are characterized essentially by boundary conditions which force the flow in different ways. In the most common configurations the temperature difference is parallel to gravity, as in the case of Rayleigh–Bénard (RB) convection, in which the flow is confined in a box with fixed temperatures on the two horizontal boundaries (Bodenschatz, Pesch & Ahlers Reference Bodenschatz, Pesch and Ahlers2000; Ahlers, Grossmann & Lohse Reference Ahlers, Grossmann and Lohse2009) or for Rayleigh–Taylor (RT) convection, which is forced by two reservoirs of fluid at different temperatures (Boffetta & Mazzino Reference Boffetta and Mazzino2017). Another geometry, which has become very popular for numerical simulations, is the so-called bulk turbulent convection (BTC) in which the flow is forced by an imposed vertical temperature linear gradient. BTC is motivated by the study of the ultimate-state regime predicted by Kraichnan (Reference Kraichnan1962), which is supposed to appear in RB convection when the contribution of boundary layers becomes negligible (Grossmann & Lohse Reference Grossmann and Lohse2004). Moreover, it is similar to the turbulent phase of RT convection where a linear temperature (density) profile naturally appears and both RT and BTC display the ultimate state regime (Lohse & Toschi Reference Lohse and Toschi2003; Calzavarini et al. Reference Calzavarini, Lohse, Toschi and Tripiccione2005; Boffetta et al. Reference Boffetta, De Lillo, Mazzino and Vozella2012).
Several internal and external factors can modify the dynamical and statistical properties of turbulent convection: among the latter, rotation along the vertical axis is known to affect the efficiency of turbulent transport of heat in both RB and RT convection. The study of the effects of rotation is of great interest because of its relevance for geophysical and astrophysical applications, including convection in the oceans (Marshall & Schott Reference Marshall and Schott1999) and in the atmosphere (Rahmstorf Reference Rahmstorf2000; Hartmann, Moy & Fu Reference Hartmann, Moy and Fu2001), convection inside gaseous giant planets (Busse Reference Busse1994) or in the external layer of the Sun (Miesch Reference Miesch2000) and for technological applications (Johnston Reference Johnston1998).
Linear stability analysis, performed originally by Chandrasekhar (Reference Chandrasekhar1961) for RB shows that rotation has a stabilizing effect and this suggests that it might reduce the transfer of heat in the nonlinear, turbulent phase. However, the work by Rossby (Reference Rossby1969) shows that rotation can also increase the heat transport. This enhancement is explained by the mechanism of Ekman pumping (Julien et al.
Reference Julien, Legg, McWilliams and Werne1996; Kunnen, Clercx & Geurts Reference Kunnen, Clercx and Geurts2008; King et al.
Reference King, Stellmach, Noir, Hansen and Aurnou2009; Zhong et al.
Reference Zhong, Stevens, Clercx, Verzicco, Lohse and Ahlers2009) that contributes to a vertical heat flux produced by an extra vertical circulation due to a suction of fluid at the two boundary layers. The effect of rotation in turbulent RB convection has been extensively studied by means of experiments (Brown et al.
Reference Brown, Nikolaenko, Funfschilling and Ahlers2005; Kunnen et al.
Reference Kunnen, Clercx and Geurts2008, Reference Kunnen, Stevens, Overkamp, Sun, van Heijst and Clercx2011; Niemela, Babuin & Sreenivasan Reference Niemela, Babuin and Sreenivasan2010) and numerical simulations (Sprague et al.
Reference Sprague, Julien, Knobloch and Werne2006; Stevens et al.
Reference Stevens, Zhong, Clercx, Ahlers and Lohse2009; Stevens, Verzicco & Lohse Reference Stevens, Verzicco and Lohse2010b
; Chong et al.
Reference Chong, Yang, Huang, Zhong, Stevens, Verzicco, Lohse and Xia2017). The picture which emerges is that the heat transport between the hot and the cold plate, measured by the dimensionless Nusselt number
 $Nu$
(all parameters are defined below), has a non-monotonic dependence on the rotation, identified by the dimensionless Rossby number
 $Ro$
: moderate rotations enhance the heat transfer while stronger rotations result in an important suppression of the vertical velocities and a reduction of the heat transport.
In the case of RT convection, the effect of rotation has been studied more recently by means of both experiments (Baldwin, Scase & Hill Reference Baldwin, Scase and Hill2015) and direct numerical simulations within the Boussinesq approximation (Boffetta, Mazzino & Musacchio Reference Boffetta, Mazzino and Musacchio2016). The main result is that rotation always reduces the turbulent heat transfer in this case. The mechanism for this reduction is due to a partial decoupling and decorrelation of the temperature and the vertical velocity fields which reduces the Nusselt number. This result does not contrast with the enhancing mechanism associated with the Ekman pumping which has been observed in the RB case, because of the absence of boundary layers in the RT system.
The aim of this paper is to investigate the effects of rotation on the heat transfer within the framework of the BTC, driven by a mean temperature gradient. Surprisingly, at variance with RT convection, we find a strong enhancement of the Nusselt number (at fixed Rayleigh number) induced by rotation. A detailed analysis shows that the heat flux is mainly due to the formation of convective columnar structures produced by the quasi-bidimensionalization of the flow.
The remainder of this paper is organized as follow. Section 2 is devoted to the description of the numerical simulations while in § 3 we discuss the dependence of Nusselt and Reynolds numbers on rotation. In § 4 we investigate the role played by the columnar structures generated by the rotation in the process of heat transfer. Finally, conclusions are reported in § 5.
2 Mathematical model and numerical method
We perform extensive numerical simulations of BTC by integrating the Boussinesq equations for an incompressible flow forced by a mean unstable temperature gradient
 $-\unicode[STIX]{x1D6FE}$
in a cubic box of size
 $L$
(Borue & Orszag Reference Borue and Orszag1997; Lohse & Toschi Reference Lohse and Toschi2003). The temperature field is therefore written as
 $T(\boldsymbol{x},t)=-\unicode[STIX]{x1D6FE}z+\unicode[STIX]{x1D703}(\boldsymbol{x},t)$
, where
 $\unicode[STIX]{x1D703}(\boldsymbol{x},t)$
represents the fluctuation field. The Boussinesq equations, written in a reference frame rotating with angular velocity
 $\unicode[STIX]{x1D734}=(0,0,\unicode[STIX]{x1D6FA})$
along the
 $z$
axis, read
 $$\begin{eqnarray}\displaystyle & \unicode[STIX]{x2202}_{t}\boldsymbol{u}+\boldsymbol{u}\boldsymbol{\cdot }\unicode[STIX]{x1D735}\boldsymbol{u}+2\unicode[STIX]{x1D734}\times \boldsymbol{u}=-\unicode[STIX]{x1D735}p+\unicode[STIX]{x1D708}\unicode[STIX]{x1D6FB}^{2}\boldsymbol{u}-\unicode[STIX]{x1D6FD}\boldsymbol{g}\unicode[STIX]{x1D703}, & \displaystyle\end{eqnarray}$$
 $$\begin{eqnarray}\displaystyle & \unicode[STIX]{x2202}_{t}\unicode[STIX]{x1D703}+\boldsymbol{u}\boldsymbol{\cdot }\unicode[STIX]{x1D735}\unicode[STIX]{x1D703}=\unicode[STIX]{x1D705}\unicode[STIX]{x1D6FB}^{2}\unicode[STIX]{x1D703}+\unicode[STIX]{x1D6FE}w, & \displaystyle\end{eqnarray}$$
where
 $\boldsymbol{u}=(u,v,w)$
is the incompressible (
 $\unicode[STIX]{x1D735}\boldsymbol{\cdot }\boldsymbol{u}=0$
) velocity field,
 $p$
is the pressure,
 $\unicode[STIX]{x1D6FD}$
is the thermal expansion coefficient,
 $\boldsymbol{g}=(0,0,-g)$
is gravity,
 $\unicode[STIX]{x1D708}$
is the kinematic viscosity and
 $\unicode[STIX]{x1D705}$
the thermal diffusivity.
The dimensionless parameters which govern the flow are the Rayleigh number, defined as
 $Ra=\unicode[STIX]{x1D6FD}g\unicode[STIX]{x1D6FE}L^{4}/(\unicode[STIX]{x1D708}\unicode[STIX]{x1D705})$
(where
 $L$
is the size of the system), the Prandtl number
 $Pr=\unicode[STIX]{x1D708}/\unicode[STIX]{x1D705}$
and the Rossby number, here defined as
 $Ro=\sqrt{\unicode[STIX]{x1D6FD}g\unicode[STIX]{x1D6FE}}/(2\unicode[STIX]{x1D6FA})$
, which measures the (inverse) intensity of rotation as the ratio of the buoyancy and Coriolis force. When the turbulent flow reaches a statistical stationary condition, we measure velocity and temperature fluctuations and their correlation from which we compute the Reynolds number
 $Re=UL/\unicode[STIX]{x1D708}$
(where
 $U=\sqrt{\langle |\boldsymbol{u}^{2}|\rangle /3}$
is the root mean square of all velocity components) and the Nusselt number is defined as
 $Nu=\langle w\unicode[STIX]{x1D703}\rangle /(\unicode[STIX]{x1D705}\unicode[STIX]{x1D6FE})+1$
with
 $\langle \cdots \rangle$
indicating the average over the volume.
We performed extensive direct numerical simulations of (2.1)–(2.2) by means of a fully parallel pseudo-spectral code at resolution
 $N^{3}=512^{3}$
in a cubic domain of size
 $L=2\unicode[STIX]{x03C0}$
with periodic boundary conditions. We explore the set of parameters by considering two different Rayleigh numbers,
 $Ra=1.1\times 10^{7}$
and
 $Ra=2.2\times 10^{7}$
, three values of the Prandtl number
 $Pr=1$
,
 $Pr=5$
and
 $Pr=10$
and 6 different Rossby numbers. The different
 $Pr$
numbers are obtained by changing both
 $\unicode[STIX]{x1D708}$
and
 $\unicode[STIX]{x1D705}$
by keeping their product constant, which fixes the value of
 $Ra$
. The two different
 $Ra$
are obtained by changing the mean temperature gradient
 $\unicode[STIX]{x1D6FE}$
. All parameter values for the simulations are showed in table 1. The maximum value of
 $Ra$
has been chosen such that in the case
 $Pr=1$
and
 $Ro=\infty$
both the Kolmogorov scale
 $\unicode[STIX]{x1D702}=(\unicode[STIX]{x1D708}^{3}/\unicode[STIX]{x1D700})^{1/4}$
and the Batchelor scale
 $\ell _{B}=(\unicode[STIX]{x1D705}^{2}\unicode[STIX]{x1D708}/\unicode[STIX]{x1D700})^{1/4}$
(where
 $\unicode[STIX]{x1D700}=\unicode[STIX]{x1D708}\langle (\unicode[STIX]{x2202}_{i}u_{j})^{2}\rangle$
is the volume averaged kinetic dissipation rate) are well resolved. In terms of the maximum wavenumber
 $K_{max}=N/3$
we have
 $K_{max}\unicode[STIX]{x1D702}=K_{max}\ell _{B}=2.4$
for the case
 $Pr=1$
and
 $Ro=\infty$
. The effects of rotation on the Kolmogorov and Batchelor scales could not be predicted a priori, but we have checked a posteriori that in the worst case we have
 $K_{max}\unicode[STIX]{x1D702}>1.8$
(for
 $\unicode[STIX]{x1D6FA}=4$
,
 $Pr=1$
) and
 $K_{max}\ell _{B}>1.4$
(for
 $\unicode[STIX]{x1D6FA}=4$
,
 $Pr=10$
). The duration of each simulation is
 $T=100\unicode[STIX]{x1D70F}$
, measured in units of the characteristic time
 $\unicode[STIX]{x1D70F}=1/\sqrt{\unicode[STIX]{x1D6FD}g\unicode[STIX]{x1D6FE}}$
.
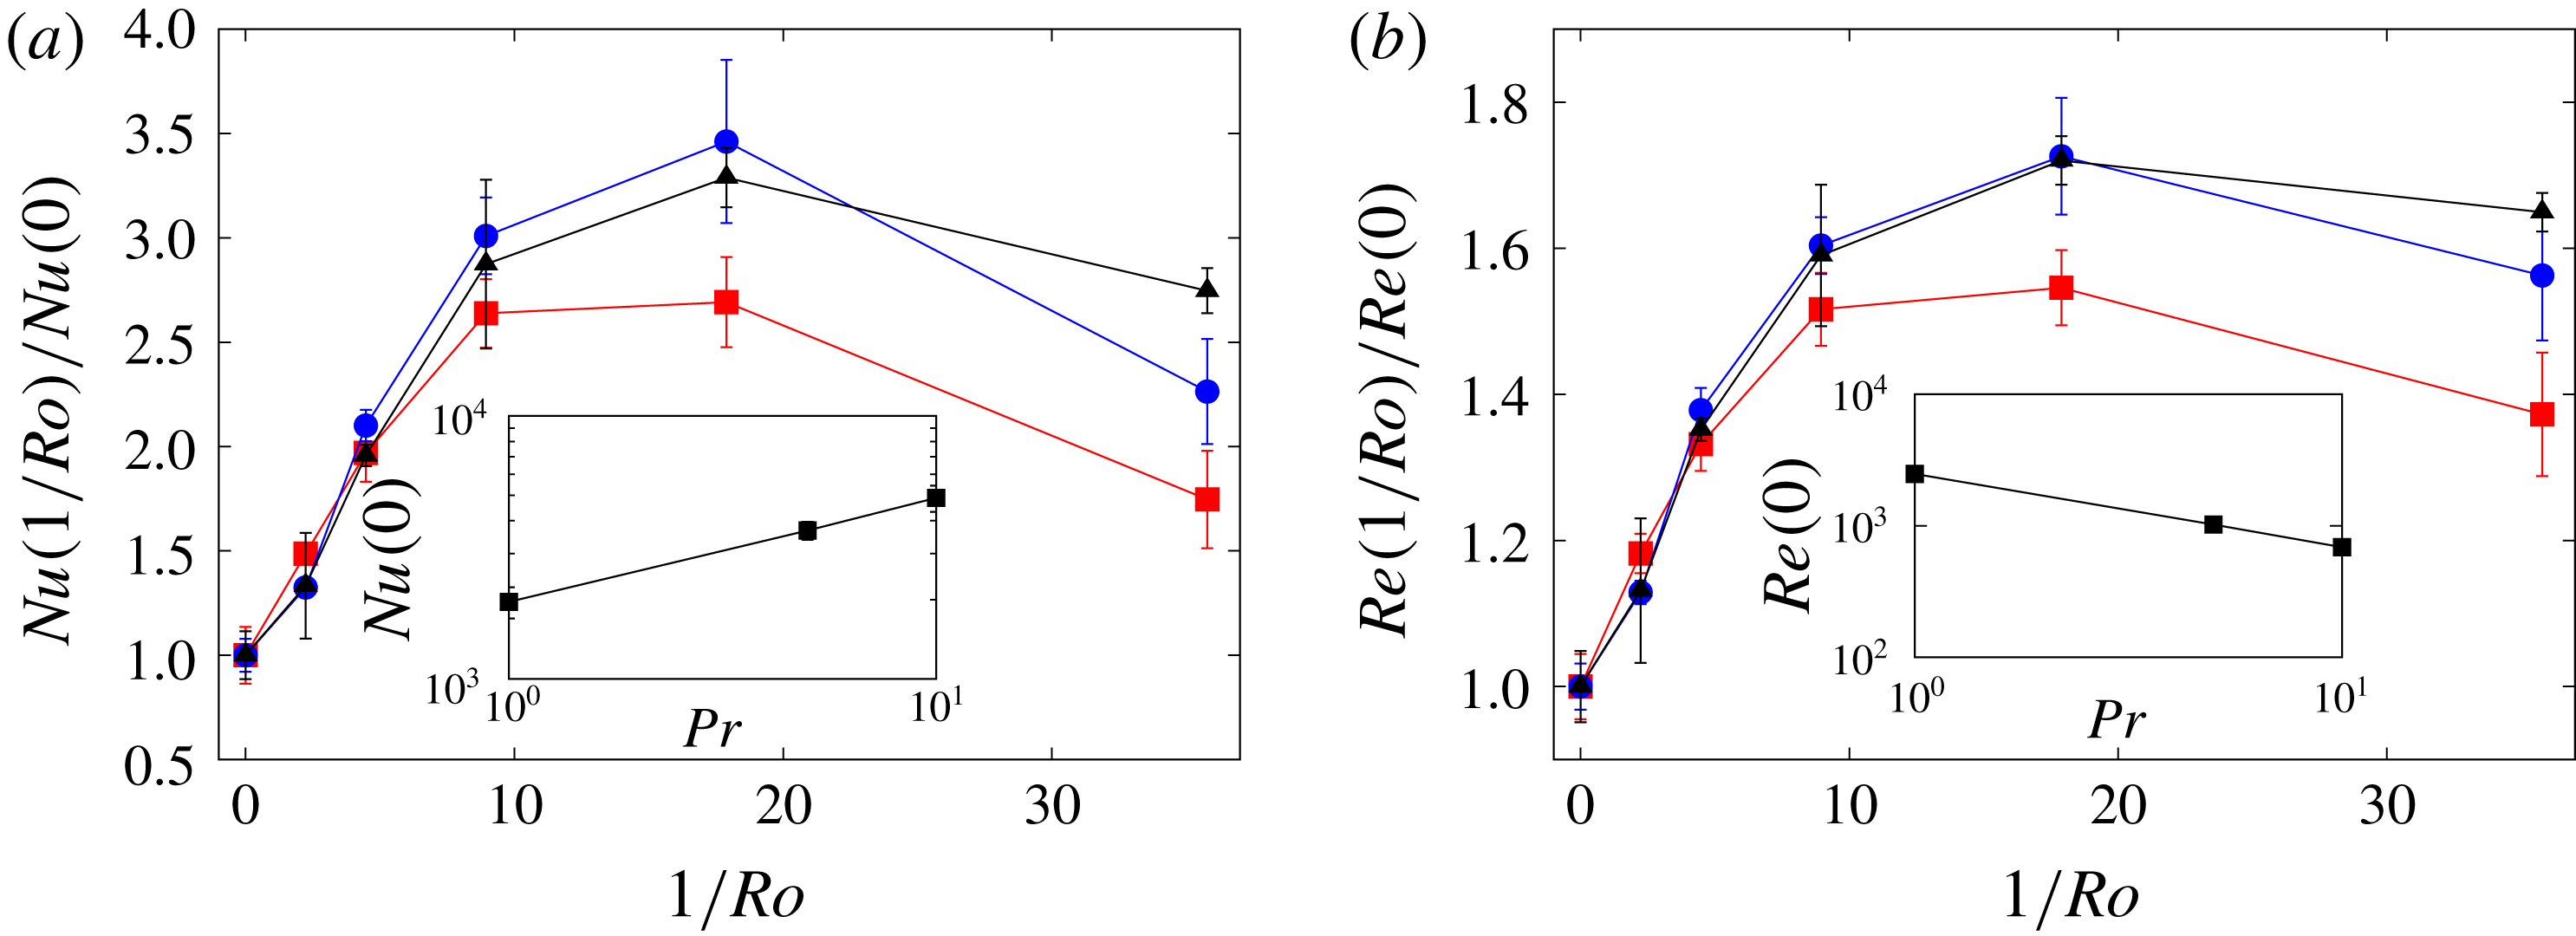
Values of
 $Nu$
(a) and
 $Re$
(b) as a function of
 $1/Ro$
normalized with the value at
 $1/Ro=0$
for simulations at
 $Ra=2.2\times 10^{7}$
and
 $Pr=1$
(red squares),
 $Pr=5$
(blue circles) and
 $Pr=10$
(black triangles). The insets show the values of
 $Nu$
and
 $Re$
in the absence of rotation (
 $1/Ro=0$
) as a function of
 $Pr$
. The lines represent the scaling
 $Nu(0)\propto Pr^{0.40}$
and
 $Re(0)\propto Pr^{-0.55}$
.

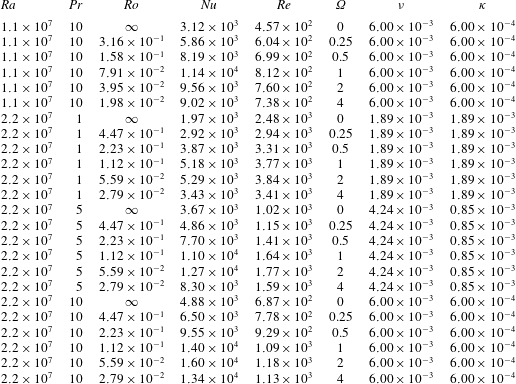
Parameters of the numerical simulations.

We found that average quantities such as
 $Re$
and
 $Nu$
display strong fluctuations in the time series.
Therefore, as a measure of the error on the time average of these quantities we use the maximum fluctuation of the running average computed on the second half of the time series.
3 Nusselt and Reynolds number dependence on rotation
In order to study the effects of the Coriolis force on the heat transfer and the turbulence intensity, we first consider the dependence of
 $Nu$
and
 $Re$
on the rotation number
 $1/Ro$
for different values of
 $Pr$
. In figure 1 we report the values of
 $Nu$
and
 $Re$
rescaled on their respective values in the absence of rotation (
 $1/Ro=0$
) for the simulations at
 $Re=2.2\times 10^{7}$
. We find a non-monotonic dependence: the heat transfer (measured by
 $Nu$
) and the turbulence intensity (quantified by
 $Re$
) increase with the rotation rate and they attain a maximum for an optimal value of
 $Ro\approx 6\times 10^{-2}$
. For stronger rotation rates they decrease slowly. The relative variation with respect to the non-rotating case (
 $Nu(0)$
) is larger for the cases
 $Pr=5$
and
 $Pr=10$
.
The non-monotonic behaviour of
 $Nu$
and
 $Re$
as a function of
 $Ro$
, as well as the dependence on
 $Pr$
, is qualitatively similar to what has been reported in previous works for the case of turbulent RB convection (Zhong et al.
Reference Zhong, Stevens, Clercx, Verzicco, Lohse and Ahlers2009; Stevens, Clercx & Lohse Reference Stevens, Clercx and Lohse2010a
; Stevens et al.
Reference Stevens, Overkamp, Lohse and Clercx2011; Stevens, Clercx & Lohse Reference Stevens, Clercx and Lohse2013). The main difference between the RB case is the magnitude of the heat transfer enhancement: in our simulations of BTC we observe a maximum relative increase of
 $Nu$
of a factor 3.5. This enhancement is much larger than the increase of a factor 1.1–1.2 which has been observed in the RB case for
 $Ra$
in the range of
 $10^{8}{-}10^{9}$
(Stevens et al.
Reference Stevens, Clercx and Lohse2013). Moreover, the decay at large rotation rates is much slower in BTC case than in RB case. It is worth noticing that the mechanisms from which the heat transfer enhancement originates are different in RB and BTC: in the case of the RB convection, the increase of
 $Nu$
is mostly due to the effects of the rotation on the boundary layers. The latter are absent on the BTC case, which is dominated by bulk effects.
In the absence of rotation, the scalings of
 $Nu(0)$
and
 $Re(0)$
as a function of
 $Pr$
observed in our simulations are
 $Nu(0)\propto Pr^{0.40}$
and
 $Re(0)\propto Pr^{-0.55}$
(see inset of figure 1) The scaling exponents are close to those predicted for the ultimate state of turbulent convection
 $Nu\propto Ra^{1/2}Pr^{1/2}$
and
 $Re\propto Ra^{1/2}Pr^{-1/2}$
(Kraichnan Reference Kraichnan1962) and they are in agreement with previous numerical results for the RB case (Calzavarini et al.
Reference Calzavarini, Lohse, Toschi and Tripiccione2005).
We do not observe a strong dependence on
 $Ra$
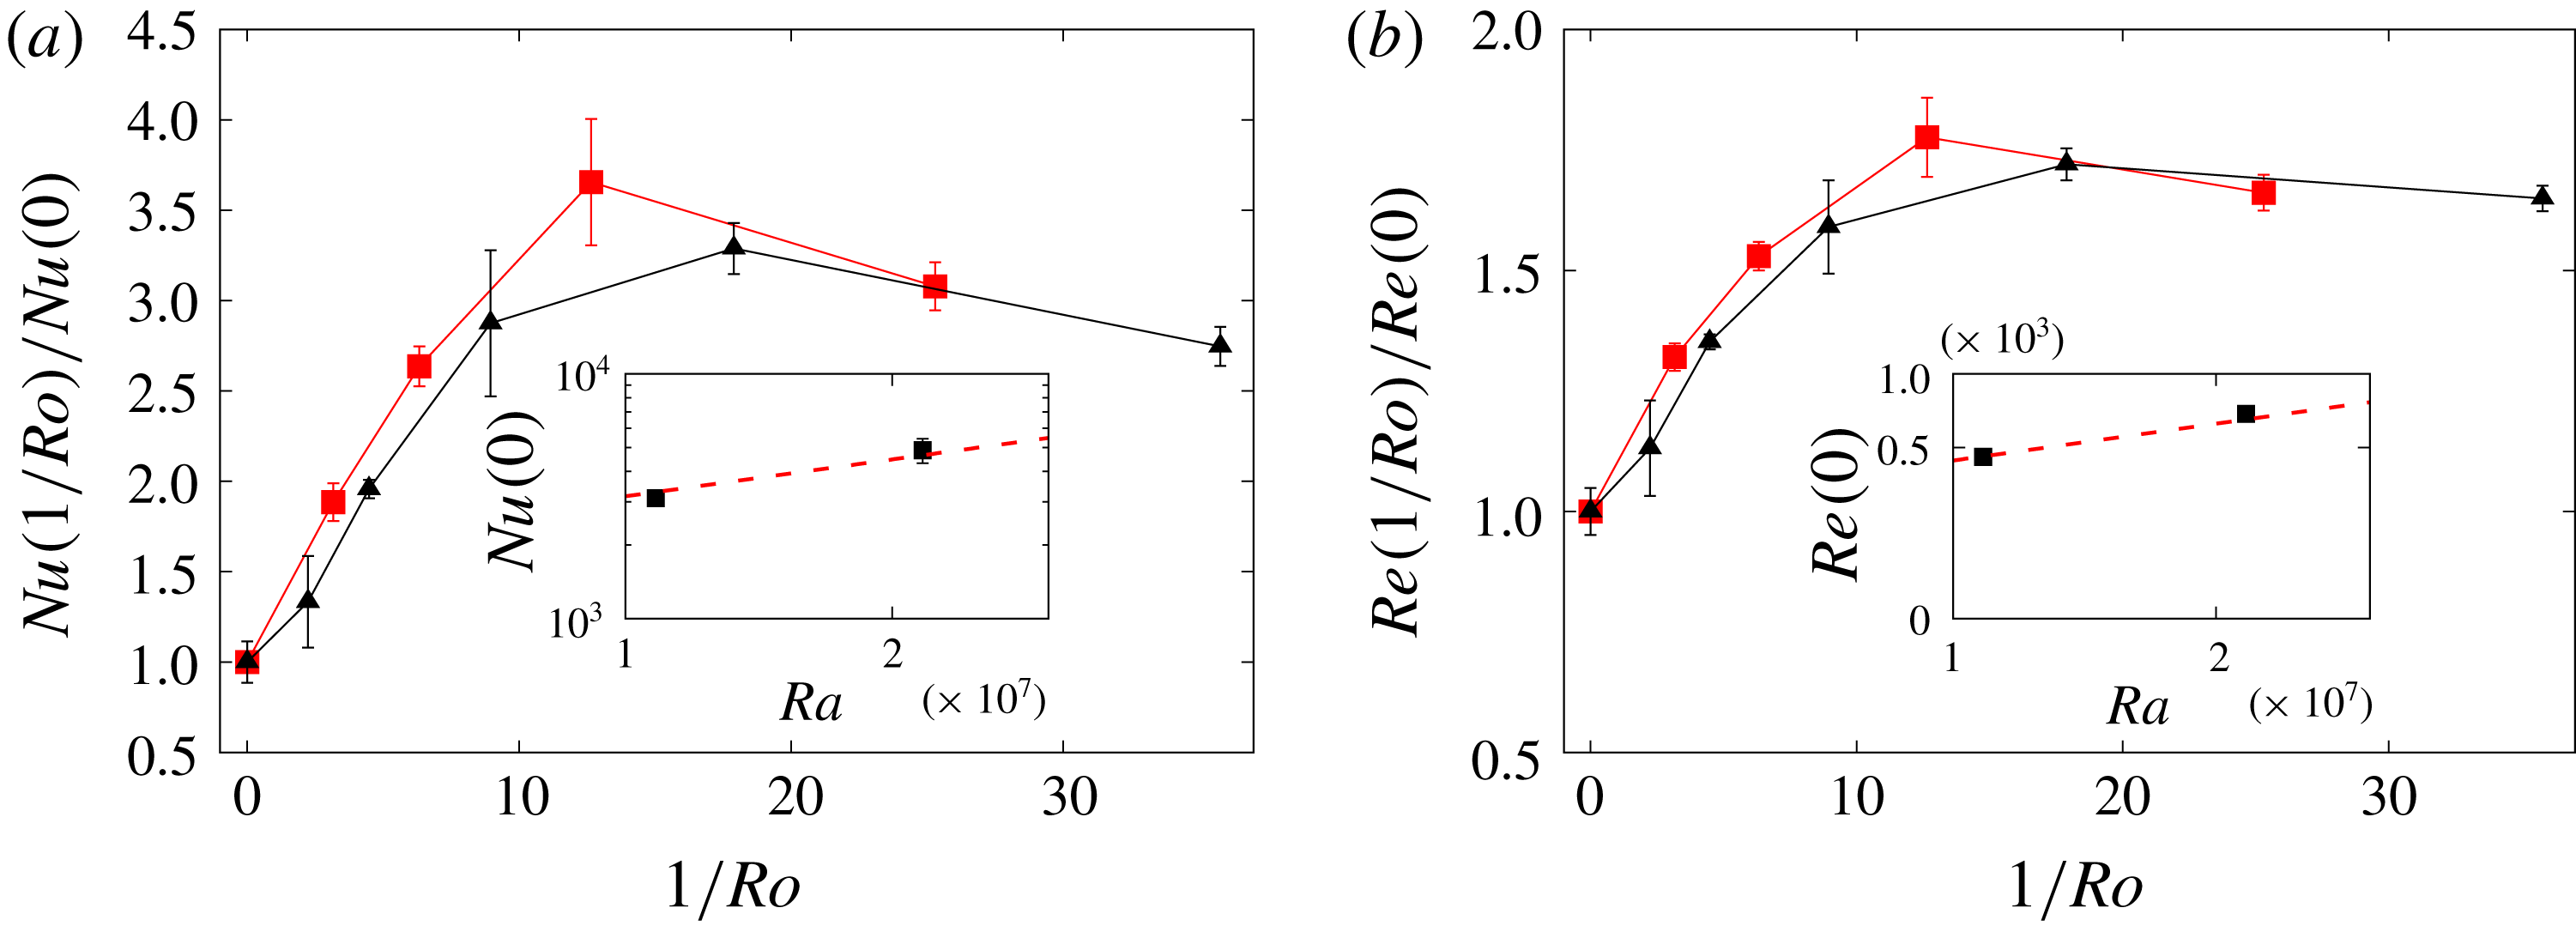
for the rotation effects on the heat transfer and turbulent intensity. The curves of
 $Nu/Nu(0)$
and
 $Re/Re(0)$
measured for
 $Pr=10$
at
 $Ra=1.1\times 10^{7}$
and
 $Ra=2.2\times 10^{7}$
are comparable within the error bars (see figure 2). The only exception are the values of
 $Nu$
and
 $Re$
of the simulation at
 $Ra=1.1\times 10^{7}$
,
 $Ro=7.91\times 10^{-2}$
. The inspection of the time series of this simulation reveals that these anomalous values are due to a single event of strong convection that influenced the entire statistics. In the absence of rotation, the dependence of
 $Nu(0)$
and
 $Re(0)$
on
 $Ra$
is in agreement with the ultimate-state scaling laws
 $Nu(0)\propto Ra^{0.5}$
and
 $Re(0)\propto Ra^{0.5}$
.
Values of
 $Nu$
(a) and
 $Re$
(b) as a function of
 $1/Ro$
normalized with the value at
 $1/Ro=0$
for simulations at
 $Ra=1.1\times 10^{7}$
(red squares) and
 $Ra=2.2\times 10^{7}$
(black triangles) for the case
 $Pr=10$
. The insets show the values of
 $Nu$
(
 $Re$
) in the absence of rotation (
 $1/Ro=0$
) as a function of
 $Ra$
. The dashed red lines represent the scaling
 $Nu(0)\propto Ra^{1/2}$
and
 $Re(0)\propto Ra^{1/2}$
.

The anisotropy between the horizontal and vertical velocity can be quantified by introducing the horizontal and vertical Reynold numbers defined respectively as,
 $$\begin{eqnarray}Re_{H}=\frac{u_{rms}L}{\unicode[STIX]{x1D708}},\quad Re_{V}=\frac{w_{rms}L}{\unicode[STIX]{x1D708}},\end{eqnarray}$$
where
 $_{rms}$
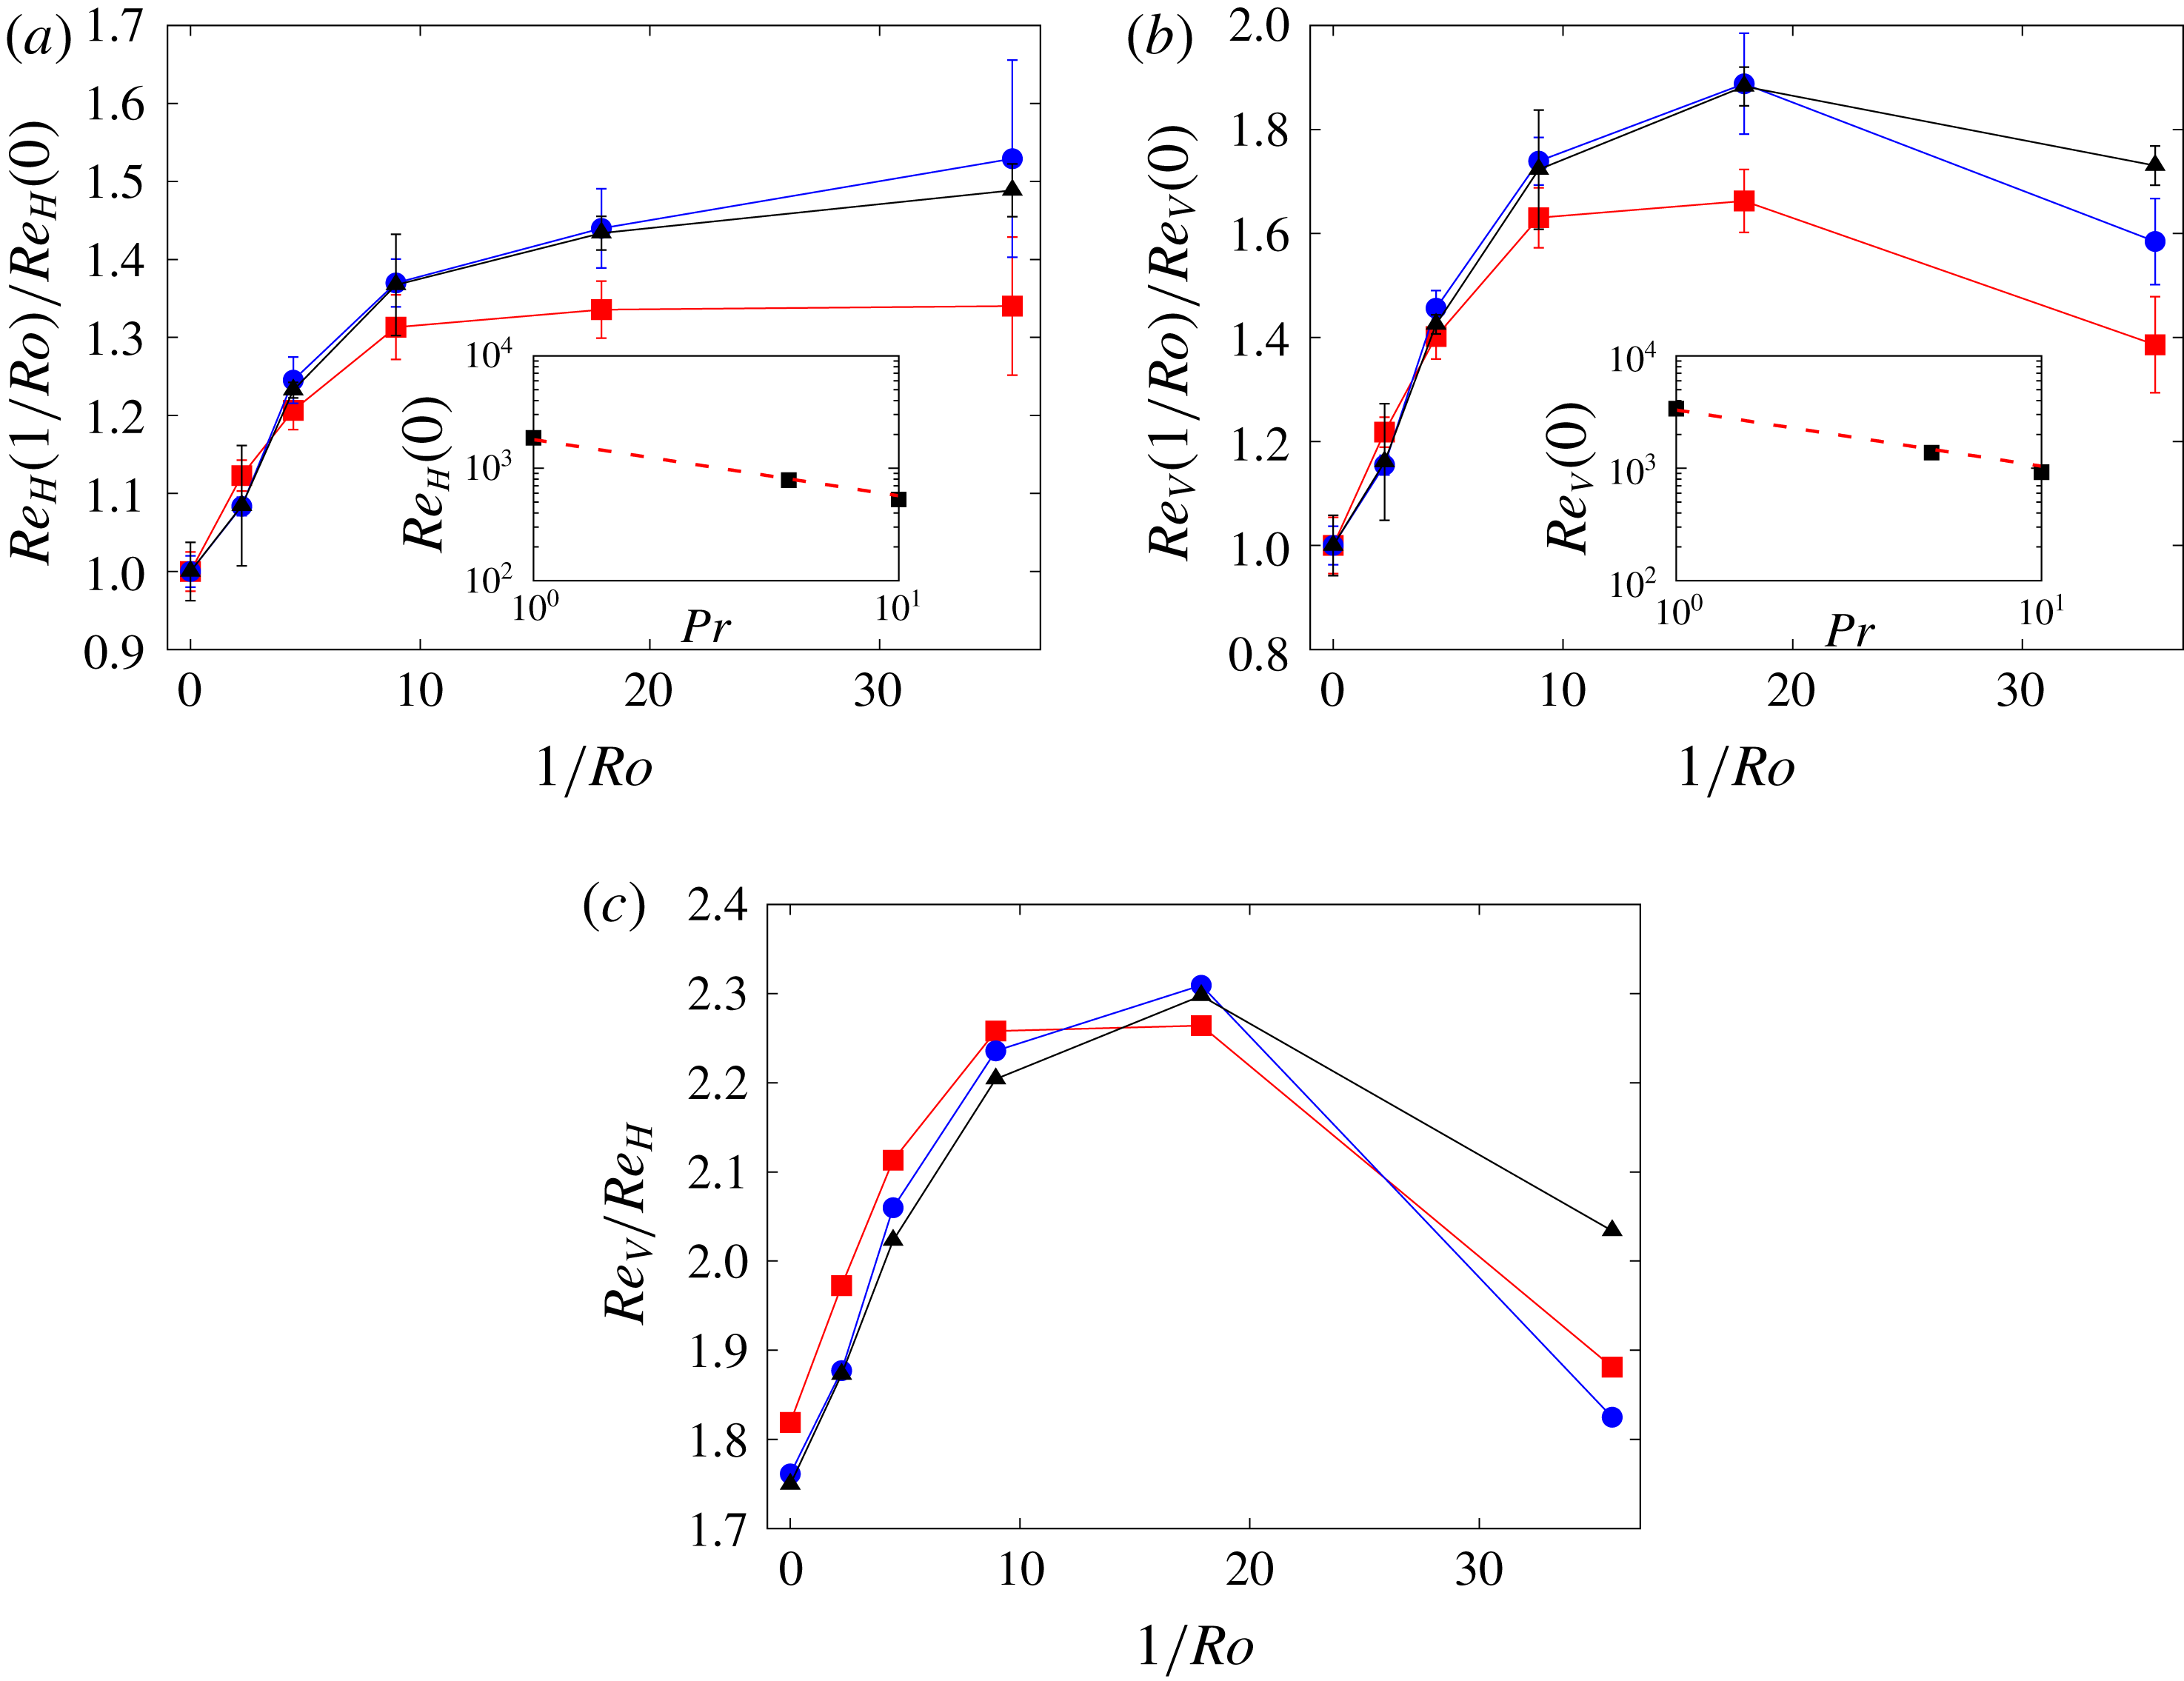
indicates the root mean square. In the absence of rotation the dependence of
 $Re_{H}$
and
 $Re_{V}$
on
 $Pr$
is in agreement with the ultimate-state scalings
 $Re_{H,V}\propto Pr^{-1/2}$
(see insets of figure 3). The behaviour of
 $Re_{V}$
as a function of
 $1/Ro$
is non-monotonic and it is similar to the behaviour of the total Reynolds number, while the
 $Re_{H}$
shows a weaker monotonic increase. In figure 3 we also show the ratio
 $Re_{V}/Re_{H}$
, which gives information on the anisotropy between the vertical and horizontal velocities. The anisotropy, which is present already at
 $1/Ro=0$
, is enhanced by rotation and attains a maximum for
 $Ro\approx 6\times 10^{-2}$
.
(a,b) Values of
 $Re_{H}$
(a) and
 $Re_{V}$
(b) as a function of
 $1/Ro$
normalized with the value at
 $1/Ro=0$
for simulations at
 $Ra=2.2\times 10^{7}$
and
 $Pr=1$
(red squares),
 $Pr=5$
(blue circles) and
 $Pr=10$
(black triangles). The insets show the values of
 $Re_{H}$
and
 $Re_{V}$
in the absence of rotation (
 $1/Ro=0$
) as a function of
 $Pr$
. The dashed lines represent the scaling
 $Re_{H,V}(0)\propto Pr^{-1/2}$
. (c) The ratio
 $Re_{V}/Re_{H}$
as a function of
 $1/Ro$
for simulations at
 $Ra=2.2\times 10^{7}$
and
 $Pr=1$
(red squares),
 $Pr=5$
(blue circles) and
 $Pr=10$
(black triangles).

Besides, following Boffetta, Mazzino & Musacchio (Reference Boffetta, Mazzino and Musacchio2011) we decompose the Nusselt number as the product of three different contributions,
 $$\begin{eqnarray}Nu=\frac{w_{rms}\unicode[STIX]{x1D703}_{rms}C_{w,\unicode[STIX]{x1D703}}}{\unicode[STIX]{x1D705}\unicode[STIX]{x1D6FE}}+1,\end{eqnarray}$$
where
 $C_{w,\unicode[STIX]{x1D703}}=\langle w\unicode[STIX]{x1D703}\rangle /(w_{rms}\unicode[STIX]{x1D703}_{rms})$
is the correlation between the vertical velocity component
 $w$
and the temperature field
 $\unicode[STIX]{x1D703}$
. All the three factors which contribute to
 $Nu$
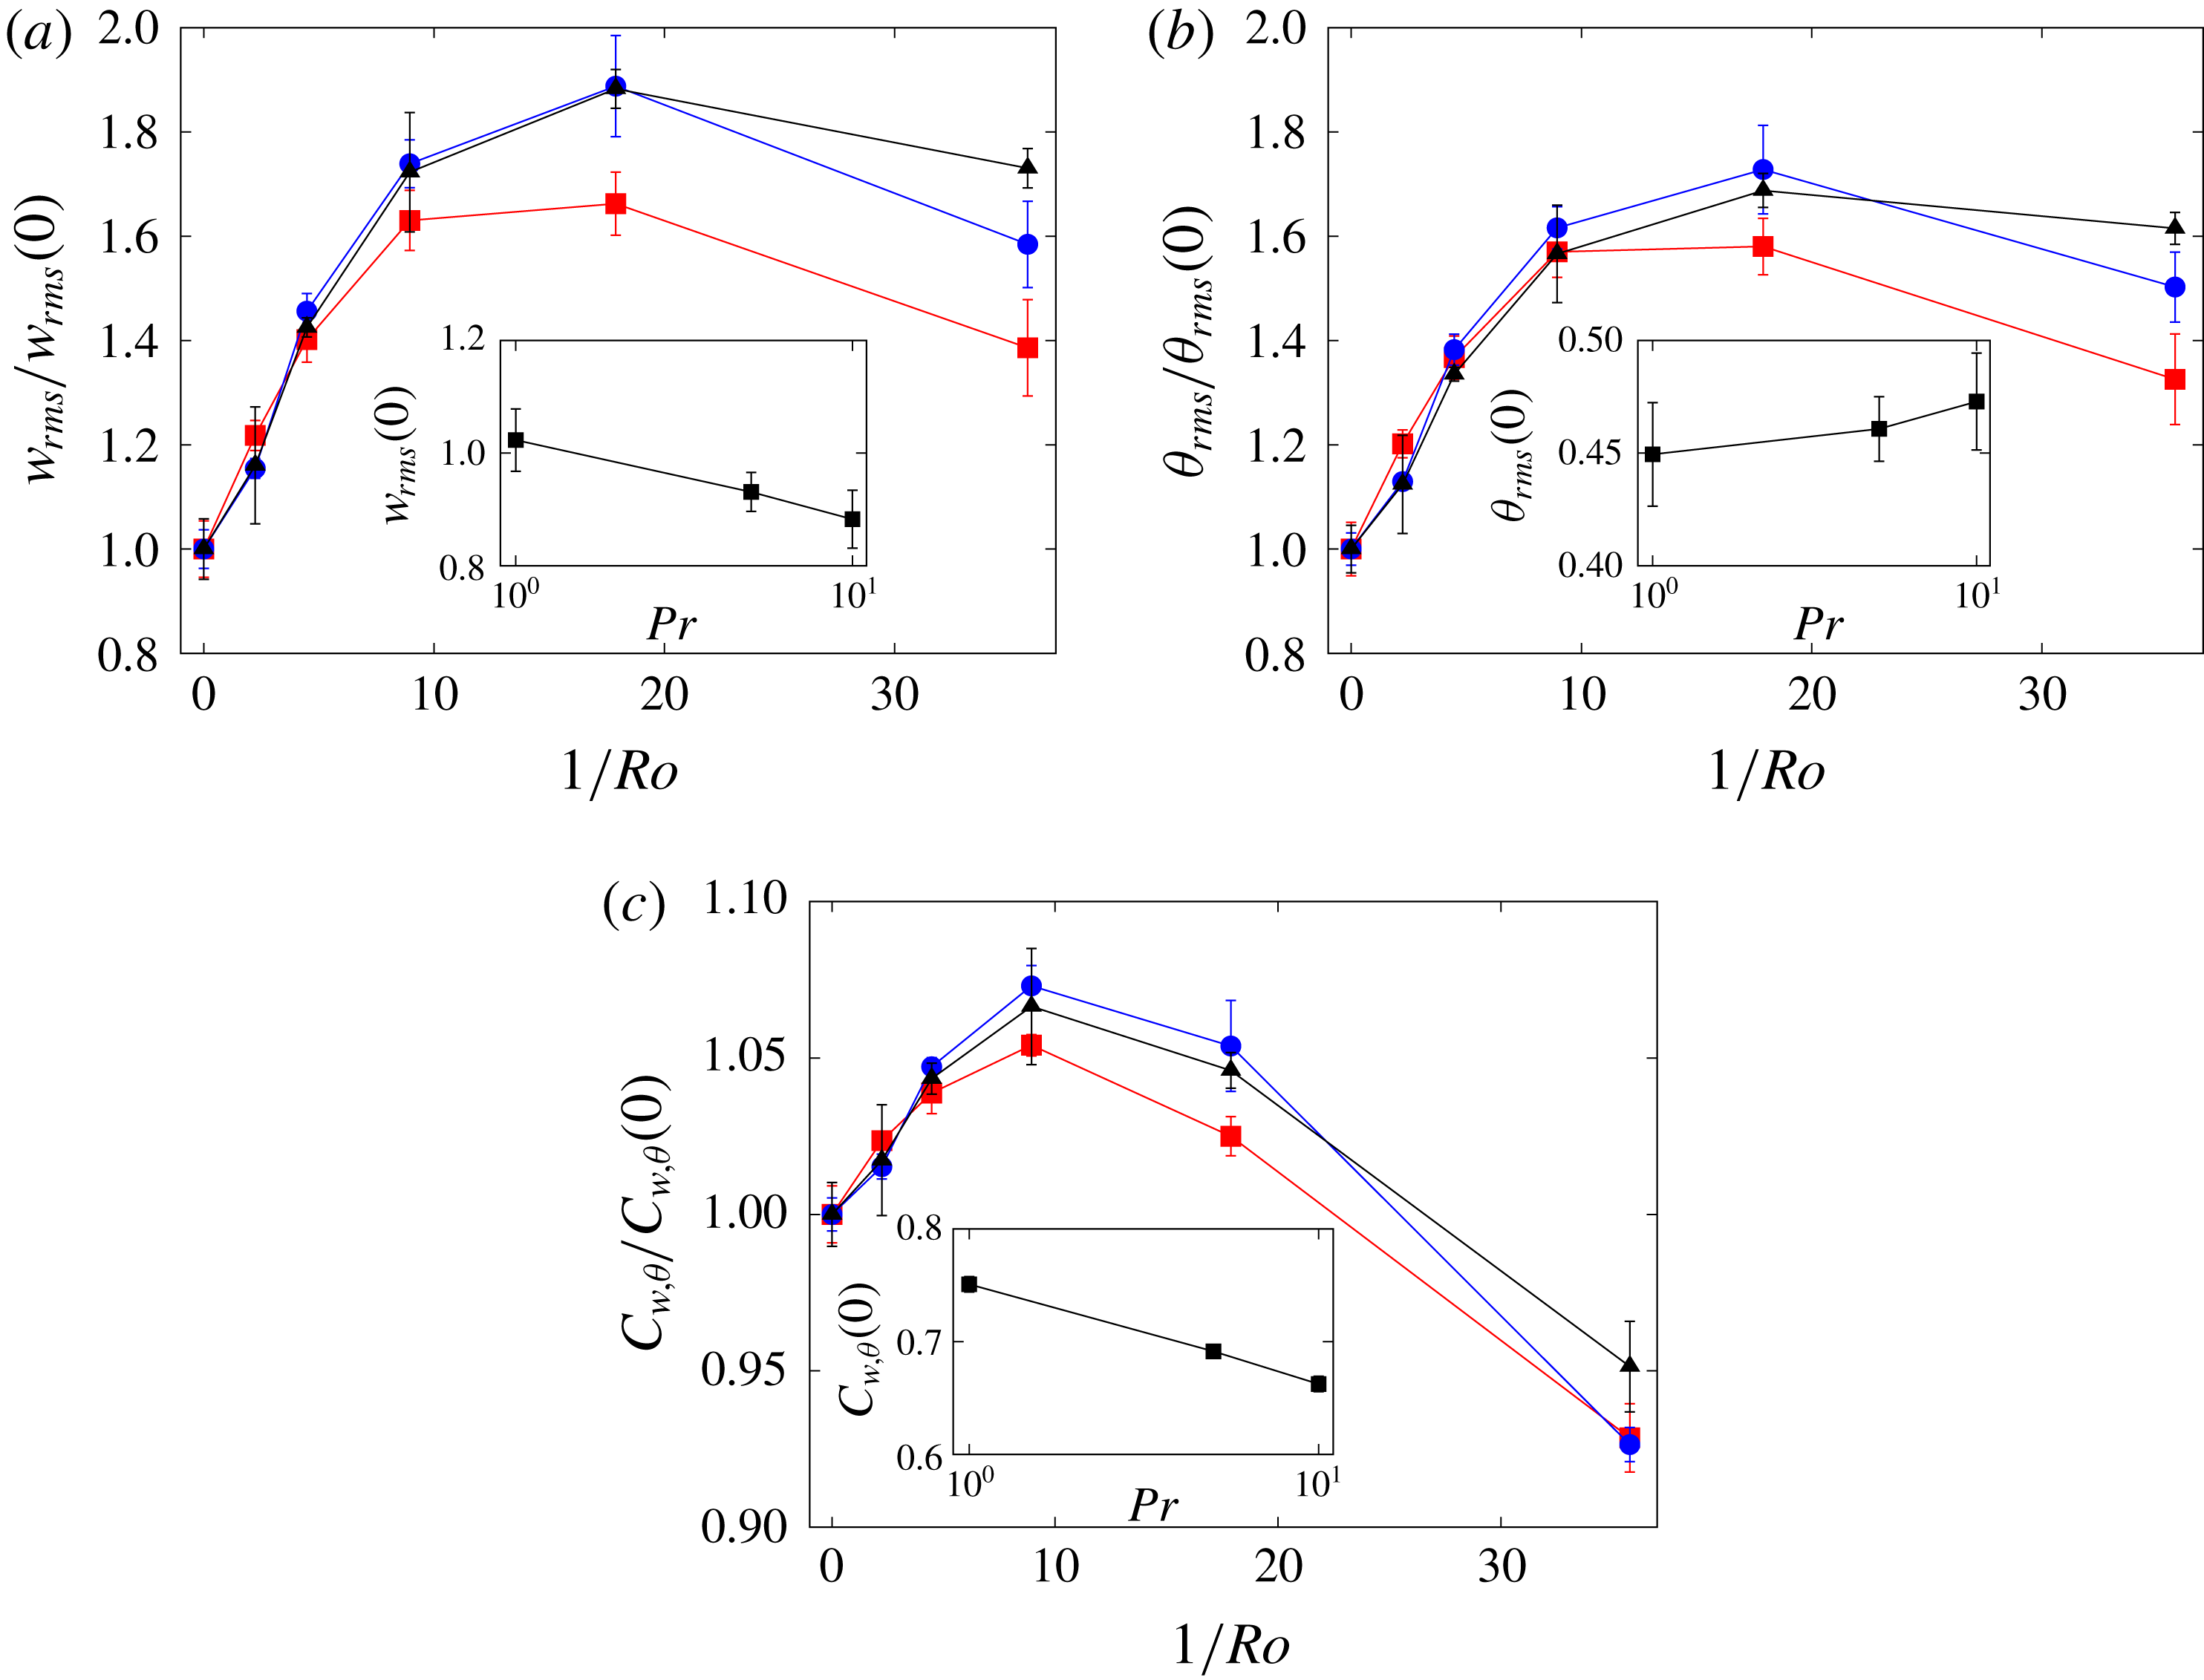
display a non-monotonic dependence on the rotation rate (see figure 4). The largest variations are observed for the root mean square fluctuations of the vertical velocity and the temperature, which for
 $Ro=5.59\times 10^{-2}$
are approximately 80 % larger than in the case
 $Ro=\infty$
. The variation of the correlation
 $C_{w,\unicode[STIX]{x1D703}}$
is considerably smaller.
Contributions to
 $Nu$
:
 $w_{rms}$
(a),
 $\unicode[STIX]{x1D703}_{rms}$
(b) and
 $C_{w,\unicode[STIX]{x1D703}}$
(c) as a function of
 $1/Ro$
normalized with their values at
 $1/Ro=0$
for simulations at
 $Ra=2.2\times 10^{7}$
and
 $Pr=1$
(red squares),
 $Pr=5$
(blue circles) and
 $Pr=10$
(black triangles). The insets show the values of
 $w_{rms}(0)$
,
 $\unicode[STIX]{x1D703}_{rms}(0)$
and
 $C_{w,\unicode[STIX]{x1D703}}(0)$
in the absence of rotation as a function of
 $Pr$
.

The dependence on
 $Pr$
of
 $w_{rms}$
,
 $\unicode[STIX]{x1D703}_{rms}$
and
 $C_{w,\unicode[STIX]{x1D703}}$
in the absence of rotation (shown in the insets of figure 4) has a simple physical interpretation. In order to increase
 $Pr$
keeping
 $Ra$
fixed, one has to increase the kinematic viscosity as
 $\unicode[STIX]{x1D708}\propto Pr^{1/2}$
and to decrease the thermal diffusivity as
 $\unicode[STIX]{x1D705}\propto Pr^{-1/2}$
. The increase of the viscosity suppresses the velocity fluctuations at small scales, and therefore causes a decrease of
 $w_{rms}$
. Conversely, the reduction of the thermal diffusivity allows for the development of small-scale temperature fluctuations, and therefore causes an increase of
 $\unicode[STIX]{x1D703}_{rms}$
. The opposite behaviour of the small-scale structures of the velocity and temperature fields at increasing
 $Pr$
causes the decrease of the correlation
 $C_{w,\unicode[STIX]{x1D703}}$
.
4 Columnar convective structures
The time series of the Nusselt number obtained in our simulations are characterized by strong fluctuations, which correspond to events of weak/strong convection. The standard deviation of these fluctuations is of the order of 50 % of their mean values, defined as the time average over the duration of the simulations (and corresponding to the values reported in the previous section).
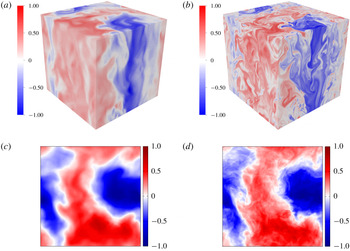
(a,b) Vertical velocity field
 $w$
(a) and temperature fluctuation field
 $\unicode[STIX]{x1D703}$
(b) during a strong convective event at time
 $t=80\unicode[STIX]{x1D70F}$
in the simulation with
 $Ra=2.2\times 10^{7}$
,
 $Pr=10$
and
 $Ro=5.59\times 10^{-2}$
. (c,d) Two-dimensional fields
 $w^{2D}$
(a) and
 $\unicode[STIX]{x1D703}^{2D}$
(b) obtained by averaging the fields
 $w$
and
 $\unicode[STIX]{x1D703}$
shown above along the vertical direction. Fields are rescaled with maxima of absolute values.

We have found that, in the rotating cases, the events of strong convection are related to the formation of columnar structures aligned with the rotation axis, which are present both in the temperature field and in the vertical velocity field. As an example, we show in figure 5 the field
 $\unicode[STIX]{x1D703}$
and
 $w$
at time
 $t=80\unicode[STIX]{x1D70F}$
, corresponding to a local maximum of the time series of
 $Nu$
in the simulation with
 $Ra=2.2\times 10^{7}$
,
 $Pr=10$
and
 $Ro=5.59\times 10^{-2}$
.
The presence of quasi-two-dimensional columnar structures is a distinctive feature of rotating turbulence, and has been observed both in experiments (Hopfinger, Browand & Gagne Reference Hopfinger, Browand and Gagne1982; Staplehurst, Davidson & Dalziel Reference Staplehurst, Davidson and Dalziel2008; Gallet et al. Reference Gallet, Campagne, Cortet and Moisy2014) and numerical simulations (Yeung & Zhou Reference Yeung and Zhou1998; Yoshimatsu, Midorikawa & Kaneda Reference Yoshimatsu, Midorikawa and Kaneda2011; Biferale et al. Reference Biferale, Bonaccorso, Mazzitelli, van Hinsberg, Lanotte, Musacchio, Perlekar and Toschi2016). The formation of columnar structures has been reported also on the case of RB convection by Kunnen, Clercx & Geurts (Reference Kunnen, Clercx and Geurts2010). In the case of BTC we observe a significant correlation between hot (cold) regions and rising (falling) regions in the core of these structures, which results in a strong increase of the heat flux.
In order to investigate quantitatively this phenomenon we proceed as follows. First, we measure the degree of bidimensionalization of the system during an event of strong convection, by studying how much the velocity and temperature fields (at fixed time) are correlated in the vertical direction. For this purpose, we compute the vertical correlation function of
 $u$
,
 $w$
,
 $\unicode[STIX]{x1D703}$
and the
 $z$
-component of the vorticity
 $\unicode[STIX]{x1D714}_{z}$
,
 $$\begin{eqnarray}\displaystyle & C_{u}(r)=\langle u(\boldsymbol{x}+r\hat{\boldsymbol{e}}_{\mathbf{3}})u(\boldsymbol{x})\rangle , & \displaystyle\end{eqnarray}$$
 $$\begin{eqnarray}\displaystyle & C_{w}(r)=\langle w(\boldsymbol{x}+r\hat{\boldsymbol{e}}_{\mathbf{3}})w(\boldsymbol{x})\rangle , & \displaystyle\end{eqnarray}$$
 $$\begin{eqnarray}\displaystyle & C_{\unicode[STIX]{x1D703}}(r)=\langle \unicode[STIX]{x1D703}(\boldsymbol{x}+r\hat{\boldsymbol{e}}_{\mathbf{3}})\unicode[STIX]{x1D703}(\boldsymbol{x})\rangle , & \displaystyle\end{eqnarray}$$
 $$\begin{eqnarray}\displaystyle & C_{\unicode[STIX]{x1D714}_{z}}(r)=\langle \unicode[STIX]{x1D714}_{z}(\boldsymbol{x}+r\hat{\boldsymbol{e}}_{\mathbf{3}})\unicode[STIX]{x1D714}_{z}(\boldsymbol{x})\rangle . & \displaystyle\end{eqnarray}$$
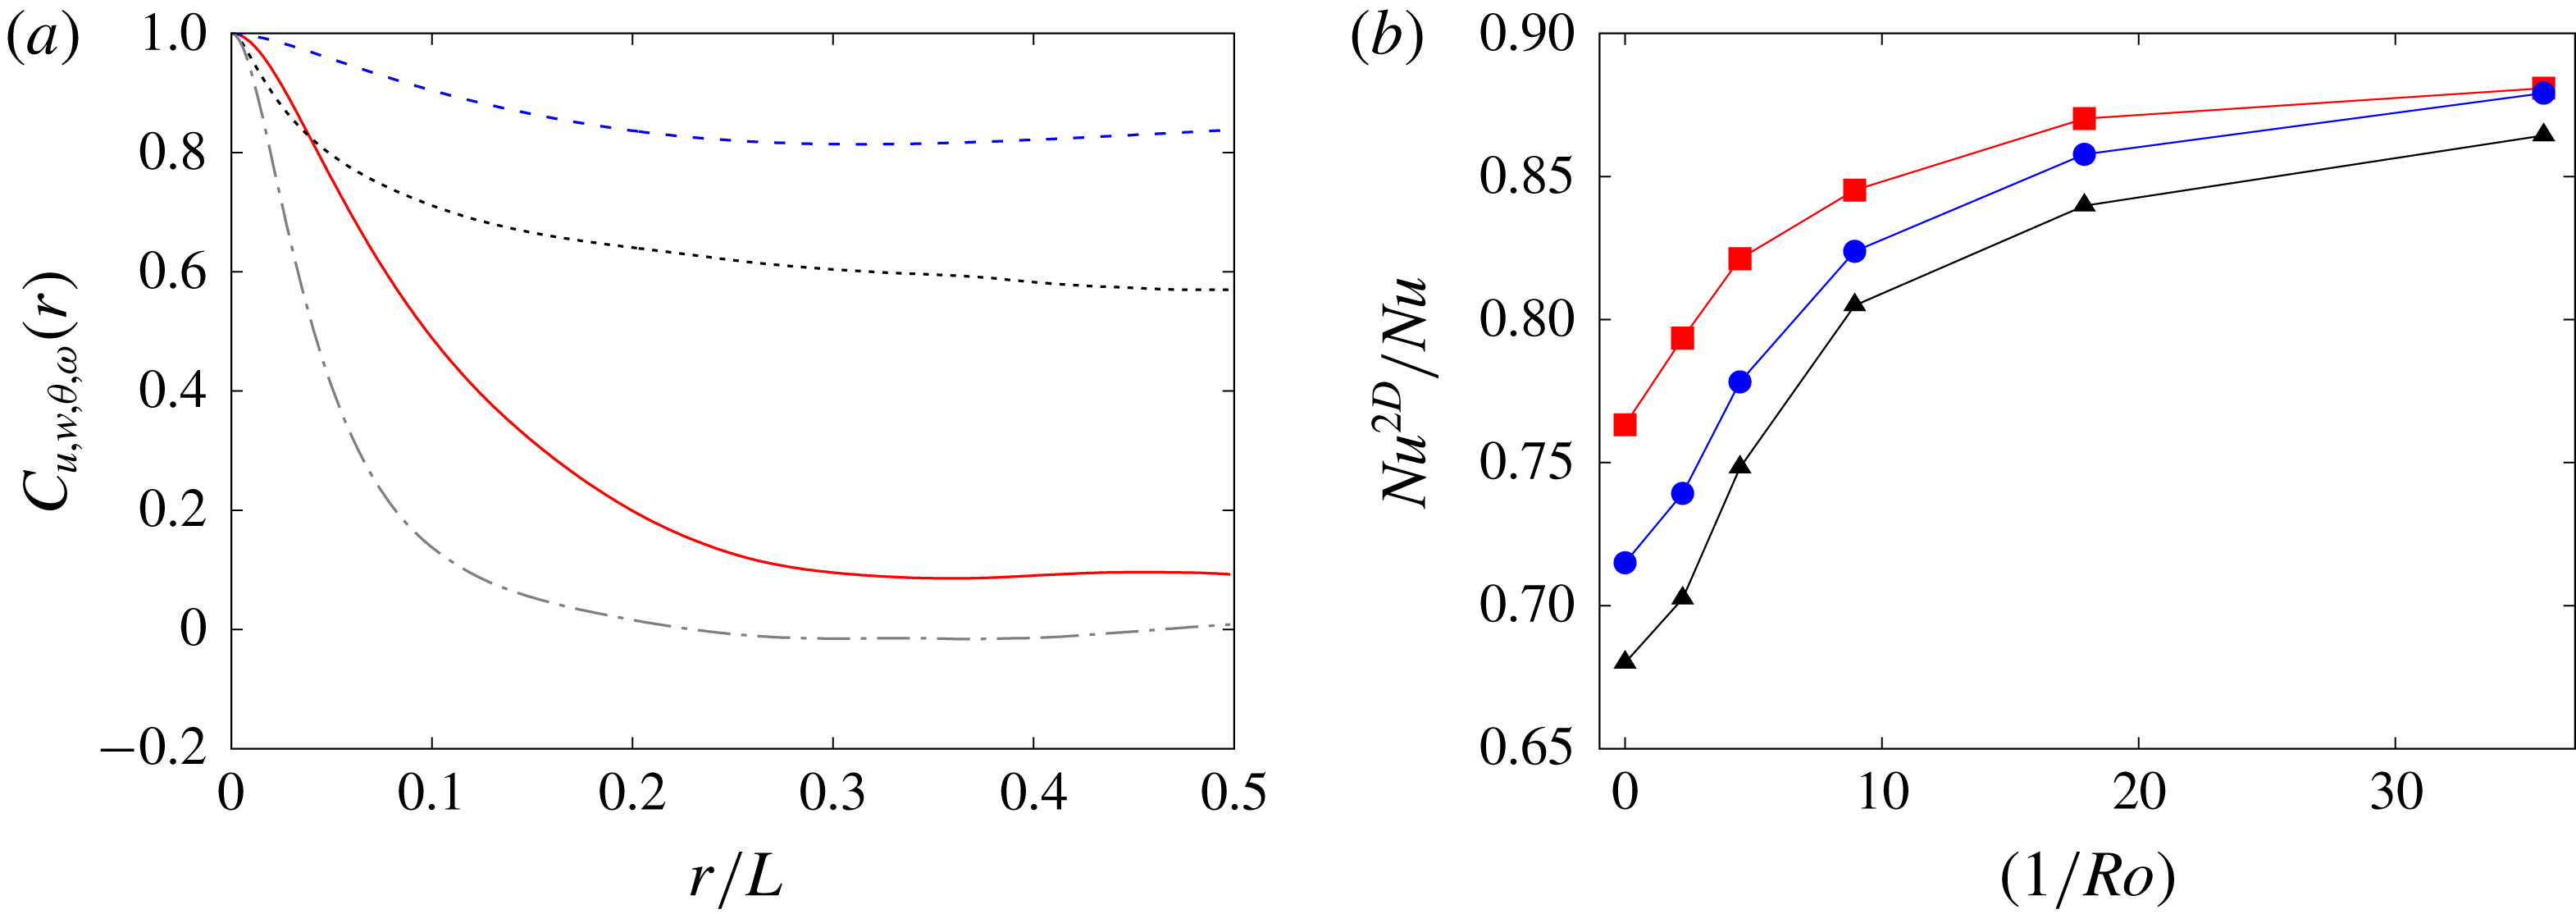
In figure 6 we show a comparison of the vertical correlation functions computed in the case of the simulation with
 $Ra=2.2\times 10^{7}$
,
 $Pr=10$
and
 $Ro=5.59\times 10^{-2}$
at the same time as that of figure 5 (
 $t=80\unicode[STIX]{x1D70F}$
). At variance with the typical columnar vortices observed in rotating turbulence, here we do not find a strong vertical correlation of the
 $z$
-component of the vorticity (see figure 6). Also the vertical correlation of the horizontal velocity
 $u$
decays at scales larger than
 $1/2$
of the box size. Conversely, the vertical velocity
 $w$
and the temperature fields
 $\unicode[STIX]{x1D703}$
remain correlated through the whole domain.
(a) Correlation function of horizontal velocity
 $C_{u}(r)$
(red line), vertical velocity
 $C_{w}(r)$
(blue dashed line), temperature
 $C_{\unicode[STIX]{x1D703}}(r)$
(black dotted line) and vertical vorticity
 $C_{\unicode[STIX]{x1D714}_{z}}(r)$
(grey dash-dotted line) at time
 $t=80\unicode[STIX]{x1D70F}$
for
 $Ra=2.2\times 10^{7}$
,
 $Pr=10$
and
 $Ro=5.59\times 10^{-2}$
. (b) Ratio
 $Nu^{2D}/Nu$
as a function of
 $1/Ro$
for
 $Ra=2.2\times 10^{7}$
,
 $Pr=1$
(red squares),
 $Pr=5$
(blue circles) and
 $Pr=10$
(black triangles).

This long-scale, vertical correlation leads us to introduce the two-dimensional fields
 $w^{2D}=\langle w\rangle _{z}$
and
 $\unicode[STIX]{x1D703}^{2D}=\langle \unicode[STIX]{x1D703}\rangle _{z}$
, defined as the average along the vertical direction of the respective three-dimensional fields. In figure 5(c,d) we show the two-dimensional (2-D) fields of
 $w^{2D}$
and
 $\unicode[STIX]{x1D703}^{2D}$
obtained for the simulation at
 $Ra=2.2\times 10^{7}$
,
 $Pr=10$
and
 $Ro=5.59\times 10^{-2}$
at time
 $t=80\unicode[STIX]{x1D70F}$
, which confirm the spatial correlation between the hot (cold) regions and the rising (falling) regions also in the vertically averaged fields.
Despite the lack of a strong vertical correlation of
 $\unicode[STIX]{x1D714}_{z}$
, the inspection of the 2-D field
 $\unicode[STIX]{x1D714}_{z}^{2D}=\langle \unicode[STIX]{x1D714}_{z}\rangle _{z}$
reveals a connection between the regions of intense heat flux, which can be identified as thermal convective columns, and cyclonic regions, i.e. those which rotates in the same direction of
 $\unicode[STIX]{x1D734}$
. It is possible that the preferential link between convective structures and cyclones could be related with the cyclonic–anticyclonic asymmetry which is observed in rotating turbulence (for a recent review on rotating turbulence see Godeferd & Moisy (Reference Godeferd and Moisy2015)).
Finally, we introduce the 2-D Nusselt number defined in terms of the 2-D fields as,
 $$\begin{eqnarray}Nu^{2D}=\left\langle \frac{\langle w\rangle _{z}\langle \unicode[STIX]{x1D703}\rangle _{z}}{\unicode[STIX]{x1D705}\unicode[STIX]{x1D6FE}}\right\rangle _{x,y},\end{eqnarray}$$
where
 $\langle \cdots \rangle _{x,y}$
is the average over the horizontal directions
 $x$
and
 $y$
. The physical meaning of the ratio
 $Nu^{2D}/Nu$
is the relative contribution of the 2-D modes, i.e. of the columnar structures, to the total heat transport. In figure 6 we show the ratio
 $Nu^{2D}/Nu$
for the various
 $Pr$
and
 $Ro$
simulations at
 $Ra=2.2\times 10^{7}$
. The increase of
 $Nu^{2D}/Nu$
with the rotation rate demonstrates that in the limit of vanishing
 $Ro$
the heat transport is dominated by the 2-D modes. We also observe a systematic trend as a function of
 $Pr$
: increasing
 $Pr$
reduces the contribution of the 2-D modes to the heat flux. This effect can be understood in terms of the reduced spatial correlation between the fields
 $w$
and
 $\unicode[STIX]{x1D703}$
at increasing
 $Pr$
, as discussed in the previous section (see figure 4 and the related discussion).
5 Conclusions
We have investigated the behaviour of the bulk turbulence convection system in a rotating frame by performing extensive direct numerical simulations of the Boussinesq equations for an incompressible flow in a cubic box with periodic boundary conditions in all directions. In the absence of rotation, we confirmed the consistency of the both
 $Nu$
and
 $Re$
scaling with
 $Pr$
and
 $Ra$
numbers according to the ‘ultimate regime of thermal convection’ theory (Grossmann & Lohse Reference Grossmann and Lohse2000). In the presence of rotation, quantified by the Rossby number
 $Ro$
, we find a surprisingly strong enhancement of both
 $Nu$
and
 $Re$
for intermediate values of
 $Ro$
followed by moderate decreases for the largest
 $Ro$
investigated.
A detailed analysis of the temperature and velocity fields shows that the observed heat flux enhancement at intermediate rotation is due to the formation of columnar convective structures with strong correlations between temperature and vertical velocity.
The understanding of the mechanism behind this phenomenon is still incomplete. In the RB case the non-monotonic increase of
 $Nu$
is associated with the Ekman pumping and it depends on the modification of the boundary layer caused by rotation. Even if in BTC case the boundary layer is absent we still observe similarities with RB phenomenology. In particular we find a correlation between
 $Nu$
and vertical velocity variations. Further studies are required in order to improve our knowledge on this phenomenon.
Acknowledgements
We thank D. Lohse for stimulating discussions. We acknowledge support by the Departments of Excellence grant (MIUR). Moreover, HPC Center CINECA is gratefully acknowledged for computing resources (INFN-Cineca grant no. INF18-fldturb).