Implications
The implementation of the Welfare Quality® assessment system for fattening cattle in this study contributes to the knowledge on the state of animal welfare in beef bull farms in Europe. The study identified weaknesses in welfare in terms of diseases and social behaviour. We were also able to investigate how farmers respond when using different ways of feedback of results. Although welfare scores did not improve within a 6-month period, our results will contribute to further projects, aiming on implementation and improvement strategies on farm animal welfare in fattening cattle.
Introduction
European beef production systems are diverse, ranging from extensive, predominantly pasture-based fattening of steers and heifers, to intensive indoor bull-fattening systems (Scientific Committee on Animal Health and Animal Welfare (SCAHAW, 2001). Besides the specific council regulations for organic beef, No. 834/2007 (European Commission, 2007) and 889/2008 (European Commission, 2008), there is no EU legislation in force concerning the welfare of fattening cattle older than 6 months. However, in 1988, the Council of Europe adopted a recommendation concerning cattle including beef cattle by the Standing Committee of the Convention on the Protection of Animals Kept for Farming Purposes (Council of Europe, 1988). At the national level, welfare legislation may address minimum requirements for beef cattle, for example, in Austria (Tierschutzgesetz, 2004).
The limited extent of legal standards regarding beef production contrasts with numerous welfare concerns, as highlighted, for example, by SCAHAW (2001). These concerns refer mostly to practices regarding housing, feeding and management in intensive beef fattening. In a more recent review on the effects of floor quality and space allowance on the welfare of finishing beef cattle, Wechsler (Reference Wechsler2011) concluded that the SCAHAW recommendations from 2001 such as ‘Fully slatted concrete or wooden floors should not be used’ are still valid. Recent studies regarding welfare aspects in beef bulls focused on problems arising from feeding facilities (Gottardo et al., Reference Gottardo, Ricci, Preciso, Ravarotto and Council2004), cleanliness (Schulze Westerath et al., Reference Schulze Westerath, Gygax, Mayer and Wechsler2007; Tessitore et al., Reference Tessitore, Boukha, Guzzo and Cozzi2009), skin lesions (Platz et al., Reference Platz, Ahrens, Bahrs, Nuske and Erhard2007), agonistic and socio-positive behaviours, (Platz et al., Reference Platz, Ahrens, Bahrs, Nuske and Erhard2007) or human–animal relationship (Windschnurer et al., Reference Windschnurer, Boivin and Waiblinger2009). To the best of our knowledge, besides studies in Italy (Gottardo et al., Reference Gottardo, Brscic, Contiero, Cozzi and Andrighetto2009; Tessitore et al., Reference Tessitore, Boukha, Guzzo and Cozzi2009), no larger-scale on-farm welfare assessments have been carried out in intensive beef farms.
However, involving scientists, citizens and stakeholders from the industry, a valid and robust on-farm welfare assessment tool for fattening cattle has recently been developed (Welfare Quality® (WQ), 2009). Focussing on animal-based measures, it addresses welfare with regard to 12 criteria and 4 principles (Good feeding, Good housing, Good health and Appropriate behaviour). The information gathered at the level of single measures can be processed into integrated welfare scores at the criterion and principle levels (Botreau et al., Reference Botreau, Bracke, Perny, Butterworth, Capdeville, Van Reenen and Veissier2007). These scores as well as the overall welfare classification of farms may be used for standardized welfare labelling of products (Blokhuis, Reference Blokhuis2008). Another important aspect is the feedback of the assessment results to the farmer, pointing out strengths and weaknesses in terms of animal welfare and aiming at initiating improvement processes.
Therefore, the aim of this study was to assess the welfare state on beef bull farms in Austria, Germany and Italy using the WQ assessment system for fattening cattle. Second, we investigated whether the welfare state changes following the provision of feedback on the assessment results. For this purpose, two types of feedback of information resulting from the assessment were used, that is, feedback by a written report or written feedback plus advice on potential improvement measures.
Material and methods
Selection of farms, housing systems and breeds
Farms were selected from a pool of 90 farms that had been recruited at an earlier stage (29 to 31 farms per country; Supplementary Figure S1). All farms considered fulfilled the following criteria:
-
1. Housing systems with littered lying area or cubicles with soft rubber mats.
-
2. Fattening of intact bulls.
-
3. At least three pens with finishing bulls >350 kg live weight to ensure a minimum number of replicates at the pen level within a given farm.
The study was conducted in farms with the above-mentioned alternative housing systems, assuming that modifications intended at improving welfare would be easier to implement in such systems, and that farmers running these potentially animal-friendly systems would more likely be the future users of welfare assessment systems.
In all, 63 farms (21 beef-fattening farms each in Austria (AT), Germany (DE) and Italy (IT)) were included in the implementation study. Selection of farms was guided by the farmer’s expectations towards the WQ assessment system and their willingness to implement modifications concerning housing and management as expressed in a previous survey (Kirchner et al., Reference Kirchner, Schulze Westerath-Niklaus, Knierim, Tessitore, Cozzi, Vogl and Winckler2014).
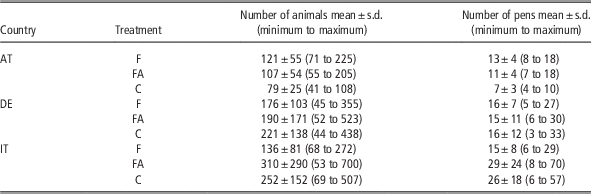
The number of beef bulls >200 kg live weight kept on the farms ranged from 41 to 700 animals (only animals in the housing systems described below, means from three visits; Table 1). Thirty-nine farms ran a sloped floor system (AT: 13, DE: 17, IT: 9), and in 36 farms the bulls were kept in a deep-bedded strawyard system (AT: 10, DE: 11, IT: 17). One farm had a bedded area that was cleaned and newly littered on a daily basis, and in two farms bulls were kept in a cubicle-housing system; in all, 15 farms had a combination of 2 housing systems. Simmental (AT, DE), Piedmontese (IT) and crosses with beef breeds were the most prevalent breeds.
Number of animals and pens on the farms studied per treatment (F, FA and C) in Austria (AT), Germany (DE) and Italy (IT)

F=feedback; FA=feedback and advice; C=control.
Mean, s.d. and range across all three assessments; n=7 farms per country and treatment.
Assessments and treatments
All beef farms were visited from April 2008 to February 2009, and all assessments were carried out by three trained assessors (one per country). They had reached at least satisfactory inter-observer agreement for 21 animal-based measures (Kendall’s coefficient of concordance W=0.79 to 0.96). On-farm assessments were carried out following largely the WQ protocol for fattening cattle (WQ, 2009); deviations are discussed in Supplementary Table S1. Assessments were carried out three times on each of the 63 farms (initial, interim and final assessment). The interim assessment was carried out about 1 month after the initial assessment and the final assessment about 6 months after the interim assessment.
Each of the 21 farms (7 per country) was assigned to 3 treatments. The treatments varied from the level of information provided in the feedback to the farmer at the interim visit: (a) feedback of the results of the initial assessment in the form of a written report (feedback, F); (b) written report on the results as for F and provision of additional advice (feedback and advice, FA); and (c) no feedback of the results during the study (control, C). Allocation to the treatment groups again depended on the willingness to implement modifications concerning housing and management (Kirchner et al., Reference Kirchner, Schulze Westerath-Niklaus, Knierim, Tessitore, Cozzi, Vogl and Winckler2014). F and FA farms did not differ in their rating of willingness.
Reports for F and FA farmers contained the results on the measure level of the initial welfare assessment, according to the WQ criteria and principles. The welfare relevance of the outcomes was illustrated using expert opinion-derived judgements. To obtain expert opinion, three animal welfare scientists from the partner institutions with experience in cattle independently provided suggestions for thresholds of acceptable prevalences for every single measure. These values were discussed and, if no agreement was reached, the average of the suggested prevalence levels was used. In the reports for the F and FA farmers, the welfare considerations were highlighted following a traffic light scheme (green: ‘okay’, yellow: ‘improvement desirable’, red: ‘improvement necessary’). In addition, for the majority of the parameters, means and ranges from 30 farms in Austria and 18 farms in Italy (from earlier studies) were provided as benchmarks. In the FA farms, advice was provided for any measure that had been judged as ‘improvement desirable’ or ‘improvement necessary’. To largely standardize the advice, a list containing potential advice for each criterion was created in collaboration between all research partners. The assessor chose those potential improvement measures, which were assumed to be applicable to the respective situation on the farm. Results and advice were then discussed with the farmer during the second visit; for two farms, this was done via telephone. Following the final assessment, 20 of the 21 FA farmers reported on the degree of implementation of advised measures.
Data handling
Retrospectively, farm-level values for the 27 measures of the WQ assessment protocol, as well as criterion and principle scores, were generated for each of the three assessments in the 63 farms, according to the WQ protocol (WQ, 2009), using updated formulas and coefficients (WQ, 2012). Criterion and principle scores may range from 0 (worst) to 100 (best welfare state). Therefore, a score of 50 represents a somewhat neutral situation (WQ, 2009). On the basis of the scores at the principle level, the farms were finally allocated to one of the following categories: ‘Not classified’, ‘Acceptable’, ‘Enhanced’ or ‘Excellent’ (WQ, 2009). Completion of the evaluation procedure (WQ, 2009) took place when on-farm data collection had already been finished. This caused some mismatch between the available data and input necessary for the calculations. As the score calculation does not tolerate missing values (Botreau et al., Reference Botreau, Bracke, Perny, Butterworth, Capdeville, Van Reenen and Veissier2007), data had to be complemented using values that were expected to reflect the most likely condition (see Supplementary Table S1).
Statistics
The following linear mixed-effects model was used in R 2.13.1 (lme-function; R Development Core Team, 2009) for ANOVA between treatment groups at the WQ measure, criterion and principle level:
 $$y_{{ijkl}} =\mu{\plus}b_{i} {\plus}b_{{ij}} {\plus}\alpha_{k} {\plus}\beta_{l} {\plus}\alpha_{k}\! :\beta_{l} {\plus}\varepsilon_{{ijkl}} $$
with intercept μ, the fixed effect ‘treatment’ (factor with three levels F, FA and C) α k , the fixed effect ‘assessment’ (factor with two levels of interim and final assessment) β l , the interaction of the fixed effects α k : β l , the random effect ‘farm’ b ij nested in ‘country’ b i and the residuals ε ijkl .
Data were transformed where necessary. Logarithmic transformation was used for the measure ‘% groups with sufficient water points’, whereas the measures ‘Duration of lying down movement (s)’, ‘% of lame animals’, ‘number of coughs per animal in 15 min’, ‘frequency of head butts, displacements, fights and chases per animal and hour’, and ‘frequency of social horning and social licking/animal per hour’ were square-root transformed. The measures ‘% of groups with at least two water points’, ‘% of dirty animals’, ‘% of animals with nasal discharge’, ‘% of animals with hampered respiration’ and ‘% of animals with diarrhoea’ were transformed taking the arcsine of the square-root. Residuals were graphically checked for fulfilling the model assumptions. In the case of criterion scores for ‘Absence of prolonged hunger’ and ‘Absence of pain induced by management procedures’, normal distribution of residuals was not achieved and ANOVA therefore omitted. P-values were calculated on the basis of the transformed data (where necessary), whereas the means given in the results section are based on the original data. For the overall score, the proportions of farms in the four WQ welfare classification categories (Excellent, Enhanced, Acceptable and Not classified) were calculated and tested for differences between treatments using a χ2-test.
Results
Welfare assessment at measure, criterion and principle, and overall classification level
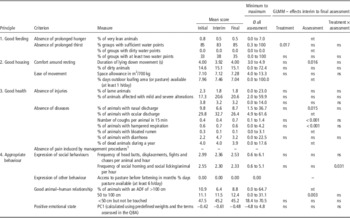
In most cases, single animals with poor body condition accounted for prevalences of very lean animals of about 1%. The maximum prevalences of 7% and 4% (Table 2) were obtained in two different farms. The criterion ‘Absence of prolonged hunger’ achieved scores below 50, considered as neutral situation, in 10% of the farms (WQ, 2009). The average score for the ‘Absence of prolonged hunger’ criterion was 93.6. Regarding the criterion ‘Absence of prolonged thirst’, the number of drinkers was ‘sufficient’ in 85% of the farms, and 35% of the pens on average had at least ‘Two drinkers per group available’ (Table 2). The equivalent score for ‘Absence of prolonged thirst’ was on average 47.1 (Table 3). This resulted in an average score of 50.0 for the principle of ‘Good feeding’ (range 19.6 to 100).
Results of the Welfare Quality® assessment for the initial, interim and final assessment (mean and range across all three assessments) at the measure level as well as P-values for the general linear mixed-effect models

nt=not tested owing to lack of fulfilment of model assumptions; ns=not significant (P>0.05); ADF=avoidance distance at feed-rack; QBA=qualitative behaviour assessment.
Data transformations were as follows: asin-sqrt=arcsine square root, sqrt=square root, log=logarithm; P-values for variables that required transformations are based on the transformed data, but means were derived from the original data for these variables.
1 For detailed information please consult Supplementary Table S2.
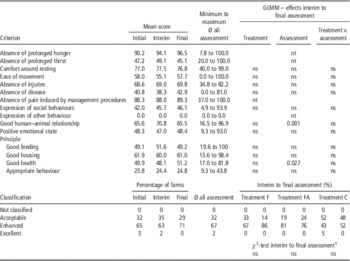
Results of the Welfare Quality® assessment for the initial, interim and final assessment (mean and range across all three assessments) at criterion, principle and classification level as well as P-values for the general linear mixed-effect models as well as for the χ2-test (classification level)
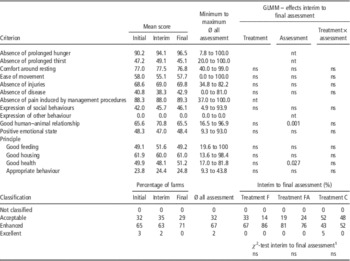
nt=not tested owing to lack of fulfilment of model assumptions; ns=not significant (P>0.05); F=feedback; FA=feedback and advice; C=control.
1 χ 2-tests were conducted only for classifications ‘Acceptable’ and ‘Enhanced’.
The average score for the criterion ‘Comfort around resting’ (77.1) resulted from a mean ‘Prevalence of dirty animals’ of 15% (0 to 72%) and the mean ‘Lying down duration’ of 4.0 s with a range of 3.0 to 4.9 s. Thus, it was higher than the criterion ‘Ease of movement’ (56.9). Measures for the latter included an average ‘Space allowance per 700 kg bull’ of about 7 m2, whereas ‘Availability of an outdoor run’ was rare. Therefore, the average score for the principle ‘Good housing’ was 61 with a range of 13.6 to 98.4 (Table 3).
Within the principle of ‘Good health’, measures such as ‘Hampered respiration’ and ‘Bloated rumen’ had a mean prevalence below 1% and the occurrence of ‘Coughs’ was below 1 per 15 min and animal (Table 2). ‘Lameness’, ‘Diarrhoea’ and ‘Severe skin alterations’ showed a prevalence of around 2% to 4%, whereas the percentage of animals with ‘ocular’ and ‘nasal discharge’ was 26% and 9%, respectively, with marked differences between farms. ‘Disbudding or dehorning’ was performed on about 28% of the farms, with 40% to 100% of animals per farm without horns (Supplementary Table S2). Tail-docking was only rarely performed (6 farms, maximum 12% of animals). For the principle ‘Good health’, the mean score was 49.7 (range 17.0 to 81.8), which resulted from mean scores of 69.1 and 41.6 for the criteria ‘Absence of injuries’ and ‘Absence of diseases’, respectively (Table 3). Evaluation of the latter criterion involves an intermediate step of ‘warning’ and ‘alarm’ thresholds. Warning thresholds were frequently exceeded for ‘diarrhoea’ (>3% animals affected) and ‘nasal discharge’ (>5%), whereas measures exceeding the alarm threshold comprised ‘ocular discharge’ (>6%) and ‘mortality’ (>4%). Criterion scores for ‘Absence of pain induced by management procedures’ averaged at 88.5.
‘Appropriate behaviour’ was the principle with the lowest scores, with an average of 24.3 (range 9.3 to 43.8). As no access to pasture was provided, the criterion score for ‘Expression of other behaviour’ was zero for all farms. Furthermore, a high mean frequency of ‘agonistic’ and ‘cohesive behaviour’ of 2.6 and 2.4 interactions per animal and hour, respectively, led to a mean score of 44 for the ‘Expression of social behaviour’ criterion (Table 3). The ‘PC1’ score for ‘Positive emotional state’ derived from qualitative behaviour assessment was on average −0.5, but ranged from −4.8 to 4.8 across all farms and assessments. It was rated with an average score of 47.8. Scores for ‘Good human–animal relationship’ were on average higher with a score of 67.3. On average, 11.7% and 45.9% of the animals had an avoidance distance of 50 to 100 cm and <50 cm, respectively, whereas 33.7% of the animals could be touched (Table 2).
Of the farms, 32% were on average classified as ‘Acceptable’ and 67% as ‘Enhanced’; only one farm was classified as ‘Excellent’. No farm was allocated to the ‘Not classified’ category at any assessment (Table 3).
Influence of feedback/advice
Of the 20 FA farmers (information missing from 1 farm), 8 reported that they had applied one or several measures as suggested in the report and during the advisory meeting. These measures are related to adaptation of feeding (one), provision of additional water points (two), purchase of already dehorned calves (one), reduced stocking density (three), improved ventilation system (two) and cleanliness in the barn (one). Twelve farmers did not implement any of the suggested measures.
At the welfare measure level, no significant treatment effects (F, FA) were found when comparing the interim and the final assessment (interaction treatment×number of assessment; Table 2), except for ‘Frequency of social horning and social licking/animal per hour’. In the final assessment, the latter was higher in C and lower in treatment group FA as compared with the interim assessment. The analysis at the criterion and principle score level did not show any interaction effect of the treatment (F or FA) and the number of assessment (interim and final) (Table 3). In addition, for the final classification, there was no significant difference regarding the percentage of farms being classified ‘acceptable’ and ’enhanced’, respectively, at the interim and final assessment. Numerically, only little changes in the percentage of farms allocated to the different categories took place for C and FA farms, but the proportion of the F farms in the category ‘Enhanced’ increased from 67% to 86% at the third assessment – 86% (Table 3).
Discussion
State of animal welfare
To the best of our knowledge, this is the first study applying the full WQ assessment protocol on beef farms. Comparison with results from other studies is difficult, because for the majority of the (animal-based) measures included in the protocol information is only rarely available from the literature. In addition, the scoring systems in the present study differed from other scoring schemes, for example, with regard to type and size of lesions considered or assessed body regions (Platz et al., Reference Platz, Ahrens, Bahrs, Nuske and Erhard2007; Schulze Westerath et al., Reference Schulze Westerath, Gygax, Mayer and Wechsler2007), making comparisons difficult. Measures that were in the range of data reported in the literature comprised, for example, the lying down duration. An average duration of 4.0 s is in agreement with data from the study by Brörkens et al. (Reference Brörkens, Plesch, Laister, Zucca, Winckler, Minero and Knierim2009), who also investigated behaviour around resting in fattening bulls on deep litter systems. Absmanner et al. (Reference Absmanner, Rouha-Mülleder, Scharl, Leisch and Troxler2009) found a slightly higher lying down duration on straw bedding (5.3 s). In addition, the proportion of animals that could be touched or with an avoidance distance at the feeding rack of <0.5 m, as measures of human–animal relationship, were similar to data from Austrian beef farms (Windschnurer et al., Reference Windschnurer, Boivin and Waiblinger2009). However, in the current study, variation was large, especially regarding the proportion of animals with a high avoidance distance (>100 cm). This was mainly because of the Italian farms confirming earlier findings (Tessitore et al., Reference Tessitore, Boukha, Guzzo and Cozzi2009). The average incidence of agonistic behaviours was markedly lower than reported by Laister et al. (Reference Laister, Brörkens, Lolli, Zucca, Knierim, Minero, Canali and Winckler2009), who used comparable definitions for the behavioural measures but included herds on fully slatted floor systems and higher stocking densities. With 2.3 events per animal and hour, the mean incidence of cohesive behaviours clearly exceeded the incidences reported by Schulze Westerath et al. (Reference Schulze Westerath, Brörkens, Laister, MacKintosh, Winckler and Knierim2009a) or those found in an Italian study (0.33 v. 0.84 per bull and hour on deep litter and slatted floors, respectively; Tessitore et al., Reference Tessitore, Boukha, Guzzo and Cozzi2009). Finally, in the present study, the average estimated mortality rate was higher than reported for littered loose-housing systems in a study by Gottardo et al. (Reference Gottardo, Brscic, Contiero, Cozzi and Andrighetto2009). However, it has to be taken into account that reliability may be weak, as mortality was mostly estimated by the farmers and not based on farm records.
Average scores lower than 50, thus indicating a worse than neutral situation, were obtained for the principle ‘Appropriate behaviour’. This rather poor rating resulted not only from the lack of access to pasture in all farms (criterion ‘Expression of other behaviour’) but also from only moderate scores for the level of social interactions (criterion ‘Expression of social behaviour) and ‘Positive emotional state’. The welfare state regarding the principles ‘Good feeding’, ‘Good housing’ and ‘Good health’ was on average rated as at least neutral. Although not finally leading to a lower than neutral principle score, within the ‘Good feeding’ principle the criterion ‘Absence of prolonged thirst’ was identified as a weak point. Average scores pointed at problems because of overstocking at the drinkers together with the lack of a second drinker per pen, whereas cleanliness of drinkers was less of a problem. Regarding the criterion ‘Absence of prolonged hunger’ undernourished animals can be considered a problem of individual farms only in the beef production system studied. However, very lean animals most likely are chronically ill or socially subordinate and should be avoided in any farm. The positive evaluation regarding ‘Good housing’ confirmed that the housing systems studied, which excluded fully slatted floor housing, are more likely to provide welfare-friendly housing conditions (SCAHAW, 2001; Wechsler, Reference Wechsler2011). However, the range in prevalence of dirty animals was large, indicating that outcomes in straw-based housing systems are dependent on other factors such as litter management. Within ‘Good health’, welfare concerns were mainly related to ‘Absence of disease’. Here, the average prevalences for nasal and ocular discharge clearly exceeded the expert-derived thresholds. Both point at pre-damage of the upper respiratory tract, which may facilitate the outbreak of the multi-factorial ‘Respiratory disease complex’ in fattening cattle (Stöber, Reference Stöber2002).
Welfare evaluation in the WQ assessment system as referred to above is based on expert opinion (Botreau et al., Reference Botreau, Bracke, Perny, Butterworth, Capdeville, Van Reenen and Veissier2007; WQ, 2009). Its appropriateness may be debated and we discuss two examples in the following paragraph. The average criterion score for ‘Expression of social behaviour’ may appear rather low; scores higher than 70 were only achieved in 5 of the 183 assessments. Considering an incidence of agonistic interactions in the range of the literature, and socio-positive behaviours clearly exceeding the levels found in other studies, this raises the question whether the expert-derived assessment of social behaviour is too strict. To the best of our knowledge, a ‘calibration’ in terms of welfare relevance, also with regard to the fact that intact growing bulls show a propensity for agonistic interactions, is not available. Quantitative measures of cohesive behaviour may be even more difficult to interpret, as the simple equation that higher incidences reflect better welfare is arguable (Knierim and Winckler, Reference Knierim and Winckler2009). These difficulties in interpreting the welfare relevance of socio-positive interactions are taken into account in the WQ protocol by prioritizing the level of agonistic interactions. In addition, the mere fact that space allowance in the housing conditions investigated was higher than in common fully slatted floor systems (Absmanner et al., Reference Absmanner, Rouha-Mülleder, Scharl, Leisch and Troxler2009; Gottardo et al., Reference Gottardo, Brscic, Contiero, Cozzi and Andrighetto2009) does not necessarily mean a decrease in agonistic interactions. An analysis of factors influencing the incidence of agonistic behaviours in the present data set did not reveal an effect of, for example, space allowance (Schulze Westerath et al., Reference Schulze Westerath, Kirchner, Tessitore, Cozzi, Winckler and Knierim2009b). This indicates that either a beneficial effect of increased space allowance had not yet been reached within the range found on the farms, or other factors, which are not necessarily linked to the present housing systems, have a major impact on the occurrence of social interactions.
The average criterion scores for ‘Ease of movement’ not only indicated a more than neutral situation but also showed the maximum possible range (0 to 100). Given a mean space allowance of about 7 m2 on a 700 kg weight basis, thus by large exceeding the conditions found in common fully slatted floor systems (Absmanner et al., Reference Absmanner, Rouha-Mülleder, Scharl, Leisch and Troxler2009; Gottardo et al., Reference Gottardo, Brscic, Contiero, Cozzi and Andrighetto2009), questions may again arise whether the scoring system adequately addresses animal welfare. First, the space allowance considered for score calculation was 5.4 m2 as the worst situation within a farm, which applies to at least 15% of the animals, is taken into account (WQ, 2009). Recommendations for the 700 kg weight class range between 4 (SCAHAW, 2001) and 4.4 m2 (Bartussek et al., Reference Bartussek, Tritthardt, Würzl and Zortea1996), but they are not specifically directed at certain housing conditions. Especially in the littered housing systems, a space allowance of 0.6 m2/100 kg live weight, as suggested by SCAHAW (2001), does not provide sufficient space to allow for comfortable lying positions, low levels of disturbance and stress responses (Munksgaard et al., Reference Munksgaard, Ingvartsen, Pedersen and Nielsen1999; Gupta et al., Reference Gupta, Earley and Crowe2007). In the current WQ scoring system, a space allowance of 0.9 m2/100 kg equals a score of 50 and thus a neutral situation, suggesting that the evaluation is not too strict.
The rather good overall classification in the present study with two-thirds of the farms finally classified as ‘Enhanced’ may reflect the overall relative welfare-friendliness of the housing systems studied; however, it may also result from the involvement of stakeholders during the development of the WQ scoring system (Botreau et al., Reference Botreau, Bracke, Perny, Butterworth, Capdeville, Van Reenen and Veissier2007) and the aim to design a classification procedure that considers what can realistically be achieved in practice (WQ, 2009). However, at the same time, all levels investigated the range obtained for the single measures, and aggregated scores showed that there is room for improvement.
Impact of the feedback
Owing to the fact that the farmers involved in the study ran alternative housing systems, we assumed that they were highly interested in animal welfare. In addition, they had stated interest in advice to improve animal welfare beforehand and willingness to implement changes in housing and management (Kirchner et al., Reference Kirchner, Schulze Westerath-Niklaus, Knierim, Tessitore, Cozzi, Vogl and Winckler2014). This assignment of farms was chosen with regard to future potential applications of assessment systems such as WQ, for example, for labelling purposes. European pig farmers participating in specific animal welfare or organic classification schemes were found to be motivated to implement changes (Bock and van Huik, Reference Bock and van Huik2007). However, in the present study, the actual number of implemented measures was low and did not lead to significant improvements (as it concerns single measures to principle scores) in both the F and FA farms. Differences in motivation may not account for the lack of effect of treatment, as the F and FA farms did not differ in their above-mentioned interest and willingness, but were highly motivated in general.
One obstacle for implementing change may be the financial implications of investments. There was no financial compensation available for measures such as the use of more bedding material or the reduction in stocking density in the course of the project. In addition, incentives such as improved market access or higher product prices could not be offered, probably reducing the farmers’ willingness to implement costly interventions. In contrast, without expecting direct financial incentives, five farms actually implemented rather cost-intensive measures such as reducing stocking density or installing additional drinkers. However, the availability of financial compensation alone is not necessarily effective. In a study by Bell et al. (Reference Bell, Bell, Knowles, Whay, Main and Webster2009), an hazard analysis and critical control points concept for lameness in UK heifers was implemented without positive effect, although participating farmers were reimbursed up to 1000 British pounds.
We acknowledge that it may be overoptimistic to expect substantial improvements in the welfare measures and scores within the time scale of the study. We expected that some actions could have been implemented within a short period of time such as changes in feeding management or amount and quality of bedding. However, even for measures implemented at an early stage, the period of 6 months was obviously too short to be effective in terms of welfare improvement. Significant improvements in the welfare of dairy cattle were not achieved during a 9-month period, following the implementation of ‘animal health and welfare plans’ in organic dairy herds (Gratzer, Reference Gratzer2011) or during a 12-month programme on dairy heifer lameness (Bell et al., Reference Bell, Bell, Knowles, Whay, Main and Webster2009). However, studies using longer monitoring periods found significant effects, for example, a more pronounced udder health improvement in the 2nd year following interventions in Swiss dairy farms (Ivemeyer et al., Reference Ivemeyer, Walkenhorst, Heil, Notz, Maeschli, Butler and Klocke2009). Management factors may take longer than 1 year to be implemented or are associated with high investments (e.g. redesigning of buildings). In addition, in all-in-all-out systems and (semi-) continuous production systems, certain changes only become effective on a longer term basis. For example, if animals are bought in continuously and fattened until the age of 1.5 years, omission of tail-docking in bought-in bulls will only affect one-third of the animals present on the farm after 6 months. This would not be sufficient to achieve a better welfare score, because two-thirds of the animals still underwent the surgical procedure. Similarly, reducing stocking density in an ongoing fattening cycle is nearly impossible for logistic reasons. Even if space would be available, regrouping of animals in bull fattening should be avoided to prevent agonistic interactions and stress, as suggested by Mounier et al. (Reference Mounier, Veissier, Andanson, Delval and Boissy2006). It is therefore likely that the observation period was too short for considerable welfare improvements, especially at the criterion and principle level where scores are rather robust against deviations of single measures (Botreau et al., Reference Botreau, Bracke, Perny, Butterworth, Capdeville, Van Reenen and Veissier2007).
Conclusions
This study contributes to the knowledge on the state of animal welfare in beef bull farms in Europe. According to the WQ assessment system, farms with littered housing systems were graded as ‘Enhanced’ and ‘Acceptable’. Nonetheless, potentials for welfare improvement were identified, mainly in terms of diseases and social behaviour. Providing farms with a written report or a report plus advice on potential amendments did not result in general improvement of the welfare state within a 6-month implementation period. It remains open if this is because of the rather short observation period or other factors. This should be further investigated in studies on the implementation of improvement strategies regarding fattening cattle welfare.
Acknowledgements
We thank the farmers participating in the study for their collaboration and feedback during and after the assessment. The present study was part of the Welfare Quality® research project, which has been co-financed by the European Commission, within the 6th Framework Programme, contract No. FOOD-CT-2004–506508. The text represents the authors’ views and does not necessarily represent a position of the Commission that will not be liable for the use made of such information.