Agencies responsible for public health and patient care must be prepared to provide medical countermeasures (MCM) for a large number of people, primarily to prevent or mitigate disease outbreaks. Other services, such as distribution of needed supplies, dissemination of information, or health evaluation may also take place on a large scale. Some of these activities occur in an emergency or crisis environment, where organization and speed are important. As in the influenza vaccine shortages and delays of 2004 and 2005 and the response to the pandemic 2009 influenza, official messages are often conflicting, and public response is difficult to predict and often disproportionate to need and available resources. Successful planning for these situations requires knowledge of effective methods for mass distribution of medication and supplies to the public, including awareness of nontraditional treatment environments such as drive-through settings and knowledge of the expected time parameters of potential interventions.
In a national forum held by the National Institutes of Medicine in 2008, it was noted that the health challenges of today require “experience in the logistics of wide-scale distribution and dispensing of countermeasures by all levels of government.”Reference Davis, Kammersall and Altevogt1 Such experience can be gained through the operation of large-scale, seasonal influenza vaccination campaigns, and include the benefits of establishing relationships among public health, hospital, and emergency management personnel, and familiarizing the public with MCM distribution.Reference Rambhia, Watson and Sell2 Annual influenza vaccination campaigns have also been used to familiarize health care students and faculty with MCM techniques.Reference Rega, Bork and Chen3
The technical definition of the term throughput can be stated as “the amount of material or data that enters and goes through something such as a machine or system,” and generally refers to some level of productivity of equipment, technology, or personnel. Measurements of throughput use various types of outputs, including time or speed, number, or monetary value. This study capitalizes on an existing public health activity to document a throughput measure relevant to disaster preparedness. The specific goals of this investigation were to measure the time required for the key components of 2 drive-through vaccination clinics and to summarize the results as they applied to provision of MCM to large populations of children and adults. We hypothesized that vaccinating children in addition to adults would affect throughput time.
Methods
In October 2011, the process times for vaccinations were measured at 2, no-cost drive-through influenza vaccination clinics conducted by the University of New Mexico Hospital system in Albuquerque. In the month before the events, the university's health sciences center public affairs department produced radio and newspaper advertisements informing the public about the clinics. The single-day clinics were held on 2 separate days, in nonenclosed parking lots, on days with fair weather. Participants receiving vaccinations included adults and children 9 years of age or older.
Nursing students administered seasonal influenza vaccinations using syringes preloaded with vaccine, under the supervision of their instructors, who reviewed and signed all forms. No intranasal vaccines were administered. Trained volunteers recorded time measurements on small paper cards using digital wristwatches displaying the atomic time (Sper Scientific). University safety personnel and two local Medical Reserve Corps units provided safety and logistical support. Data from the time cards (vehicle entry and exit times for clinic 1 and the vaccination procedure time for clinic 2), the number of people vaccinated per vehicle, and the card number were entered in a spreadsheet (Microsoft Excel). Analysis included tabulations of total vehicles and vaccinations per hour for each hour of the clinic, total length of stay (clinic 1), elapsed time for vaccination procedures (clinic 2), and median times per vehicle by the number of vaccinations per vehicle. Before initiating the study, we submitted an application for approval to the University of New Mexico Human Research Protection Office; the study was exempted from the requirement of the human research regulations stated in 45 C.F.R. 46.101(b).
Clinic 1
The first clinic was open from 8:30 am until 4:00 pm, and approximately 2600 vaccinations were delivered, as measured by the number of vaccination consent forms submitted to the New Mexico Department of Health. Time measurements and person counts were taken from a total of 1051 vehicles throughout the day beginning at 9:00 am and ending at 4:00 pm. The time measurement to the nearest minute for each vehicle was recorded on a small, individually-numbered card that was placed on the windshield as the vehicle entered the timed area, and removed as it exited the timed area. Before entering the timed area, the driver of each vehicle was asked how many people in the car were going to receive a vaccination; this information was also recorded on the card. Due to the large number of participants in the clinic, and the many vehicles that arrived 1 to 2 hours before the opening time, the wait time before entering the timed area ranged from a few minutes to 2 hours. This wait time permitted participants to review the vaccination information statement and sign the vaccination consent form. These times were not recorded, owing to concerns that this time data collection would create traffic backup into major thoroughfares.
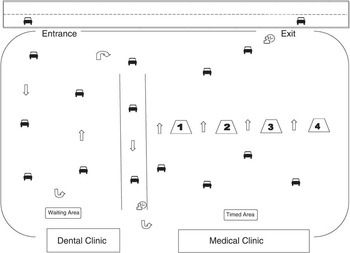
Figure 1 shows the vehicle flow and design of clinic 1. At the direction of volunteers, vehicles entered the timed area using 1 of 4 processing lanes that measured between 165 and 175 m in length. Each lane contained a vaccination station (table and tent) staffed by 15 to 20 students or instructors, which held vaccination supplies, paper forms, waste containers, and preloaded syringes. After a vehicle came to a stop, participants could ask questions regarding the vaccination process or the forms, and then were administered the vaccination in the upper arm, usually while remaining in the vehicle. Multiple vaccinations per vehicle were managed by multiple students who carried small trays with their supplies. Multiple vehicles per lane were processed simultaneously as students became available.
Pattern of Vehicle Flow and Clinic Design, Clinic 1.

Clinical staff directed participants who had additional questions or who required special processing because of physical needs out of the processing lanes and into a preselected area to prevent traffic congestion. Research staff measured processing time as the time the vehicle entered a processing lane until it left via the single exit out of the parking lot. Due to a decreased volume of traffic, we reduced the clinic to 2 processing lanes at 2:00 pm.
Clinic 2
The second clinic was conducted 2 weeks after the first. It ran from 10:00 am until 2:00 pm and provided approximately 455 vaccinations, as measured by the number of vaccination consent forms submitted to the New Mexico Department of Health. Time measurements and person counts were taken from a total of 224 vehicles in the 4 processing lanes throughout the entire clinic. Staff used the same vaccination procedures as for clinic 1. Research staff recorded time measurements for only the actual vaccination procedure. Measurements, to the nearest second, began at the time the vehicle came to a stop next to the vaccinator, and ended when the vehicle pulled away. The counts of the number of people per vehicle during clinic 2 included separate totals for vehicles with children (in which the pediatric version of the consent form was used for a least 1 child between the ages of 9 and 18 years) versus vehicles without children. The counts did not include actual totals of children versus adults receiving the vaccination.
Statistical Analysis
We used analysis of variance to test the hypothesis that throughput times differed between groups. For analyses that examined the effect of the number of individuals vaccinated per vehicle, we included all instances of 5 or more persons vaccinated into a single group for clinic 1 and 3 or more persons vaccinated for clinic 2. Because time data are typically skewed to large values and bounded at zero on the left, we used the logarithmic transformation and evaluation of median values to improve on normality assumptions. Analyses were conducted on the transformed data then back transformed for presentation. For any analyses that compared more than 2 groups, we used the Tukey honestly significantly difference test to adjust for post hoc multiple comparisons. We used a 2-tailed type I error rate of .05 to determine statistical significance.
We used the R statistical package for exploratory and graphical analyses. The confirmatory data analysis for this report was generated using SAS/STAT© software, Version 9.3 of the SAS System for Windows 7.
Results
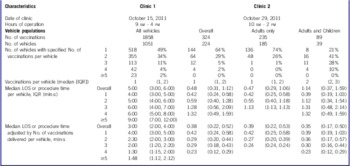
Data from clinic 1 demonstrates flow over time and efficiency. Data from clinic 2 demonstrates the impact of vaccinating children on process times. The Table summarizes visit characteristics for both clinics.
Visit Characteristics of Clinics 1 and 2

Abbreviations: LOS, length of stay; IQR, interquartile range.
Clinic 1
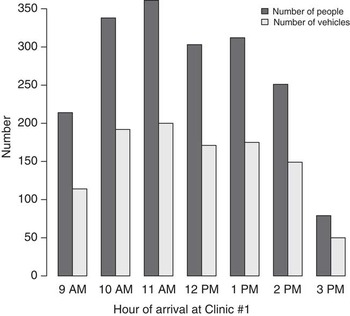
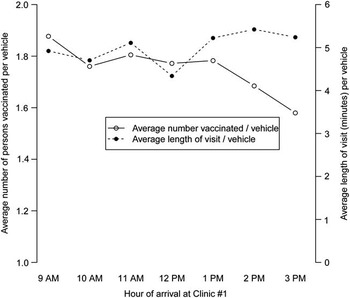
We collected length of stay data for 7 hours. The number of vaccinations and vehicles per hour varied during the course of the day; the maximum numbers of 200 and 361 per hour, respectively, occurred during the 11:00 am to 12:00 pm hour (Table and Figure 2). In addition, the number of vaccinations per vehicle varied during the day, with more vaccinations per vehicle given in the earlier hours (Figure 2).
Number of Vehicles Processed and Number of Vaccinations Delivered, by Clinic Hour, Clinic 1.

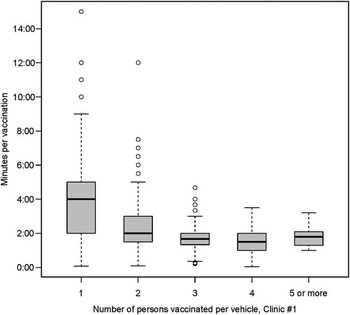
A total of 1850 vaccinations were given in the 1051 timed vehicles during clinic 1. The length of stay (LOS) varied slightly during the course of the day, with the longest LOS occurring from 2:00 pm to 3:00 pm (Figure 3). The Table shows the median number of vaccinations administered per vehicle and the median LOS by vehicle and by the number of vaccinations per vehicle. The highest percentage of the 1051 timed vehicles (49%; 518 vehicles) had only 1 vaccination given per vehicle. However, 23 vehicles (2%) received 5 or more vaccinations, including 1 vehicle in which 8 vaccinations were given. The median LOS per vehicle was 5 minutes overall, and increased as the number of vaccinations per vehicle increased (P < .0001). The median LOS per vaccination was 3 minutes overall, but decreased significantly as the number of vaccinations per vehicle increased (P < .0001), and reached maximum efficiency at 3 persons vaccinated per vehicle. Efficiency, measured by the time to vaccinate each person, was lower in vehicles with 4 or more people (Figure 4).
Average Number of Vaccinations per Vehicle and Average Length of Stay, by Hour of Arrival, Clinic 1.

Box Plots the Number of Minutes per Vaccination by the Number of Persons Vaccinated per Vehicle, Clinic 1. Heavy bars indicate the median; box boundaries indicate the interquartile range (IQR); whiskers show 1.5 times the IQR; and circles indicate outlier values.

Clinic 2
We collected procedure time data for 4 hours. Overall, the second clinic was less well attended, with a total of 324 vaccinations in the 224 timed vehicles, for an average of 56 vehicles per hour and an average of 81 vaccinations per hour (not pictured). As with clinic 1, the largest percentage of vehicles (64%; 144 vehicles) received only 1 vaccination per vehicle, but the maximum number per vehicle was only 4 in clinic 2 (Table). The median procedure time overall was 48 seconds per vehicle. As with clinic 1, the median procedure time per vehicle increased as the number of vaccinations per vehicle increased (P < .0001), but the median procedure time per vaccination decreased as the number of vaccinations per vehicle increased (P < .0001).
The Table also shows the number of vaccinations per vehicle and the time comparisons for the vehicles with children and adults and the vehicles with adults only. The majority of vehicles had only adults receiving vaccinations (83%; 185 vehicles). The median overall procedure time per vehicle was slower for vehicles with adults and children (1 minute 14 seconds) versus vehicles with adults only (47 seconds). Procedure time per vaccination, however, did not significantly differ between the vehicles with adults only (39 seconds) and those with both children and adults (35 seconds) (P = .182).
Discussion
Our study provides an analysis of a larger dataset than many previously published studies and evaluates an actual public health intervention as opposed to an exercise. It also provides an evaluation of the impact of children on processing time. Our data demonstrate that it is feasible to deliver vaccinations to a large number of individuals during a short period of time using a minimally trained medical and volunteer staff. The optimum number of vaccinations per vehicle to maximize efficiency is between 3 and 4. We found no evidence that vaccinating children in addition to adults affected throughput negatively.
The results of our study are most applicable to clinics providing seasonal influenza vaccinations, but also have implications for public health emergencies and disaster medical services. In the United States, MCM planning is largely based on recommendations by the Centers for Disease Control and Prevention (CDC) for the response to an intentional release of aerosolized anthrax. These recommendations are summarized in the CDC's city readiness initiative (CRI) and include the ability to provide oral antibiotics to the entire population of a large community within 48 hours of a decision to treat.4 Different parameters for the administration of preventive or postexposure prophylaxis exist for other exposures of concern, such as smallpox, influenza, or plague, which would include MCM other than oral antibiotics (eg, vaccines or antiviral agents). The ability of a local community to dispense MCM is also included as one of the public health preparedness capabilities provided by the CDC.5 This guidance recommends community planning that determines the target population to be reached with countermeasures and monitors the throughput of dispensing points to ensure maximum efficiency. Standards for the development of point of dispensing (POD) sites have been provided by the RAND Corporation, in alignment with the CRI goals.Reference Nelson, Chan and Chandra6 These standards include methods to calculate the target population, as well as the number of PODs and the throughput needed to accomplish dispensing goals.
The provision of MCM includes methods that push the treatment out to the target population, such as home delivery of antibiotics by the US Postal Service or prepositioned home medical kits, or pull the target population into a particular point for dispensing. Most community plans include components of both methods to provide treatment for all segments of the population, including citizens with mobility or health challenges, and consider community characteristics (eg, size, income, age, transportation) that would benefit from push or pull techniques. In a national Institutes of Medicine forum,Reference Davis, Kammersall and Altevogt1 several issues were presented as potential challenges to the successful delivery of MCM to a large population, including labor, facility capacity, security, liability, and financial sustainability. In addition, any delivery of MCM that requires people to come together in close proximity potentially increases the chance of transmission of the very disease that is the target for control.
The delivery of MCM via drive-through clinics potentially mitigates some barriers to successful dispensing, particularly during severely hot and cold weather and for citizens with mobility impairments. Treatment regimens that require multiple doses per person over time can be accomplished by repeating the drive-through clinic in the same community. Drive-through clinics pose less risk of disease transmission,Reference Rebmann and Coll7 although infection control practices must still be followed to protect workers. In addition, the potentially significant logistical problems and decreased total clinic throughput modeled by Baccam etal,Reference Baccam, Willauer and Krometis8 caused by the lack of available parking at walk-in clinics, can be mitigated with use of drive-through clinics. The use of drive-through techniques for the operation of PODs was recommended by an expert panel to reduce the demand on traditional, clinic-based facilities.Reference Nelson, Chan and Chandra6
Patient volume has been reported by other researchers for seasonal influenza drive-through vaccination clinics. In 2002 and 2003, clinics in North Dakota administered 467 and 720 vaccinations, respectively, during a 5-hour period, in addition to 40 pneumococcal vaccinations each year.Reference Hansen and Dunn9 In 2006, a clinic in Pennsylvania administered 6000 vaccinations during a 2-day period.Reference Burger and Fry10 In a New York county, 2 drive-through clinics reported processing times that averaged 3.75 and 4.25 minutes per vehicle, respectively, operating for 2 hours.Reference Pavelchak, Franko and Zhu11 None of these reports characterized the number of adults versus children per vehicle or time patterns.
A drive-through technique for dispensing Strategic National Stockpile antibiotics to simulated adult and pediatric patients was tested using a functional exercise in Hawaii, and resulted in a throughput average of 5.2 people per minute for the 2-hour exercise.Reference Zerwekh, McKnight and Hupert12 A drive-through mechanism was also simulated at Stanford University in California to triage patients during an influenza pandemic. Although the results of this exercise were not comparable to our study owing to the different goals of the activity, LOS measurements were tracked during the 3-hour period for each stage of the triage process to evaluate efficiency.Reference Weiss, Ngo and Gilbert13, Reference Callagy and Woodfall14
A comparison of throughput times and LOS across studies with large variations in design and intent is difficult. It is beneficial, however, to report the results of such events to provide a broad base of experiences from which public health and emergency management officials can draw to design PODs and create emergency plans for MCM distribution. An excellent summary of POD design is available from the National Association of City and County Health Officials and their preparedness partners.15 A novel design for a POD using neighborhood banks is also available for 2 communities in Utah.16
Our study provides potentially useful data regarding adult versus pediatric processing times, and some indication of flow over time. The average LOS is fairly consistent during the course of the first clinic, but increases slightly after the closure of 2 processing lanes at 2:00 pm, indicating that the lanes might have been closed prematurely. Our study shows that the presence of children raises the total number of vaccinations given per vehicle, and therefore the total vaccination processing time for the vehicle. However, no significant increase occurs in the median individual procedure time in the vehicles with children. Our findings indicate that the calculation of increased times is not necessary for processing children 9 years of age or older during emergency planning.
The clinic flow patterns indicate a preponderance of single-person visits, but a trend toward larger groups of people (presumably families) during the earlier hours. There also appears to be economy of scale and improved efficiency with higher numbers of people per vehicle. The median LOS and processing time per vaccination decreases with an increasing number of people per vehicle. In other words, 3 vehicles with 1 person each took more total time to process than 1 vehicle with 3 people, suggesting that carpooling should be encouraged during mass vaccination events. This effect, however, could depend on the relationship between the people in the vehicle and the compression of question and decision-making time for family groups. In addition, our data suggest a maximum effect at the level approaching 4 people per vehicle, possibly due to the physical challenge of vaccinating people in interior seat positions and the need for these passengers to exit the vehicle.
Limitations
Limitations in the use of routine vaccination procedures as a model for emergency events occurred primarily within the logistical framework. Because our study was limited to the processes occurring at these specific clinics, it did not address other forms of treatments, such as therapies administered orally or nasally. Also, although national POD planning recommendations include processes for handling pediatric patients, we had access only to data for adults and children 9 years of age and older. Clinics designed for routine vaccinations make every effort to limit their impact on the nonparticipating public through traffic flow that minimizes roadway interference and processes that do not impede regular clinical operations. These concerns would be significantly different during a public health emergency or disaster and would result in different techniques for processing, which could actually increase throughput.
Human behavior caused by the fear or uncertainty related to a public health emergency would also be different during a crisis and would result in tight security processes and traffic control that would likely have a negative impact on throughput time. Information needs would likely be different as well, and might result in a lower per person or per vehicle throughput time due to longer times spent addressing questions and concerns. Information needs, however, could be addressed by technology such as radio microbroadcasting to vehicles in the queue, or via signage at the site of the clinic to decrease the need for individual questions and answers.
In addition, our study collected time measurements from only 71% of the total number of vaccinations administered during the clinics and therefore does not reflect a complete picture of the attendance. This lapse was due to periodic missed measurements from overlapping vehicle entrances and exits, but also delays in data collection caused by traffic concerns at the beginning of the first clinic when larger groups tended to be present.
Conclusions
Drive-through clinics can be used to administer a large number of seasonal influenza vaccinations in a relatively efficient manner, and provide needed experience for students and practitioners in techniques for mass administration of MCMs. The outcomes of routine vaccination clinics can be used to assist public health and emergency management personnel with disaster planning. Including children older than 9 years does not reduce efficiency.