This article presents the results of the AMS radiocarbon analysis of 26 human bone and tooth samples recovered from burial contexts at Machu Picchu, Peru. This suite of measurements provides the basis for a scientifically derived estimate for the foundation of Machu Picchu and the duration of its occupation. Since its ‘scientific discovery’ in 1911, this Inca country palace has become widely recognised and is now probably the best-known archaeological site in South America (Salazar & Burger Reference Salazar, Burger, Alconini and Covey2018). In 1983 Machu Picchu was designated as a UNESCO World Heritage Site and—before the start of the COVID-19 pandemic—it was visited by over a million travellers each year. Machu Picchu has been the focus of considerable scholarly attention, but despite this, it has never been directly dated using AMS radiocarbon analysis based on a large number of samples from secure contexts. An earlier attempt in the 1980s using radiometric radiocarbon methods yielded problematic results (Berger et al. Reference Berger, Chohfi, Valencia, Yepez and Fernandez1988; Tables S1–2 & Figures S1–2 in the online supplementary material (OSM)). The subsequent development and refinement of the AMS technique now makes it possible to produce high-precision measurements on human skeletal material with low organic content. Another recent effort to establish the chronology of Machu Picchu using AMS dating was constrained by the small number of samples (n = 3) from the site itself, and due to issues regarding sample context and the organic material analysed (Ziółkowski et al. Reference Ziółkowski, Bastante Abhuhadba, Hogg, Sieczkowska, Rakowski, Pawlyta and Manning2020; Table S3).
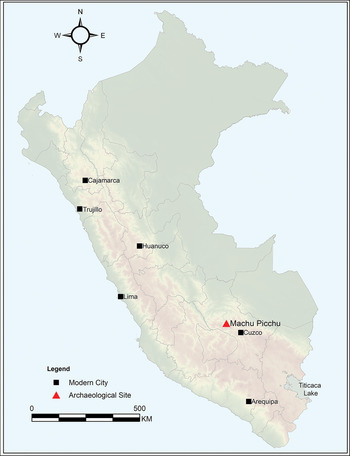
The scarcity of reliable radiocarbon measurements for Machu Picchu was the result of a widely held opinion among archaeologists working in the Andes that such analyses were unnecessary because the accurate dating of Inca sites such as Machu Picchu could be established on the basis of Spanish historical accounts. Until recently, archaeological work at Cuzco has produced few radiocarbon dates for Inca-period sites, and even recent in-depth studies have relied on Spanish chronicles for dating (e.g. Nair Reference Nair2015). An ‘absolute chronology’ for the Inca period based on historical records was published by John Rowe in 1945 and remains the dominant chronological framework (Rowe Reference Rowe1945). According to Rowe, after repelling an invasion by the Chanka ethnic group in AD 1438, the army of the Emperor Pachacuti conquered the lower Urubamba Valley, an area that includes Machu Picchu, before expanding imperial rule over much of the Central Andes (Figure 1; Rowe Reference Rowe1945: 270). Sixteenth-century legal documents published by Luis Glave and María Remy (Reference Glave and Remy1983) contain information interpreted by Rowe to indicate that Machu Picchu was built as part of a royal estate known as ‘Picchu’. Rowe argued that this royal estate belonged to the Emperor Pachacuti, and suggested that the palatial complex would have been constructed to commemorate his conquests of the lower Urubamba (Rowe Reference Rowe1990: 140 & 142–43).
Map showing the location of Machu Picchu (figure by the authors).

In Rowe's historical framework Machu Picchu was built sometime after Pachacuti's accession to power in AD 1438 and before his son, Tupac Inca Yupanqui, took command of the imperial army in AD 1463 or ascended to the throne in AD 1471. Although Rowe acknowledged the lack of consistency regarding imperial chronology among Spanish accounts and the difficulty of disentangling them, he relied on dates reported in the 1586 chronicle by Cabello de Balboa because “they are the most plausible ones we have or, indeed, ever likely to have” (Rowe Reference Rowe1945: 277). The source of Cabello's dates has never been determined (Covey Reference Covey2006: 171), but at the time of the publication of Rowe's chronological model, no technique besides historical analysis was available to produce an absolute chronology. Even after the introduction of radiocarbon-dating to Andean archaeology, the method's limitations and the scarcity of measurements available undermined acceptance of it as an alternative to Rowe's historicist reading.
In recent years, the publication of a large number of radiocarbon measurements from Inca sites, including in northern Chile, Argentina and Ecuador, far from the Cuzco heartland, has prompted a shift in opinion within Inca studies (D'Altroy et al. Reference D'Altroy, William, Lorandi, Burger, Morris and Matos2007: 92–93; Ogburn Reference Ogburn2012; Marsh et al. Reference Marsh, Kidd, Ogburn and Daran2017; Covey Reference Covey2018). Many of these new dates appear to be inconsistent with the Rowe chronology, and these discrepancies have resulted in growing scepticism about the historically based dates proposed for Pachacuti's establishment of the Inca Empire and its expansion. There have been repeated calls for a re-evaluation of the Rowe chronology using radiocarbon analyses, but samples from short-lived materials with well-established provenance that can be tied to Inca imperial history have been difficult to find (Burger Reference Burger, Burger, Morris and Matos2007: 427–29). Thus, the measurements reported here for samples from Pachacuti's royal estate at Machu Picchu not only shed light on the chronology of Peru's most famous archaeological site, but also have implications for the ongoing debate over the document-based chronology of Inca imperial history.
Contextualising the bone and tooth samples from Machu Picchu
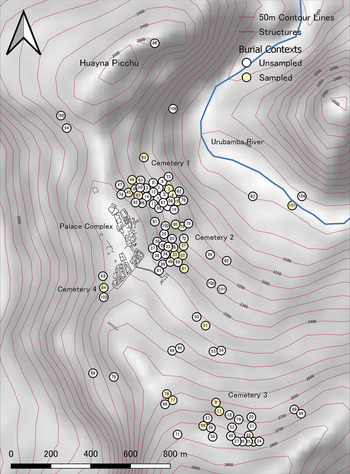
Machu Picchu is located on the eastern face of the Andes at 2450m asl on a narrow granitic ridge between two mountains (Figure 2). Steep slopes leading down to the Urubamba River 450m below make the site nearly inaccessible on three sides and with the construction of a dry moat along the southern limit of the palatial complex, the builders rendered the site almost impregnable. Despite the term ‘lost city’ used by Bingham (Reference Bingham1948), Machu Picchu was a country palace, one of many, in the Urubamba drainage basin (Niles Reference Niles and Shimada2015). Before the palace could be constructed, the irregular ridge on which it is built had to be completely reworked into a series of terraces using massive stone fills sustained by masonry retention walls (Wright et al. Reference Wright, Valencia, Wright and McEwan2000). The resulting flat open areas on the summit of the ridge accommodated residences, shrines, open plazas and other elements typical of high-status Inca imperial architecture. An enclosure wall, with a single entrance, adjacent to the dry moat protected the vulnerable southern side of the complex (Bingham Reference Bingham1930).
Map showing the location of burial caves at Machu Picchu and highlighting the caves sampled in this study (adapted from Miller Reference Miller, Burger and Salazar2003: fig. 1.1).

The archaeological remains recovered at Machu Picchu are consistent with the documentary evidence, which portrays this architectural complex as part of a royal estate belonging to the Emperor Pachacuti and his descendants; this interpretation is widely accepted by most modern scholars (e.g. Valencia Reference Valencia, Burger and Salazar2004: 82; D'Altroy Reference D'Altroy2014; Niles Reference Niles and Shimada2015; Quave Reference Quave, Alconini and Covey2018). The architectural core of the royal estate corresponds to a palace where the royal family and their guests could escape the pressures of the capital in Cuzco and engage in recreational activities such as banqueting, hunting and gambling, as well as religious activities associated with the royal family (Salazar & Burger Reference Salazar, Burger, Evans and Pillsbury2004). The hunting of animals such as deer and agouti was probably practised in the surrounding forests (Miller Reference Miller, Burger and Salazar2003).
Machu Picchu's warmer temperatures and lush vegetation would have made it an attractive seasonal destination for the Cuzco elite, particularly in the winter months of May to August when the overnight temperature falls below freezing in the capital. Located only 75km north of Cuzco, the royal estate could be reached along a stone-paved Inca road in four to six days. Judging from the number of house structures at the site, it is unlikely that the number of inhabitants exceeded 500, most of whom would have been retainers and craftsmen (Salazar Reference Salazar, Burger and Salazar2004: 30). During the austral summer, when rains were heavier and access more difficult, Machu Picchu would have been occupied by only a few hundred inhabitants dedicated to maintaining facilities and religious activities (Rowe Reference Rowe1990: 145; Salazar Reference Salazar, Burger, Matos and Morris2007). Most residents were probably yanacona—specialised labourers who were removed from their home societies and committed to life-long service to the state—or, in this case, Pachacuti's panaca (royal dynastic descent group) and camayoq, specialised artisans taken from their homelands and attached to the royal panaca (Rowe Reference Rowe, Collier, Rosaldo and Wirth1982). Some of the camayoq at Machu Picchu may have been metal workers brought from the north coast of Peru (Salazar Reference Salazar, Burger, Matos and Morris2007).
The radiocarbon samples discussed here come from individuals interred in burial caves at Machu Picchu. The 1912 excavations located 104 such burials (Eaton Reference Eaton1916), most with few grave goods. It has been hypothesised that these interments are the remains of retainers rather than the Cuzco elite (Salazar & Burger Reference Salazar, Burger, Evans and Pillsbury2004; Salazar Reference Salazar, Burger, Matos and Morris2007). Such retainers (camayoc or yanacona) would have been assigned to the royal estate from throughout the empire and would have reflected the history of conquests (Niles Reference Niles, Burger and Salazar2004, Reference Niles and Shimada2015; Salazar Reference Salazar, Burger, Matos and Morris2007). Since this hypothesis was proposed (Burger & Salazar Reference Burger and Salazar1993), the suggested multi-ethnic character of the buried individuals at Machu Picchu has been confirmed by the results of research on cranium deformation (Verano Reference Verano, Burger and Salazar2003: 88–90), cranial morphology (Verano Reference Verano, Burger and Salazar2003: 90–97), analyses of strontium 87Sr/86Sr (Turner et al. Reference Turner, Kamenov, Kingston and Armelagos2009) and stable carbon (δ13C) isotopes (Burger et al. Reference Burger, Lee-Thorpe, van der Merwe, Burger and Salazar2003; Table S4). Similarly, ongoing palaeogenomic analysis has produced preliminary results that confirm and expand the evidence for ethnic diversity at the site (Forst et al. Reference Forst, Burger, Salazar, Bradley, Krause and Fehren-Schmitz2019).
The individuals recovered from the burial caves show little evidence of involvement in heavy physical labour such as agriculture or construction, and do not exhibit pathologies resulting from violence (Verano Reference Verano, Burger and Salazar2003: 97–104). Thus, the population of Machu Picchu was dominated by retainers and would have been ethnically diverse and cosmopolitan, and fundamentally different from the agricultural villages in the Cuzco heartland (Salazar Reference Salazar, Burger, Matos and Morris2007: 174; Andrushko & Torres Reference Andrushko and Torres2011).
The burials at Machu Picchu were placed beneath boulders, under cliff overhangs and in shallow caves, and were sealed for protection with coarse, clay-plastered masonry walls (Figure 2; Eaton Reference Eaton1916). The grave goods include ceramics in the imperial style of Cuzco and the provinces, as well as bronze and silver shawl pins and tweezers, and other typical Inca artefacts. Significantly, many of the non-local vessels had been broken and repaired in antiquity, and their inclusion in the graves suggests that they were valued heirlooms, perhaps from an ethnic homeland (Salazar & Burger Reference Salazar, Burger, Evans and Pillsbury2004). Among the assemblages of grave goods, as in those from the architectural core of the site, there is a conspicuous lack of pre-Inca and post-Spanish conquest artefacts (Bingham Reference Bingham1930: 115–116; Salazar & Burger Reference Salazar, Burger, Evans and Pillsbury2004), a pattern suggesting that the occupation of Machu Picchu was limited to the reign of Pachacuti and his immediate successors. The ceramic styles preceding the classic Cuzco Inca style, such as Killke and Lucre (Bauer Reference Bauer1999), are absent from the large ceramic assemblage recovered in the 1912 excavations (Salazar & Burger Reference Salazar, Burger, Evans and Pillsbury2004).
Most of the known burials are clustered in areas on the margins of the country palace (Figure 2); one cluster (cemetery one) is situated among the boulders to the north-east of the architectural core, another (cemetery two) on the slopes to the east and a third (cemetery three) along the northern slopes of Machu Picchu mountain to the south (Bingham Reference Bingham1930: 102–105). Additional burials have been recovered on the western terraces and are referred to here as cemetery four (Salazar Reference Salazar2001, Reference Salazar, Burger, Matos and Morris2007: 171). In some of the burial caves there are multiple interments, in some only a single burial. The social relationship between the cemeteries is unknown, as is the rationale for the presence of multiple or single individuals in the burial caves.
The present study of AMS radiocarbon-dating of bone and tooth samples forms part of a wider, ongoing ancient DNA project on osteological samples that were formerly curated at the Yale Peabody Museum of Natural History. All human remains and other archaeological materials from Machu Picchu have subsequently been returned to Cuzco where they are now conserved at the Museo Machu Picchu, which is administered by the Universidad Nacional San Antonio Abad Cuzco (UNSAAC) (Salazar & Burger Reference Salazar, Burger, Underhill and Salazar2016). The osteological samples for this study were chosen to represent burial contexts from all known cemeteries and outliers, to represent burials with multiple individuals in order to clarify the extent of the period in which caves were used for burial, and to consider the chronological dimension of the diversity observed in the grave goods, cranial modifications and other indicators suggesting the diverse geographic origins of the buried individuals (Verano Reference Verano, Burger and Salazar2003; Salazar Reference Salazar, Burger and Salazar2004, Reference Salazar, Burger, Matos and Morris2007). A summary of the age and sex determinations for the individuals in the sample, along with relevant data on cranial deformation, 87Sr/86Sr measurements and grave goods is provided in Table S4.
An analysis of the Yale Peruvian Scientific Expedition Collections by Verano (Reference Verano, Burger and Salazar2003) concluded that a minimum of 174 individuals were represented in the cave burials. Investigations have been carried out over the last half century by Peruvian government archaeologists and investigators from UNSAAC, but only about two dozen additional burials have been documented. Assuming that Verano's estimate for the number of buried individuals recovered in 1912 is correct, a reasonable estimate of the total buried population at Machu Pichu can be made by adding those individuals recovered by archaeologists after 1912 to this number. The 26 samples analysed here may represent over 10 per cent of the individuals buried at Machu Picchu. The samples come from cemetery one (n = nine), cemetery two (n = six), cemetery three (n = seven), and cemetery four (n = three); the remaining sample is an outlier from near the banks of the Urubamba (Figure 2). Interments with multiple individuals are represented by samples from burial caves 4 and 84.
As it is believed that the bone samples relate to site retainers, these interments should span the history of Machu Picchu from its early use as a palace until its abandonment. They are unlikely to reflect the period during the construction of Machu Picchu. As noted, the skeletons recovered show little evidence of heavy labour and it is likely that the labour for estate-building was provided by a rural non-retainer population that would not have left its dead at the site. The objects buried with the dead at Machu Picchu are consistent with this assumption. Finally, the initial construction date estimated for Machu Picchu should be considered as a terminus ante quem relative to the death of the retainers who served there.
Sampling and analytical procedure
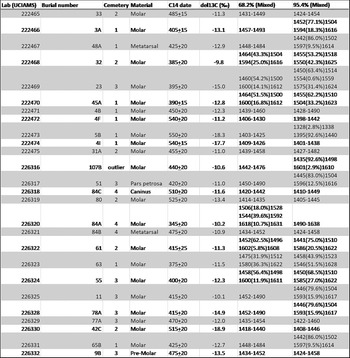
Samples were selected from all the cemeteries (Figure 3) and include individuals associated with artefactual evidence coming from the north coast, central coast, central highlands, Cuzco and the Lake Titicaca area, and there are multiple lines of non-artefactual evidence indicating that many individuals in the cemetery population came from these areas (see Table S4). Bone and tooth samples were prepared and cut at the clean-room facilities of the University of California Santa Cruz Human Paleogenomics Laboratory under the direction of Lars Fehren-Schmitz. They were then submitted to the W.M. Keck Carbon Cycle AMS facility at the University of California, Irvine (UCIAMS). Sample preparation and quality control at UCIAMS facility followed the protocol described in Beverly et al. (Reference Beverly, Beaumont, Tauz, Ormsby, von Reden, Santos and Southon2010).
AMS provenance and results (dates calibrated using the mixed calibration curve with OxCal v4.4) (figure by the authors).

Challenges of radiocarbon-dating the Inca Empire
One of the obstacles for developing an absolute chronology of Machu Picchu centres on the challenges of interpreting radiocarbon measurements. Although there are an increasing number of absolute dates associated with Inca archaeological sites, there is uncertainty as to whether the Northern Hemisphere Curve (IntCal20; Reimer et al. Reference Reimer2020) or the Southern Hemisphere Curve (SHCal20; Hogg et al. Reference Hogg, Heaton, Hua, Palmer, Turney, Southon, Bayliss, Blackwell, Boswijk, Ramsey and Pearson2020) is the most appropriate for calibrating radiocarbon results (e.g. Ogburn Reference Ogburn2012; Marsh et al. Reference Marsh, Kidd, Ogburn and Daran2017). This relates to the realisation that large parts of the Eastern Andes had atmospheric carbon influx from the Northern and Southern Hemispheres due to the South American Summer Monsoon (Marsh et al. Reference Marsh, Bruno, Fritz, Baker, Capriles and Hastorf2018). Because the precise nature of atmospheric mixing is unknown, archaeologists have used different curves. Ogburn (Reference Ogburn2012) observes that, for the period encompassed by the Late Horizon, the application of IntCal results in dates at the 95.4 per cent confidence interval that are 15–20 years earlier than those produced if SHCal is used. For the period corresponding to the Late Horizon, these discrepancies are significant in the interpretation of Inca chronology. To address this problem, Ogburn (Reference Ogburn2012) suggested publishing dates calibrated with the most recent versions of both curves (Covey Reference Covey2018; Quave et al. Reference Quave, Covey and Durand2018). We follow this practice in Table S5, which presents the 26 dates from Machu Picchu using both IntCal20 and SHCal20.
More recently, an alternative approach known as the ‘mixed calibration curve’ has been proposed, which accounts for atmospheric carbon inputs from the Northern and Southern Hemispheres (Marsh et al. Reference Marsh, Bruno, Fritz, Baker, Capriles and Hastorf2018; Hogg et al. Reference Hogg, Heaton, Hua, Palmer, Turney, Southon, Bayliss, Blackwell, Boswijk, Ramsey and Pearson2020). Application of this curve can be run on OxCal using the ‘Mix_Curve’ command (see the OSM). Although this produces slightly wider date ranges than either IntCal or SHCal, it is considered to yield “more accurate estimates of the dated samples and therefore, more robust comparisons to historic dates” (Marsh et al. Reference Marsh, Bruno, Fritz, Baker, Capriles and Hastorf2018: 933). A recent article presenting three radiocarbon measurements from Machu Picchu also employs a mixed calibration (Ziółkowski et al. Reference Ziółkowski, Bastante Abhuhadba, Hogg, Sieczkowska, Rakowski, Pawlyta and Manning2020). For these reasons, the dates presented here are also calibrated using this method (for comparisons of the different curves, see Table S5 and Figures S3–6).
Results and chronological implications for Machu Picchu
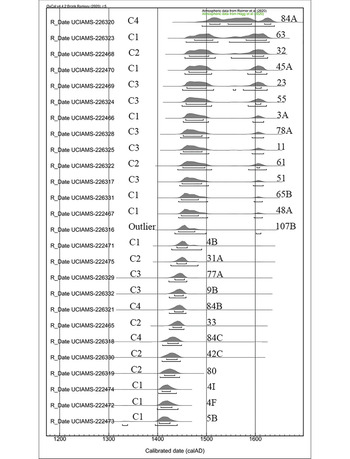
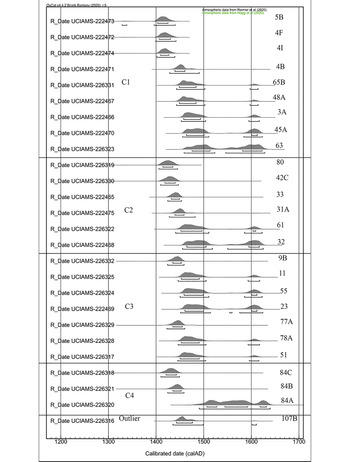
The results for the 26 new AMS measurements from the Machu Picchu burials are presented in Figure 3. As each of the cave burials constitutes its own basin of deposition, no stratigraphic relationship can be determined between them. As can be appreciated from Figure 3, the assays present a consistent and coherent pattern. The uncalibrated radiometric measurements range from 550±20 BP–345±20 BP, and when these results are calibrated and arrayed in chronological order (Figure 4) they appear as a series of overlapping curves extending over most of the fifteenth century and into the early sixteenth century. The burials are spaced across this time range, with no indication for any obvious gaps, such as a bimodal distribution that might suggest a hiatus and reoccupation of the site. The results therefore indicate a single unbroken occupation of Machu Picchu between c. AD 1420 and 1530.
Multiplot showing AMS results sorted chronologically (dates calibrated with the mixed calibration curve using OxCal v4.4; Hogg et al. Reference Hogg, Heaton, Hua, Palmer, Turney, Southon, Bayliss, Blackwell, Boswijk, Ramsey and Pearson2020; Reimer et al. Reference Reimer2020) (figure by the authors).

None of the 26 measurements indicate a date in the fourteenth century. This is consistent with the ceramic collections, which indicate the absence of a pre-imperial Late Intermediate Period occupation at Machu Picchu. Some of the younger AMS assays from Machu Picchu have curves that include two separate peaks, the second of which falls c. AD 1600. These are almost always low probabilities and appear to be the product of the flattening of the calibration curve at this point; they can be tentatively dismissed as a function of the calibration method. The overall absence of post-AD 1530 measurements is consistent with the lack of evidence in Bingham's excavations for a significant colonial-period occupation at Machu Picchu. A single bead of fused glass was the only post-Conquest artefact recovered from the graves (Bingham Reference Bingham1930: 116).
The AMS measurements can also be considered in relation to unresolved questions regarding the burial patterns at Machu Picchu, for example, the significance of the multiple burial clusters or cemeteries observed by Bingham and Eaton. One possibility was that they might show chronological differentiation; Bingham refers to the western terraces (i.e. cemetery four) as containing the ‘oldest’ burials (Bingham Reference Bingham1930: fig. 219). Figure 5 arranges the measurements by cemetery and clearly demonstrates that the cemeteries are largely contemporaneous.
Multiplot showing results sorted by burial locations (dates calibrated with the mixed calibration curve using OxCal v4.4; Hogg et al. Reference Hogg, Heaton, Hua, Palmer, Turney, Southon, Bayliss, Blackwell, Boswijk, Ramsey and Pearson2020; Reimer et al. Reference Reimer2020) (figure by the authors).

Another question that can be explored, though not resolved, is the issue of the relationships between individuals in multiple interments found in a single cave burial. The genetic aspect of this question is currently under investigation using ancient DNA analysis, but the temporal aspect can be considered here for two burial caves (Figure 3). Burial cave four held six individuals, but only three (UCIAMS-222471, 222472, 222474) were analysed. Using 1-sigma confidence intervals, two of the individuals (UCIAMS-222472 and -222474) produced similar AMS measurements (AD 1406–1430 and AD 1409–1426, respectively), but the third individual yielded a calibrated date of AD 1439–1460. Similarly, in grave 84, two of three individuals (UCIAMS-226318 and -226321) yielded similar calibrated dates (AD 1420–1442 and AD 1434–1452), but the third (UCIAMS-226320) appears to have died at a later date, with AD 1506–1631 being the most probable estimate. In both caves, therefore, there is evidence that the individuals found in multiple interments were buried at different times; the same conclusion is reached using 2-sigma confidence intervals (Figure 3).
As discussed above, an earlier attempt to date the burial population of Machu Picchu, published in Antiquity (Berger et al. Reference Berger, Chohfi, Valencia, Yepez and Fernandez1988), utilised the radiometric rather than AMS analytical technique. That study analysed seven samples from the osteological collection recovered by Bingham (Table S2). In two cases no date was obtained because of insufficient collagen fraction. The calibrated ages for the remaining five samples were published as: AD 600, AD 1200, AD 1200 and AD 1400 (Berger et al. Reference Berger, Chohfi, Valencia, Yepez and Fernandez1988: tab. 2). The fifth sample was published as ‘AD/BC’, but if calibrated would yield a date ranging from 763 BC–AD 525 (95.4% confidence interval). The standard deviations for the first four analyses range from 180–325 years and is even larger for the fifth. Based on these results, Berger and colleagues concluded that the collagen-based bone dates supported an occupation dating to c. AD 650, and hinted at an even earlier human presence at the site. They argued that the bone dates supported an extended occupation at Machu Picchu and not the single late occupation during Inca times as had been previously supposed (Berger et al. Reference Berger, Chohfi, Valencia, Yepez and Fernandez1988: 710). We believe that the differences between our results (Figure 3) and the earlier radiometric study are due to the limitations of the pre-treatment and other techniques utilised in the UCLA laboratory in 1988. In contrast, three AMS analyses made on carbonised wood from the architectural core of Machu Picchu published by Ziółkowski et al. (Reference Ziółkowski, Bastante Abhuhadba, Hogg, Sieczkowska, Rakowski, Pawlyta and Manning2020) are consistent with the 26 analyses from the burial caves reported here (Table S3).
In the historicist framework proposed by Rowe (Reference Rowe1945), the accession of Pachacuti is dated to AD 1438, and this date has become increasingly reified through decades of repetition. If correct, the country palace at Machu Picchu should have been occupied no earlier than AD 1440 and more likely AD 1450, depending on how much time is assumed for the conquest of the lower Urubamba, the massive reworking of the local topography of Machu Picchu and the construction of the country palace. As illustrated in Figure 4, six of the 26 AMS measurements presented in Figure 3 indicate, however, that Machu Picchu was already occupied before AD 1440. If we consider the 1-sigma ranges for these six assays, which have a 68.2 per cent probability, they are: AD 1406–1430 (UCIAMS-222472), AD 1403–1425 (UCIAMS-222473), AD 1409–1426 (UCIAMS-222474), AD 1420–1442 (UCIAMS-226318), AD 1414–1435 (UCIAMS-226319) and AD 1418–1440 (UCIAMS-226330). All four cemetery areas are represented in these early measurements. At least two of the individuals studied were interred at Machu Picchu before AD 1440 with a probability of 95.4 per cent and, judging from the medians of the radiocarbon measurements, it appears that the country palace at Machu Picchu was functioning by AD 1420, if not earlier.
If the calibrated AMS dates presented here are supported by future analyses, the traditional text-based estimate of AD 1438 for Pachacuti's accession to the throne and his initial conquests would have to be moved back by at least two decades. This suggestion is consistent with the conclusions reached by several other Inca scholars on the basis of radiocarbon evidence from Cuzco and provincial areas outside of Cuzco (D'Altroy Reference D'Altroy2014: 64; Pärssinen Reference Pärssinen and Shimada2015; Covey Reference Covey2018). Our AMS dates from Machu Picchu, however, do not support the position of scholars who argue for a more radical revision of imperial Inca chronology in which the reign of Pachacuti and the expansion of the Inca Empire beyond the Cuzco heartland would be pushed back to the final decades of the fourteenth century (Ogburn Reference Ogburn2012; Marsh et al. Reference Marsh, Kidd, Ogburn and Daran2017). Given the limitations of radiocarbon-dating, the interpretation of AMS dates presented here should be treated with caution, but given the unreliability of the documentary evidence, perhaps the time has come for the radiocarbon evidence to assume priority in reconstructions of the chronology of the Inca emperors and the dating of Inca monumental sites such as Machu Picchu.
Acknowledgements
We express our gratitude to Veronique Belisle, Jorge Calero, Ivan Ghezzi, Bebel Ibarra, Rachel Johnson, Jeffrey Quilter, Yale Provostial Research Fund, the National Science Foundation (grant 1515138), the Ministerio de Cultura, Cuzco and two anonymous reviewers of the manuscript.
Supplementary material
To view supplementary material for this article, please visit https://doi.org/10.15184/aqy.2021.99