1. Introduction
InequalityFootnote 1 has been increasing in a large number of countries in Europe over the past 20 to 25 years. Questions include: what is the population’s attitude to whether societies are fair, is it a public task to intervene in this, does the public’s attitude change over time, and does this change depend on a number of socio-economic conditions? There has continued to be redistribution in welfare states after the financial crisis (Caminada etal. Reference Caminada, Goudswaard, Wang and Wang2019), indicating that the welfare states still have a strong role with regard to ensuring some degree of equality, albeit not to the same degree in all countries, and, as data will show later, there has been an increase in inequality in some of the Nordic countries, indicating that the redistributional impact of welfare states has weakened.
This article is structured as follows: after the introductory section, Section 2 gives a brief description of the development of inequality in the Nordic countries as a background for the analysis. Next comes a series of methodological considerations, and description and presentation of the data. This is followed by a discussion and interpretation of data, including whether a development can be ascertained since 2002, a year chosen as it is the first year where it is possible to use data from the European Social Survey.
The Nordic countries (Denmark, Sweden, Norway and Finland) have been chosen because, as a starting point in analyses of welfare states, they are seen as belonging to the same cluster of welfare state countries with the desire for and a historically high degree of equality compared with countries in other types of welfare regimes, cf. the classical Esping-Andersen description of welfare regimes (Esping-Andersen Reference Esping-Andersen1990; Arts and Gelissen Reference Arts and Gelissen2002), along with a number of recent analyses of Nordic welfare states (Kangas and Kvist Reference Kangas, Kvist and Greve2019; Jónsson and Stefánsson Reference Jónsson and Stefánsson2013; Palviainen Reference Palviainen2019). Naturally, even when belonging to the same welfare regime, there might be country differences, and sometimes countries are placed in other regimes than where they are traditionally placed (Rice Reference Rice2013) – seeing welfare regimes here as an ideal type. This ideal type approach ‘is an empirical classificatory tool that reduces observed complexity by cataloguing existing cases as meaningful representatives (types) of some concept of interest’ (Von Kersbergen Reference Von Kersbergen and Greve2019, 118). Nevertheless, even between countries belonging to the same ideal types we can observe differences.
At the same time, this approach provides an opportunity to examine whether there are differences in perceptions on equality in what is termed the Nordic welfare states. In addition, this article focuses on not only economic inequality but also equality between men and women. There is also the question of whether there are differences in attitudes in the Nordic countries between men and women, assuming that women want more redistribution than men – as was pointed out several years ago in a study, although mainly with US, and by now historical, data (Alesina and Giuliano Reference Alesina and Giuliano2011) – and the difference between men and women in the UK and the US (Shorrocks and Grasso Reference Shorrocks and Grasso2020). The article also looks at whether there is a difference between generations. This because it can be assumed that if a generation has a greater desire for redistribution it may, in the long run, change the desire for changes in public sector intervention, and also that different generations might have self-interest in redistribution. It is not only age that can have an influence on attitudes towards distribution, but also, as mentioned, gender, position in the labour market, education, ethnicity and income can be assumed to influence attitudes to the role of the state in relation to redistribution (Dimick etal. Reference Dimick, Rueda and Stegmueller2018; Rueda and Stegmueller Reference Rueda and Stegmueller2016; Burgoon etal. Reference Burgoon, Koster and Van Egmond2012). The existing literature on economic inequality is large and, given the size of this article, only a limited amount can be presented; however, see Atkinson and Bourguignon (Reference Atkinson and Bourguignon2014); Silber (Reference Silber and Silver1999); Coulter and Arqueros-Fernández (Reference Coulter and Arqueros-Fernández2019); Salverda etal. (Reference Salverda, Nolan and Smeeding2009) for a large number of references to a number of issues related to inequality, including measurement issues.
This article looks into change and difference in preferences for redistribution, where one issue is the generational contract as people have age-related social risk (Birnbaum etal. Reference Birnbaum, Ferrarini, Nelson and Palme2017), so that one generation supports the other with the expectation that the next generation will do the same. Besides generational solidarity, there might also be a self-interest when supporting the welfare state, for an early overview of this discussion see Jæger (Reference Jæger2006). Preferences for redistribution might also depend on religion, macroeconomic development and tradition and culture (Alesina and Giuliano Reference Alesina and Giuliano2011), which is also a reason for looking into a specific welfare regime, since history and culture form part of the reason for the Nordic welfare states’ development (Baldwin Reference Baldwin1990).
Self-interest might be a reason for preferences with regard to redistribution. As an example, it has been argued that the ‘individual differences in childcare support among European parents are driven by interest, ideologies and assessments of current provision’ (Chung and Meuleman Reference Chung and Meuleman2017, 61). Self-interest as a driver for change can be pursued by welfare chauvinism (Ennser-Jedenastik Reference Ennser-Jedenastik2018). Self-interest and welfare chauvinism can be related (Greve Reference Greve2019). The whole issue of legitimacy and social benefits also indicates that some groups are more deserving, which can have an impact on the support for redistribution (Oorschot and Roosma Reference Oorschot and Roosma2015).
The self-interest argument for development in welfare states has been pointed out, and ‘implies that the elderly or older middle-aged population should be more likely to support public programs for the elderly, but less likely to support programs for children’ (Blekesaune and Quadagno Reference Blekesaune and Quadagno2003, 416). In addition, there is, in general, large backing to support the elderly (Deeming Reference Deeming2018). The elderly are, simultaneously, less likely to support, for example, education if this would imply a cut in pension, but with the possible difference that the high-trusting elderly will tend to support such a cut to a lesser extent (Busemeyer and Lober Reference Busemeyer and Lober2019). This should imply that in the Nordic high-trusting societies (Martela etal. Reference Martela, Greve, Rothstein, Saari, Emmanuel De Neve, Helliwell, Layard and Sachs2020; Helliwell and Wang Reference Helliwell and Wang2011) the elderly will support redistribution in general, and not only for the sake of their own position.
Overall, this points to self-interest being central, whether generalized or reciprocal, which implies a risk of contradiction in the development of welfare states in different areas, such as income transfers to the unemployed and pensioners, and care for children and the elderly. Income transfers to the unemployed is an example of where self-interest and support are often low, and this might reduce legitimacy in times of different kinds of external shocks to the state’s ability to finance and develop welfare states (Rehm etal. Reference Rehm, Hacker and Schlesinger2012). This also leads to a focus on drivers for changes (Guiraudon and Martin Reference Guiraudon, Martin and Greve2019) where a possible driver can be in a voter’s self-interest, in promoting policies they gain from personally. How strong the impact on social development will be depends on how conflicting interests are mediated in the different welfare states. Furthermore, there might be a relation to the position of the median voter, albeit not given that they have unidimensional preferences, and that preferences for redistribution is therefore not a sufficient condition for change or even support for change (Romer and Rosenthal Reference Romer and Rosenthal1979; Kenworthy and McCall Reference Kenworthy and McCall2008). Still, in all Nordic democratic welfare states there needs to be a majority to change the distribution of income. Given the expected demographic changes, with an increasing proportion of the elderly, this also leads to an expectation of growing support for public spending on old age people (especially pensions and long-term care), which could in the future lead to a higher degree of equality given that the elderly also in the Nordic countries have, on average, lower levels of income than the average.
The analysis is thereby also related to the literature on voters’ attitudes towards welfare development, where self-interest is often seen as an important parameter (Taylor-Gooby and Leruth Reference Taylor-Gooby and Leruth2018). When self-interest is important, then one’s socio-economic position can have an impact, which is also true for gender if there are different preferences among men and women, and also due to gender differences in terms of outcomes, including the gender wage gap. Women are, historically, also in the Nordic countries, expected to be more supportive of the welfare states (Svallfors Reference Svallfors1997), which might reflect that women value quality of life more (Balestra etal. Reference Balestra, Boarini and Tosetto2018). A study has further shown that students are more supportive of spending on education and the unemployed, than they are spending on unemployment policies (Busemeyer and Garritzmann Reference Coulter and Arqueros-Fernández2018), albeit depending on the existing government size, so that conflicts also in mature welfare states are not about support to welfare states as such, but more between which services and benefits to allocate spending (Busemeyer and Neimanns Reference Busemeyer and Neimanns2017). Income can be an important predictor of attitudes, presumably even more than class (Kevins etal. Reference Kevins, Horn, Jensen and van Kersbergen2018), although a study with (mainly US) data from 1987 to 2010 did not show any impact on income inequality with regard to support for redistribution (Breznau and Hommerich Reference Breznau and Hommerich2019), but did conclude ‘as long as preferences do not change, inequality will likely continue rising’ (Breznau and Hommerich Reference Breznau and Hommerich2019, 185).
Thus, the hypotheses to be analysed are, based upon the above presentation and discussion, whether for different socio-economic groups in all Nordic countries that:
Hypothesis 1: Women are more supportive of redistribution than men.
Hypothesis 2: The elderly are more supportive of state welfare redistribution.
Hypothesis 3: Higher education implies stronger support for education.
Hypothesis 4: Higher income reduces redistribution support.
Overall, the article contributes with new knowledge on the possible differences among the universalisticFootnote 2 Nordic welfare states on their variation in support of welfare state redistribution, with regard to different socio-economic groups.
2. Development of Inequality
Table 1 shows the development of inequality in the four Nordic countries since 2002 through the use of the Gini coefficient as a measure of inequality. Theoretically, there could be a possibility that attitudes to the state’s role in relation to inequality depend on the total scope of public spending. Therefore, social spending as a share of GDP is also shown.
Gini-coefficient of equivalized disposable income for the Nordic countries and the EU.

Source: EU, ilc_di12 (accessed 26 January 2021).
The table indicates that the development has been different from a standstill in the EU on average (albeit data are only available from 2010), to an increase in Sweden and Denmark, and a decline for Finland if starting in 2001, but a standstill in Finland since 2005, thus contrasting the development compared with that described above from the mid-1980s until 2004. Norway has, especially compared with Denmark and Sweden, had a different development, with a decline of more than 3 points since 2005. Thereby, even when using a welfare regime approach, there can be differences across countries.
Figure 1 indicates whether or not there is a connection between the Gini coefficient and social spending.
The GINI-coefficient and government social protection spending as a percentage of GDP, 2001–2017 (to view this figure in colour please see the online version of this journal).
Source: Eurostat, spr_exp_sum and GINI (accessed 12 June 2020).

Overall, the pattern does not indicate a significant relation between the level of social spending and inequality. This might reflect that spending over time has been influenced by not only support for redistribution, but also the impact of the financial crisis. There are, nevertheless, some differences. Norway and Finland have increased spending as a percentage of GDP and reduced inequality, whereas Denmark – despite an increase in spending – has a higher level of inequality. Sweden has the same spending level, but higher inequality. So, there is no unique pattern in the development, also making it important to look into whether or not there have been changes in redistribution preferences among different socio-economic groups.
3. Methodology
One weakness in asking for support for changes in the income distribution may be that many do not know the actual level of inequality, and that the desired level might be dependent on one’s own position in society, which also applies, for example, to how satisfied the individual is (Ejrnæs Reference Ejrnæs and Greve2020). Responses may also depend on the current financial situation, including whether people are unemployed or at risk of becoming unemployed, as this affects people’s satisfaction (Helliwell and Huang Reference Helliwell and Huang2014; Chung Reference Chung2016). There might therefore be a number of exogenous factors having an impact on the changes in inequality.
The European Social Survey (ESS) is the data basis for the analysis. The dataset contains the attitudes, beliefs and behaviour patterns of representative cross-national samples from 30+ European countries, where face-to-face interviews are conducted every two years. (ESS 2021).
Design weights are available to ensure representativeness (external validity) of samples. Except for Norway, weights were 1 for every respondent. Norway differed with slightly unequal weights for the sample, but comparing results did not produce any noteworthy differences, and in particular no major differences materialized in the case of significant results. For this reason, it was chosen to not apply weights to the statistical analyses. However, weighted results (only relevant for Norway) are available from the authors upon request.
The redistribution preference in ESS is operationalized by asking respondents to which degree they agree with the statement (ESS 2020, question B33):Footnote 3 ‘The government should take measures to reduce differences in income levels’. The possible answers are of the Likert-scale type (Likert Reference Likert1932): ‘Agree strongly’ (1), ‘Agree’ (2), ‘Neither agree nor disagree’ (3), ‘Disagree’ (4), and ‘Disagree strongly’ (5). Additionally, the categories ‘(Refusal)’ (6) and ‘(Don’t know)’ (7) are also used. Only the first five answers (coded 1–5) are used in the following. For interpretative purposes we reverse the scale such that the possible values are still 1 through 5, with 1 representing strongly disagree and 5 representing strongly agree, e.g. the higher the value the more strongly the respondent thinks government should reduce income differences among the citizens. For validity and sensitivity analyses purposes it would have been good to also include other measures of support for redistribution, but those questions only exist for two rounds, while this analysis focuses on a longer time period.
Although, the analysed answers are coded 1–5, the actual answers are ordinal in nature, which is why an ordinal regression approach is required (Greene Reference Greene2019) to estimate the cumulative probability of choosing/answering a given ordinal response. This approach was used, but the estimated parameters need to be transformed in order to make them more easily interpretable. The (transformed) ordered logit marginal effects were compared with regression estimates from linear regression and they showed nearly the same magnitudes, and thus, in the following, we present the simpler linear regression approach but also present ordinal logit regressions in the Appendix. This also means that we are treating responses 1–5 as if they were an interval variable (although actually being an ordinal variable), which is supported by Ferrer-i-Carbonell and Frijters (Reference Ferrer-i-Carbonell and Frijters2004) in the case of ordinal responses in relation to subjective well-being (happiness).
4. Data
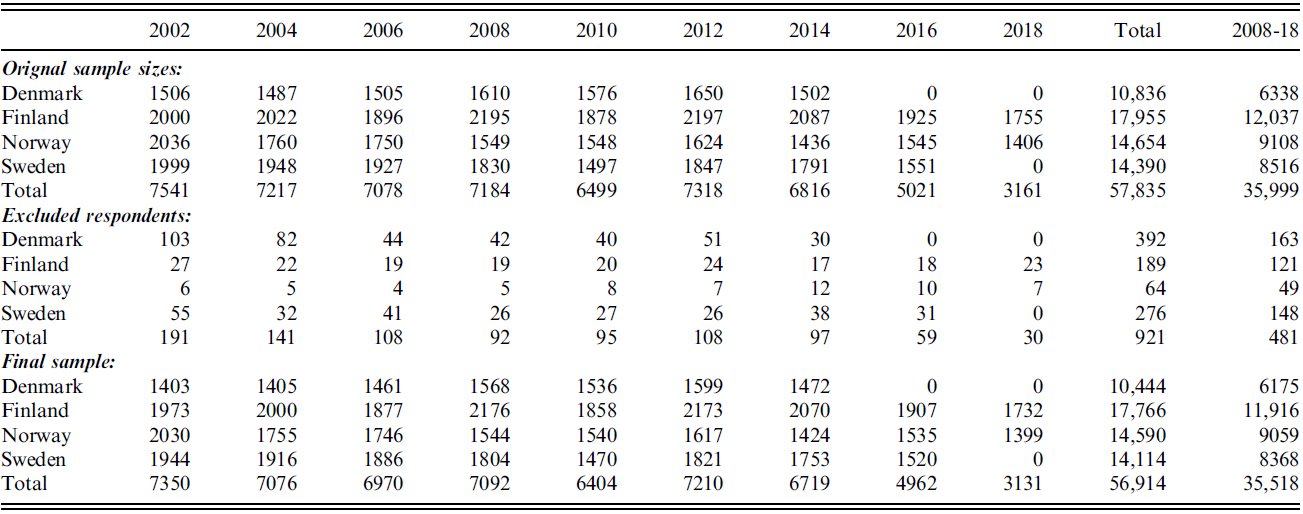
All rounds 1–9 from the European Social Survey are used for the Nordic countries Denmark, Finland, Norway and Sweden, covering the years 2002, 2004, …, 2018 in the form of the dataset versions ESS1–8e01 and ESS9e01_2.Footnote 4 The total number of respondents is 57,835 (Table 2). Among these, 921 respondents had incomplete answers, including 918 respondents who did not answer question B33; 813 answered they don’t know (code 6) while the remaining 75 respondents refused to answer the question (code 7). An additional three respondents were excluded since there was no information on gender. The 921 respondents corresponds to leaving out 1.6% of the original sample, which is supposed not to seriously affect any results. There is some variation among the countries, such that 3.6% (392 respondents) are left out for Denmark and only 0.4% (64 respondents) for Norway. There is also some variation over the years, but again with most cases left out for Denmark (2002) and the least cases left out for Norway (2006).
Original sample, exclusions, and final sample.

Source: Own calculations based on ESS data for 2002–2018.
The final sample size used for the descriptive analysis is 56,914, and the spatial sample size variation is between 14,114 (Sweden) and 17,766 (Finland), while the temporal sample size variation is between 3131 (2018) and 7350 (2002). There are no data for Denmark in 2016 and 2018, and for Sweden in 2018.
Income information is not available for 2002–2006, and thus those years are excluded from the regressions. Instead, the data for 2008–2018 are used. The original sample included 35,999 respondents, including 481 persons with missing data, which is equivalent to 1.3% of the original sample, and thus the attrition is actually smaller than when using the sample for all years. The final data total for the regression analyses is thus 35,518 respondents.
We investigate whether gender, unemployment, discrimination, age, and education (number of years) affect the degree of support for the government to redistribute income. An overview of the dependent variable is presented in Table 3. The distribution of respondents giving their view on the statement ‘The government should take measures to reduce differences in income levels’ varies between the four Nordic countries, except for the middle category of undecided people that neither agree nor disagree with the statement (17–22% of respondents). Denmark has by far the largest percentage strongly disagreeing (8%), and the lowest percentage strongly agreeing (10%). The other three countries have a much lower share strongly disagreeing, and a much larger share strongly agreeing with the statement. Assigning values 1–5 to the ordinal variable, the distribution means that the average for Denmark is lowest at 3.0 and highest in Finland with 3.9.
Distribution of answers to ‘The government should take measures to reduce differences in income levels’.

Source: See Table 2.
Summary statistics for all included variables as well as the base categories are presented in Table 4. This gives an overview of the structure of the data, including the distribution of the observations across central distinctions such as country, time periods, demographics, etc. All explanatory variables in the regression analyses are 0/1 dichotomous variables. Both age and education are categorized into year intervals. Female is coded as 1 (male are 0). A person is defined as unemployed (coded as 1) if he/she was unemployed during the last 7 days and was looking for a job. If the respondent describes him or herself as belonging to a discriminated against group than this is coded as 1. The income variable is ordinal and attempts to make respondents self-classify into national household disposable income deciles. It is seemingly not a perfect measure since 10% of the sample is not in each decile. On the other hand, the measure is probably better than it looks, since we should actually not expect 10% in each decile as the European Social Survey is representative for individuals while the income measure is on the household level. Additionally, persons below 15 years are not included in the survey, which is another reason why we would not expect 10% in each decile, Finally, around 7% do not answer the income question, which can also contribute to the deviation from 10%.

5. Results
The first impression is that the citizen support is rather stable over time in the Nordic countries, but also that some significant differences exist between the Nordic countries (Figure 2). Thus, all four countries have a remarkably stable redistribution support over time even though the period from 2002 to 2018 was characterized by major changes, including business cycles and the ‘The Great Recession’ after the financial crisis. The middle of the period was characterized by adverse macroeconomic effects (EU Commission Reference Commission2009), but at the same time the financial and economic crisis did actually not lead to a broadly based reduction in multi-dimensional welfare (Hussain etal. Reference Hussain, Siersbæk and Østerdal2020), which could be one reason behind the stable development in redistribution support.
‘Government should reduce differences in income levels.’ (1 = strongly disagree and 5 = strongly agree) (to view this figure in colour please see the online version of this journal).
Source: See Table 2.

Finns top the support for governmental redistribution, with a staggering support hovering around 3.9, and only varying slightly between 3.8 and 4. At the bottom, we find Denmark with support around 3, also with negligible variation over time. Norway and Sweden are in between with support around 3.6–3.7, but with Norway having a little greater temporal variation than any of the other Nordic countries. Thus, although the countries are often considered very similar in terms of welfare regime, we see that the support for redistribution shows a rather large difference, with support in Finland being around 30% higher than in Denmark. The high degree of stability mirrored in Figure 2 is investigated further within each country to see if the distributional support varies across population sub-groups.
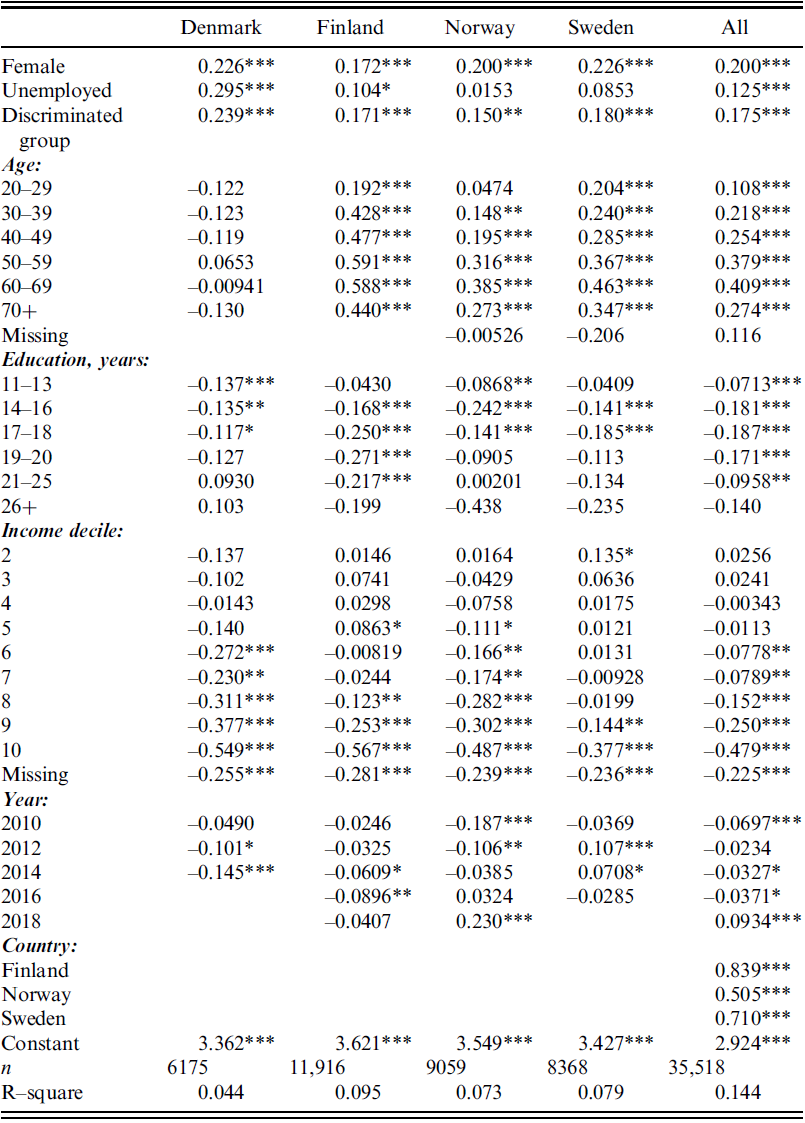
From Table 5’s regressions of attitudes towards redistribution, we see that many parameters are statistically significant, which is unsurprising given the large sample size. There is some difference in sample sizes, with Finland at nearly 12,000 observations, while Denmark is represented with a little over 6000 observations. Nevertheless, in all countries, the sample sizes are very high. Being female or in a discriminated group increases support for redistribution and with nearly the same magnitude (around 0.15–0.24) in all countries, which is in line with the first hypothesis. Reasons behind the result could be the gender wage-gap as well as the fact that women, to a higher degree, are employed in the public sector (Albæk etal. Reference Albæk, Larsen and Thomsen2017; Kovalainen Reference Kovalainen2019), both of which points to relatively lower income for women.
OLS regression coefficients for support to the view that government should redistribute income. 2008–2018.

* p<0.05, ** p<0.01, *** p<0.001. Note: Base categories are age 15–19 years, up to 10 years of education, first income decile, the year 2008, and Denmark.
Source: See Table 2.
Support among the unemployed is largest in Denmark with a value of 0.30, and insignificant in Norway and Sweden (0.02 and 0.09), and 0.10 in Finland. The high level for Denmark could be related to the fact that unemployed persons experience relatively high net replacement rates in the event of unemployment, which is 85% for Denmark and less than 70% for the other countries, assuming a one-person household earning 2/3 of the average wage.Footnote 5 However, for those on average wage, the net-replacement rate is higher in Norway (63%) compared with Denmark (60%), with Finland (55%) and Sweden (48 %) having lower levels. This indicates that a high level of benefits reduces support for intervention for some, but might also increase it for others.
Age seems not to affect redistribution support much for Denmark, while ageing generally increases support in the three other countries, particularly in Finland, where people aged 50–69 years have 0.59 points (15% of the average level) higher support than the youngest group aged 15–19 years. The second hypothesis is thus not supported for all countries.
There is a general tendency of reduced redistributional support until 18 years of education (compared with up to 10 years of education) in Denmark, Norway, and Sweden. In contrast, Finns with 19–20 years of education have 0.27 points (7% of average) lower support than Finns with up to 10 years of education. Thus, the third hypothesis is only somewhat supported by the behaviour in Finland.
In all four countries, the top two income levels (quintiles) support redistribution less than the lower income levels. In Norway and Denmark, this reduced support starts at deciles 5 and 6, respectively. Danes in the top decile have 0.55 points (18% of the Danish average) less support for redistribution compared with people in the lowest decile. This supports the fourth hypothesis about income levels and redistribution attitude.
With the presence of both education and income, the marginal effects of both can be difficult to estimate more precisely since the two variables are expected to be correlated. In the current analysis, deciles and years of education have a correlation around 0.3, which seems not be to a high correlation. Additionally, the multi-collinearity diagnostic VIF shows a maximum value of only 3.5, which means the estimated parameters are not expected to be biased due to correlation among the explanatory variables.
The results above confirm that self-interest can be an important aspect of support for redistribution, albeit not necessarily the only explanation.
The year effects are often insignificant, and even in significant cases they are generally of low magnitude (except for Norway 2010), which reflects the pattern observed in Figure 1. The country effects similarly confirm the ranking observed in Figure 2.
Ordinal logit regression estimated parameters comparable with OLS in Table 5 are presented in Table A1 in the Appendix.
6. Discussion and Conclusion
Methodologically, ordinal logit regressions are required, but here the OLS regression approach was applied since the marginal effects from the more complicated ordinal regression were very much in line with the simpler OLS. The hypotheses were tested using data from the European Social Survey covering the years 2002, 2004, …, 2018.
The Nordic countries are characterized by high support for income redistribution, with the highest in Finland (average 3.9 out of a maximum of 5), and lowest in Denmark (3.1), while Sweden and Norway were in between. All four countries have a remarkably stable support over time, even though the period from 2002 to 2018 went through business cycles as well as the financial and economic crises. Thus, despite times of, for example, higher levels of unemployment and insecure economic positions, the viewpoints of redistribution seemingly have not changed in the Nordic countries.
Females and discriminated groups more strongly support income redistribution than others and nearly to the same degree in the four Nordic countries. A possible reason for the difference between men and women might be – which is also in line with the information on preferences among income groups – that not only do men earn more than women, but also that this is even more pronounced when looking into top-income earners (Atkinson etal. Reference Atkinson, Casarico and Voitchovsky2018).
Unemployed persons support redistribution more in Denmark, while unemployment had no effect in Norway (statistically insignificant), nevertheless this support in Denmark has not changed over the years, although the unemployment rate has changed. Age hardly affects support in Denmark, while ageing in Finland clearly increases support for income redistribution via the government. Among the two highest income groups, support for income redistribution is clearly less than the lower deciles in each and all of the four countries, which supports the self-interest hypothesis. More education is correlated with lower support for income redistribution in Finland, but not in the other countries.
Thus, there is, to conclude, despite similar types of welfare states in Nordic countries, differences in which groups are more or less supportive of government intervention in order to redistribute income. This is despite the fact that, given the variation in the development of inequality (increasing in Denmark and Sweden), one might have expected some variation, while, at the same time, there are also similarities in which socio-economic groups support governmental intervention in income distribution.
The conflicting perspectives among citizens in the four countries also points towards the need for more knowledge on why there are these differences among citizens in the universal and encompassing Nordic welfare states. Self-interest seems to be one, but not the only, reason for variations in income redistribution preferences.
Conflict of Interest
On behalf of the authors, the corresponding author (M. Azhar Hussain) states that there is no conflict of interest.
Data Availability
The datasets generated and/or analysed during the current study are available in the European Social Survey (ESS) repository, https://www.europeansocialsurvey.org/data/round-index.html.
Appendix
Ordered logistic regression coefficients for support to the view that government should redistribute income, 2008–2018.

* p<0.05, ** p<0.01, *** p<0.001.
Source: See Table 2.