Introduction
Nanomaterials have been widely investigated because of their special physical and chemical properties. One has witnessed many breakthroughs and discoveries when nanoparticles are applied as advanced catalysts [Reference Sun and Bao1, Reference Ta, Liu, Chenna, Crozier, Li, Chen and Shen2, Reference Carrasquillo-Flores, Ro, Kumbhalkar, Burt, Carrero, Alba-Rubio, Miller, Hermans, Huber and Dumesic3, Reference Shekhar, Wang, Lee, Williams, Kim, Stach, Miller, Delgass and Ribeiro4]. When material’s scale is reduced to the nanometer dimension, changes are expected in the electronic structures, which allows one to well tune physical and chemical properties. Usually, such properties, including adsorption and redox ability, are closely related to the catalytic performance. Therefore, there is an intimate connection between the catalytic performance and the particle size for the given nanoparticles. To make clear this relationship, a series of nanoparticles with the precisely controlled sizes should be prepared, because growth kinetics is necessary for particle size adjustment [Reference Asakura, Hosokawa, Ina, Kato, Nitta, Uera, Uruga, Miura, Shishido, Ohyama, Satsuma, Sato, Yamamoto, Hinokuma, Yoshida, Machida, Yamazoe, Tsukuda, Teramura and Tanaka5, Reference Gänzler, Casapu, Vernoux, Loridant, Cadete Santos Aires, Epicier, Betz, Hoyer and Grunwaldt6, Reference Moreno, Pérez, Merino, Portillo, Tellez, Rosas and Tototzintle7, Reference Lakhwani and Rahaman8]. With help of grain growth kinetics, one is able to set up a function relationship between the condition parameters over growth process and the obtained grain size of nanoparticles, and also to predict the other size-dependent properties, such as catalytic activities could be further studied.
Here, cerium oxide (CeO2) nanoparticles were selected as a target for grain growth kinetic studies because of the following considerations: (i) CeO2 has been frequently studied as a catalytic material due to its excellent physical and chemical properties. Cerium ions can be stably maintained in trivalent or tetravalent state, and CeO2 has the ability to undergo electron transfer through a redox process, leading to a large number of oxygen vacancies in CeO2, essential for oxygen storage. On the other hand, CeO2 has a good adsorption property. All these unique properties enable CeO2 to create high activity for many catalytic processes. So, it is rational to develop a kinetic-controlled method that could produce an effective composite catalyst over CeO2 substrate. (ii) As a typical catalytic material, CeO2 has shown a great potential for many applications. CeO2-based catalysts have been reported for degradation of gas oxides with important practical significance in industrial waste gas and automobile exhaust gas purification. For instance, Nie Lei and other teams have made great contributions in improving the catalytic performance of CeO2-based nanomaterials for CO oxidation reaction [Reference Nie, Mei, Xiong, Peng, Ren, Hernandez, DeLaRiva, Wang, Engelhard, Kovarik, Datye and Wang9]. Yang et al. reported that ceria exhibited high photoreactivity for low-temperature decomposition of N2O to form N2 [Reference Yang, Yu, Pleßow, Heißler, Weidler, Nefedov, Studt, Wang and Wöll10] and so forth [Reference Kattel, Liu and Chen11, Reference Abdel-Mageed, Kucerova, Bansmann and Behm12, Reference Stere, Anderson, Chansai, Delgado, Goguet, Graham, Hardacre, Taylor, Tu, Wang and Yang13, Reference Wang, Dangerfield and Li14, Reference Jeong, Bae, Han and Lee15, Reference He, Yang, Li, Shi, Chen, Zhang and Zhu16, Reference Gao, Zhang, Zhou, Cai, Zhao, Huang, Li, Zhu, Liu, Yang, Wang and Bao17]. It is fundamentally important to develop a grain growth kinetic-controlled method. One may thus prepare a composite catalyst over CeO2 substrate for practical applications. (iii) Previous studies on the growth kinetics of CeO2 hardly link the particle size to the catalytic performance. With the controlled syntheses, this work will focus on how large the particle size is suitable for catalyzing a specific chemical reaction for CeO2-containing nanomaterials. (iv) Previous literature of CeO2-based nanomaterials has paid more attention to the size effect of the loaded matters (as noble metals such as Rh, Pt, and Au) [Reference Podor, Clavier, Ravaux, Claparede and Dacheux18, Reference Ko, Yang, Wang and Zhao19], whereas the size effect of CeO2 substrate itself is always neglected, which does not help to understand the performance of CeO2-based nanomaterials. As a consequence, a systematic study on the grain growth kinetics of CeO2 nanomaterials is highly necessary.
In this work, grain growth kinetics of CeO2 nanoparticles was studied via a kinetically controlled sintering method, and Pt was further dispersed on CeO2 particles to obtain a composite catalyst for CO oxidation reaction. By controlling the sintering conditions, the growth kinetics of the particle size of CeO2 nanoparticles was explored. Furthermore, the relationship between particle size of CeO2 nanoparticles as the substrates of Pt/CeO2 composite catalysts and the catalytic activity was studied and discussed. X-ray diffraction (XRD) data were exploited to calculate the grain size. The morphology and grain size were further observed via transmission electron microscopy (TEM). Nitrogen adsorption and desorption experiment were conducted to explore the gas adsorption and desorption behavior of CeO2 nanoparticles to obtain more information on its microstructure. X-ray photoelectron spectroscopy (XPS) was used to analyze the elemental composition of the sample surface. To understand the vibrational behavior of CeO2 molecules with different particle sizes, Raman characterizations were performed. Temperature-programmed reduction with hydrogen (H2-TPR) technique was used to reveal the reduction ability of CeO2 nanoparticles, estimate the interaction between Pt nanoparticles and the CeO2 support, and further to understand the change of catalytic performance of samples. The performance test on CO oxidation of the Pt/CeO2 composite catalyst illustrate the correlation between catalytic performance and subtrate’s size. The results of this work may help to determine the size of substrate for composite catalyst and promote the applications of CeO2 in many fields, such as removal of CO gas in automotive and industrial exhaust gases as well as elimination of trace CO in proton exchange membrane fuel cells.
Results and discussion
Particle size distribution and morphology of CeO2 nanoparticles under different preparation conditions
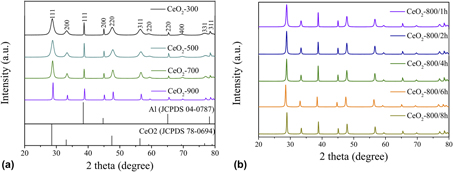
A series of CeO2 nanoparticles were prepared by calcining cerium nitrate at different temperature and time. The calcining temperature was chosen via thermogravimetric analysis for raw material of Ce(NO3)3·6H2O (Fig. S2). XRD analysis initially get the structure and phase information of the prepared CeO2 nanoparticles, and more importantly, the particle size is going to be calculated via XRD data. As shown in Figs. 1 and S1, all diffraction peaks are well defined and well match the standard diffraction data of fluorite CeO2 (JCPDS, No. 78-0694). No trace of other phases was found. In the following, reaction temperature and time were taken as two variables to control the growth of CeO2 nanoparticles. It can be seen that the diffraction peaks became sharp and narrowed with increasing temperature or prolonging reaction time, implying an increased crystallinity and the grain growth. Furthermore, the calculated particle sizes by XRD data using the Scherrer formula also confirm that the nanocrystals’ particle size grew from 11 to 100 nm as the calcining temperature changing from 300 to 1000 °C at a fixed calcining time of 2 h. Similarly, the particle size of the nanocrystals increased from 30 to 57 nm with prolonging the calcining time from 1 to 8 h at the fixed temperature condition of 800 °C.
(a) Powder XRD patterns of CeO2 obtained by setting the reaction temperature at 300, 500, 700, and 900 °C and a fixed reaction time of 2 h. (b) Powder XRD patterns of CeO2 obtained by setting the reaction duration of 1, 2, 4, 6, and 8 h and a fixed reaction temperature of 800 °C. The peak positions were calibrated by using Al as an internal standard.

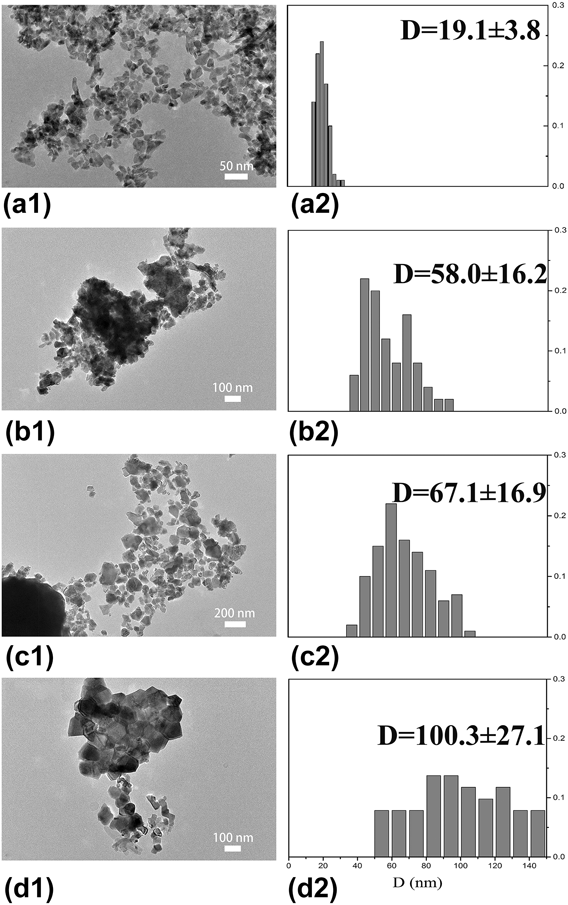
To further observe the morphology of CeO2 nanoparticles and measure the true particle size via the particle size statistics method, TEM was used. From TEM images in Fig. 2, all samples exhibit particles size varying in a wide range from 19 to 100 nm and all particles presented an irregularly ellipsoidal shape. When the sintering temperature below 1000 °C, the particle sizes obtained from XRD and TEM are nearly the same (Table S1). When the sintering temperature is increased to 1000 °C, the actual particle diameter obtained by particle size statistics from TEM is 100 nm, larger than 79.9nm calculated from XRD data, suggesting that the grain size of this sample is beyond the predicted range of Scherrer equation using XRD. By comparing the particle sizes determined by TEM and XRD techniques (Table S1), one can see that XRD is reliable to investigate the growth mode of CeO2 nanocrystals, because the particles sizes calculated by XRD data are in good accordance with those directly observed by TEM except the 1000 °C. Therefore, the particle sizes calculated by XRD data are used in the following discussion, and we would address the growth kinetics of CeO2 nanoparticles in the nanometer dimension via a series of controlled conditions.
TEM images and the corresponding size distributions of CeO2 nanoparticles prepared under different conditions: (a1 and a2) 700 °C, 2 h; (b1 and b2) 800 °C, 8 h; (c1 and c2) 900 °C, 2 h; and (d1 and d2) 1000 °C, 2 h.

Determinations of grain growth kinetics of CeO2 nanoparticles
Here, the sintering procedure for the current sample preparation should be a crystallization process. The growth kinetics over this process could be demonstrated as follows. First, the particle size data calculated using the Scherrer formula based on XRD data are used to fit the following equation:
 $${D^n} - D_0^n = kt\quad ,$$
where D 0 denotes the initial particle size before sintering. D is the particle size of the sample obtained at a given temperature (T) over a reaction period of time (t), k is a constant related to the reaction temperature, and n is defined as the grain growth exponent. The Arrhenius formula describing the kinetics of the process is written as follows:
 $$k = {k_0}{\rm{\ }}\exp \left( {{{ - {E_{\rm{a}}}} / {RT}}} \right)\quad ,$$
where k 0 is a constant, E a is the activation energy for grain growth, T is the temperature, and R is the gas constant. We combine Eq. (1) with Eq. (2) to obtain
 $${D^n} = D_0^n + {k_0}t{\rm{\ }}\exp \left( {{{ - {E_{\rm{a}}}} / {RT}}} \right)\quad .$$
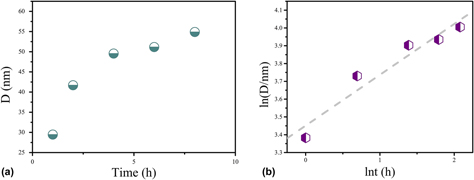
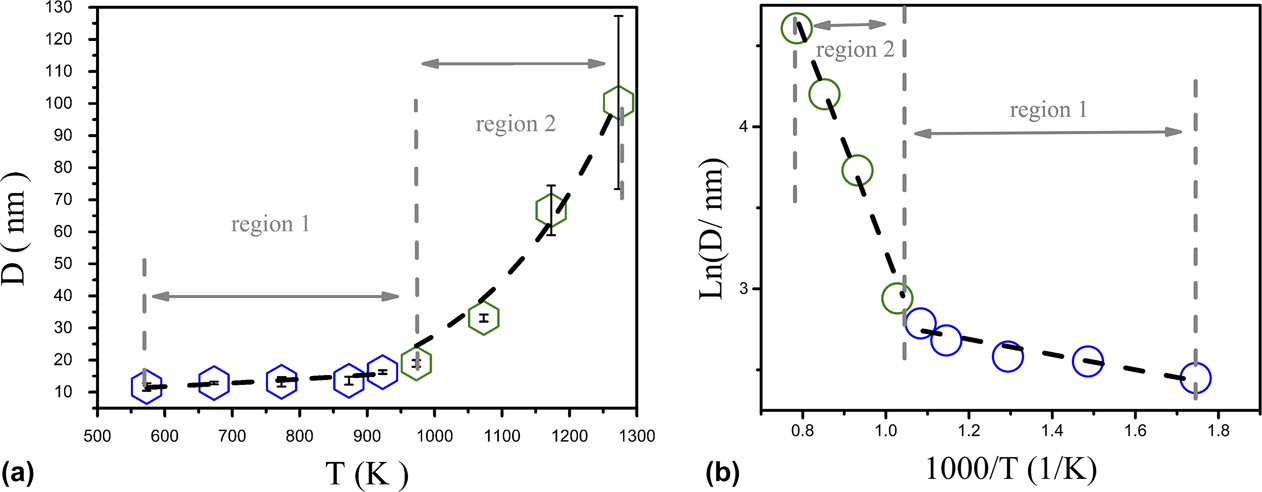
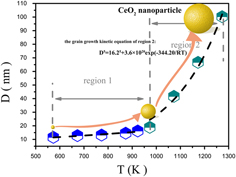
The particle size and reaction time show a simple liner functional relationship if the particles grow under isothermal condition of 800 °C, which is shown in Fig. 3(a). At this point, D 0 = 16.2 nm. Then, we could obtain n = 5 via Eq. (1) by executing a fitting calculation method, because there exists a step-controlled surface diffusion process that obviously affects the growth kinetic. Figure 3(b) shows the log–log plot of reaction time versus particle size. There appears a consecutive line, indicating that the grain growth of CeO2 nanoparticles is an Ostwald ripening (OR) process: large particles would grow at the expense of smaller ones. As the reaction time is fixed for 2 h, the particle size changes with temperature as a simple function relationship, which could be divided into two linear functions of different slopes at a break point of 700 °C as displayed in Fig. 4(a). ln D was used as the ordinate and 1000/T the abscissa. Both linear functions were determined via two regions in Fig. 4(b) as presented in regions 1 and 2. In region 1 (from 300 to 700 °C), the size of CeO2 nanoparticles grows slowly. Then, CeO2 nanoparticles underwent a fast growth process in region 2 (from 700 to 1000 °C). By the slope of the line in region 2 from a linear fitting, E a = 344.2 kJ/mol was obtained with the logarithmic from of Eq. (3). In summary, under the current preparation conditions, the growth kinetics of CeO2 nanoparticles could be described using the following equation:
 $${D^5} = {16.2^5} + 3.6 \times {10^{20}}\exp \left( {{{ - 344.20} / {RT}}} \right)\quad ,$$
When the reaction temperature is set below 700 °C [region 1 of Fig. 4(b)], the grain size hardly increases with reaction time (Table S3). Thus, only the activation energy (E a) for grain growth in region 2 of Fig. 4 could be worked out. Using MATLAB software (Mathworks, Natick, MA), the growth process of CeO2 nanoparticles was in good agreement with the OR process. The similar OR process has been reported in other systems, such as SnO2 [Reference Zhang, Li, Zheng, Li, Zuo, Yang and Li20], Mg(OH)2 [Reference Li, Li, Chen, Zhang and Li21], NiFe2O4 [Reference Wang, Li, Zhang, Chen, Fang and Li22], and YVO4 [Reference Yang, Li, Zheng, Fu, Zheng and Li23].
Relationship between particle size of CeO2 and reaction time at a fixed reaction temperature of 800 °C. (a) Isothermal grain growth of CeO2 at temperature of 800 °C. (b) The log–log plots of reaction time versus particle size prepared at 800 °C.

Relationship between particle size of CeO2 and reaction temperature in a fixed reaction duration of 2 h. (a) Isothermal grain growth for CeO2 at duration of 2 h. (b) The log–log plots of reaction temperature versus particle size prepared at 2 h.

Size-dependent physical properties of CeO2 nanoparticles
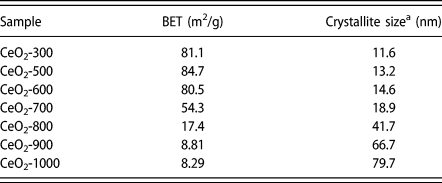
To investigate the size-dependent structure properties, nitrogen adsorption and desorption experiments were conducted to further explore more information on the microstructure of CeO2 nanoparticles. In the nitrogen adsorption/desorption data (Fig. S3), all samples present a type IV isotherm with a type H3 hysteresis loop, indicating a mesopore structure possibly because of the stacking between nanoparticles. Pore size [Fig. S3(b)] is mainly distributed in the range from 1 to 25 nm, where the smaller mesopores may be the fine nature of these particles, and the larger mesopores may be generated by the gaps among particles. The pore size distribution of the nanoparticles is all within the mesoporous region. As the particle size increases from 11 to 100 nm, Brunauer–Emmett–Teller (BET) specific surface area decreases accordingly (Table I). Specially, the specific surface area and pore volume are 54.3 m2/g and 0.14 cm3/g for the break point of crystallite size at 18.9 nm when sintering at 700 °C. The proper specific surface area, pore volume, and crystallite size are able to provide good catalytic performance. Therefore, grain growth kinetics of CeO2 nanoparticles allow one to get different catalytic properties, which will be described latter.
BET surface area and crystallite size for CeO2 nanoparticles obtained by calcinning cerium nitrate at different temperature for 2h.

a The crystallite size was obtained by XRD analysis.
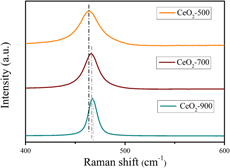
To understand the vibrational behaviors of CeO2 nanocrystals at different particle sizes, Raman characterizations were performed, as shown in Fig. 5. It is known from the literature that Ce–O bond stretching vibration band is 460 cm−1 [Reference Chen, Li, Hu, Huang, Li, Xu, Zuo and Li24]. In this work, F 2g symmetric stretching vibration of the Ce–O bond showed a slight blue shift near 460 cm−1, and the half-peak width become wider for the samples when calcined at different temperatures (such as 500, 700, and 900 °C). The main reason for this blue shift and the increase in half-peak width may be related with the growth of particle size with increasing sintering temperature from 500 to 900 °C. Oxygen vacancy peaks were not observed near 580 cm−1, consistent with the following XPS characterization. The current sintering conditions did not provide a reduction atmosphere for generation of oxygen vacancy in the samples.
Raman spectra of CeO2 nanoparticles obtained by calcinning cerium nitrate at different temperature for 2h.

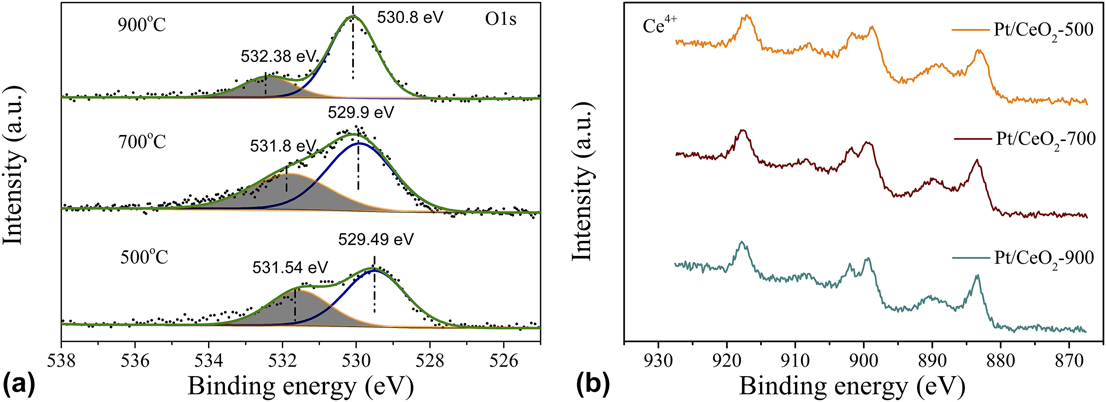
Pt (1 wt%) was dispersed on CeO2 nanoparticles via wetness impregnation process; the obtained composite catalyst was named as Pt/CeO2-500, Pt/CeO2-700, and Pt/CeO2-900. First, heating treatment at different temperature could alter the Ce–O bond lengths, leading to a variation of the interaction between Pt atoms and supports. Thus, the electron-donation ability of Pt atoms is changed with increasing temperature, which makes a shift in O 1s binding energy. For better revealing the oxygen species on the catalyst surface and their effects on catalytic performance, the chemical valence states of all Pt loading samples were characterized by XPS. As illustrated in Fig. 6(a), two O 1s peaks were fitted. The peak at approximately 529 eV is attributed to the lattice oxygen, and the peak at higher binding energy is attributed to the surface chemisorbed oxygen species [Reference Chen, Li, Hu, Huang, Li, Xu, Zuo and Li24]. The integrated peak areas of lattice oxygen (O1) and the chemisorbed oxygen (O2) are calculated and listed in Table S2. In general, high quantity of chemisorbed oxygen species on surface leads to a good catalytic activity. As shown in Table S2, the sample prepared at 700 °C exhibits the highest concentration of chemisorbed oxygen species, which is in agreement with the catalytic performance of our later catalytic experiments results. Additionally, only tetravalent Ce4+ was detected for the as-prepared catalysts in [Fig. 6(b)].
XPS spectra of (a) O 1s and (b) Ce 3d for Pt/CeO2-500, Pt/CeO2-700, and Pt/CeO2-900 catalysts.

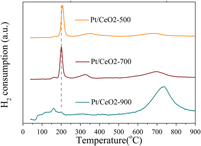
To determine the interactions between Pt and CeO2 nanoparticles, the H2-TPR test was conducted (Fig. 7). The characteristic reduction peak of the catalyst prepared at 700 °C locates relative low temperature, suggesting that it has better redox capacity and could give good catalytic performance. Moreover, the shifts toward lower temperature for reduction peaks should be induced by a strong synergistic interaction between Pt and CeO2 support. This is also in accordance with the following conclusion.
H2-TPR profiles of as-prepared composite catalysts of Pt/CeO2-300, Pt/CeO2-500, and Pt/CeO2-700.

CO oxidation performance for Pt supported CeO2 nanoparticles under different temperatures
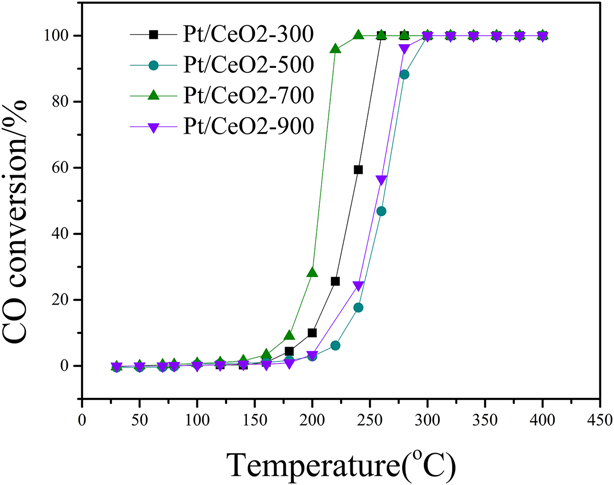
The conversion of CO in a fixed-bed reactor under gradient heating conditions can be seen in Fig. 8. It is worth noting that the samples prepared at 700 °C own the highest catalytic activity for CO oxidation reaction. The CO conversion reached as high as 95% at 180 °C; the total CO conversion occurred above 220 °C. The reasons that the sample prepared at 700 °C has the highest catalytic activity could be attributed to the following issues: (i) this sample has a suitable specific surface area and pore volume; (ii) abundant chemisorbed oxygen species on this sample surface provide rich activated oxygen; and (iii) there is strong interaction between the Pt and the CeO2 nanoparticles obtained at 700 °C calcination. These issues are highly related to the particle size of CeO2 nanoparticles, which were indicated by the BET, XPS, and H2-TPR, respectively.
CO oxidation performance of Pt supported by CeO2 as-prepared after sintering reaction for a given time.

Conclusion
CeO2 nanoparticles were prepared by a kinetically controlled sintering process. In the temperature range of 700 to 1000°C, the grain growth kinetics was determined to follow an equation, D 5 = 16.25 + 3.6 × 10²⁰ exp(−344.20/RT). With the kinetics control, CeO2 nanoparticles exhibit a significant size effect on the surface chemistry and moreover the catalytic performance. The amounts of chemisorbed oxygen species on the surface of CeO2 nanoparticles became pronounced as particle size reduces, accounting for the promoted catalytic activity. The methodology of kinetics control over nanoparticles reported here might be extended to other systems for advanced catalytic applications.
Experimental
Sample characterization
Structures and average particle sizes of the nanoparticles were examined by XRD at room temperature on a Rigaku MiniFlex apparatus using a copper target. XRD patterns were collected in a 2θ range from 10° to 80°. The grain size, D, was calculated from the diffraction peaks of cubic phase CeO2 using Scherrer formula, D = 0.89λ/(β cos θ), where λ = 0.15418 nm is the X-ray wavelength, θ is defined as the Bragg’s diffraction angle of the diffraction peak, and β is the half width of diffraction peak calculated from the XRD spectrum. High purity Al powder was used as an internal standard for calibration of peak position. The morphology of samples was observed by a TEM using a Tecnai G2 S-Twin F20 apparatus (FEI Thermo Fisher Scientific, Waltham, MA). Nitrogen adsorption isotherms of the samples were measured using an ASAP2020 analyzer (Micromeritics Instrument Corporation, Norcross, GA). Before the measurement, all samples were degassed at 200 °C for 6 h. Specific surface was calculated using linear portion of adsorption branch of the isotherms. Pore size and pore volume analyses were conducted with BJH method using desorption branch of the isotherms. Raman spectra were recorded on an inVia Raman system under excitation of 532 nm. We also investigated the thermal behavior of samples via Thermogravimettric-Differential Thermal Analysis (TG-DTA) using a Netzsch STA449C thermogravimetric analyzer (Netzsch Group, Selb, Germany). XPS analysis was performed using an ESCALAB 250 apparatus (Thermo Electric Company, Inc., West Chester, Pennsylvania) with a monochromatic Al Kα X-ray source. The charging shift was calibrated using C 1s photoemission line at a binding energy of 284.8 eV.
Catalytic activity test
Catalytic activity of the as-prepared catalysts was measured in a feed reactor. The feed gas consisted of 1% CO, 20% O2, and the balance He was at a rate of 1 × 103 cm3/(min g) [approximately 80,000 h−1—GHSV (gas hourly space velocity)]. The products and reactants were detected by a gas chromatograph equipped with GC-detector (GC2014, SHIMADZU, Kyoto, Japan). H2-TPR experiments were implemented in a programmable temperature system. Basically, the percentage of conversion in the CO process are defined as
 $${X_{{\rm{CO}}}} = {{F_{{\rm{CO}}}^{{\rm{in}}} - F_{{\rm{CO}}}^{{\rm{out}}}} \over {F_{{\rm{CO}}}^{{\rm{in}}}}} \times 100\% \quad ,$$
where X represents percentage conversion. F is the molar flow of the indicated gas (inlet or outlet).
Sample preparation
CeO2 nanoparticles were synthesized by sintering cerium nitrate. A certain amount of Ce(NO3)3·6H2O was taken as the starting material in the crucible and was heated in air. After being cooled naturally to room temperature, the products were then grinded in a mortar. To investigate the grain growth kinetics of CeO2 nanoparticles, heating at different temperature and period of time was executed. The sintering temperatures were varied from 300 to 1000 °C for a fixed time of 2 h, the obtained samples were noted as CeO2-300, CeO2-400, CeO2-500, CeO2-600, CeO2-700, CeO2-800, CeO2-900, and CeO2-1000. In addition, the reaction periods were also changed from 1 to 8 h at a fix temperature of 800 °C; the samples thus obtained were named as CeO2-800/1 h, CeO2-800/2 h, CeO2-800/4 h, and CeO2-800/8 h.
Pt/CeO2 catalyst (1 wt% Pt, nominal) was synthesized by an incipient wetness impregnation. Briefly, a suitable amount of chloroplatinic acid (3.21 mg/mL) was added dropwise to the as-prepared CeO2 (CeO2-300, CeO2-500, CeO2-700, and CeO2-900) while kept being grinded in a mortar. The composite material was then dried at 60 °C for 12 h. According to the heat treatment temperature of the CeO2 substrate, the final products were noted as Pt/CeO2-300, Pt/CeO2-500, Pt/CeO2-700, and Pt/CeO2-900.
Supplementary material
To view supplementary material for this article, please visit https://doi.org/10.1557/jmr.2018.456.
Acknowledgment
This work was financially supported by the National Natural Science Foundation of China (Nos. 21871106, 21771075, and 21671077).