INTRODUCTION
The damage that large, infrequent disturbance events, such as hurricanes and cyclones, can cause to forest systems has been widely discussed ((Everham & Brokaw Reference EVERHAM and BROKAW1996). The focus has been on abiotic factors that influence patterns of damage (Martin & Ogden Reference MARTIN and OGDEN2006) and effects on the composition and structure of forest vegetation (Zimmerman et al. Reference ZIMMERMAN, EVERHAM, WAIDE, LODGE, TAYLOR and BROKAW1994). However, little information is available on the micro-environmental effects that large storm events have on forest canopies (Turton Reference TURTON, Lowman, Devy and Ganesh2013, Turton & Siegenthaler Reference TURTON and SIEGENTHALER2004).
The structural impact of infrequent high-energy weather events depends on the properties of regional and local stands (Martin & Ogden Reference MARTIN and OGDEN2006), the geographical environment and the frequency, strength, duration, severity and size of the disturbance event (Everham & Brokaw Reference EVERHAM and BROKAW1996, Sturtevant et al. Reference STURTEVANT, MIRANDA, WOLTER, JAMES, FORTIN and TOWNSEND2014). For example, topographic sheltering can reduce the local impact on forest trees, while their vulnerability to wind damage can increase on exposed sites such as ridge tops (Brokaw & Grear Reference BROKAW and GREAR1991). Repetitive wind damage may result in either stand adaptations to wind damage (de Gouvenain & Silander Reference DE GOUVENAIN and SILANDER2003) or increased vulnerability to additional disturbances through changing stand physiognomy (Uriarte et al. Reference URIARTE, RIVERA, ZIMMERMAN, AIDE, POWER and FLECKER2004). The scale of the impact is highly variable and can extend from mass uprooting of trees, to branch damage (e.g. breakage, bending stress and wounds), to defoliation of the canopy.
The effects that these structural changes have on the micro-environment of the forest are also closely linked to the degree of disturbance. The changes in light environment along with the resulting increase in temperature maxima and decrease in humidity are particularly striking (Turton & Siegenthaler Reference TURTON and SIEGENTHALER2004). Consequently, change in the forest micro-environment can have wide-reaching implications for the forest stand and associated biota (Benzing Reference BENZING1990, Cach-Pérez et al. Reference CACH-PÉREZ, ANDRADE, CHILPA-GALVÁN, TAMAYO-CHIM, ORELLANA and REYES-GARCÍA2013). Little is known about the recovery of the forest micro-environment and even less about microclimatic changes along the vertical forest profile after disturbance (Turton & Siegenthaler Reference TURTON and SIEGENTHALER2004).
To assess how the forest micro-environment changed following long-term exposure to hurricane winds in Cusuco National Park, Honduras, we developed a model that allowed us to identify areas that have been least/most impacted by hurricanes over a 15-y period (1995–2010) (Batke et al. Reference BATKE, JOCQUE and KELLY2014). The model was verified on the ground using tree damage as a proxy for wind impact (Batke et al. Reference BATKE, JOCQUE and KELLY2014). As the forest canopy will be structurally altered as a result of past wind disturbances, it can be hypothesized that the forest microclimate will differ along a gradient of hurricane exposure.
To investigate this, we tested the correlation between predicted hurricane exposure and the local microclimate within individual trees (expressed as VPD). It was predicted that VPD will increase in tree canopies that are found in high-exposure sites, as they are likely to be more affected by hurricane winds. As the response to wind damage is predicted to change among tree species, we also expected to find differences in VPD among them.
METHODS
Study site
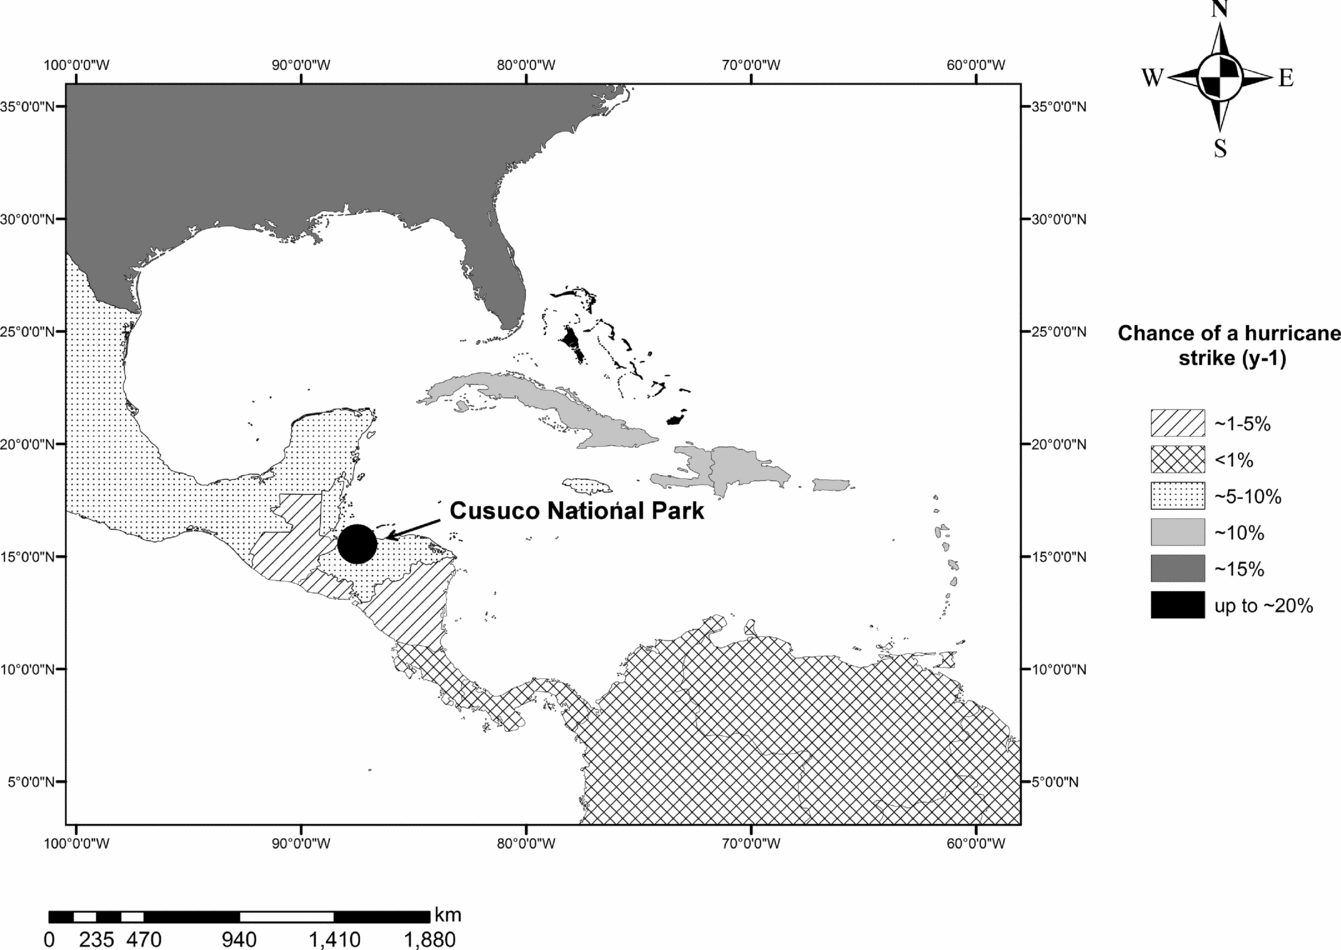
Cusuco National Park (CNP) is located in the Departments of Santa Barbara and Cortés in north-west Honduras (15o32ʹ31ʹʹN, 88o15ʹ49ʹʹW; Figure 1). Cusuco is situated within a mountainous, high-rainfall region. Maximum altitude is 2242 m asl, with a mean monthly precipitation of 211 mm and an annual precipitation of approximately 2500 mm (Baker Reference BAKER1994). The wet season in CNP is between May–November and is followed by a shorter dry season between December–April (Harborne et al. Reference HARBORNE, AFZAL and ANDREWS2001). The long-term average probability of hurricanes striking a particular point in Central America is 0.2 hurricanes y−1 (Pielke et al. Reference PIELKE, RUBIERA, LANDSEA, FERNANDEZ and KLEIN2003). Honduras falls within a hurricane belt that is estimated to have a 5–10% chance of being hit by a hurricane each year (Pielke et al. Reference PIELKE, RUBIERA, LANDSEA, FERNANDEZ and KLEIN2003) (Figure 1). Between 1995 and 2010, 11 hurricanes affected CNP. However, most winds at CNP did not reach hurricane strength, as many of the storms only passed the Park at great distance (Batke et al. Reference BATKE, JOCQUE and KELLY2014).
Annual likelihood of hurricane activity per country, in the Caribbean. The north-east Bahamas and the coastal region in the Atlantic basin has the highest strike probability, followed by regions such as the Lesser Antilles through the British and US Virgin Islands, southern Haiti, Puerto Rico, Dominican Republic, central Bahamas, the Cayman Islands and western Cuba. Moderate hurricane risk areas (~5–10%) include countries such as Jamaica, Turks and Caicos Islands, Belize, Honduras and the Yucatan and western Gulf of Mexico. Our study site, Cusuco National Park, indicated by a circle, lies within the moderate risk area. Moreover, countries south of 10oN latitude have an annual hurricane risk probability of < 1%. Data were adapted from Pielke et al. (Reference PIELKE, RUBIERA, LANDSEA, FERNANDEZ and KLEIN2003).

The forest in CNP consists of a complex mosaic of forest types that is the subject of ongoing study by the Forest Botany team of Operation Wallacea, led by D.L. Kelly over the period 2004–2013 (http://opwall.com/). Mixed broadleaved and pine forests dominate most of the Park; Liquidambar (Hamamelidaceae), Pinus (Pinaceae) and Quercus (Fagaceae) being among the principal genera. The families Melastomataceae, Lauraceae, Rubiaceae and Euphorbiaceae are also well represented. At the highest elevations a well-defined elfin forest is present.
Hurricane model
A hurricane model was used to predict the high-energy weather impacts at CNP from 1995 to 2010 (Batke et al. Reference BATKE, JOCQUE and KELLY2014). The model was based on data provided by the National Oceanic and Atmospheric Administration (NOAA) and a digital elevation map (DEM) of CNP. The model predicted hurricane exposure at a high resolution (50 × 50 m) for eight cardinal model solutions. Each model solution represents the predicted hurricane exposure from different cardinal wind-inflow directions within CNP. Each 50 × 50-m raster field on the DEM is expressed as an exposure vulnerability site score (EVSS). The scores are between 1 and 5 (low-high exposure) and represent the topographic exposure of each raster field, the hurricane frequency (i.e. number of hurricanes) and the maximum wind velocity calculated for each hurricane. The individual models were assessed following validation on the ground using tree assessment methods and by correlating the exposure scores to the observed tree damage on the ground. Damage on individual trees in CNP was explained best by the correlation of tree damage with the south and south-east model solutions (i.e. exposure to south and south-easterly winds) (Batke et al. Reference BATKE, JOCQUE and KELLY2014).
Plot and tree selection
Between June and August 2012 and 2013 a total of 10 plots was sampled (four additional plots to those in Batke et al. Reference BATKE, JOCQUE and KELLY2014). The locations of the plots were standardized using the results from the hurricane model and a contour map of CNP and randomly selected as described in Batke et al. (Reference BATKE, JOCQUE and KELLY2014). The size of the plots was 150 × 150 m, and minimum distance between plots was 50 m. The plots had an altitudinal average ± SD of 1595 ± 269 m asl. The original aim was to sample three large Pinus sp. and three large angiosperm trees (Quercus sp. or Liquidambar styraciflua L.) within each of the 10 plots. However, because of anthropogenic forest disturbance and scarcity of Pinus sp. and L. styraciflua at higher elevations this was not always possible. As a result, other angiosperm species that had similar architectural properties to Quercus sp. (i.e. a decurrent canopy) were randomly selected and surveyed. On sites where Pinus spp. were absent, additional angiosperm species were investigated. Compared with the decurrent canopy and evergreen ecology of most angiosperms investigated, L. styraciflua had an excurrent canopy and was deciduous.
Branch damage on each tree was assessed using rope climbing methods (Batke et al. Reference BATKE, JOCQUE and KELLY2014). Trees were selected based on (1) tree diameter at breast height (>150 cm) and (2) safe climbing-accessibility, thereby excluding all toxic species (e.g. Toxicodendron) as well as ant-trees (e.g. Cecropia). Tree species were identified at Kew (K), the Natural History Museum (BM), Trinity College Dublin (TCD) and the Cyril Hardy Nelson Sutherland Herbarium (TEFH). Only large trees were surveyed as they are more susceptible to wind damage (Foster & Boose Reference FOSTER and BOOSE1992) and they most fully represent the vertical range in microclimate regimes (Shaw Reference SHAW, Lowman and Rinker2004).
To assess how observed branch damage differed among tree species and types, individual trees were divided for the analysis into groups based on morphological characteristics and/or genus. Group one consisted of Quercus spp., L. styraciflua, conifers (Pinus maximinoi H.E. Moore and P. tecunumanii F. Schwerdtf. ex Eguiluz & J.P. Perry, two species of similar overall morphology) and other angiosperm species (Cedrela odorata L. and Ilex pallida Standl., Dendropanax aff. hondurensis M.J. Cannon & Cannon). Group two consisted of L. styraciflua, conifers and other angiosperm species, whereas group three was simply divided into conifers and other angiosperm species.
Climate data
Data loggers (Luscar EL-USB-2) were suspended on two of the six trees within each plot (n = 20). Loggers were placed at three levels within the tree canopy, viz. lower, middle and upper canopy. The height of each logger depended on the total tree height. Each of the three data loggers was at the same horizontal distance from the bole of the tree (i.e. the inner canopy). Some of the data loggers were paired, in order to assess recording precision. The loggers measured relative humidity and temperature at 10-min or hourly intervals from June 2012 to June 2013.
Autocorrelation in the climate data was tested for using a Durbin–Watson test, which confirmed a first order-autocorrelation (d = 0.598). To compensate for this autocorrelation, we used loglinear models and treated the factor ‘Month’ as a random variable and ‘Plot’ and canopy position (‘Position’) as nested random variables. To avoid multicollinearity between variables in the models (Heikkinen et al. Reference HEIKKINEN, LUOTO, ARAÚJO, VIRKKALA, THUILLER and SYKES2006), only the variable with the highest Variance Inflation Factor (VIF) was retained (O’Brien Reference O’BRIEN2007).
Calculating VPD
Transpiration rates, amongst others, are limited externally by VPD and internally by hydraulic conductivity and water potential between the leaves and the soil (i.e. the capacity to transport available water) (Koch et al. Reference KOCH, SILLETT, JENNINGS and DAVIS2004). Although there has been much debate on the usefulness of using VPD to explain temporal dynamics in transpiration (Bacon Reference BACON2004, Streck Reference STRECK2003), it is believed that VPD can be a useful indicator of potential transpiration for many species, particularly when they are closely coupled to the atmosphere (Adelman et al. Reference ADELMAN, EWERS and MACKAY2008). VPD is biologically more relevant to many forest organisms than relative humidity (RH) (Rambo & North Reference RAMBO and NORTH2009), because it reflects more closely differences in water stress (Donald Reference DONALD1936). As a result, monthly RH and temperature (T) measurements (n = 386469) were converted into VPD, using the formula by Murray (Reference MURRAY1967) as adapted by Bolton (Reference BOLTON1980).
Sunrise and sunset times for the years 2012 and 2013 were calculated by averaging daily sunrise and sunset data for each month. The data were obtained from Time and Date (www.timeanddate.com). Mean time of sunrise was 05h44 (± 12 min) and 17h52 (± 14 min) for sunset. It was assumed that VPD = 0 when temperature was ≤ 0°C (Rambo & North Reference RAMBO and NORTH2009). Bolton (Reference BOLTON1980) showed that this assumption for VPD is sufficiently accurate (0.1%) for temperatures between −30°C and 35°C. As a first step, saturation vapour pressure (es) was calculated as follows:
 \begin{equation}
\mathop e\nolimits_e = 6.112 \times \exp \left( {\frac{{17.67 \times T}}{{T + 243.5}}} \right)\end{equation}
Where T is the temperature (°C). Because hourly temperature and RH measurements were available, the actual vapour pressure (ea) and VPD were determined as follows:
 \begin{equation}
\mathop e\nolimits_a = \mathop e\nolimits_s \left( T \right) \times \frac{{RH}}{{100}}\end{equation}
and
 \begin{equation}
{\it VPD} = \mathop e\nolimits_s - \mathop e\nolimits_a\end{equation}
The calculated VPD was correlated to the different model solutions, altitude, tree species and data logger position within the canopy, and compared between different plots and months.
RESULTS
Branch damage
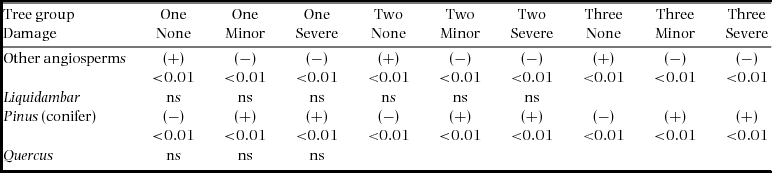
Branch damage differed significantly among different tree groups (Pearson's Chi-square; grouping 1: χ2 = 106, P < 0.01; grouping 2: χ2 = 82.8, P < 0.01; grouping 3: χ2 = 78.4, P < 0.001). Standardized residuals from loglinear models (LLM) showed that most of the difference in observed branch damage between different tree types was among conifers and angiosperms (Table 1). Branch damage was significantly higher for Pinus trees than for angiosperms, and the latter had significantly higher numbers of undamaged branches (Table 1).
A LLM pairwise residual comparison was made to compare branch damage responses following hurricane perturbation at Cusuco National Park, among different tree groups. Group one consisted of Quercus spp., Liquidambar styraciflua, conifers (Pinus maximinoi and P. tecunumanii) and other angiosperm species. Group two consisted of L. styraciflua, conifers and other angiosperm species. Group three consisted of conifers and angiosperm species. Comparisons were made among branches that were not damaged (none), had minor damage (minor) and were severely damaged (severe). P values are given for each comparison. The plus and minus signs indicate the direction (positive or negative) of the comparison.

Vapour pressure deficit
Linear mixed models (LMM) with random nested effects were used to identify changes in mean VPD as a function of the eight hurricane exposure solutions, altitude, position in the canopy and different tree species. A Shapiro–Wilks test and visual assessment were used to test for data normality. No further transformation was necessary (P < 0.05). VPD was not included as a seasonal (i.e. dry/wet) or diurnal measurement, but merely as a monthly measurement. This was done because ‘Month’ had the highest VIF. Monthly VPD was strongly correlated with diurnal VPD (Adj. R2 = 0.97, P < 0.01) and seasonal VPD (Adj. R2 = 0.99, P < 0.01). Moreover, diurnal VPD was strongly correlated to seasonal VPD (Adj. R2 = 0.98, P < 0.01).
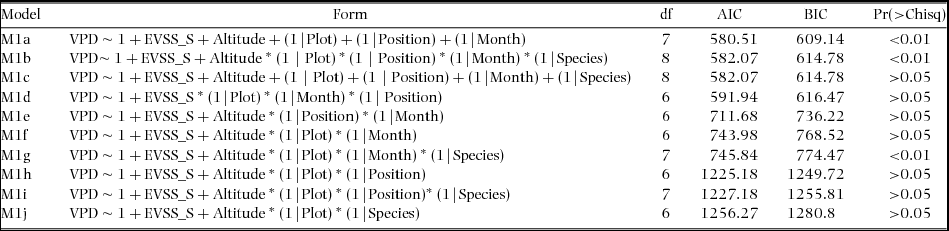
As a first step, the eight different hurricane exposure solutions, which predicted the hurricane exposure from different wind-inflow directions, were compared using maximum likelihood (ML) ratio tests. The south solution (i.e. exposure to south and south-easterly winds) was the model with the best fit (AIC = 582.07). In a second step, the south solution model was remodelled using different interaction and random-effect combinations to identify the contribution of different nested and random effects on the overall model performance (Table 2). Note that the interaction terms (e.g. plot × position) were not included here, as the overall variance did not significantly contribute to the total variance of the models. The best-fit model remained model one (M1a). Here VPD was measured as a function of the south hurricane solution (i.e. best fit solution); altitude as a fixed effect; and plot, canopy position and monthly fluctuation as random nested effects. The final model was re-run using the restricted maximum likelihood estimation (REML) (AIC = 597.3; Table 3). Due to the low variance of each random effect (total variance = 0.7%), all random effects were removed from the model and a linear model (LM) was used instead. The fitted LM explained 83% of the total variance, of which 67% was attributed to monthly fluctuation, 15% to altitude, 12% to historical hurricane damage and 6% to canopy position (Table 4).
Assessing VPD in Cusuco National Park, Honduras. Maximum likelihood ratio tests were used to identify how VPD changed in response to altitude, monthly fluctuations, plot location, canopy position (namely lower, middle and upper canopy) and hurricane exposure (i.e. EVSS_S). The tests were run using different interaction and random effect combinations. The model with the lowest AIC and BIC (Bayesian information criterion) was retained (i.e. the best-fit model) and a Chi-squared test was used to test for significance (Pr>Chisq).
The best-fit model that explained most of the variation of VPD in Cusuco National Park, Honduras. The model was rerun using restricted maximum likelihood estimation (REML). The contribution to the model of each random and fixed effect is presented.

Summary of the variance from the LM that explained most of the variation in VPD in Cusuco National Park, Honduras. For each contributing variable (i.e. month, altitude, EVSS south and canopy position), the remaining variance (exclusion of individual variables from the model), the difference in variance and the total variance (%) are presented.

VPD was significantly different among different tree species (df = 435, P < 0.01) and types (df = 435, P < 0.01). The main differences were observed between conifers and angiosperms. Angiosperm trees, with the exception of L. styraciflua (t = 6.6, P < 0.01), had significantly lower VPD compared with conifer trees (t = 5.9, P < 0.01). However, as the variation of VPD in the model (i.e. M1a) was not significantly explained by different tree species (Table 2), tree species was not analysed further as a variable.
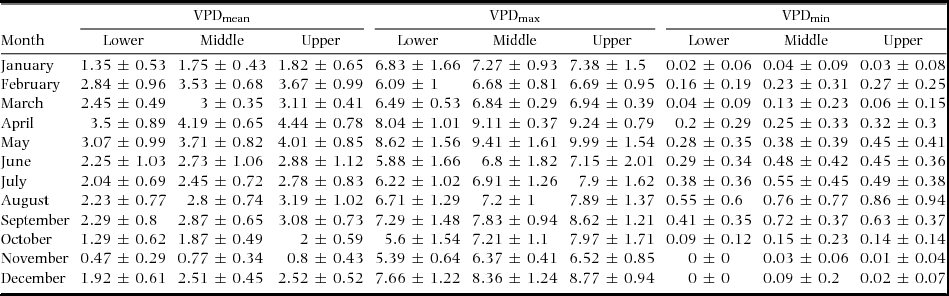
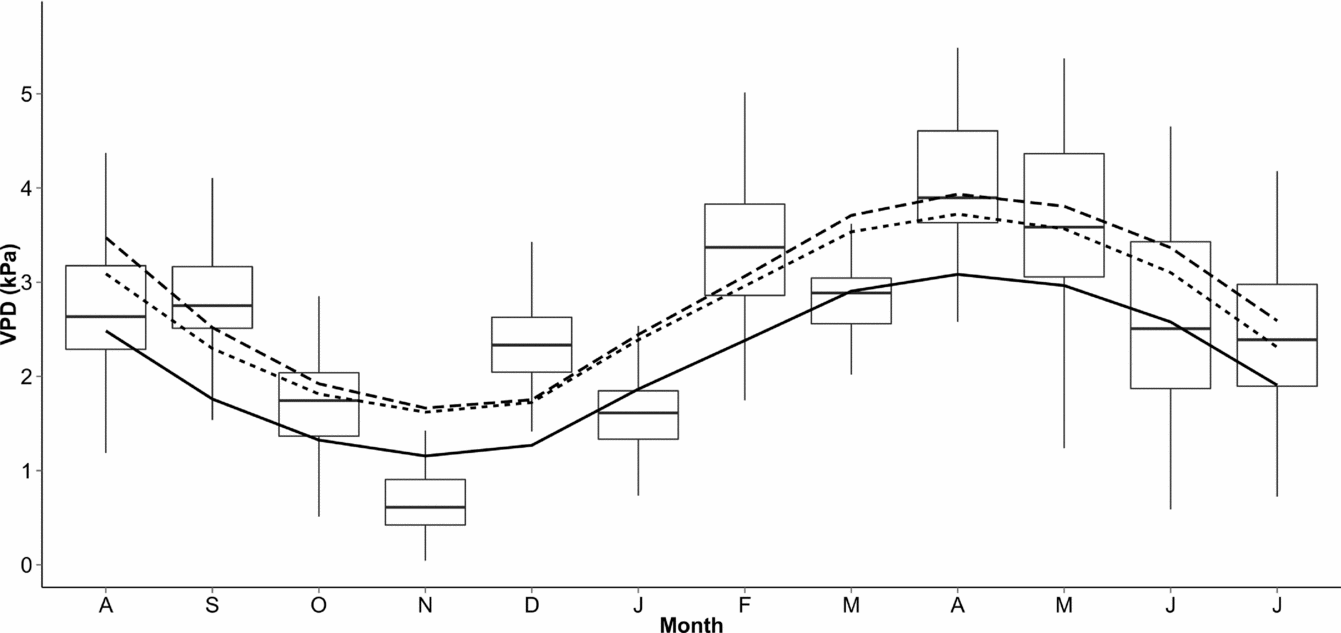
Micro-environmental canopy conditions (i.e. VPD) differed amongst heights within the canopy, as well as the months in which the results were recorded (Figure 2; Table 5). Although seasonal and diurnal VPD changes were not included in the overall model, significant differences between mean VPD in the dry and wet seasons were detected (df = 439, F = 15.8, P < 0.01), with the dry season having significantly higher VPD (2.8 ± 1.09 kPa) compared with the wet season (2.4 ± 1.1 kPa). Additionally, a Tukey Honest Significant Differences (Tukey HSD) test showed that VPD changed significantly between night and day (df = 1, F = 29.7, P < 0.01). This difference was consistent throughout the year (df = 11, F = 3040, P < 0.01), with the only non-significant comparisons between months being December/August (P > 0.05), May/February (P > 0.05) and October/January (P > 0.05).
Mean and standard deviation of changes in VPD in Cusuco National Park, Honduras. The mean, maximum and minimum VPD for each month are given for the lower, middle and upper canopy.
Boxplot of mean monthly VPD (kPa) between 2012 and 2013 at Cusuco National Park, Honduras. A linear model (LM) for each canopy position was computed and overlaid. The dashed line represents the modelled mean VPD values for the upper canopy position, the dotted line represents the middle canopy position and the solid line represents lower canopy position.
An analysis of variance (ANOVA) with Bonferroni adjustment revealed that VPD varied significantly between different canopy positions (df = 438, F = 17.5, P < 0.01). The lower canopy had significantly lower VPD compared with the middle (P < 0.01) and upper canopy (P < 0.01). However, the middle canopy did not differ statistically from the upper canopy (P > 0.05).
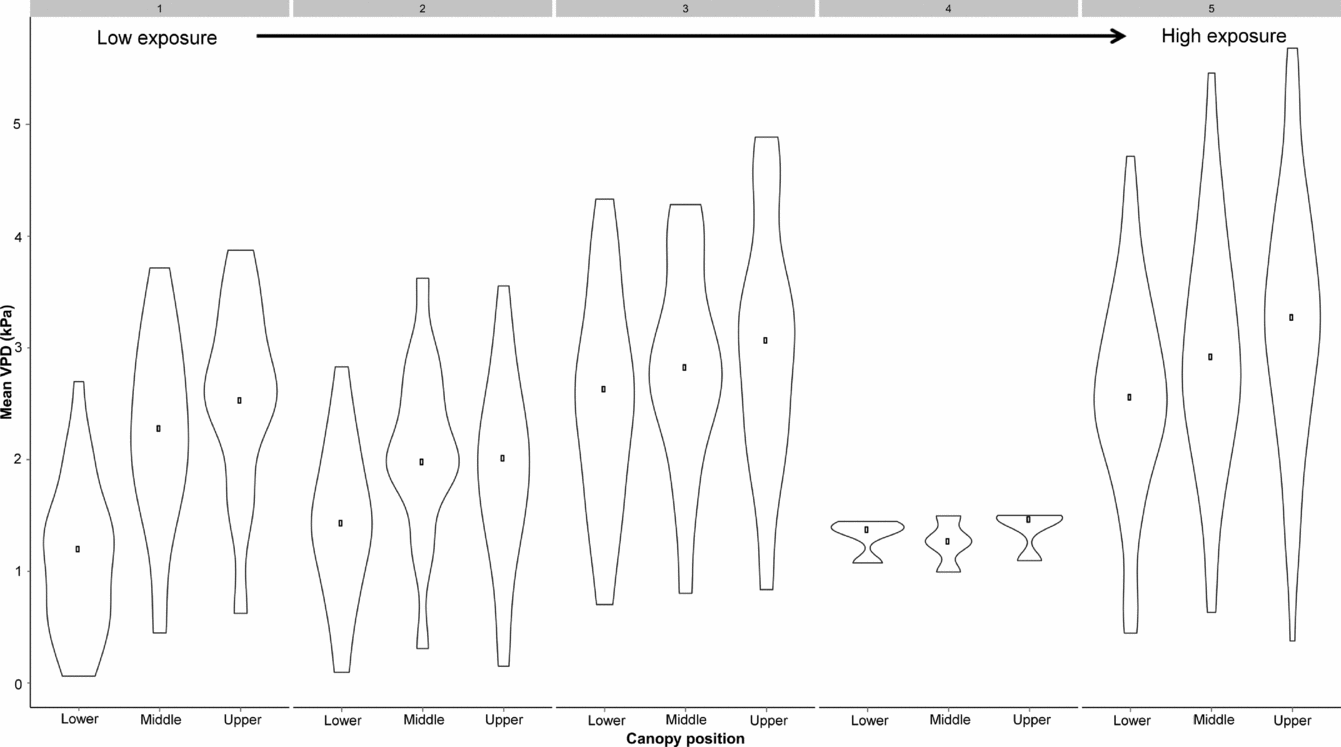
Additionally, VPD increased with hurricane EVSS (Estimate = 0.28, F = 74.2, R2 = 0.14, P < 0.01), with the exception of EVSS 4. Differences between exposure levels were detected following pairwise comparisons among EVSSs 1, 3 and 5 (P < 0.01); 2, 3 and 5 (P < 0.01); 3 and 4 (P < 0.01) and 4 and 5 (P < 0.01). Mean VPD increased with height in the canopy and increased hurricane exposure. VPD was significantly lower in canopies that were less likely to be impacted by hurricanes compared with canopies that were more likely to be affected (lower: t = 5.48, P < 0.01; middle: t = 8.04, P < 0.01; upper: t = 9.51, P < 0.01) (Figure 3).
Violin plot of mean monthly VPD (kPa) for each canopy position and hurricane exposure site at Cusuco National Park, Honduras. The violin plot is a combination of a boxplot and a kernel density plot, which shows the spread and the probability density of the data. The hurricane exposure sites (EVSS 1 = low impact; EVSS 5 = very high impact) are indicated by the grey boxes at the top of the figure. The black dot symbolizes the median.
DISCUSSION
The effects of disturbance by hurricane winds depend on the spatial environment of the trees, their proneness to damage, the frequency of hurricane events and the size and intensity of prior disturbances (Boose et al. Reference BOOSE, CHAMBERLIN and FOSTER2001, Turner et al. Reference TURNER, BAKER, PETERSON and PEET1998, Xi et al. Reference XI, PEET, DECOSTER and URBAN2008). For example, Foster & Boose (1992) found that storm damage increases linearly with increasing tree height, making taller trees more vulnerable to damage. Emergent trees seem to be particularly vulnerable, as they are less sheltered by the surrounding vegetation and therefore experience increased biomechanical stress (de Gouvenain & Silander Reference DE GOUVENAIN and SILANDER2003, Lewis & Bannar-Martin Reference LEWIS and BANNAR-MARTIN2011). The difference of tree damage between trees of different size was not very apparent in our study, because most of the investigated trees were similar in height (mean ± SD tree height = 40.4 ± 9.9 m).
Moreover, tree species may differ in their susceptibility to storm events. Pinus spp. had much higher levels of branch damage than the angiosperm canopy species. These findings are consistent with other studies (Brokaw & Walker Reference BROKAW and WALKER1991, Foster & Boose Reference FOSTER and BOOSE1992). Xi et al. (Reference XI, PEET, DECOSTER and URBAN2008) reported that the probability of tree damage differs between tree species in a Carolina forest. They found that species such as Pinus taeda are more susceptible to hurricane damage compared with species such as Liquidambar styraciflua, Quercus spp. (deciduous) and Fagus grandifolia. Although no statistical differences among L. styraciflua, Quercus spp. and angiosperm division (group one) were detected in our study, the angiosperm species investigated had significantly lower branch damage compared with Pinus spp. This is probably because L. styraciflua and Quercus spp. have a very similar damage risk, making the detection of differences in damage more difficult (Xi et al. Reference XI, PEET, DECOSTER and URBAN2008). The difference between angiosperm and conifer trees may be due to the higher wood density observed in many slow-growing hardwood species (Zimmerman et al. Reference ZIMMERMAN, EVERHAM, WAIDE, LODGE, TAYLOR and BROKAW1994), compared with that of the fast-growing and shade-intolerant conifers. In contrast to Xi et al. (Reference XI, PEET, DECOSTER and URBAN2008), Boucher et al. (Reference BOUCHER, VANDERMEER, YIH and NELSON1990) found that rain-forest trees (i.e. angiosperm-dominated forest) had higher overall tree damage compared with conifer stands, but that angiosperm species had higher survival due to their resprouting abilities. It is possible that other stand attributes such as composition and physiognomy (e.g. canopy closure), rather than differences in wood and tree properties such as density, elasticity and anchorage (Brokaw & Walker Reference BROKAW and WALKER1991, McCallum et al. Reference MCCALLUM, MASON and WHITLEY2007, Putz et al. Reference PUTZ, COLEY, LU, MONTALVO and AIELLO1983) could have caused this observed difference. Although our study did not investigate stand properties, stand composition and tree density within each plot could have influenced the susceptibility of individual trees to wind damage (Rambo & North Reference RAMBO and NORTH2009). For example, if the variability of forest canopy height is increased, wind flow turbulence is more severe, thereby enhancing damage susceptibility of the whole stand (Martin & Ogden Reference MARTIN and OGDEN2006).
Understanding the differences in probability of wind damage between tree species and forest stands is important as damage affects the vertical, seasonal and diurnal pattern of micro-environmental conditions in the canopy. The formation of gaps and the opening of the canopy due to topping of canopies, branch damage and severe defoliation are some mechanisms that can alter the forest micro-environment. Our study found that VPD was affected significantly by seasonal and diurnal cycles, height in the canopy and the modelled impact of hurricanes. However, our model showed that tree species is not an important factor in explaining differences in VPD between trees. The LM explained 83% of the total variance with 67% attributed to monthly fluctuation, 15% to plot altitude, 6% to height in the canopy and 12% to predicted hurricane damage. The decline in VPD with elevation can be attributed to several causes. The air has a lower water-holding capacity at higher altitude (because the temperatures are lower); also, rainfall and cloud occurrence are higher (Richards Reference RICHARDS1996). This was clearly observed in one of the plots at EVSS level four (Figure 3). VPD was significantly reduced at this plot due to its higher altitude (~2020 m asl) and possibly because of the shorter stand height observed at this plot. The low variability in that plot can be attributed to the recording failure of the logger equipment between November and June. Thus only data for the period between June–August was available for these trees.
Studies that investigate micro-environmental gradients in forest canopies are often limited by incomplete and periodic data records and are often restricted to the lower canopy (Bohlman et al. Reference BOHLMAN, MATELSON and NADKARNI1995, Fetcher et al. Reference FETCHER, OBERBAUER and STRAIN1985, Stuntz et al. Reference STUNTZ, SIMON and ZOTZ2002, Turton & Siegenthaler Reference TURTON and SIEGENTHALER2004). Saldaña et al. (Reference SALDAÑA, PARRA, FLORES-BAVESTRELLO, CORCUERA and BRAVO2013) investigated micro-environmental differences in the lower part of the canopy (c. 5–10 m above ground level) between different forest successional stages and found that VPD increased with height in the canopy. Our study investigated the full range of the vertical forest profile over a 12-mo period and found that a clear climate stratification could be observed along this gradient. VPD increased with height in the canopy, although the upper and middle canopy did not differ statistically in mean VPD; the lower canopy was significantly different from the middle and upper canopy. The vertical gradient in VPD can be attributed to the differences in solar radiation absorption through the canopy profile (Szarzynki & Anhuf Reference SZARZYNKI and ANHUF2001). The elevated heat of the air in the upper canopy produces a stable density stratification of cooler denser air in the lower canopy and warmer, lighter air in the upper canopy. The lower canopy is therefore less connected to the atmosphere, reducing the saturation deficit in some instances to approximately 20% compared with the upper canopy (Szarzynki & Anhuf Reference SZARZYNKI and ANHUF2001).
The long-lasting effect of hurricanes on the forest microclimate can be substantial and will vary spatially and temporally (Lugo et al. Reference LUGO, ROGERS and NIXON2000). Our hurricane exposure model for CNP was able to explain 12% of the variation in mean VPD along a gradient of hurricane exposure. This is striking as the last severe hurricanes that impacted Honduras and CNP were hurricane Mitch in 1998 and Wilma in 2005 (Batke et al. Reference BATKE, JOCQUE and KELLY2014, Ensor Reference ENSOR2009). This highlights the importance of past hurricane impacts on forest stand structure. These effects will diminish over time (Fetcher et al. Reference FETCHER, OBERBAUER and STRAIN1985) and there is some evidence that the recovery rates might vary spatially along the vertical forest profile (King Reference KING1986, Weishampel et al. Reference WEISHAMPEL, DRAKE, COOPER, BLAIR and HOFTON2007). For example, Weishampel et al. (Reference WEISHAMPEL, DRAKE, COOPER, BLAIR and HOFTON2007) used LiDAR remote-sensing technology to detect historical hurricane damage following the 1938 hurricane in New England. They reported that the degree of forest damage varied vertically with height in the canopy and tree diversity. This is important, as the difference in damage susceptibility and recovery rate among different tree types and species can further complicate the picture (Bellingham et al. Reference BELLINGHAM, KAPOS, HEALEY, TANNER, KELLY, DALLING, BURNS, LEE and SIDRAK1992) and the implications are therefore more difficult to predict.
Early studies reported that the effects of site disturbance on the forest microclimate are highly variable along an intensity gradient and with distance from the disturbance site (Davies-Colley et al. Reference DAVIES-COLLEY, PAYNE and VAN ELSWIJK2000, Meyer et al. Reference MEYER, SISK and COVINGTON2001). Fetcher et al. (Reference FETCHER, OBERBAUER and STRAIN1985) compared microclimatic regimes in single tree-fall gaps and clear-fell sites over a 2-y period and found that an increase in VPD and temperature between different sites increased with canopy openness (i.e. disturbance level). However, they also noted that these differences declined strongly after only 2 y, due to regrowth. Our study showed that mean VPD increased on sites that were more impacted by hurricanes at the lower, middle and upper canopy, with great variability among the different canopy positions. Similar results were observed by Turton & Siegenthaler (Reference TURTON and SIEGENTHALER2004) in a rain forest in Australia after the passing of cyclone ‘Rona’. They found that mean VPD was significantly higher compared with pre-disturbance measurements at a canopy height of 10 m; however, post-hurricane VPD did not significantly differ at 20 and 30 m height in the canopy.
In conclusion, the effects that canopy removal (e.g. defoliation and branch damage) and thinning (Rambo & North Reference RAMBO and NORTH2009) can have on the micro-environment after the passing of hurricanes is of great importance to the forest's long-term persistence. De Frenne et al. (Reference DE FRENNE, RODRÍGUEZ-SÁNCHEZ, COOMES, BAETEN, VERSTRAETEN, VELLEND, BERNHARDT-RÖMERMANN, BROWN, BRUNET, CORNELIS, DECOCQ, DIERSCHKE, ERIKSSON, GILLIAM, HÉDL, HEINKEN, HERMY, HOMMEL, JENKINS, KELLY, KIRBY, MITCHELL, NAAF, NEWMAN, PETERKEN, PETŘÍK, SCHULTZ, SONNIER, VAN CALSTER, WALLER, WALTHER, WHITE, WOODS, WULF, GRAAE and VERHEYEN2013) recently reported that forest closure minimizes the risk to understorey vegetation under climate change scenarios, by reducing ground-layer temperatures and solar radiation and by increasing RH. Our study revealed that cumulative hurricane impacts (i.e. branch damage and raised VPD) can still be measured long after the passing of hurricane storms (Brokaw & Walker Reference BROKAW and WALKER1991, Weaver Reference WEAVER2008). Moreover, the degree of structural damage and the resulting alteration in micro-environmental canopy conditions varied along a hurricane exposure gradient and along the vertical forest profile. It remains to be seen how significant these long-term alterations are to the forest and its biota, as there is limited long-term information available on this (baseline forest plot data for CNP go back only to 2003–2004; Cayuela et al. Reference CAYUELA, GÁLVEZ-BRAVO, PÉREZ, DE ALBUQUERQUE, GOLICHER, ZAHAWI, RAMÍREZ-MARCIAL, GARIBALDI, FIELD, BENAYAS, GONZÁLEZ-ESPINOSA, BALVANERA, CASTILLO, FIGUEROA-RANGEL, GRIFFITH, ISLEBE, KELLY, OLVERA-VARGAS, SCHNITZER, VELÁZQUEZ, WILLIAMS-LINERA, BREWER, CAMACHO-CRUZ, CORONADO, DE JONG, DEL CASTILLO, GRANZOW-DE LA CERDA, FERNÁNDEZ, FONSECA, GALINDO-JAIMES, GILLESPIE, GONZÁLEZ-RIVAS, GORDON, HURTADO, LINARES, LETCHER, MANGAN, MEAVE, MÉNDEZ, MEZA, OCHOA-GAONA, PETERSON, RUIZ-GUTIERREZ, SNARR, DZUL, VALDEZ-HERNÁNDEZ, VIERGEVER, WHITE, WILLIAMS, BONET and ZAMORA2012).
ACKNOWLEDGEMENTS
This project was funded by Trinity College, The University of Dublin, the Rufford Foundation, Operation Wallacea, British Airways and the Royal Geographic Society London (in collaboration with Dr Merlijn Jocque). In particular, we thank Nicholas Hill (primary assistant), Waldo Etherington (Canopy Access Limited – CAL), Ian Geddes (CAL), Alex Turner (CAL) and José Omar Arteaga Mesía (local guide) for their help with the data collection. Additionally, we would like to thank Seán Ó’Riordáin (Statistics Department, Trinity College Dublin) for his valuable advice on the data analysis.