

1. INTRODUCTION
The prosodic phenomenon stød is both a characteristic feature of Danish and a typical Scandinavian phenomenon. The relation between Danish stød and Swedish/Norwegian word accents is well-established when it comes to diachrony and distributional patterns (Riad Reference Riad1998, Reference Riad and Lahiri2000; Basbøll Reference Basbøll2005; Grønnum Reference Grønnum2005). Still, it has not been investigated whether distributional resemblance for patterns of stød and patterns of word accent are also reflected in measures of cognitive markedness. In this article, we compare existing analyses of Standard Danish stød to analyses of Swedish/Norwegian word accents in terms of markedness and distributional properties. Drawing on data from a psycholinguistic study of stød, we discuss in what sense stød and word accent have a similar pattern in terms of cognitive markedness.
1.1 Stød: A characteristic feature of Standard Danish
The term stød is often described as a uniquely Danish feature (Grønnum Reference Grønnum2005). The stød accent is a syllable-based prosodic feature, phonetically realized as a creaky voice /ˀ/ with a full or partial glottal constriction (Grønnum Reference Grønnum2005). In Standard Danish, stød is lexically distinctive, with numerous minimal pairs, e.g. mor ‘mother’ – mord ‘murder’ pronounced [mo ] and [mo
 ], respectively. Stød requires a stød-basis in the shape of a bimoraic syllable (Basbøll Reference Basbøll, Barnes, Bremmer, Lerchner and Nielsen2008: 153). This means that stød can only occur in (i) syllables with a long vowel or (ii) syllables that have primary stress and contain a short full vowel followed by a sonorant consonant (Basbøll Reference Basbøll, Barnes, Bremmer, Lerchner and Nielsen2008), as found in the mor/mord example. Besides being lexically distinctive, the occurrence of stød or non-stød is tied up to specific inflectional and derivational suffixes (see Grønnum Reference Grønnum2005 for an overview). For inflected words, the relation between base and suffix determines stød assignment. For example, the noun vand ‘water’ (as in ‘a glass of water’) and the imperative vand ‘water’ (as in ‘please water the plant’) have an identical pronunciation with stød [vanˀ], and both of these words can be inflected with an -et, which is both a definite and past participle suffix. When vandet means definite ‘the water’, it is pronounced with stød [ˈvanˀ], but with the past participle -et ‘watered’, it is pronounced with non-stød [ˈvan]. The occurrence of stød vs. non-stød in the stem depends on the type of suffix (for details of these processes, see Basbøll Reference Basbøll, Duncker, Hansen and Skovgaard-Petersen2013).
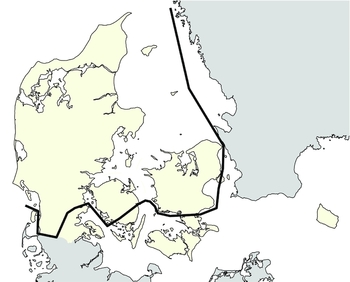
Not all Danish dialects have the stød accent, but stød appears in most dialects (see Figure 1), including Standard Danish.
Map of Denmark showing the stød isogloss. Dialects north of the solid line have stød, whereas dialects south of the solid line have no stød. The map is based on illustrations from Quist (Reference Quist2015).

In itself, the phonetic representation of stød is not unique to Standard Danish. However, languages other than Danish have lexically distinctive full or partial glottal constrictions too (e.g. cockney, McArthur Reference McArthur2013). Understood as a syllable-based prosodic phenomenon, the stød accent nevertheless appears unique to Standard Danish.
1.2 Stød in relation to word accents
Though uniquely Danish in some sense, the stød/non-stød distinction can also be seen as a parallel to Swedish and Norwegian word tones. Stød and word tones are tied to each other diachronically (Riad Reference Riad1998, Reference Riad and Lahiri2000), and there is a long tradition of understanding stød in a Scandinavian context. The distributional pattern of stød vs. non-stød in Standard Danish largely overlaps with the distributional pattern of Swedish and Norwegian accent 1 and accent 2. If speakers of Standard Danish produce a word with stød, speakers of Central Swedish and East Norwegian are likely to produce this word with a low word tone (accent 1), while Danish words without stød will be pronounced with a high word tone (accent 2) in the Swedish and Norwegian variants.
According to Basbøll (Reference Basbøll2005:86) there are some systematic exceptions to this distributional parallel:
(i) Due to the syllable-based nature of stød, each stem of a Danish compound may have stød or non-stød, while Swedish/Norwegian compounds as a whole have either accent 1 or accent 2.
(ii) Swedish/Norwegian monosyllables always have accent 1,Footnote 1 but Danish monosyllables may have stød or non-stød.
(iii) Stød can only be attached to voiced sounds of a certain minimal duration. The Danish stød therefore only occurs in syllables that have stød-basis i.e. either a long vowel or a short vowel followed by a sonorant. This restriction on occurrence does not apply to Swedish/Norwegian word accents.
Examples of the otherwise parallel distribution in Standard Danish and Central Swedish are shown in Table 1.
An example of the parallel distribution of Standard Danish stød/non-stød and Central Swedish accent 1/accent 2

Another common trait between the Danish stød/non-stød dichotomy and Swedish and Norwegian accent 1/accent 2 is the pronounced dependency on suffixes. In a manner similar to Standard Danish stød/non-stød, the occurrence of accent 1 and accent 2 in a word is altered by the suffixes used. The suffix, rather than the stem on which the word tone occurs, can therefore be seen as having an inherent word tone (Rischel Reference Rischel, Grønnum, Gregersen and Basbøll2008). Central Swedish lek ‘game’ followed by the plural suffix -ar (lekar ‘games’) is realized with accent 2 on the stem, but when followed by the singular definite suffix -en (leken ‘the game’), it is realized with accent 1. On the basis of this dependency, the Swedish suffixes -ar and -en have, respectively, been described as belonging to a class of ‘high tone-inducing’ and ‘low tone-inducing’ suffixes (Roll, Söderström & Horne Reference Roll, Söderström and Horne2013).Footnote 2 In a similar fashion, we may group Danish suffixes according to how they influence the occurrence of stød (see Grønnum Reference Grønnum2005:230).
1.3 Markedness of stød/non-stød and word tones
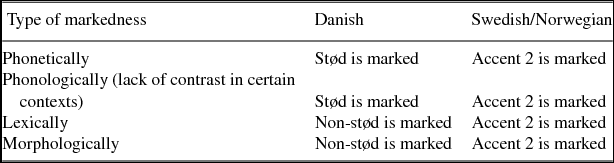
As has been shown, the distribution of stød corresponds to the distribution of accent 1. This distributional correspondence does not, however, entail that stød is also equivalent to accent 1 when it comes to markedness. The markedness status of stød and word tones is a controversial and recurring question in both the phonological and psycholinguistic literature. The ambiguous nature of the term markedness (Haspelmath Reference Haspelmath2006) adds to the complexity. According to Haspelmath (Reference Haspelmath2006), there are 12 senses of the word markedness. In some senses, markedness is defined as complexity, in other senses it is defined as difficulty, as abnormality or even as a correlation between complexity, difficulty and abnormality.Footnote 3 Basbøll (Reference Basbøll, Barnes, Bremmer, Lerchner and Nielsen2008) sees stød as corresponding to accent 1 when speaking of phonetic markedness and phonological markedness, but to accent 2 in terms of lexical and morphological markedness, see Table 2. Deliberately, he does not discuss markedness as frequency (Basbøll Reference Basbøll, Barnes, Bremmer, Lerchner and Nielsen2008:167), i.e. markedness ‘as abnormality’. Rather, Basbøll's analysis revolves around markedness ‘as complexity’.
The markedness of stød compared to non-stød and of accent 1 compared to accent 2 according to Basbøll (Reference Basbøll, Barnes, Bremmer, Lerchner and Nielsen2008)
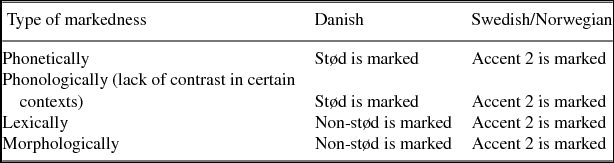
Basbøll (Reference Basbøll, Barnes, Bremmer, Lerchner and Nielsen2008:167) argues that stød is phonetically marked because it exhibits ‘something extra’ phonetically. He sees stød as phonologically marked because there are heavy phonological conditions on which syllables can have stød (the requirement for stød-basis). With respect to the lexical and morphological senses of markedness, he sees the function of non-stød as restricted, and thereby concludes that non-stød is marked. According to Basbøll (Reference Basbøll, Barnes, Bremmer, Lerchner and Nielsen2008), the correspondence between Swedish/Norwegian word tones and Danish non-stød/stød therefore depends on the meaning of markedness. Danish stød is the marked member in some senses and unmarked in others, while in Swedish and Norwegian, accent 2 is marked and accent 1 is unmarked both phonetically, phonologically, lexically and morphologically.
Basbøll's (Reference Basbøll, Barnes, Bremmer, Lerchner and Nielsen2008) account of accent 2 as marked concurs with e.g. Riad (Reference Riad and Lahiri2000), Rischel (Reference Rischel, Grønnum, Gregersen and Basbøll2008), Roll, Horne & Lindgren (Reference Roll, Horne and Lindgren2010), Roll, Söderström & Horne (Reference Roll, Söderström and Horne2011) and Söderström, Roll & Horne (Reference Söderström, Roll and Horne2012). Monosyllables always have accent 1, whereby accent 2 is considered phonologically marked. Phonetically accent 2 exhibits ‘something extra’ (Basbøll Reference Basbøll, Barnes, Bremmer, Lerchner and Nielsen2008:167) compared to accent 1 as it deviates from the (sentence) intonation contour (instead Roll et al. Reference Roll, Söderström and Horne2011 argue that accent 2 can be seen as marked in Central Swedish due to phonetic difficulty, i.e. a high tone involves faster movement of the vocal folds). As for lexical markedness, Basbøll (Reference Basbøll, Barnes, Bremmer, Lerchner and Nielsen2008) sees accent 1 as unmarked because accent 1 is less restricted lexically (e.g. occurring on loanwords), but Lahiri, Wetterlin & Jönsson-Steiner (Reference Lahiri, Wetterlin and Jönsson-Steiner2005, Reference Lahiri, Wetterlin, Jönsson-Steiner, Bruce and Horne2006) argue that a simpler analysis is obtained if accent 2 is regarded as default for all Scandinavian tonal dialects, while accent 1 is specified in the lexicon.
Basbøll's account shows that the intended meaning of markedness is crucial to the analysis. While the account covers a broad range of ‘markedness as complexity’ senses, it leaves unsaid the status of stød and word tones with respect to ‘markedness as difficulty’ and ‘markedness as abnormality’. These two senses have, however, become increasingly relevant with recent psycholinguistic studies of word tone processing (Roll et al. Reference Roll, Horne and Lindgren2010, Söderström et al. Reference Söderström, Roll and Horne2012, Roll et al. Reference Roll, Söderström and Horne2013). Psycholinguistic studies can measure cognitive markedness, i.e. ‘markedness as conceptual difficulty’ (Haspelmath Reference Haspelmath2006:26). The conceptual difficulty or cognitive load is determined by means of e.g. response times. Cognitive markedness is often seen to correlate with ‘markedness as abnormality’, i.e. response times will be longer for abnormal stimuli, e.g. infrequent and unpredicted input (Misyak, Christiansen & Tomlin Reference Misyak, Christiansen and Tomlin2010). It is, however, an open question how cognitive markedness relates to phonetic, phonological, lexical and morphological markedness. Roll et al. (Reference Roll, Horne and Lindgren2010), Söderström et al. (Reference Söderström, Roll and Horne2012) and Roll et al. (Reference Roll, Söderström and Horne2013) have carried out psycholinguistic studies to shed light on the markedness issue in relation to Central Swedish word tones, but the question how markedness ‘as complexity’ of a word tone should manifest itself in terms of psycholinguistic measures (cognitive markedness) remains unsolved. It is therefore not yet settled whether the differences in markedness status for stød/non-stød as compared to accent 1/accent 2 (as shown in Table 2) are also reflected in measures of cognitive processing.
1.4 The cognitive markedness of Central Swedish word tones
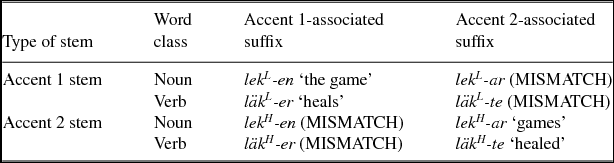
Psycholinguistic studies of Swedish accent 1 and accent 2 have focused on perception tasks where participants listened to words that either contained a match or a mismatch between a stem and a suffix. A matched combination in these experiments combines a stem produced with a low tone with a ‘low tone-inducing’ suffix (e.g. lekL-en ‘the game’) or combines a stem produced with a high tone stem with a ‘high tone-inducing’ suffix (e.g. lekH-ar ‘games’). A mismatched combination was created by splicing a low tone stem with a ‘high tone-inducing’ suffix (e.g. *lekL-ar) or splicing a high tone stem with a ‘low tone-inducing’ suffix (e.g. *lekH-en). Examples of matched and mismatched words are given in Table 3.
Examples of matched and mismatched stimuli of the type used in perception studies of Central Swedish by Roll et al. (Reference Roll, Horne and Lindgren2010, noun study) and Söderström et al (Reference Söderström, Roll and Horne2012, verb study). Raised letter L (low tone) and H (high tone) indicate the word accent used.
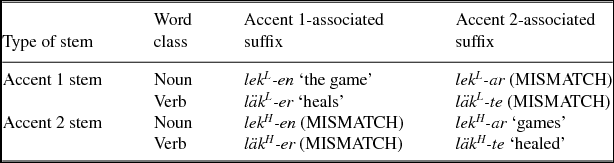
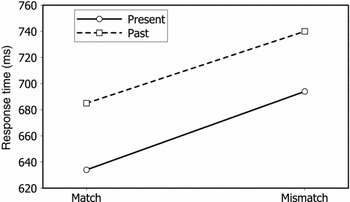
In a psycholinguistic response time study by Söderström et al. (Reference Söderström, Roll and Horne2012), participants were presented with Swedish sentences that contained a verb with either the present tense suffix -er or the past tense suffix -te. While the suffix -er is associated with accent 1, -te is associated with accent 2. The suffix either matched or mismatched the word accent of the verb stem (see Table 3 for examples). In the study, native speakers of Swedish were asked to quickly judge whether the utterance ‘represented an action in the present tense (nutid “now”) or the past tense (dåtid “then”)’. Not only did the authors find increased response time for mismatched compared to matched conditions but they also found that verbs with the past tense (accent 2-associated) -te suffix were processed more slowly than words with the -er suffix. According to the authors, there is a strong association between accent 2 and a particular set of endings including -te. When presented with a stimulus with an accent 2 stem, listeners have broader expectations toward the upcoming word form than for accent 1 stems, as accent 2 stems occur with a large number of word forms including compounds and suffixes like -te. In the case of a stimulus with an accent 1 stem, there is no cue for predicting the -te suffix, and the -te suffix therefore comes as a surprise to the listener.
An ERP (event-related potential) study by Roll et al. (Reference Roll, Horne and Lindgren2010) confirms that accent 2 is cognitively marked in relation to accent 1 (see also Roll et al. Reference Roll, Söderström and Horne2011 for a discussion on the relation between phonetic markedness and cognitive markedness). The authors see accent 2 stems as causing stronger expectations towards the nature of the suffix than accent 1 stems do. Roll et al. (Reference Roll, Horne and Lindgren2010) used the same kind of match–mismatch paradigm. Their target words, however, were Swedish nouns, not verbs, as in Söderström et al. (Reference Söderström, Roll and Horne2012). The nouns either ended with the definite singular accent 1 suffix -en, the indefinite plural accent 2 suffix -ar, or the accent 2 plural suffix -or. The suffixes -en and -ar were declensionally correct for the stems of the experimental stimuli, while -or was declensionally incorrect. Swedish listeners judged sentence acceptability, and ERPs were measured. Similarly to Söderström et al. (Reference Söderström, Roll and Horne2012), they found indications of processing difficulties for both kinds of mismatch (indicated by an increased N400 effect), but they also found differences between the two kinds of mismatch, when it comes to a later time window. For words with the declensionally incorrect suffix -or (e.g. *minkL-or and *minkH-or) as well as for a mismatch between accent 1 stem and the accent 2 suffix -ar (e.g. *minkL-ar), they found a P600 effect, which did not occur for mismatches between an accent 2 stem and an accent 1 suffix (e.g. *minkH-en). The P600 effect was taken as a sign of reanalysis of the stem–suffix combination, and the authors took the lack of a P600 effect for accent 2 stem combined with accent 1 suffix to indicate the low accent 1 is ‘a default accent, lacking association with any particular suffix’ (Roll et al. Reference Roll, Horne and Lindgren2010:114). The study also showed differences for ERPs in an earlier time window (around 200 ms after onset) between accent 2 stems and accent 1 stems, which could be interpreted as either relating to differences in the relative auditory saliency of the two word tones or to differences in activation of upcoming suffixes for the kinds of stems. A recent study by Roll et al. (Reference Roll, Söderström and Horne2013) investigated whether the effect in the early time window is in fact a lexical process. By comparing the processing of word tones in lexical material to delexicalized material (‘hums’), they found that effects in the early time window only apply to word tone differences in lexical material.
In the present article, we describe a response time study with a paradigm similar to Söderström et al. (Reference Söderström, Roll and Horne2012) with the aim of investigating the processing of Danish stød. Offline studies like these cannot clearly tell us which part of the stimuli is the cause of response time differences (whether a delay is caused by a particular stem, a particular suffix or by an association between the two, see the discussion in Section 6.5 below). Nevertheless, our study can investigate whether there are cognitive processing differences between stød and non-stød, and how the stød/non-stød pattern of cognitive difficulty corresponds to the accent 1/accent 2 pattern of cognitive difficulty found by Söderström et al. (Reference Söderström, Roll and Horne2012).
2. AIMS AND HYPOTHESES OF THE PRESENT STUDY
Danish stød is distributionally comparable to accent 1, but in some interpretations of markedness, stød is seen as comparable to Central Swedish accent 2 (see Table 2 above). This results in a cross-distribution with stød being equivalent to accent 2 in terms of phonetic and phonological markedness (both are marked), but stød being equivalent to unmarked accent 1 in other senses of markedness and in terms of distribution. This cross-distribution raises the question: Is stød equivalent to accent 1 or to accent 2 when it comes to cognitive markedness?
The relation between Danish stød/non-stød and Swedish/Norwegian word tones is of relevance to a description of the cognitive markedness of both stød and word tones. The present study aims to show how a prosodic phenomenon in one Scandinavian language can shed light on the nature of prosodic phenomena in other Scandinavian languages and increase insight into mechanisms behind the processing of prosody. It investigates the architecture and mechanisms of stød processing and seeks to determine the strength of the association between stød+suffix and non-stød+suffix. Finally, it compares the processing measures for stød+suffix and non-stød+suffix to results from previous studies of Swedish word tones. This comparison may reveal whether stød exhibits a cognitive pattern similar to accent 2 (both stød and accent 2 are considered phonetically and phonologically marked) or to accent 1 (with which stød shares a distributional pattern).
Stød is associated with certain word structures under certain morphological conditions (see Grønnum Reference Grønnum2005). This means that by exchanging the definite singular suffixes -en/-et (associated with stød at the stem) with the plural indefinite suffix -e (associated with non-stød at the stem) one can examine how language users respond to such a reversal. By matching and mismatching two kinds of stems (with and without stød) with two kinds of suffixes (singular definite vs. plural indefinite), the study has a 2 × 2 design similar to Roll et al. (Reference Roll, Horne and Lindgren2010) and Söderström et al. (Reference Söderström, Roll and Horne2012), with type of suffix and match/mismatch between suffix and stem as its two independent variables. By measuring and comparing language users’ response times and response correctness according to the four conditions, it can be shown whether or not the prosody of the stem (stød or non-stød) is an influencing factor in the word processing of Danish language users, aside from semantic discrimination, as previously described. In line with previous studies, we interpret a decrease in response accuracy as an increase in cognitive difficulty, and we also interpret an increase in response time as an increase in cognitive difficulty. Both measures are included as they differ in sensitivity. With response correctness, the answer is either singular or plural whereas with response time, the range of possible responses is much greater, making response time a more sensitive variable.
Based on the results from Söderström et al. (Reference Söderström, Roll and Horne2012), we hypothesized that responses to mismatched stimuli would be more inaccurate and slower than responses to matched stimuli. We expected that the two kinds of matched stimuli (stød + definite singular suffix and non-stød + indefinite plural suffix) behave similarly with respect to cognitive difficulty. We therefore hypothesized that the response accuracy and response time would not differ significantly between the two matched conditions.
We also looked for interactions between the two independent variables to determine whether the association between stem and suffix differed in strength, but we did not have a directional hypothesis.
3. METHOD
In this section, we present the material and experimental procedure for our psycholinguistic study in which participants listened to words that had either a congruent or an incongruent combination of prosody (stød or non-stød) and suffix (-en/-et and -e).
3.1 Material
The stimuli consisted of 40 test items × 4 conditions: Two matched conditions in which stød/non-stød at the stem were matched with their associated suffixes (stød matched with -en/-et and non-stød matched with -e, respectively), and two mismatched conditions (stød mismatched with -e and non-stød mismatched with -en/-et). Altogether there were 160 test words (80 matched and 80 mismatched, see Appendix for details). All words contained a syllable with stød-basis (Basbøll Reference Basbøll2003, Reference Basbøll, Barnes, Bremmer, Lerchner and Nielsen2008).
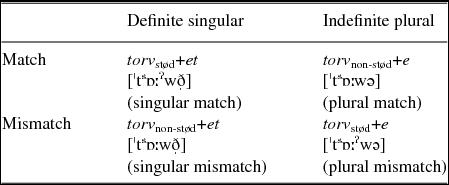
The test words were all nouns with oxytone stems (i.e. stems with primary stress on the final syllable). An example of one of the 40 items is given in Table 4.
The four conditions of the experimental stimuli exemplified with the item torvet/torve ‘town square’/‘town squares’.
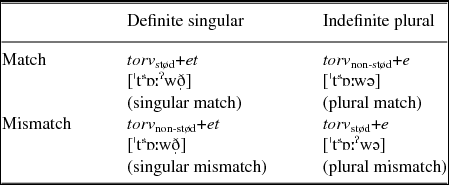
Söderström et al. (Reference Söderström, Roll and Horne2012) used verbs in the present and past tense in their study of Swedish word tones, but such stimuli would not be suitable in a study of Danish. As thoroughly discussed by Grønnum (Reference Grønnum2005:230ff.), there is no predominant tendency in Standard Danish to a specific correspondence between a particular verb suffix and the prosody of the verb stem. The assignment of stød to verbs is a complex matter and one must take into account factors other than just the verb suffix, e.g. the number of syllables and whether the stem is identical with the infinitive (see Grønnum Reference Grønnum2005:231).
Taking into account the complexity and irregularity of stød assignment to inflected verbs, we instead based the stimuli on inflected nouns. The singular definite suffix (-en for common gender and -et for neuter gender) and the indefinite plural -e were chosen. As shown by Grønnum (Reference Grønnum2005), less complex rules for stød manifestation apply to these suffixes. For instance, there are no exceptions to the association between non-stød and the plural suffix -e.Footnote 4 The definite singular suffix -en/-et associates to stød in oxytone stems (stems with emphasis on the final syllable). Thus, within the class of nouns, oxytone stems are, as a rule of thumb, pronounced with stød when appearing in the singular definite form, and the stem, presuming that it takes the plural suffix -e, is pronounced with non-stød in the plural. For a fair comparison between stød-associated suffixes and non-stød-associated suffixes, the target words of the experiment solely consisted of nouns which could be pluralized with -e and which had an oxytone stem. The two types of suffixes not only differ in number, but also in definiteness. Still, we prefer to compare response times for the singular definite -en/-et vs. the plural indefinite -e rather than to compare the singular definite with the plural definite -ene, since -en/-et and -ene differ in the number of syllables. It would not be possible to tell whether increased or decreased response times were due to either increase or decrease in the number of syllables or to other factors.
To ensure that the prosody of the stem was the only cue to the suffix, and that nothing apart from stød/non-stød distinguished the stems of the test words, we did not include items such as the noun finger ‘finger’ with the plural form fingre ‘fingers’, as the /r/ was audible in the stem and as such possibly a cue to the suffix. We also avoided the use of test words that could be confused with verbs or adjectives. This proved fairly tricky as e.g. the plural suffix -e can be mistaken for the infinitive suffix -e. For instance, the plural noun huse ‘houses’ could be confused with the infinitive verb huse ‘to house’. Previous studies (Jastrzembski Reference Jastrzembski1981, Azuma & van Orden Reference Azuma and van Orden1997) have shown that polysemy has a noticeable effect on word processing. Expressions that carry several meanings are processed more rapidly than those that carry fewer meanings. Therefore, polysemic words were also excluded from the experimental stimuli.
3.1.1 Preparation of stimuli
The stimuli were recorded in a soundproof studio with a dictaphone (Olympus Linear PCM Recorder LS-10) in WAV-format (standard CD-quality). To ensure a uniform pronunciation, all stimuli were recorded in one session by the same speaker, a 26-year-old woman. All stimuli were recorded as distinctly as possible without, however, compromising natural speech. For example, the word falken ‘the falcon’ was pronounced with a co-articulated and syllabic nasal [ˈfalˀk] (see Brink et al. Reference Brink, Lund, Heger and Jørgensen1991:1633). With a more distinct pronunciation than that, e.g. [ˈfalˀkən], there would be a risk of drawing the participants’ attention away from the experimental task. Test words were only recorded in the two matched conditions. The intelligibility of the sound files was checked by a 57-year-old woman and a 62-year-old woman. Both were able to perfectly identify all words produced by the speaker.
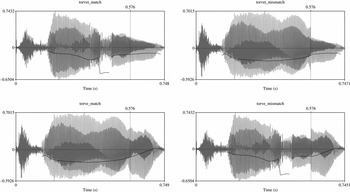
The sound files of the two matching conditions were digitally manipulated in order to create the two mismatched conditions. The recorded stimuli were edited in Praat v5.3.66 (Boersma Reference Boersma2001). First it was ensured that the two matched items did not differ from each other in duration. The duration of each item was therefore adjusted so that the recordings of each item had a maximal variation of 10 ms. Had the duration of the test words not been the same across the four conditions, there would have been no comparative basis on which to interpret the results. The disambiguation point between stem and suffix was manually annotated for each recording. For both the stems and the suffixes, the length was adjusted (by either cutting out or copying and repeating part of the syllabic elements), so that the two conditions did not differ with respect to the duration of the stem or the duration of the suffix. Since the recordings of singular suffixes were typically longer than those of plural suffixes, this meant that singular suffixes were usually shortened and plural suffixes were usually lengthened. After this adjustment, the sound files were digitally manipulated to create the two mismatched conditions: The stød stem was concatenated with the non-stød-associated suffix, and the non-stød stem was concatenated with the stød-associated suffix. Figure 2 illustrates a typical example of the disambiguation point (marked with a dotted line) across the four conditions with the test item torvet/torve ‘the town square’/‘town squares’.
The input and output of the digital sound manipulation for the item torvet/torve ‘the town square’/‘town squares’. The disambiguation points are shown with a dotted vertical line. The disambiguation point is the point in time where the stem ends and the suffix starts (here around 576 ms into the recording). The two matched conditions are shown on the left. The two unmatched conditions are shown on the right: torvet_mismatch is a mismatched concatenation of the recording of the plural stem and the recording of the singular suffix, while torve_mismatch shows a mismatched concatenation between the recording of the singular stem and the recording of the plural suffix.

3.2 Participants
In total, 30 participants took part in the experiment, but three participants did not meet the inclusion criteria (see below) and one participant's data was excluded because she was too tired to attend to the experiment (she seemed unmotivated, nearly fell asleep during the experiment, and her response times were significantly longer than those of the other participants). The exclusion of these four participants left 26 participants (20–32 years of age, mean 23.7 years, 7 male), who all met the following four inclusion criteria: native speaker of Danish, born and raised north of the stød border, student or in between studies, and right-handed. The first three criteria were intended to ensure, respectively, linguistic uniformity, that stød was part of the participants’ language and that participants were of a relatively young age. As the response buttons were located to the right, only right-handed participants were included.
Following the Declaration of Helsinki (World Medical Association 2002), all participants gave their informed consent, permitting the use and the publication of their data, and were informed of their right to withdraw their participation from the study for up to 24 hours after their participation.
3.3 Experimental procedure
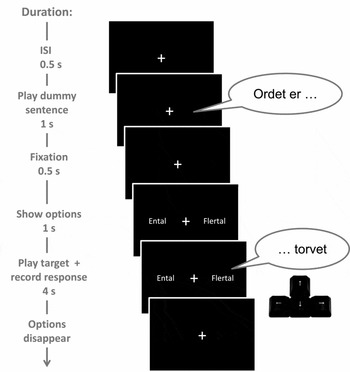
The experiment was conducted using the experimental software program PsychoPy v1.80.08 (Peirce Reference Peirce2007)Footnote 5 on a laptop PC. The duration of the experiment was approximately 20 minutes. After an oral and written introduction, the participants completed a short training session with eight training words that were not part of the actual experiment. The purpose of the initial training session was to make the participants comfortable with the task. After the training session, participants were presented with the four experimental blocks of the study. Each block contained 40 target words (a mix of all four conditions) as well as 10 fillers played in a randomized order. To prevent all four conditions of a test item from appearing immediately after one another, the four conditions of each item were divided over the four blocks. The procedure of target trials is illustrated in Figure 3.
The experimental procedure. After an inter-stimulus interval (ISI) of 0.5 s, the participant heard the dummy sentence Ordet er . . . ‘The word is . . .’, which had a duration of one second. Half a second after the onset of the dummy sentence, the participant saw the two response options on the screen (ental/flertal ‘singular’/‘plural’). One second after the response options appeared, the participant heard the target word (e.g. torvet ‘the town square’), and the participant was required to indicate the number of the word using the left arrow key or right arrow key of the keyboard. The response options disappeared from the screen after four seconds, but the experiment did not continue until the participant had responded. Once the participant had responded, the procedure was repeated for the next trial. For fillers, the response options were different, but the procedure was otherwise identical. After looping through 50 trials, a pause screen was shown, and the participant had a break of 15 s.

The task of the participants was to indicate, as accurately as possible and as fast as possible, whether the target word was a singular or plural noun. Response accuracy and response time were recorded for all trials. For half of the trials, the singular option appeared on the right side of the screen; for the other half, it appeared on the left side. In one out of five trials, the stimulus was a filler word. The purpose of the filler trials was to ensure that the participants focused on the entire test words and not just on one morpheme of the word (the suffixes).
For these filler trials, a filler word such as volde ‘fortifications’ was played, and two response options appeared on the screen. The response options were the written version of the filler word as well as a word with the same suffix but with a different stem (e.g. volde/skjolde ‘fortifications’/‘shields’. Except for these different response options, the procedure for filler trials was identical to the target trials.
4. ANALYSIS
Only target trials (not filler trials) were analyzed. Response time was measured from the disambiguation point (the onset of the suffix), thereby taking into account small differences in the disambiguation points that in some cases occurred across the four conditions of each test item. The analysis only included the response time to correct responses. Before analyzing these responses, outliers were adjusted.Footnote 6 For each participant, the mean of the four conditions was calculated as well as the standard deviation. All observations two standard deviations above and below the mean were considered outliers and adjusted to the border value. This procedure affects 3.6% of the data.
After this procedure, a statistical analysis of response accuracy and response time was carried out in R version 3.1.1. (R Core Team 2014) using the aov function. For each of the two dependent variables, a two-way ANOVA was conducted both by subject (F1) and by item (F2).
5. RESULTS
5.1 Response accuracy
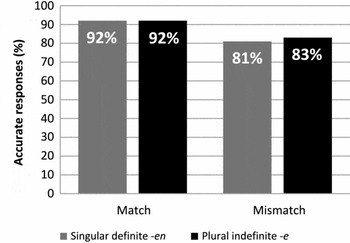
The analysis showed a significant effect of congruency on response accuracy (F1(1,25) = 14.1, p < .001; F2(1,39) = 22.6, p < .001), but no effect of suffix type (-e or -en) and no interaction. As shown in Figure 4, matched conditions had an average response accuracy of 92% for both conditions, whereas the response accuracy dropped to 81% for the mismatched singular definite and 83% for the mismatched plural indefinite condition. A post hoc pair-wise comparison of the two mismatched conditions showed no significance of suffix type.
Percentage of accurate responses across participants grouped by the four conditions of the experiment.

5.2 Response time
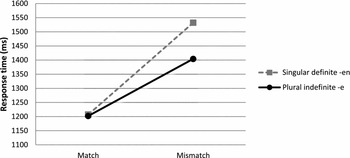
Mean response times (RTs) for all accurate responses (with adjusted outliers) are shown in Figure 5. Responses to the matched conditions (averaging around 1200 ms) were significantly shorter than responses to the two mismatched conditions (F1(1,25) = 101, p < .001; F2(1,39) = 297.6, p < .001). There was no significant effect of suffix type (-e vs. -en/-et), but there was an interaction between congruency and suffix type, such that there was a larger difference between singular definite conditions than between the plural indefinite conditions (F1(1,25) = 5.7, p < .05; F2(1,39) = 9.4, p < .01). As shown in Figure 5, matched conditions, singular and plural, had an average response time of 1207 ms and 1202 ms, respectively. Mismatched conditions had an average response time of 1532 ms (singular) and 1404 ms (plural). A post hoc Tukey HSD test was carried out to compare the conditions pairwise. With a p-value close to 1, the comparison between the mean RT for congruent singular definite and congruent plural indefinite was not significant, but all other pairwise comparisons were significant, with a p-value below .001.
Response time (outliers adjusted) for all accurate responses, reported in milliseconds for the four conditions of the experiment. For the matched conditions there was no significant difference between the RT for singular definite (mean 1207 ms ±394 ms) and plural indefinite (mean 1202 ms ±391 ms). For mismatched conditions the RT for the singular definite condition (mean 1532 ms ±644 ms) was higher than for the plural indefinite (mean 1404 ms ±493 ms).

6. DISCUSSION
For the two congruent conditions, there was no significant difference between the participants’ responses to definite singular and indefinite plural nouns, neither for response accuracy nor for response time. The lack of a significant difference for both of these measures seems to indicate that the matched conditions were comparable in terms of cognitive difficulty. Both the response accuracy data and the response time data showed an effect of congruency: Participants gave slower and more inaccurate responses to the mismatched conditions. The effect of congruency may indicate a higher cognitive load for incongruent combinations of stød/non-stød and suffix. Interestingly, we found an interaction effect between congruency and number: The difference in response time between singular matched and mismatched nouns was larger than the difference in response time between plural match and mismatched nouns. Response accuracy did not, however, seem sensitive to this interaction effect. The interaction for response time may show that the mismatched combination of non-stød and singular definite -en/-et is more cognitively demanding and surprising to participants than the mismatched combination of stød and plural indefinite -e.
6.1 Comparing the cognitive status of stød and word tones
Because Söderström et al.’s (Reference Söderström, Roll and Horne2012) study does not report the number of excluded incorrect (inaccurate) responses, only the response time patterns of the two studies can be compared. Figure 6 illustrates the results of the Swedish word accent response time study, which can be compared to our results for Danish stød/non-stød in Figure 5 above.
Results from response time study executed by Söderström et al. (Reference Söderström, Roll and Horne2012). Reprinted from Söderström et al. (Reference Söderström, Roll and Horne2012:87) with the publisher's permission.

As in Söderström et al. (Reference Söderström, Roll and Horne2012), we found increased response times for the mismatched conditions compared to the matched conditions, indicating increased processing difficulties for these kinds of anomalous stimuli. However, unlike the Swedish study, which found a difference in response time for words with accent 1 stems vs. accent 2 stems in the matched condition, we found no difference between stød and non-stød in the matched conditions. We only found a difference between the two mismatched conditions: Mismatched items with non-stød showed longer response times compared to mismatched items with stød. The fact that mismatched items with non-stød had the longest response time could indicate that the cognitive status of Danish non-stød is parallel to Central Swedish accent 1 (as mismatched words with accent 1 prosody have the longest response time in Söderström et al. Reference Söderström, Roll and Horne2012), and that the cognitive status of Danish stød is parallel to Central Swedish accent 2.
6.2 No difference between the two matched conditions
When comparing the response times for the two matched conditions in the present study, we did not, as mentioned above, find a difference between a stød stem with singular definite -en/-et and a non-stød stem with a plural indefinite -e. This is contrary to the difference between the matched conditions of Söderström et al. (Reference Söderström, Roll and Horne2012). As a possible explanation for the difference in their study, they propose that ‘the silent closure of the stop in the past tense suffix -te provided less acoustic information than the vowel onset of the present tense suffix -er at the disambiguation point following the stem-final stop release, and thus could prolong syllabification of the stem final consonant’ (Söderström et al. Reference Söderström, Roll and Horne2012:86). Another explanation could be that the timing of accent 1 and accent 2 differs in their experimental stimuli, such that the information regarding accent 1 is realized earlier than the information regarding accent 2.Footnote 7 This difference in timing may have affected the response times to some degree. In our study the prosodic information is realized close to the suffix both in the case of stød and of non-stød and is therefore unlikely to cause response time differences.
Yet another explanation for the difference between our results and those of Söderström et al. (Reference Söderström, Roll and Horne2012) could come from the difference in the suffixes of the stimuli words. In the Söderström et al. (Reference Söderström, Roll and Horne2012) study, words with the past tense -te were more cognitively difficult than with the present tense -er, while in our study words with the definite singular suffix -en/-et and the indefinite plural suffix -e were comparable in terms of cognitive load. With respect to cognitive load and processing, the past tense may be considered more cognitively difficult than the present tense, as the present tense exhibits higher accessibility (Haspelmath Reference Haspelmath2006). Following this line of argumentation, the singular–plural contrast could also be regarded as a contrast in cognitive difficulty that would also result in response time differences even for matched conditions. Drawing on Givón (Reference Givón1991), Haspelmath (Reference Haspelmath2006:32) analyses singular as less complex than plural and singular word forms should as such be processed more rapidly than plural word forms. However, in our study, we did not simply contrast singular nouns with plural ones – the suffixes also differed with respect to definiteness. According to Givón (Reference Givón1991:335, cited in Haspelmath Reference Haspelmath2006:32) definite noun phrases can be described as cognitively more difficult than indefinite noun phrases. As such, both types of suffixes in the present study of stød/non-stød, the definite singular suffix and the indefinite plural suffix, are cognitively difficult in some way. The fact that the semantics of both of these noun suffixes could be considered complex (though this may not mean equally complex) may explain why we, unlike Söderström et al. (Reference Söderström, Roll and Horne2012), did not find a difference between the matched conditions: In our experiment, both types of congruent words were somewhat cognitively difficult.
6.3 An effect of congruency
The present study also showed a significant effect of congruency both with respect to response time and response accuracy. Participants responded more slowly and less accurately to mismatched words. The unconventional pronunciation may cause increased cognitive difficulty when processing the word and retrieving it in the mental lexicon. The effect of congruency can also be explained in light of recent prediction theories. According to Clark (Reference Clark2013:181), the human brain is essentially a ‘prediction machine’ and relies heavily on top–down-processing. Thus, expectation governs word recognition. In the present study, participants may have used top–down processing to predict whether a word appears in the singular or in the plural. Based on their experience as a language user, the participant will expect that an oxytone noun stem with stød will be followed by -en/-et (rather than -e), and that an oxytone noun stem with non-stød will be followed by -e (rather than -en/-et). In the matched conditions, these predictions are in accordance with the input that actually occurred. However, in the mismatched conditions, the participants are surprised because the prediction is different from the input that actually occurred, e.g. the participant predicts that the oxytone noun stem with stød will be followed by a singular definite -en, but it is instead followed by an unpredicted input: the plural indefinite -e. In other words, this prediction error is a ‘“surprise” induced by a mismatch between the sensory signals encountered and those predicted’ (Clark Reference Clark2013:183). As conventionality is broken and top–down processing is not sufficient, response accuracy decreases and a bottom–up analysis of the stimuli is required which may result in increased response times. A similar analysis might be offered for the Swedish accent study made by Söderström et al. (Reference Söderström, Roll and Horne2012), who also found an effect on the congruency variable, and is further supported by the finding of ERP ‘expectation components’ for processing of Swedish word tones (Roll et al. Reference Roll, Söderström and Horne2013).
6.4 Prosodic congruency interacts with suffix type
Besides the effect of congruency, the present study found an interaction between prosodic congruency and suffix type: The difference in response time between matched and mismatched conditions was greater for words with a singular definite suffix than for words with a plural indefinite suffix. Response accuracy, however, was not sensitive to this interaction.
The response time interaction can be interpreted as related to the previously described surprise effect for mismatched items and can thereby be used to say whether there is a stronger association between stød and -en/-et than between non-stød and -e, or whether it is the other way around. The problem is, however, that there are many possible ways to interpret what causes the surprise, and that these different kinds of interpretation give contradictory conclusions. Concentrating on the suffix, the surprise could be caused either by the suffix that occurred (in which case -en/-et is more surprising than -e) or by the suffix that did not occur (in which case the lack of -e is more surprising than the lack of -en/-et). If we take the view that the suffix that occurred caused a surprise, we can see the association between stød and the definite singular suffix as stronger than the association between non-stød and the indefinite plural suffix, as there is a greater difference in response time between matched and mismatched singular definite -en/-et than between matched and mismatched plural indefinite -e. In other words, when the singular definite suffix is not preceded by a stem with stød, it comes as a big surprise to the listener and increases the response time – an even bigger surprise than when the plural indefinite suffix occurs without the presence of a non-stød stem. This makes stød function as indicative and predictive of a specific set of suffixes, while non-stød is also indicative and predictive, but with a weaker association.
If, on the other hand, we take the view that the surprise in the mismatched conditions was caused by a predicted suffix that did not occur, we should regard the association between a non-stød stem and -e as stronger than the association between stød and -en/-et. This interpretation would hold that the stronger the prediction towards either singular or plural, the more surprising a mismatched unpredicted suffix will be, resulting in increased processing demands and increased response times.
Yet another way to interpret the interaction would be to look at the number of activated word forms for stød vs. non-stød. Söderström et al. (Reference Söderström, Roll and Horne2012) argue that the number of activated word forms can influence response times, such that an increased processing load for accent 2 can be explained by its wider range of associated word forms (including compounds). In the case of Danish stød and non-stød, it could be argued that non-stød activates more words than stød, and that the association of non-stød is therefore more widespread and weaker than the association of stød. Non-stød is often seen in connection with compounds at the initial syllable of the compound, e.g. flodˀ vs. flodbølge ‘river’ vs.’tsunami’, håndˀ vs. håndtryk ‘hand’ vs. ‘handshake’. Stød, on the other hand, is associated with specific inflections and derivations (see Grønnum Reference Grønnum2005). This means that non-stød activates more words than stød, and therefore it takes more processing time to rule out possible connections for a non-stød stem than for a stød stem. The association and predictive feature of stød is thus greater than that of non-stød.
As shown here, there are different ways to model the association between stød and suffix in light of prediction theories – some of which directly contradict each other. In both cases, stød can be seen as a prosodic index (Nielsen Reference Nielsen2012) of definite singular suffix -en/-et (and non-stød as an index of -e).
6.5 The relation to markedness
As mentioned, it is still an open question how markedness ‘as complexity’ of a tone should manifest itself in terms of psycholinguistic measures (markedness ‘as difficulty’). The response time measures of the present study could be interpreted as reflecting the complexity of the linguistic system (e.g. phonetic complexity, phonological complexity, morphological complexity or lexical complexity), but the cognitive load of a text can also be attributed to factors outside of the linguistic system e.g. frequency. There may be a correlation between cognitive markedness and some type of markedness ‘as complexity’, but behavioral measures give no guarantee of directly and solely reflecting the structure of language. Part of Söderström et al.’s (Reference Söderström, Roll and Horne2012) argument of accent 2 being more marked than accent 1 is that accent 2 is associated with a wide range of word forms, but it is not entirely clear why a wide range of associated word forms for accent 2 as compared to accent 1 would imply that accent 2 is more marked in terms of cognitive difficulty. Following this line of argumentation, any type of frequently occurring stem would be more cognitively difficult than an infrequently occurring stem. This goes directly counter to the idea of textual markedness (‘markedness as abnormality’, Haspelmath Reference Haspelmath2006:33), according to which a marked word or morpheme is a word or morpheme that rarely occurs in texts.
As mentioned, a behavioral measure such as response time may have a number of sources and may or may not reflect a specific linguistic systematicity. Not all linguistic systematicity will be reflected in response time measures (or in other available behavioral or neuroscientific measures). Therefore, we cannot convincingly say that the response time differences are caused by systematic differences at some level in the language system, let alone differentiate between e.g. phonetic and phonological differences. What we can say, however, is whether or not a behavioral measure correlates with a linguistic systematicity. If we see accent 2 as marked in the ‘complexity’ sense of the word (as phonetically, phonologically, morphologically and lexically marked, see Table 2 above), the results of Söderström et al. (Reference Söderström, Roll and Horne2012) show a correlation between markedness as linguistic complexity and cognitive markedness: Accent 2 is marked in terms of linguistic complexity and the authors also interpret accent 2 as cognitively marked. The response pattern for accent 2 in their study corresponds to the pattern for stød in our study. If we thereby conclude that stød is cognitively marked compared to non-stød, our results show a positive correlation between cognitive markedness on the one hand and phonetic markedness and phonological markedness on the other (stød is also phonetically and phonologically marked, according to Table 2), but a negative correlation with lexical and morphological markedness (non-stød is marked according to Basbøll Reference Basbøll, Barnes, Bremmer, Lerchner and Nielsen2008, see Table 2). On these grounds, a bold interpretation of our results (assuming that the positive correlation equals causation) would be that cognitive markedness is a measure of phonetic and phonological markedness, but not of lexical and morphological markedness. Returning (bold attitude intact) to the results of Söderström et al. (Reference Söderström, Roll and Horne2012), we can reinterpret their data with respect to ours, assuming parallelism, and claim that their measure of cognitive markedness only corresponds to phonetic and phonological markedness, and not to morphological and lexical markedness. In the end, this would mean that there is still no cognitive support to either side of the controversy about lexical markedness of word tones: The behavioral measures of Söderström et al. (Reference Söderström, Roll and Horne2012) do not tell us whether accent 2 is lexically marked (see Table 2) or lexically unmarked (Lahiri et al. Reference Lahiri, Wetterlin and Jönsson-Steiner2005).
6.6 The timing of cognitive markedness effects
Another difficulty in interpreting cognitive measures of markedness involves determining at what time during processing markedness effects for word tones should occur: Should measurements of markedness focus on the time window for processing marked vs. unmarked stems, for the suffixes associated with marked vs. unmarked stems or for the associations between stems and suffixes? When discussing this issue, it is relevant to distinguish between online studies such as the ERP study of Roll et al. (Reference Roll, Horne and Lindgren2010), where data is obtained while the listener is processing the target words and offline studies such as the current response time study and the study of Söderström et al. (Reference Söderström, Roll and Horne2012), where data is obtained after the listener has processed the target word. In online studies, we may distinguish between the processes related to the stem and processes related to the suffix, as we can distinguish between these processes in time. Offline measures of stem+suffix processing, on the other hand, cannot separate processes in time and do not accurately reveal whether increased response times are due to markedness of a particular stem, markedness of a particular suffix or markedness of a particular combination of stem+suffix. This means that in the case of Söderström et al. (Reference Söderström, Roll and Horne2012), we cannot convincingly say whether response times for the past tense accent 2 suffix are longer than for the present tense accent 1 suffix because the past tense suffix is marked ‘as abnormality’ (e.g. because it is infrequent) in relation to the present tense suffix, or because there is a difference in the markedness ‘as complexity’ status of the word accents. Similarly, our offline study of Danish stød does not allow us to say whether differences in cognitive difficulty (in this case response times) are caused by a prosodic feature (stød or non-stød) or a morphological contrast (-en/-et or -e). Future online studies (e.g. ERP studies) can determine what part of the word causes the increased processing load that we find in the present study. In addition, future ERP studies can show whether the P600 and P200 components found in Roll et al.’s (Reference Roll, Söderström and Horne2013) comparison of accent 1 and accent 2 also occur for Danish stød.
6.7 Conclusion: Correspondence between stød/non-stød and the Central Swedish word accents
With respect to distribution, stød in Standard Danish corresponds to accent 1 in Central Swedish, and non-stød corresponds to accent 2. However, the results of the present study seem to complicate the relationship between stød/non-stød and the Central Swedish accents, as it shows a cross-distributional relationship between the distribution and cognitive status of Danish and Swedish prosodic features. In our study, non-stød mismatch has the longest response time, and in Söderström et al. (Reference Söderström, Roll and Horne2012) the longest response time occurred for accent 1 mismatch. Our study therefore suggests that stød corresponds to accent 2 in terms of cognitive load.
ACKNOWLEDGEMENTS
The authors would like to thank the editors for their support in the initial stages of the project, the anonymous reviewers for their helpful and constructive comments on the content and structure of earlier drafts of the article, and Ruben Schachtenhaufen for help with the phonetic transcription.
APPENDIX
Target stems with glosses
Each of the 40 words was recorded with a definite singular suffix (-en or -et depending on the grammatical gender) and with an indefinite plural suffix (-e).