





Highlights
What is already known?
-
• Artificial intelligence (AI) and machine learning (ML) offer potential solutions for automating labor-intensive evidence synthesis tasks.
-
• Challenges in integrating specific AI tools into existing workflows, together with limited understanding of their reliability, may undermine any efficiency gains from AI automation.
What is new?
-
• AI/ML tools have been developed and evaluated for nearly every evidence synthesis task, but with variable performance and readiness for implementation.
-
• Across tasks, the most consistent evidence supports using AI/ML tools to assist (not replace) reviewers in study design identification and study screening workflows.
-
• A critical limitation of the evidence base is the lack of standardized evaluation approaches.
Potential impact for RSM readers
-
• For randomized controlled trial identification and screening prioritization, AI/ ML tools can be implemented with safeguards.
-
• For search strategy design, data extraction, and risk of bias assessment, evidence remains heterogeneous and highly sensitive to implementation details (e.g., training data, prompting strategies, and reference standards).
-
• Because many tools share underlying model types (e.g., LLMs), practical selection should emphasize workflow fit (integration, audit trails, versioning), transparency (ability to document prompts and parameters), and governance (privacy and security).
1. Introduction
Evidence synthesis products (ESPs), including systematic reviews (SRs), rely on scientific methods to identify, summarize, and evaluate studies, yielding rigorous appraisals of the evidence that serve as the foundation of evidence-based healthcare and health policy.Reference Gough, Oliver and Thomas1 Moreover, ESPs serve a critical function in a variety of disciplines beyond health, such as education and environmental science. However, producing high-quality ESPs requires substantial time and resources. A 2019 analysis estimated the average cost at $141,195 per review,Reference Michelson and Reuter2 with most resources devoted to searching, screening, and data extraction.Reference Nussbaumer-Streit, Ellen and Klerings3 As the demand for timely, well-conducted SRs increases, and as the volume of primary studies continues to grow, it is important to identify ways to improve efficiency.Reference Tsafnat, Dunn, Glasziou and Coiera4, Reference Wallace, Dahabreh, Schmid, Lau and Trikalinos5
Artificial intelligence (AI) and machine learning (ML) technologies offer potential solutions for automating labor-intensive evidence synthesis tasks. Recent advances in generative large language models (LLMs) and fine-tuned task-specific models have generated considerable interest in the evidence synthesis community as a potential option to improve review timeliness and reduce costs. These tools can be implemented through zero-shot learning, in which pretrained models are applied to tasks without specific training, or through fine-tuning on task-specific datasets.
As AI tools are integrated into ES workflows, it is crucial to understand what research has been done and what tools already exist to avoid redundant research and development efforts and to help systematic reviewers determine which tools may improve their processes. In recent years, several reviews have addressed the use of AI and ML in biomedical evidence synthesis.Reference Affengruber, van der Maten and Spiero6– Reference MSA, Peiris and Figueiró13 However, few have systematically evaluated tool/model performance, and, to our knowledge, none are being regularly updated.
To address these concerns, we are conducting a living rapid review and evidence map of AI/ML tools for evidence synthesis. This review aims to provide evidence synthesis methodologists with comprehensive information about available tools, their performance characteristics, and practical implications for workflow integration.
2. Methods
2.1. Review design and protocol
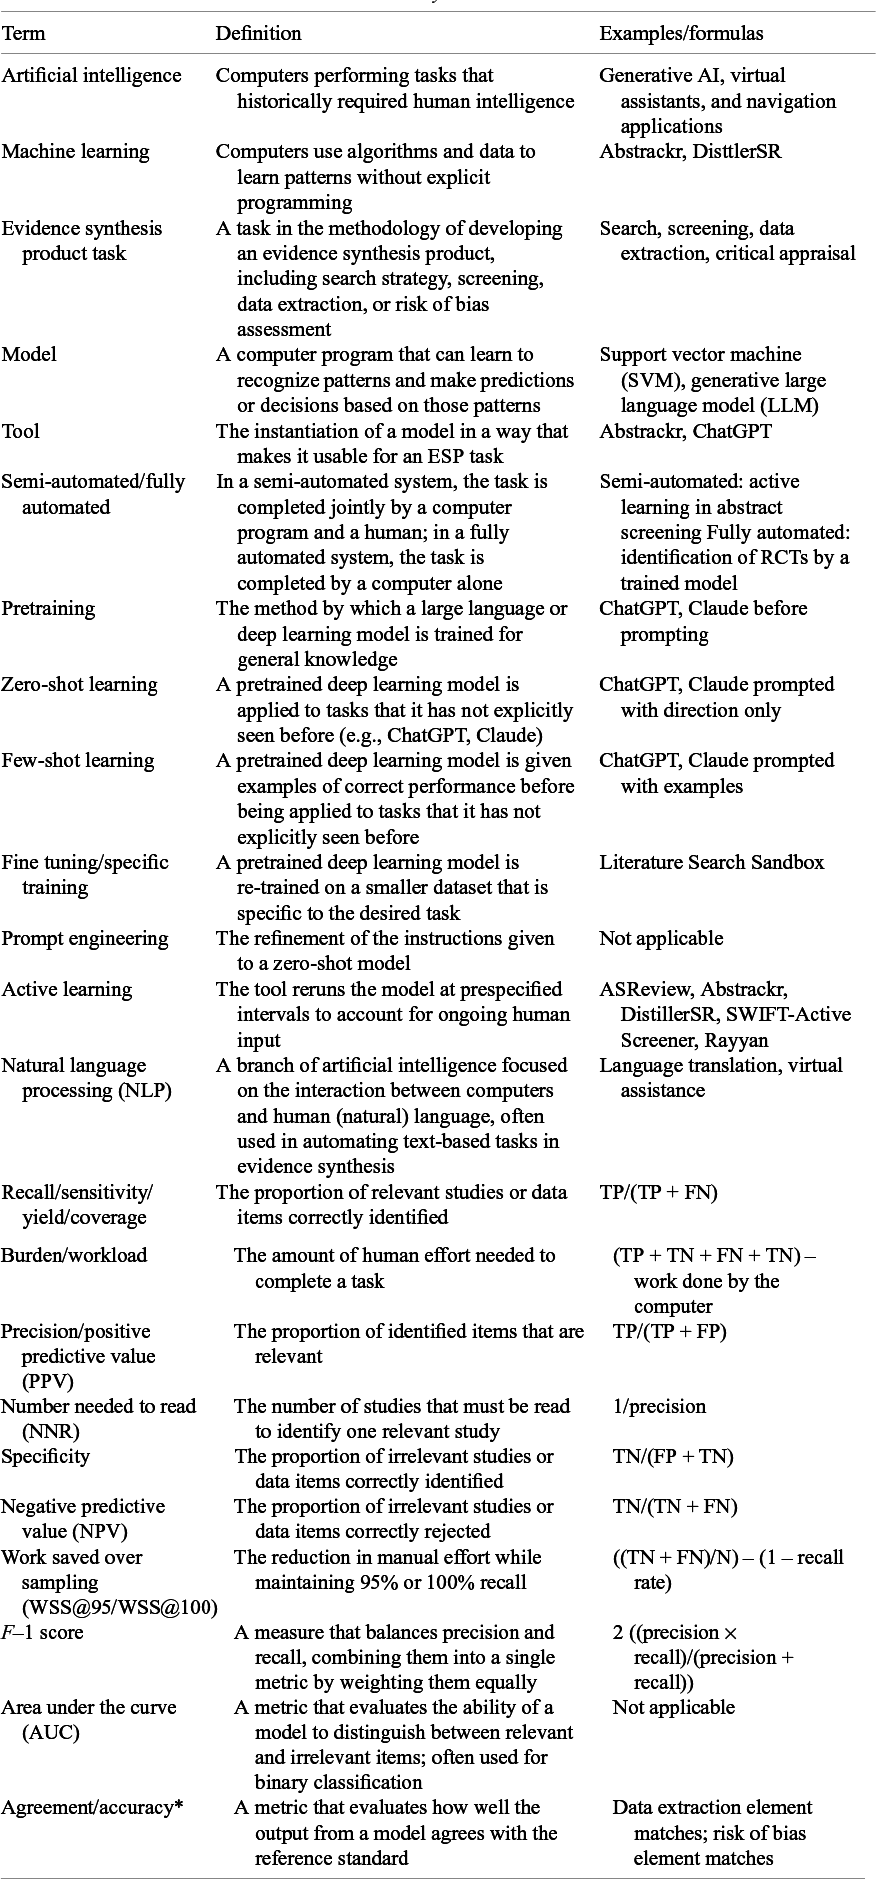
This review follows AHRQ EPC Program methodology combined with rapid review methods. We published the protocol and full report on the AHRQ website.14, 15 To manage scope and resources, we adapted standard evidence synthesis methods by (1) limiting the scope to tools used in the most common EPC ESP tasks, (2) relying on existing evidence synthesis for studies published before 2021, (3) leveraging ML to restrict the number of abstracts that must be manually screened, (4) using single data extraction with verification by a second reviewer, rather than the typical double data extraction process, and (5) not assessing of the risk of bias (RoB) or methodological quality of the included studies. Table 1 outlines vocabulary used commonly in this report that may not be immediately intuitive.
Vocabulary used in this review

Table 1. Long description
The table is organized into three columns: Term, Definition, and Examples/formulas.
* Artificial intelligence: Computers performing tasks requiring human intelligence. Examples: Generative A I, virtual assistants.
* Machine learning: Algorithms learning patterns without explicit programming. Examples: Abstrackr, Distiller S R.
* Evidence synthesis product task: Methodology tasks like search, screening, or data extraction.
* Model: Program learning patterns for predictions. Examples: S V M, L L M.
* Tool: Instantiation of a model for an E S P task. Examples: Abstrackr, Chat G P T.
* Semi-automated/fully automated: Tasks completed jointly by human and computer or computer alone.
* Pretraining: Training for general knowledge. Examples: Chat G P T, Claude.
* Zero-shot learning: Applying pretrained models to unseen tasks. Examples: Chat G P T, Claude with direction only.
* Few-shot learning: Pretrained models given examples before tasks. Examples: Chat G P T, Claude with examples.
* Fine tuning/specific training: Re-training on smaller, specific datasets. Example: Literature Search Sandbox.
* Prompt engineering: Refinement of instructions for zero-shot models.
* Active learning: Tool reruns model based on human input. Examples: A S Review, Rayyan.
* Natural language processing (N L P): A I focused on human language interaction.
* Recall/sensitivity/yield/coverage: Proportion of relevant items identified. Formula: T P all over (T P plus F N).
* Burden/workload: Human effort needed. Formula: (T P plus T N plus F N plus T N) minus work done by computer.
* Precision/positive predictive value (P P V): Proportion of identified items that are relevant. Formula: T P all over (T P plus F P).
* Number needed to read (N N R): Studies read to find one relevant study. Formula: 1 over precision.
* Specificity: Proportion of irrelevant items correctly identified. Formula: T N all over (F P plus T N).
* Negative predictive value (N P V): Proportion of irrelevant items correctly rejected. Formula: T N all over (T N plus F N).
* Work saved over sampling (W S S at 95/W S S at 100): Reduction in manual effort. Formula: ((T N plus F N) over N) minus (1 minus recall rate).
* F-1 score: Balanced measure of precision and recall. Formula: 2 times ((precision times recall) over (precision plus recall)).
* Area under the curve (A U C): Ability to distinguish between relevant and irrelevant items.
* Agreement/accuracy: How well model output matches a reference standard.
ESP = evidence synthesis product; FN = false negatives; FP = false positives; SR = systematic review; TN = true negatives; TP = true positives; * Specific definitions vary by study and are captured in the full data extraction tables in the Supplementary Material.
2.2. Eligibility criteria
We included English-language primary studies evaluating publicly available AI tools that automate or semi-automate one or more evidence synthesis tasks. “Publicly available” was defined as commercially available (whether free or by subscription) or having code available through a public repository (e.g., GitHub); we did not require tools to be free of charge. Tools were defined as systems, methods, models, applications, software, or packages that use AI/ML/NLP to automate or semi-automate tasks. We categorized tools by evidence synthesis task, using a prespecified taxonomy. Core tasks included: (1) question/PICO (i.e., study eligibility criteria) development; (2) protocol/scoping; (3) search and retrieval (including deduplication); (4) study design identification; (5) title/abstract screening; (6) full-text screening; (7) study aggregation/linkage; (8) data extraction; (9) RoB assessment; and (10) synthesis, reporting, and writing support. Some tools spanned multiple tasks; the unit of analysis was the study-tool-task combination. Comparators included human performance, published review decisions, or alternative tools. Studies had to report quantitative performance (e.g., recall, precision, specificity, agreement/accuracy, workload/burden reduction; see Table 1 for definitions used). The full inclusion/exclusion criteria and search strategies are provided in the Supplementary Material.
2.3. Literature search strategy
To keep the scope of this project feasible, given time and resource limitations, studies published prior to 2021 were identified using existing SRs that, in combination, covered all included evidence synthesis tasks. We searched MEDLINE, Embase, and the Association of Computing Machinery Digital Library from January 1, 2021, through April 3, 2024, and conducted update searches on October 3, 2024, April 3, 2025, and October 15, 2025 (most recent update search). We searched the Cochrane Library for methodology reviews and hand-searched two journals not indexed in either bibliographic database: the Journal of the European Association for Health Information and Libraries and Cochrane Evidence Synthesis and Methods. To identify conference papers and preprints, primarily in the computer science literature, we searched bioRxiv and medRxiv through Embase and the Association of Computing Machinery (ACM) Digital Library. Search terms included terms for ESPs (e.g., SR, scoping review, evidence map) and ESP methodology (e.g., search, screening, data extraction); terms for ML and AI (e.g., machine learning, artificial intelligence, automation) and for specific known tools (e.g., RobotReviewer, DistillerSR, ChatGPT); and terms for evaluation (e.g., evaluation, workload, recall). Studies were limited to those available in English. Search strategies for all databases were developed by two experienced medical librarians, with one conducting primary development and the second reviewing them against the Peer Review of Electronic Search Strategies (PRESS) checklist.Reference McGowan, Sampson, Salzwedel, Cogo, Foerster and Lefebvre16
2.4. Living review management
Searches are updated every six months until fewer than five new eligible studies are identified in the 6-month interval. Each update will generate (1) an updated PRISMA flow diagram, (2) an updated evidence map, and (3) a dated changelog summarizing new studies, newly evaluated tools/tasks, and any changes to methods. All versions of the report, including future updates, can be found on the AHRQ website.15
2.5. Screening and data extraction
Abstract screening was streamlined using the Systematic Review Data Repository Plus (SRDR+) ML algorithm, which has since been discontinued. The functionality and content of SRDR+ have been migrated to the Veterans Affairs Data Repository Rutgers (VADRR), which we will use for future iterations. We performed manual double-screening with the algorithm reprioritizing the abstracts from most to least likely to be relevant once daily until the likelihood of relevance was below 0.1 for all studies, and 400 consecutive citations had been rejected by both screeners. For each update, we restarted this algorithm. To minimize the risk of potentially missing relevant studies of new technologies for ESP tasks due to the model not yet having learned that they are relevant, we tagged any such studies identified as “include.” Full-text screening was conducted by a single screener with verification by a second screener.
We extracted data into structured forms in Google Sheets, with the study-tool-task combination as the unit of analysis. For each included study, we extracted tool name, model details, platform availability and accessibility (e.g., open access, free with registration, subscription), automation method, training approach, evaluated tasks, testing methodology, and performance metrics. We created separate extraction forms for different task categories to accommodate varying descriptions and outcome measures. Key outcomes included recall (relevant items correctly identified), precision (proportion of identified items that are relevant), accuracy or percent agreement (correctly extracted or assessed items), and burden/workload reduction. When studies reported aggregated results, we used those values; otherwise, we calculated medians and ranges across ESPs. A second reviewer verified all extractions.
2.6. Data synthesis
Due to substantial heterogeneity in tasks, outcomes, and reported measures, meta-analysis was inappropriate. We synthesized findings qualitatively, organizing results by evidence synthesis task. For literature identification tools (search, study design classification, screening), we focused on recall, precision, and burden. For data extraction and RoB tools, we prioritized accuracy or percent agreement. For the remaining tools, we took the study-reported measures. We also documented reference standards and comparators from each study to provide context for tool performance interpretations; however, we did not critically appraise individual RoB or methodological quality or rate the strength of evidence.
To contextualize findings, we developed a tiered system to assign readiness for each ESP task. Four tiers were applied (ready for use with oversight; not yet ready for routine use but promising; not yet ready for use; or exploratory) and were based on three criteria: the number of studies available, the consistency of results across studies and tools, and whether the reported performance metrics met a minimum threshold for safe use in a production workflow (specifically, recall ≥95% for literature identification tasks, or percent agreement ≥70% for extraction and assessment tasks). Due to the wide range of performance and generally poor quality of studies, we do not believe that any task is ready for use without human oversight, and the readiness tiers give a sense but should not be interpreted as prescriptive.
3. Results
3.1. Literature identification
The database searches, combined with hand-searching existing SRs, yielded 10,968 citations through October 15, 2025. After abstract screening, 448 articles have undergone full-text assessment and 134 studies have met inclusion criteria, reporting on tools for PICO development (n = 1), searching (n = 18), study design identification (n = 7), abstract screening (n = 62), full-text screening (n = 9), deduplication (n = 1), study aggregation (n = 2), data extraction (n = 23), RoB assessment (n = 19), data analysis (n = 4), and writing (n = 6). Some studies evaluated multiple tools or tasks. The literature flow diagram is presented in Figure 1.
Literature flow diagram. AI, artificial intelligence; ESP, evidence synthesis product; ML, machine learning.

Figure 1. Long description
The flowchart is organized into three vertical stages.
1. Identification Phase:
- Top left: Identification of new studies via databases and registers. Records identified from databases: 8458 from previous searches and 2360 from the last update in Oct. 2025.
- Top right: Identification of new studies via other methods. Records identified from previous systematic reviews: 137 from previous searches and 15 from the last update.
2. Screening Phase:
- Center: Records screened. Totaling 8595 from previous searches and 2375 from the last update.
- Right (Exclusion 1): Records excluded by humans. 3658 from previous searches and 2258 from the last update.
- Right (Exclusion 2): Records excluded by machine learning algorithm. 4606 from previous searches and 0 from the last update.
- Center: Full-text reports assessed for eligibility. 331 from previous searches and 117 from the last update.
- Right (Exclusion 3): Reports excluded with reasons. 236 from previous searches and 48 from the last update. Reasons include: No usable performance results (33), Not an E S P task (44), Not an available tool (27), Tested on a single review/dataset (52), Not an A I / M L tool (17), No full-text paper available (101), Duplicate (2), Not in the human biomedical domain (7), and Retracted publication (1).
3. Included Phase:
- Bottom center: Studies included in review. 95 from previous searches and 39 from the last update.
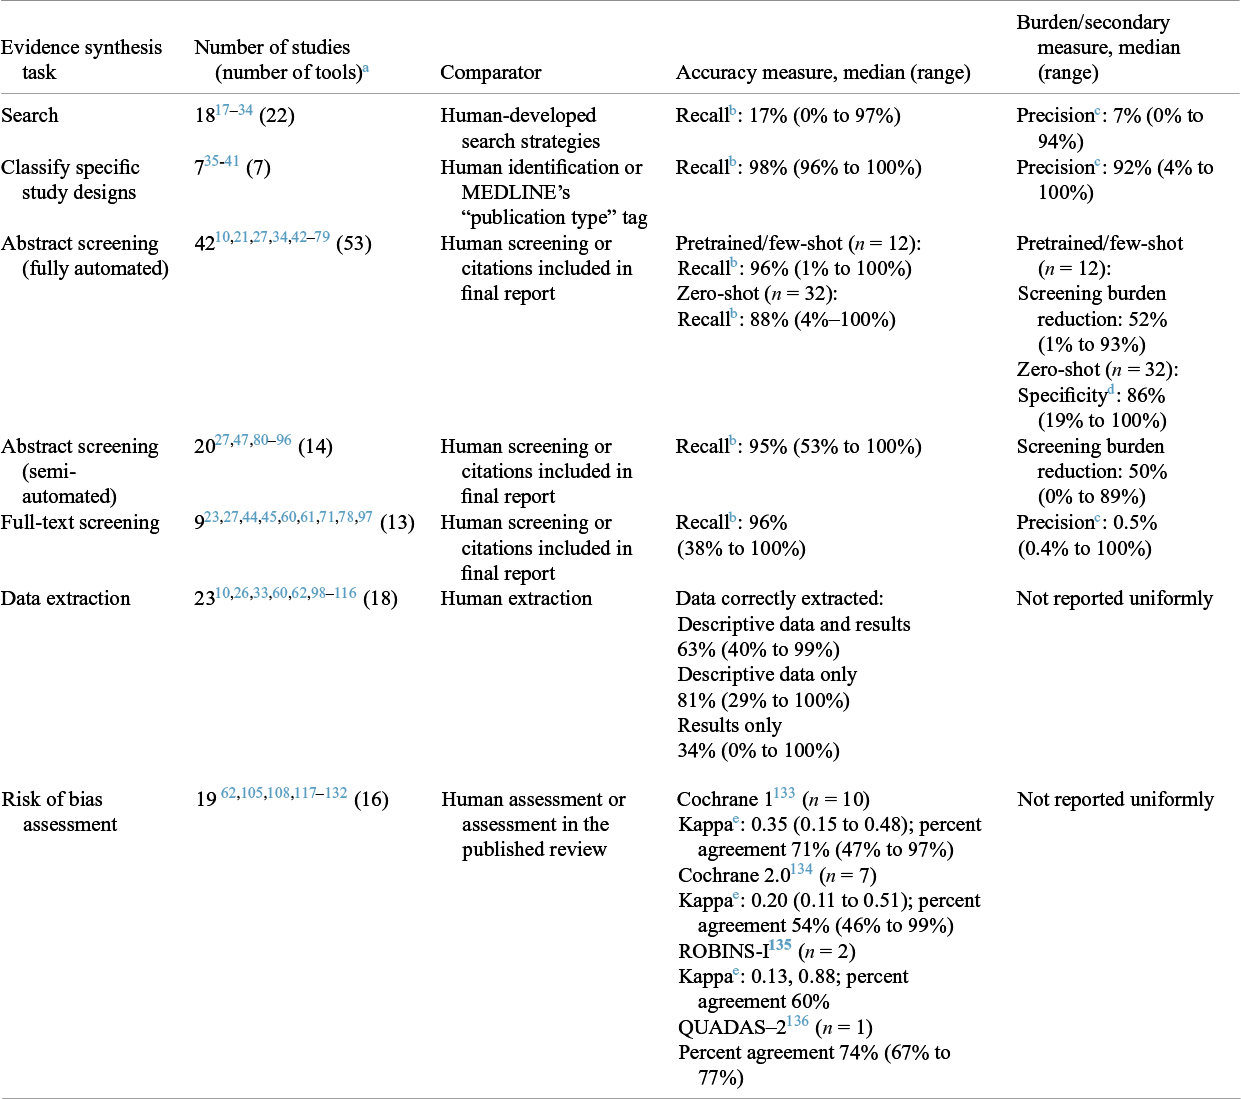
Results are summarized in Table 2 for ESP tasks evaluated by more than three studies. Detailed performance results for all ESP tasks are described narratively. The fully extracted data are provided in the Supplementary Material. In most cases, the reference standard for search and screening tools was the citations reported as meeting inclusion criteria in the previously published SR. The reference standard for data extraction and RoB assessment was either the extracted data or the RoB judgments in the published SR, or manual extraction.
Tool performance summary by ESP task

Table 2. Long description
The table consists of five columns: Evidence synthesis task, Number of studies (number of tools), Comparator, Accuracy measure, median (range), and Burden/secondary measure, median (range).
* Search: 18 studies (22 tools). Comparator: Human-developed search strategies. Recall: 17% (0% to 97%). Precision: 7% (0% to 94%).
* Classify specific study designs: 7 studies (7 tools). Comparator: Human identification or MEDLINE's publication type tag. Recall: 98% (96% to 100%). Precision: 92% (4% to 100%).
* Abstract screening (fully automated): 42 studies (53 tools). Comparator: Human screening or citations in final report. Pretrained/few-shot (n = 12) Recall: 96% (1% to 100%); Zero-shot (n = 32) Recall: 88% (4% to 100%). Burden measures: Pretrained/few-shot screening reduction 52%; Zero-shot Specificity 86%.
* Abstract screening (semi-automated): 20 studies (14 tools). Comparator: Human screening or citations in final report. Recall: 95% (53% to 100%). Screening burden reduction: 50% (0% to 89%).
* Full-text screening: 9 studies (13 tools). Comparator: Human screening or citations in final report. Recall: 96% (38% to 100%). Precision: 0.5% (0.4% to 100%).
* Data extraction: 23 studies (18 tools). Comparator: Human extraction. Accuracy: Descriptive and results 63%; Descriptive only 81%; Results only 34%. Burden: Not reported uniformly.
* Risk of bias assessment: 19 studies (16 tools). Comparator: Human assessment. Accuracy measures vary by tool: Cochrane 1 (n = 10) Kappa 0.35; Cochrane 2.0 (n = 7) Kappa 0.20; R O B I N S - I (n = 2) Kappa 0.13, 0.88; Q U A D A S - 2 (n = 1) Percent agreement 74%. Burden: Not reported uniformly.
Abbreviations: LLM = large language model; n = number of studies; QUADAS-2 = Quality Assessment of Diagnostic Accuracy Studies 2; ROBINS-I = Risk Of Bias In Non-randomized Studies—of Interventions; QUADAS-2 = Quality Assessment of Diagnostic Accuracy Studies 2.
a Some studies addressed more than one task. This table includes tasks for which there were at least four studies that could be combined in a meaningful way. Not included are tools for PICO/key question development,Reference Demir, Süküt, Duran, Topsakal and Görgülü137 deduplication,Reference Borissov, Haas and Minder138 study colocation,Reference Shao, Adams and Cohen139, Reference Smalheiser and Holt140 identification of empirical studies,Reference Langlois, Nie, Thomas, Hong and Pluye141 identification of diagnostic accuracy studies,Reference Kataoka, So and Banno142 data analysis,Reference Kim, Chua, Li, Rickard and Lorenzo105, Reference Pradhan, Hoaglin, Cornell, Liu, Wang and Yu112, Reference Reason, Benbow, Langham, Gimblett, Klijn and Malcolm113, Reference Goyal, Tariq and Ahsan143 and writing.Reference Meliante, Coco, Rabiolo, De Cillà and Manni26, Reference Reason, Benbow, Langham, Gimblett, Klijn and Malcolm113, Reference Passby, Madhwapathi, Tso and Wernham144– Reference Ovelman, Kugley, Gartlehner and Viswanathan147
b Recall is the percentage of relevant citations that are correctly identified.
c Precision is the percentage of identified citations that are relevant.
d Specificity is the percentage of citations that are correctly rejected.
e Kappa refers to Cohen’s Weighted Kappa, a measure of inter-rater reliability.
3.2. Search tools
Eighteen studiesReference Adam, DeYoung and Paul17– Reference Yao, Lopez, Rizk, Aggarwal and Namdari34 evaluated tools that use deep learning or LLMs to automate or semi-automate the search process. Figure 2 shows the performance of the tools that either generated a search strategy or returned a list of relevant citations. The reference standard for all studies was the confirmation that the citations produced were included in the published SR. Where reported, the median recall for human-generated queries was 88% (range, 65% to 100%), and the median precision was 2.0% (range, 1.7% to 2.2%; median number needed to read [NNR] 50).Reference Adam, DeYoung and Paul17, Reference Adam, Pappas, Papageorgiou, Evangelou and Trikalinos18, Reference Pourreza and E29, Reference Wang, Scells, Koopman and Zuccon32
Recall was generally poor (median 17%, range 0% to 97%), although some studies reported better recall with very detailed prompting strategies (recall 74% to 91%),Reference Dogra, Arabshahi and Wei21, Reference Yao, Lopez, Rizk, Aggarwal and Namdari34 or human-in-the-loop methods, in which the human edited the final query before it was run (recall 80%).Reference Kallmes, Thurnham, Sauca, Tarchand, Kallmes and Holub23 Precision was highly variable, ranging from 0.2% to 94% (NNR 1 to 500).
We also included studies that reported literature identification tasks other than search strategy development or retrieval. One study reported on a tool to remove duplicate citations found from different databases, achieving an average recall of 99.5% and average precision of 100%.Reference Borissov, Haas and Minder138 Two other studies reported on a single web-based tool to aggregate multiple reports of the same study; performance ranged from 91% to 100% for grouping papers from the same trial and from 86% to 94% for differentiating distinct studies.Reference Shao, Adams and Cohen139, Reference Smalheiser and Holt140
3.3. Study design identification tools
Seven studies reported on tools to identify randomized controlled trials (RCTs).Reference Cohen, Smalheiser and McDonagh35– Reference Windisch, Dennstädt and Koechli41 Most tools used supervised learning, trained on large pre-labeled datasets. Performance was consistently strong, with median recall ranging from 96% to 100% across tools and median precision from 4% to 100%.
One study evaluated a variety of models to identify empirical studies; the naïve Bayes model had the best recall (98%) with a precision of 50%.Reference Langlois, Nie, Thomas, Hong and Pluye141 Another study evaluated two versions of ChatGPT (3.5 Turbo and 4) to identify diagnostic test accuracy studies, with recall ranging from 89% to 96% and specificity from 41% to 70%.Reference Kataoka, So and Banno142 A third reported that PubMedBERT classified a median of 81% of studies as having the correct design (range, 57% to 100%).Reference Sugiura, Saegusa and Jin148
Performance of search tools by publication year. The bars represent the recall of the search tools; colors reflect how the underlying model was trained. Bars indicating tools that were trained or fine-tuned are shown in distinct shades (numbers reflect the size of the dataset used to train each model); bars for tools that used few-shot training as part of the prompt and bars for tools that used zero-shot learning are shown in separately distinguishable colors. Circles indicate precision where reported. Dashed lines represent median human recall and precision from the studies in which they were reported.

Figure 2. Long description
A bar chart titled Search with the y-axis labeled Recall or Precision as a proportion from 0.00 to 1.00. The x-axis lists specific studies and models chronologically from left to right.
Two horizontal dashed lines represent human benchmarks. The top line at approximately 0.88 is labeled Manual recall. The bottom line at approximately 0.02 is labeled Manual precision.
Data is categorized by training data type in the legend.
- Brown bar (958835 samples): Pourreza 2023 B A R T or B E R T or Bio B E R T shows recall near 0.95.
- Green bar (10000 samples): Adam 2024 Mistral shows recall near 0.85.
- Purple bars (few shot): Concentrated in late 2024 and 2025, including Wang S 2025 G P T 4 and G P T 3.5, with recall values ranging from 0.40 to 0.65.
- Blue bars (zero shot): The most frequent category, showing highly variable recall. Notable peaks include Dogra 2025 Gemini Deep Research at 0.75, Kallmes 2025 Open A I Deep Research at 0.80, and Yao 2025 G P T 4 which reaches approximately 0.90.
Black circles represent precision. Most precision values are low, clustered near the Manual precision line. However, Dogra 2025 models and Lau 2025 G P T 3 show significant precision spikes reaching between 0.40 and 0.95.
3.4. Abstract screening tools
3.4.1. Fully automated screening
Forty-two studies evaluated 53 LLM-based tools to fully automate abstract screening.Reference Li, Datta and Rastegar-Mojarad10, Reference Adam, Pappas, Papageorgiou, Evangelou and Trikalinos18, Reference Akinseloyin, Jiang and Palade42, Reference Cao, Sang and Arora44– Reference Dai, Wang and Shen48, Reference Delgado-Chaves, Jennings and Atalaia50– Reference Issaiy, Ghanaati and Kolahi58, Reference Khraisha, Put, Kappenberg, Warraitch and Hadfield60, Reference Lerner, Créquit, Ravaud and Atal63– Reference Oami, Okada and Nakada66, Reference Sanghera, Thirunavukarasu and El Khoury69, Reference Strachan70, Reference Tran, Gartlehner and Yaacoub73– Reference Wang, Scells, Koopman, Potthast and Zuccon75, Reference Zhan, Suvada and Xu78, Reference Brockmeier, Ju, Przybyła and Ananiadou82, Reference Chai, Lines, Gucciardi and Ng83, Reference Hamel, Kelly, Thavorn, Rice, Wells and Hutton85– Reference Rathbone, Hoffmann and Glasziou91, Reference Tsou, Treadwell, Erinoff and Schoelles93– Reference Janoudi, Uzun, Jurdana and Hutton97, Reference Chan, Abad, Dibart and Kernitsky149– Reference Pham, Jovanovic and Bagheri151 Results varied across studies and models (Figure 3), likely reflecting differences in prompting strategies and study designs. Nevertheless, overall average performance showed potential, with median recall of 88% (range, 4% to 100%) and a median specificity of 86% (range, 19% to 100%). Tools that used a combination of models performed better and more consistently than most individual models (80% to 98% recall; data not shown). Three studies evaluated few-shot training for LLMs in abstract screening, using a variety of LLMs.Reference Tao, Li, Yisha, Yang, Zhan and Sun71, Reference Teperikidis, Trampoukis and Polymenakos72, Reference Zhang, Momeni Nezhad and Gupta79 They reported better results than the zero-shot models, with recall ranging from 75% to 100% (median 99%), and precision ranging from 97% to 98%.
3.4.2. Semi-automated screening
Twenty studies evaluated active learning tools that regularly update models based on ongoing human input.Reference Moens, Nagels, Wake and Goudman27, Reference Chen, Jiang and Liu47, Reference Akinseloyin, J and Palade80– Reference Yamada, Yoneoka and Hiraike96 These tools achieved a median recall of 95% (range, 53% to 100%) while reducing screening burden by approximately 50% (range, 0% to 89%). Performance varied by review topic, suggesting that some review topics and types are better suited to semi-automation than others. For example, reviews with clear population and intervention criteria (such as tympanostomy tubes for otitis media) have models that converge quickly, while more amorphous topics (such as pharmacological adherence in mental health) converge more slowly, if at all. One study evaluated stopping rules using ASReview, finding that current heuristics achieved inadequate recall (66% to 82%) despite substantial reductions in burden, with performance dependent on the prevalence of relevant articles.
3.5. Full-text screening tools
Nine studies evaluated LLMs for full-text screening,Reference Kallmes, Thurnham, Sauca, Tarchand, Kallmes and Holub23, Reference Moens, Nagels, Wake and Goudman27, Reference Cao, Sang and Arora44, Reference Cao, Sang and Arora45, Reference Khraisha, Put, Kappenberg, Warraitch and Hadfield60, Reference Kim and Yoon61, Reference Tao, Li, Yisha, Yang, Zhan and Sun71, Reference Zhan, Suvada and Xu78, Reference Janoudi, Uzun, Jurdana and Hutton97 reporting a median recall of 96% (range, 38% to 100%) and precision of 0.5% (range, 0.4% to 100%; NNR median 200, range 1 to 250).
Recall of LLMs for fully automating abstract screening, by model and publication year. The dots and lines in this figure represent the median and range of recalls across studies, for each model in classifying citations as relevant or irrelevant; the colors represent the model family, and the size of dots indicates the number of studies evaluated. Models evaluated in a single study do not have range bars.

Figure 3. Long description
A dot plot titled Sensitivity by L L M model and family. The horizontal X-axis measures Sensitivity percentage from 0 to 100. The vertical Y-axis lists specific models grouped by family.
* Claude family: Models like 3.7 Sonnet and 3.5 Sonnet cluster at the high end, between 80 and 100 percent.
* Deepseek family: Deepseek-R 1-Distill and Deepseek-3 show high sensitivity near 80 to 100 percent.
* Gemini family: Models including 1.0-pro and 1.5 Flash are concentrated between 75 and 100 percent.
* Gemma family: Gemma-2 shows a wide range bar extending from approximately 30 to 100 percent, with a median near 65 percent.
* G P T family: This large group shows high variance. G P T-4 and G P T-4o have large dots indicating many studies, with medians around 80 percent and ranges spanning from 40 to 100 percent. G P T-3.5 Turbo and Scholar G P T are outliers with lower sensitivity near 20 percent.
* L L a M A family: L L a M A-3.1 and L L a M A-3 show extremely wide range bars spanning from 5 to 95 percent.
* Other family: A diverse group including Mistral, Grok, and Qwen. Most models in this category cluster tightly between 80 and 100 percent, though Mistral and Google Pa L M 2 show lower medians near 60 percent.
A legend at the bottom indicates that dot size represents the number of studies n, ranging from 2 to 12. Colors correspond to the seven model families mentioned.
3.6. Data extraction tools
Twenty-three studies evaluated 18 tools for extracting study data, with most studies evaluating zero-shot LLMs with varying prompting strategies.Reference Li, Datta and Rastegar-Mojarad10, Reference Meliante, Coco, Rabiolo, De Cillà and Manni26, Reference Wang S and Jin33, Reference Khraisha, Put, Kappenberg, Warraitch and Hadfield60, Reference Lee, Paek and Ofoegbu62, Reference Bianchi, Hirt, Vogt and Vetsch98– Reference Yun, Pogrebitskiy, Marshall and Wallace116 Performance varied substantially by extraction task and tool type, with extraction of descriptive information performing better and more consistently compared with extraction of quantitative results. For combined descriptive data and results extraction, median accuracy was 63% (range, 40% to 99%). For descriptive data only, median accuracy improved to 81% (range, 29% to 100%). For results extraction only, performance was poor, with a median accuracy of 34% (range, 0% to 100%).
There were mixed findings on whether fine-tuning prompts improved accuracy. One study evaluated an LLM fine-tuned on the extractions from 262 relevant articles, achieving 56% accuracy across arm descriptions, outcomes, and results extractions, suggesting that fine-tuning may not improve performance for this task.Reference Panayi, Ward, Benhadji-Schaff, Ibanez-Lopez, Xia and Barzilay111 However, another study compared fully automated versus semi-automated workflows and reported that the semi-automated approach was slightly more accurate (98% versus 95%).Reference Lai, Liu and Bai108
3.7. Risk of bias assessment tools
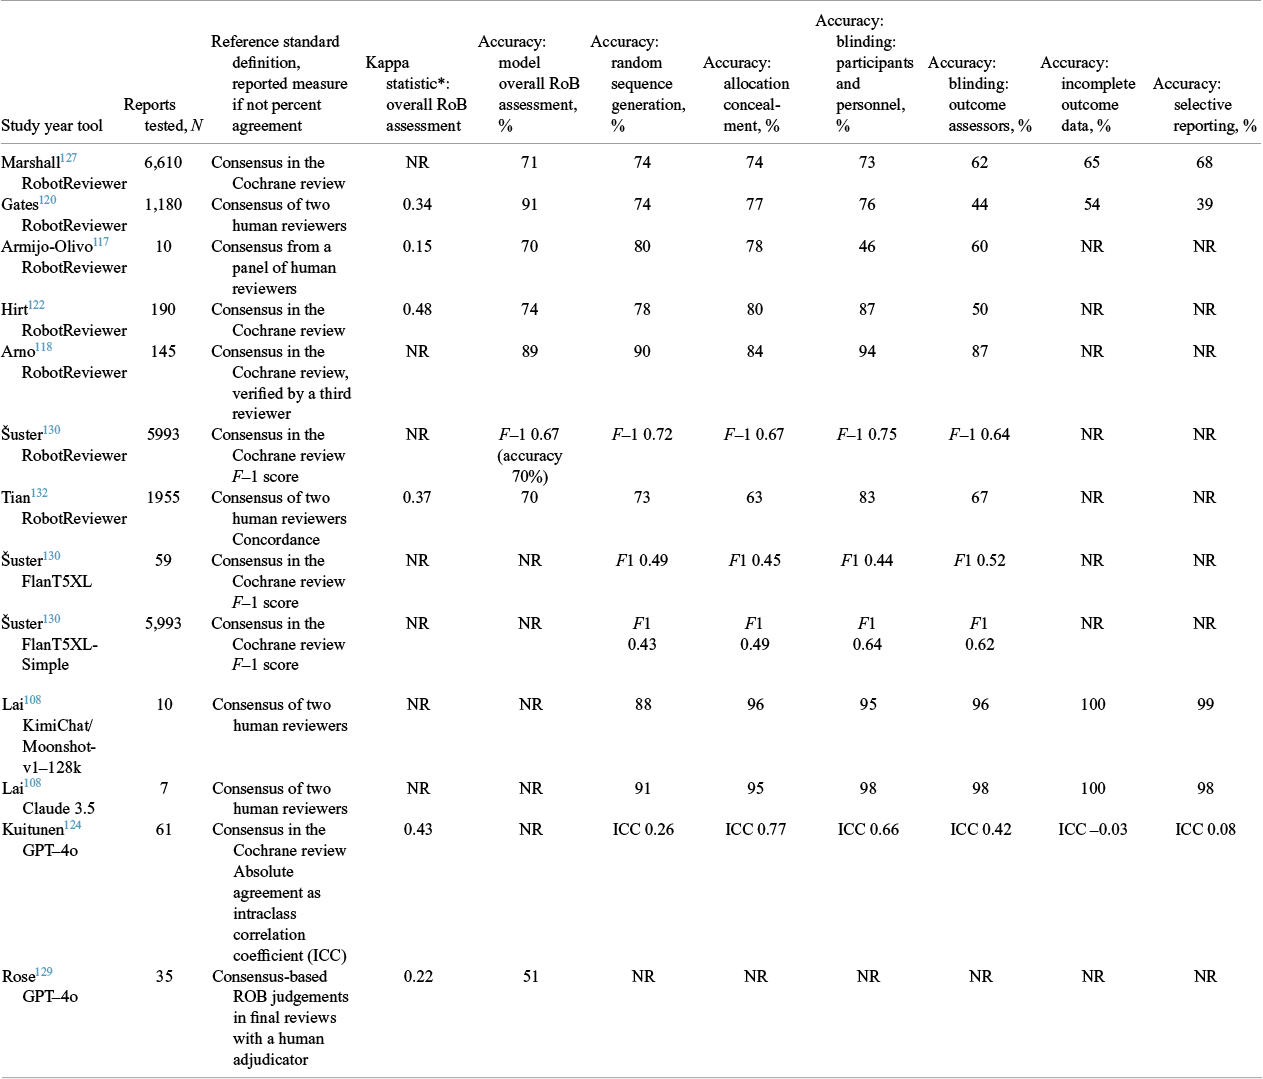
Eleven studies evaluated tools to assess RoB, and results varied widely based on the assessment tool chosen and model implemented. The most commonly reported tool the studies evaluated was the original Cochrane RoB tool.Reference Higgins, Altman and Gøtzsche133 Table 3 presents overall and domain-specific results of these studies. Seven studiesReference Armijo-Olivo, Craig and Campbell117, Reference Arno, Thomas, Wallace, Marshall, McKenzie and Elliott118, Reference Gates, Vandermeer and Hartling120, Reference Hirt, Meichlinger, Schumacher and Mueller122, Reference Marshall, Kuiper and Wallace127, Reference Šuster, Baldwin and Verspoor130, Reference Tian, Yang and Doi132 assessed RobotReviewer, a support vector machine-based tool trained on over 12,000 Cochrane reviews. RobotReviewer demonstrated a median agreement of 71% with human assessments for overall RoB (range, 70% to 91%). Domain-specific performance varied, with better accuracy for randomization (73% to 90%) and allocation concealment (63% to 84%) than for blinding of participants (46% to 94%) or blinding of outcome assessors (44% to 87%). Four studies evaluated LLMs on the original Cochrane tool,Reference Kuitunen, Nyrhi and De Luca124, Reference Lai, Ge and Sun125, Reference Rose, Bidonde and Ringsten129, Reference Šuster, Baldwin and Verspoor130 with inconsistent results.
Performance of RobotReviewer and LLM-based tools to assess risk of bias using the Cochrane RoB assessment tool

Table 3. Long description
The table consists of 11 columns: Study year tool, Reports tested (N), Reference standard definition, Kappa statistic, and Accuracy percentages for overall R o B, random sequence generation, allocation concealment, blinding of participants, blinding of outcome assessors, incomplete outcome data, and selective reporting.
Key data points include:
* Marshall, RobotReviewer: 6,610 reports, 71 percent overall accuracy, with domain accuracies ranging from 62 to 74 percent.
* Gates, RobotReviewer: 1,180 reports, 0.34 Kappa, 91 percent overall accuracy.
* Šuster, RobotReviewer: 5,993 reports, F-1 score of 0.67 (70 percent accuracy).
* Lai, KimiChat: 10 reports, showing high accuracy across domains (88 to 100 percent).
* Lai, Claude 3.5: 7 reports, showing high accuracy across domains (91 to 100 percent).
* Kuitunen, G P T 4o: 61 reports, 0.43 Kappa, with I C C values ranging from -0.03 for incomplete outcome data to 0.77 for allocation concealment.
* Rose, G P T 4o: 35 reports, 0.22 Kappa, 51 percent overall accuracy.
Other entries for RobotReviewer (Armijo-Olivo, Hirt, Arno, Tian) and Flan T 5 X L variants show varying levels of accuracy and F-1 scores. N R indicates data not reported for specific domains.
* Cohen’s weighted kappa coefficient (κ) for ordinal data. Kappa statistic and overall performance are as compared to reference standard.
Abbreviations: ICC = intraclass correlation coefficient; NR = not reported; RoB = risk of bias
Seven studies evaluated zero-shot LLMs using the Cochrane RoB 2.0 tool,Reference Sterne, Savović and Page134 reporting a median kappa of 0.20 (range, 0.11 to 0.51) and median accuracy of 54% (range, 46% to 90%). Two studies evaluated LLM RoB assessment using ROBINS-IReference Sterne, Hernán and Reeves135 with inconsistent results (kappa 0.13 versus 0.88),Reference Lee, Paek and Ofoegbu62, Reference Hasan, Saadi and Rajjoub121 and one study evaluated LLM RoB assessment using QUADAS 2Reference Whiting, Rutjes and Westwood136 with a median accuracy of 74% (range, 67% to 77%).Reference Leucuța, Urda-Cîmpean, Istrate and Drugan126
3.8. Analysis and writing tools
Three studies explored the use of LLMs to analyze and summarize data. When given the correct data, the studies found that ChatGPT can calculate meta-analytic results that are close to those calculated by humans in the original reviews (within 0.02 to 0.05 for the point estimate).Reference Kim, Chua, Li, Rickard and Lorenzo105, Reference Reason, Benbow, Langham, Gimblett, Klijn and Malcolm113, Reference Goyal, Tariq and Ahsan143
Six studies of LLMs addressed writing tasks.Reference Meliante, Coco, Rabiolo, De Cillà and Manni26, Reference Reason, Benbow, Langham, Gimblett, Klijn and Malcolm113, Reference Passby, Madhwapathi, Tso and Wernham144– Reference Ovelman, Kugley, Gartlehner and Viswanathan147 The studies each used different assessment measures and criteria; thus, it is not possible to synthesize findings across studies, except to note that overall performance was good for summarization, with some limitations in accuracy and comprehensiveness.
4. Discussion
4.1. Principal findings
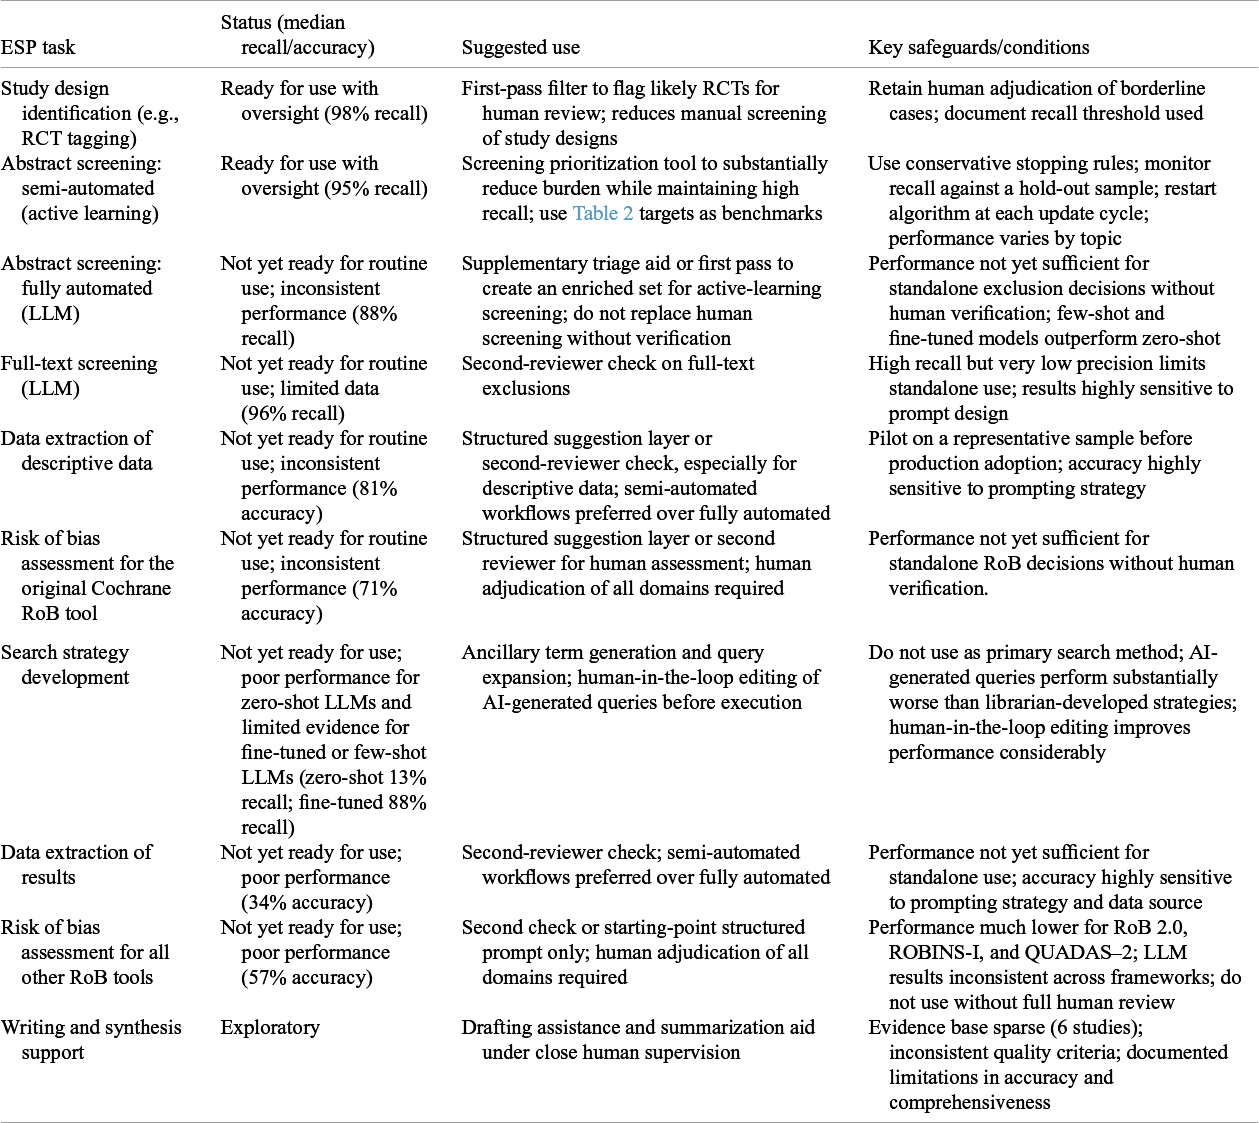
This living rapid review of 134 studies demonstrates that AI/ML tools have been developed and evaluated for nearly every evidence synthesis task but with variable performance and readiness for implementation. Table 4 lists tasks in order from most ready to least. Tools for identifying specific study designs, particularly RCTs, demonstrate sufficient accuracy for routine use with appropriate human oversight. Semi-automated abstract screening tools using active learning can reduce workload by approximately half while maintaining high recall, though performance varies by topic. Search automation tools require further development, though they may serve valuable ancillary roles. Data extraction and RoB assessment tools show promise but demonstrate inconsistent performance, likely reflecting differences in prompting strategies, evaluation methods, and task complexity.
Task-level readiness and implementation guidance for AI/ML tools in evidence synthesis

Table 4. Long description
The table is organized into four columns: E S P task, Status (median recall/accuracy), Suggested use, and Key safeguards/conditions.
* Study design identification (e.g., R C T tagging): Ready for use with oversight (98 percent recall). Suggested as a first-pass filter for human review. Safeguards: Retain human adjudication and document recall thresholds.
* Abstract screening (semi-automated active learning): Ready for use with oversight (95 percent recall). Suggested as a prioritization tool. Safeguards: Use conservative stopping rules and monitor against hold-out samples.
* Abstract screening (fully automated L L M): Not yet ready for routine use (88 percent recall). Suggested as a triage aid. Safeguards: Do not replace human screening; fine-tuned models perform better.
* Full-text screening (L L M): Not yet ready for routine use (96 percent recall). Suggested as a second-reviewer check. Safeguards: Limited by low precision and sensitivity to prompt design.
* Data extraction of descriptive data: Not yet ready for routine use (81 percent accuracy). Suggested as a structured suggestion layer. Safeguards: Pilot on representative samples first.
* Risk of bias assessment (original Cochrane R o B tool): Not yet ready for routine use (71 percent accuracy). Suggested as a suggestion layer. Safeguards: Human adjudication of all domains required.
* Search strategy development: Not yet ready for use (13 percent zero-shot recall; 88 percent fine-tuned recall). Suggested for term generation. Safeguards: Do not use as primary method; requires human-in-the-loop editing.
* Data extraction of results: Not yet ready for use (34 percent accuracy). Suggested as a second-reviewer check. Safeguards: Performance insufficient for standalone use.
* Risk of bias assessment (all other R o B tools): Not yet ready for use (57 percent accuracy). Suggested as a starting-point prompt. Safeguards: Performance lower for R o B 2.0, R O B I N S dash I, and Q U A D A S dash 2.
* Writing and synthesis support: Exploratory status. Suggested for drafting assistance. Safeguards: Evidence base is sparse with only 6 studies.
Abbreviations: LLM = large language model; RCT = randomized controlled trial; RoB = risk of bias.
4.2. Methodological considerations
4.2.1. Evaluation heterogeneity
A critical limitation of the evidence base is the lack of standardized evaluation approaches. Studies varied in reference standards, performance metrics, reporting methods, and evaluation contexts. Even studies assessing the same tool often used it differently or evaluated it on different tasks. This heterogeneity precludes meaningful quantitative synthesis and limits generalizability. For LLMs, performance is highly sensitive to prompt engineering. Additionally, results from one evaluation may not generalize to other implementations, even using the same base model. This challenge is compounded by the rapid evolution of AI technologies, with newer versions potentially offering substantially different performance.
4.2.2. Reference standards
Most studies used human-generated labels or final included studies from published reviews as reference standards. However, humans are imperfect, with documented inconsistencies in screening decisions, data extraction, and RoB assessments.Reference Gartlehner, Kugley and Crotty101, Reference Haywood, Hargreaves, White and Lamb152, Reference Jardim, Rose, Ames, Echavez, Van de Velde and Muller153 This creates challenges in interpreting tool performance. Future research should consider developing consensus-based reference standards or acknowledging and quantifying human variability.
4.2.3. Reproducibility
Reproducibility represents a significant concern, particularly for LLMs. Model updates, prompt variations, and application programming interface (API) changes can all affect performance. Evidence synthesis projects using AI tools may not be exactly reproducible, raising questions about transparency and verification. Careful documentation of model versions, prompts, and parameters is essential. A recent review found poor reporting of methods for studies that used ML or ML-enabled tools across several ESP tasks.Reference Scotti, Young, Gainey and Lan154
4.3. Implications for practice
The appropriate level of AI involvement in ESP tasks could be determined by the evidence available. The authors suggest that a readiness gradient could be applied across ESP tasks, which would include three tiers: (1) ready for use with human oversight or review; (2) promising, but to be used in parallel with human effort; (3) exploratory pending stronger and consistent evidence. Table 4 presents ESP tasks readiness based on the evidence found, along with suggested use and considerations. Tools used to identify study designs and to assist with abstract screening prioritization maintain the strongest evidence for readiness of use. Tools, including LLMs, for screening, data extraction, or assisting with RoB assessment showed inconsistent performance, but remain promising areas of use. Other ESP tasks have limited evidence to support their readiness of use. In future iterations, as tools continue to evolve, we anticipate that some tools not yet ready for use will become ready for use under oversight. Moreover, the notation that a tool is not ready for use should not dissuade reviewers from experimenting with it in their reviews; however, they should ensure that these tools are used with human oversight.
Across all tasks, tool selection should prioritize workflow integration (audit trails, version control, and reproducible prompt documentation), transparency, and institutional governance requirements around data privacy and security. Because many of the tools evaluated share underlying models, differences in benchmark performance may reflect implementation choices rather than the inherent superiority of one tool over another. A tool embedded thoughtfully into an existing workflow is likely to deliver more reliable efficiency gains than one chosen solely on published accuracy figures. Finally, different model versions perform differently, based on the size of the model, its recency, and other related factors.
4.4. Implications for research
The most pressing research gap is the near absence of prospective workflow integration studies that include more than one SR. Most existing research evaluates tools against a static reference standard in isolation, leaving unanswered the questions investigators care about most: how do tools perform when embedded in a real production workflow, who bears responsibility for errors they introduce, and how does performance change with different review topics and across update cycles? Filling this gap requires prospective evaluations under realistic production conditions, error-analysis studies, and head-to-head workflow comparisons.
Specific operational questions remain unresolved even for the tasks with the most implementation-ready tools. For semi-automated screening, current stopping heuristics achieve inadequate recall (66%–82%) despite substantial burden reduction; validated, evidence-based stopping rules that account for topic complexity and relevant article prevalence are urgently needed. For data extraction, it is unclear whether standardized prompting frameworks can generalize across review topics, or whether task-specific fine-tuning will prove necessary. For RoB assessment, developing labeled training datasets for newer frameworks (RoB 2.0, ROBINS-I, QUADAS-2) would likely accelerate progress more than continued zero-shot LLM evaluation.
Research and development on multi-task pipeline fine-tuning would further advance the field. Tools that span consecutive ESP tasks (e.g., searching and screeningReference Adam, Pappas, Papageorgiou, Evangelou and Trikalinos18 or extraction-to-meta-analysis pipelinesReference Pradhan, Hoaglin, Cornell, Liu, Wang and Yu112, Reference Reason, Benbow, Langham, Gimblett, Klijn and Malcolm113) could compound efficiency gains across the full workflow. The consistently superior performance of fine-tuned and few-shot models over zero-shot LLMs across tasks suggests that investing in task-specific training datasets is likely to provide more durable improvements than continued prompt optimization of general-purpose models. Tools that span all ESP tasks are emerging and warrant evaluation of performance for each task.
Finally, the field urgently needs standardized evaluation and reporting frameworks. Studies should document training and fine-tuning procedures, exact prompts and parameters, reference standard definitions and their limitations, and performance metrics in a form that enables cross-study comparison. For literature identification, recall paired with a workload measure (e.g., number needed to read or absolute screening reduction) is the most interpretable and investigator-preferred outcome.Reference Adam155 Consensus on preferred metrics for data extraction, risk of bias assessment, and writing tasks has not yet been established. The 2025 guidance from the Responsible use of AI in Evidence SynthEsis initiative (RAISE)Reference Thomas, Hair and Noel-Storr156 and on AI tool evaluation reportingReference Farotimi, Dunn, Van Lissa, Polanin, Mavridis and Pigott157 represents progress, but formal reporting guidelines for this domain remain a priority.
4.5. Strengths and limitations
This project summarizes the current state of the literature on AI and ML tools for ESP tasks. We followed the AHRQ EPC Program methodology; however, some constraints were implemented due to feasibility. We did not include every study that had the potential to inform the review. One notable exclusion was studies of tools that may be useful but did not fit with the EPC ESP methodology, such as data extraction from abstracts. Another limitation was that we did not extract all results from every analysis published for each study but instead sought to summarize the results across ESPs. Finally, we did not critically appraise the RoB or methodological quality of the included studies.
5. Conclusions
AI tools for evidence synthesis show promise for improving efficiency, particularly for study design identification and screening prioritization. However, the evidence base reveals substantial heterogeneity in evaluation approaches, inconsistent performance across tasks and topics, and limited research on workflow integration. No existing tool can currently replace human expertise; the most promising approaches incorporate humans in the loop. For ES methodologists, certain tools, particularly for RCT identification and screening prioritization, can be implemented cautiously and with appropriate human oversight. Search automation, data extraction, and RoB assessment tools require further development and validation before routine implementation. The field would benefit from standardized evaluation frameworks, consistent reporting practices, and research focused on workflow integration along with isolated model validation. As AI technologies continue to evolve rapidly, living reviews and evidence maps will be essential for keeping the evidence synthesis community informed about new developments and best practices. Semi-annual updates of this report can be found on the AHRQ website.15
Author contributions
Conceptualization: G.A., M.D., Ed.C., H.J.M., Er.C., H.H., E.K., E.B., T.A.T., I.I.; Data curation: G.A., Ed.C., H.J.M., E.B., T.A.T.; Formal analysis: G.A., H.H., E.K., E.B., T.A.T., I.I.; Investigation: G.A., M.D., Ed.C., H.J.M., Er.C., H.H., E.K., E.B., T.A.T., I.I.; Methodology: G.A., M.D., H.H., Er.C., E.K., E.B, T.A.T., I.I.; Project administration: G.A., H.J.M.; Supervision: E.B., T.A.T.; Validation: H.J.M.; Visualization: G.A., E.B., T.A.T., I.I.; Writing—original draft: G.A.; Writing—review and editing: G.A., M.D., I.I., Ed.C., H.J.M., Er.C., H.H., E.K., E.B., T.A.T.
Competing interest statement
This report is based on research conducted by the Brown Evidence-based Practice Center (75Q80120D00001), Kaiser Permanente Research Affiliates Evidence-based Practice Center (75Q80120D00004), Pacific Northwest Evidence-based Practice Center (75Q80120D00006), and the Scientific Resource Center (75Q80122C00002) under contract to the Agency for Healthcare Research and Quality (AHRQ), Rockville, MD. The findings and conclusions in this document are those of the authors who are responsible for its contents; the findings and conclusions do not necessarily represent the views of AHRQ. No statement in this article should be construed as an official position of the Agency for Healthcare Research and Quality or of the U.S. Department of Health and Human Services.
Data availability statement
All data are included in the Supplementary Material.
Funding statement
The authors declare that no specific funding has been received for this article.
Supplementary material
To view supplementary material for this article, please visit http://doi.org/10.1017/rsm.2026.10118.





 Open access

