Introduction
The feldspathoid KAlSiO4 has, like zeolites, a framework structure of linked (Si, Al)O4 tetrahedra. The first structural refinement of kalsilite was performed by Perrotta and Smith (Reference Perrotta and Smith1965) who studied a natural sample of kalsilite from Mt. Nyiragongo, Congo, naming it “low kalsilite” (hexagonal symmetry, space group P6 3, a = 5.161 and c = 8.699 Å). Andou and Kawahara (Reference Andou and Kawahara1984) synthesized low kalsilite under hydrothermal conditions (600°C and 15 days), also with hexagonal symmetry (a = 5.151 and c = 8.690 Å); low kalsilite was later also synthesized by Okamoto (Reference Okamoto1997) (600°C and 14 days), with an observed modification at high temperature (above 865°C) into the high kalsilite polymorph (P6 3mc or P6 3/mmc). Kawahara et al. (Reference Kawahara, Andou, Marumo and Okomo1987) investigated transformation of low kalsilite into high kalsilite at 865°C.
Several applications for kalsilite have been developed in the past, for example as an ingredient in dental ceramic materials (Kumar et al., Reference Kumar, Kumar Singh and Kumar2015). Kalsilite crystallization may be related to the formation mechanism of leucite; in fact, it was observed that when synthesizing leucite for biomedical applications, kalsilite crystallizes as a metastable intermediate reaction product and then disappears after prolonged heating (Zhang et al., Reference Zhang, Lv, Chen and Wu2007). Also Bogdanoviciene et al. (Reference Bogdanoviciene, Jankeviciute, Pinkas, Beganskiene and Kareiva2007) reported that during the preparation of alumosilicate glass ceramics the synthesis of multiphasic products (kalsilite, leucite and sanidine) very often occurs.
Recently, kalsilite was used as a heterogeneous catalyst for transesterification of soybean oil with methanol to biodiesel (Wen et al., Reference Wen, Yan, Smith, Zhang and Wen2010). At present, biodiesel is produced principally by the transesterification reaction of vegetable oils in the presence of methanol and homogeneous alkaline catalysts. The final product (fatty acid methyl ester) is purified by removing glycerol, various by-products present in minor amounts and a homogeneous catalyst (e.g. KOH). Although recycling of glycerol could make this process more efficient (Canale et al., Reference Canale, Tonucci, Bressan and d'Alessandro2014), the classical biodiesel production procedure is still laborious, making it not fully sustainable economically. The use of a heterogeneous catalyst, such as kalsilite, could improve the entire process by reducing and making the purification more efficient. A few studies have reported the use of kalsilite as a transesterification catalyst in the presence of soybean oil and methanol at 120°C (weight ratio: oil/methanol/kalsilite = 100/50/5) (Wen et al., Reference Wen, Yan, Smith, Zhang and Wen2010).
Kalsilite has been synthesized in the past by various techniques, including cation exchange from nepheline (Dollase and Freeborn, Reference Dollase and Freeborn1977); a sol-gel method using TEOS or SiO2 (Hamilton and Henderson, Reference Hamilton and Henderson1968; Bogdanoviciene et al., Reference Bogdanoviciene, Jankeviciute, Pinkas, Beganskiene and Kareiva2007); hydrothermal methods (Smith and Tuttle, Reference Smith and Tuttle1957; Kopp et al., Reference Kopp, Harris and Clark1961; Andou and Kawahara, Reference Andou and Kawahara1984; Okamoto and Kawahara, Reference Okamoto and Kawahara1996; Okamoto, Reference Okamoto1997; Becerro et al., Reference Becerro, Escudero and Mantovani2009a,Reference Becerro, Mantovani and Escuderob); and solid-state synthesis from zeolite, silicate compounds and kaolinite (Dimitrijevic and Dondur, Reference Dimitrijevic and Dondur1995; Heller-Kallai and Lapides, Reference Heller-Kallai and Lapides2003; Kosanovic et al., Reference Kosanović, Subotic, Śmit, Čižmek, Stubicar and Tonejc1997).
With the aim of using kaolinite as a starting material, our research group conducted several studies on the reactivity of ‘metakaolinite’ (dehydroxylated kaolinite) with alkali solutions in successful zeolitic synthesis (Novembre et al., Reference Novembre, Di Sabatino and Gimeno2005, Reference Novembre, Gimeno, Pasculli and Di Sabatino2010, Reference Novembre, Di Sabatino, Gimeno and Pace2011, Reference Novembre, Pace and Gimeno2014). However, few reports have been published on the direct kalsilite synthesis from kaolin, avoiding the use of any chemicals (‘green conditions’). We can only cite the work of Becerro et al. (Reference Becerro, Escudero and Mantovani2009a) and Becerro et al. (Reference Becerro, Mantovani and Escudero2009b) who synthesized kalsilite by hydrothermal treatment of kaolin at 300°C for 12 h in a KOH solution.
The present work seeks to extract value from an abandoned kaolin quarry, as well as aiming towards realization of a ‘green’ mineralogical synthesis process. The scope of the present work is in fact to synthesize kalsilite by the hydrothermal technique using a kaolinitic rock from northern Sardinia, Italy, lowering the synthesis temperature as far as possible and obtaining a higher yield than reached in the past by other authors.
Furthermore, we tried to employ the synthesized kalsilite as a heterogeneous green catalyst in the production of biodiesel starting from a non-edible, cheap and largely available product such as sunflower oil that has been used for frying. The process is particularly sustainable as non-toxic and inexpensive catalysts are easily available. Furthermore, we should emphasize that this is an example of adding value to readily available by-products as reported in other studies for lignin-based derivatives that are another important class of agroindustrial waste (Tonucci et al., Reference Tonucci, Coccia, Bressan and d'Alessandro2012; Girardi et al., Reference Girardi, Cichelli, Perri, Basti and d'Alessandro2014). Use of other cheap kaolin sources and blends of used non-edible oils could be envisaged in similar future experiments.
Experimental
Materials
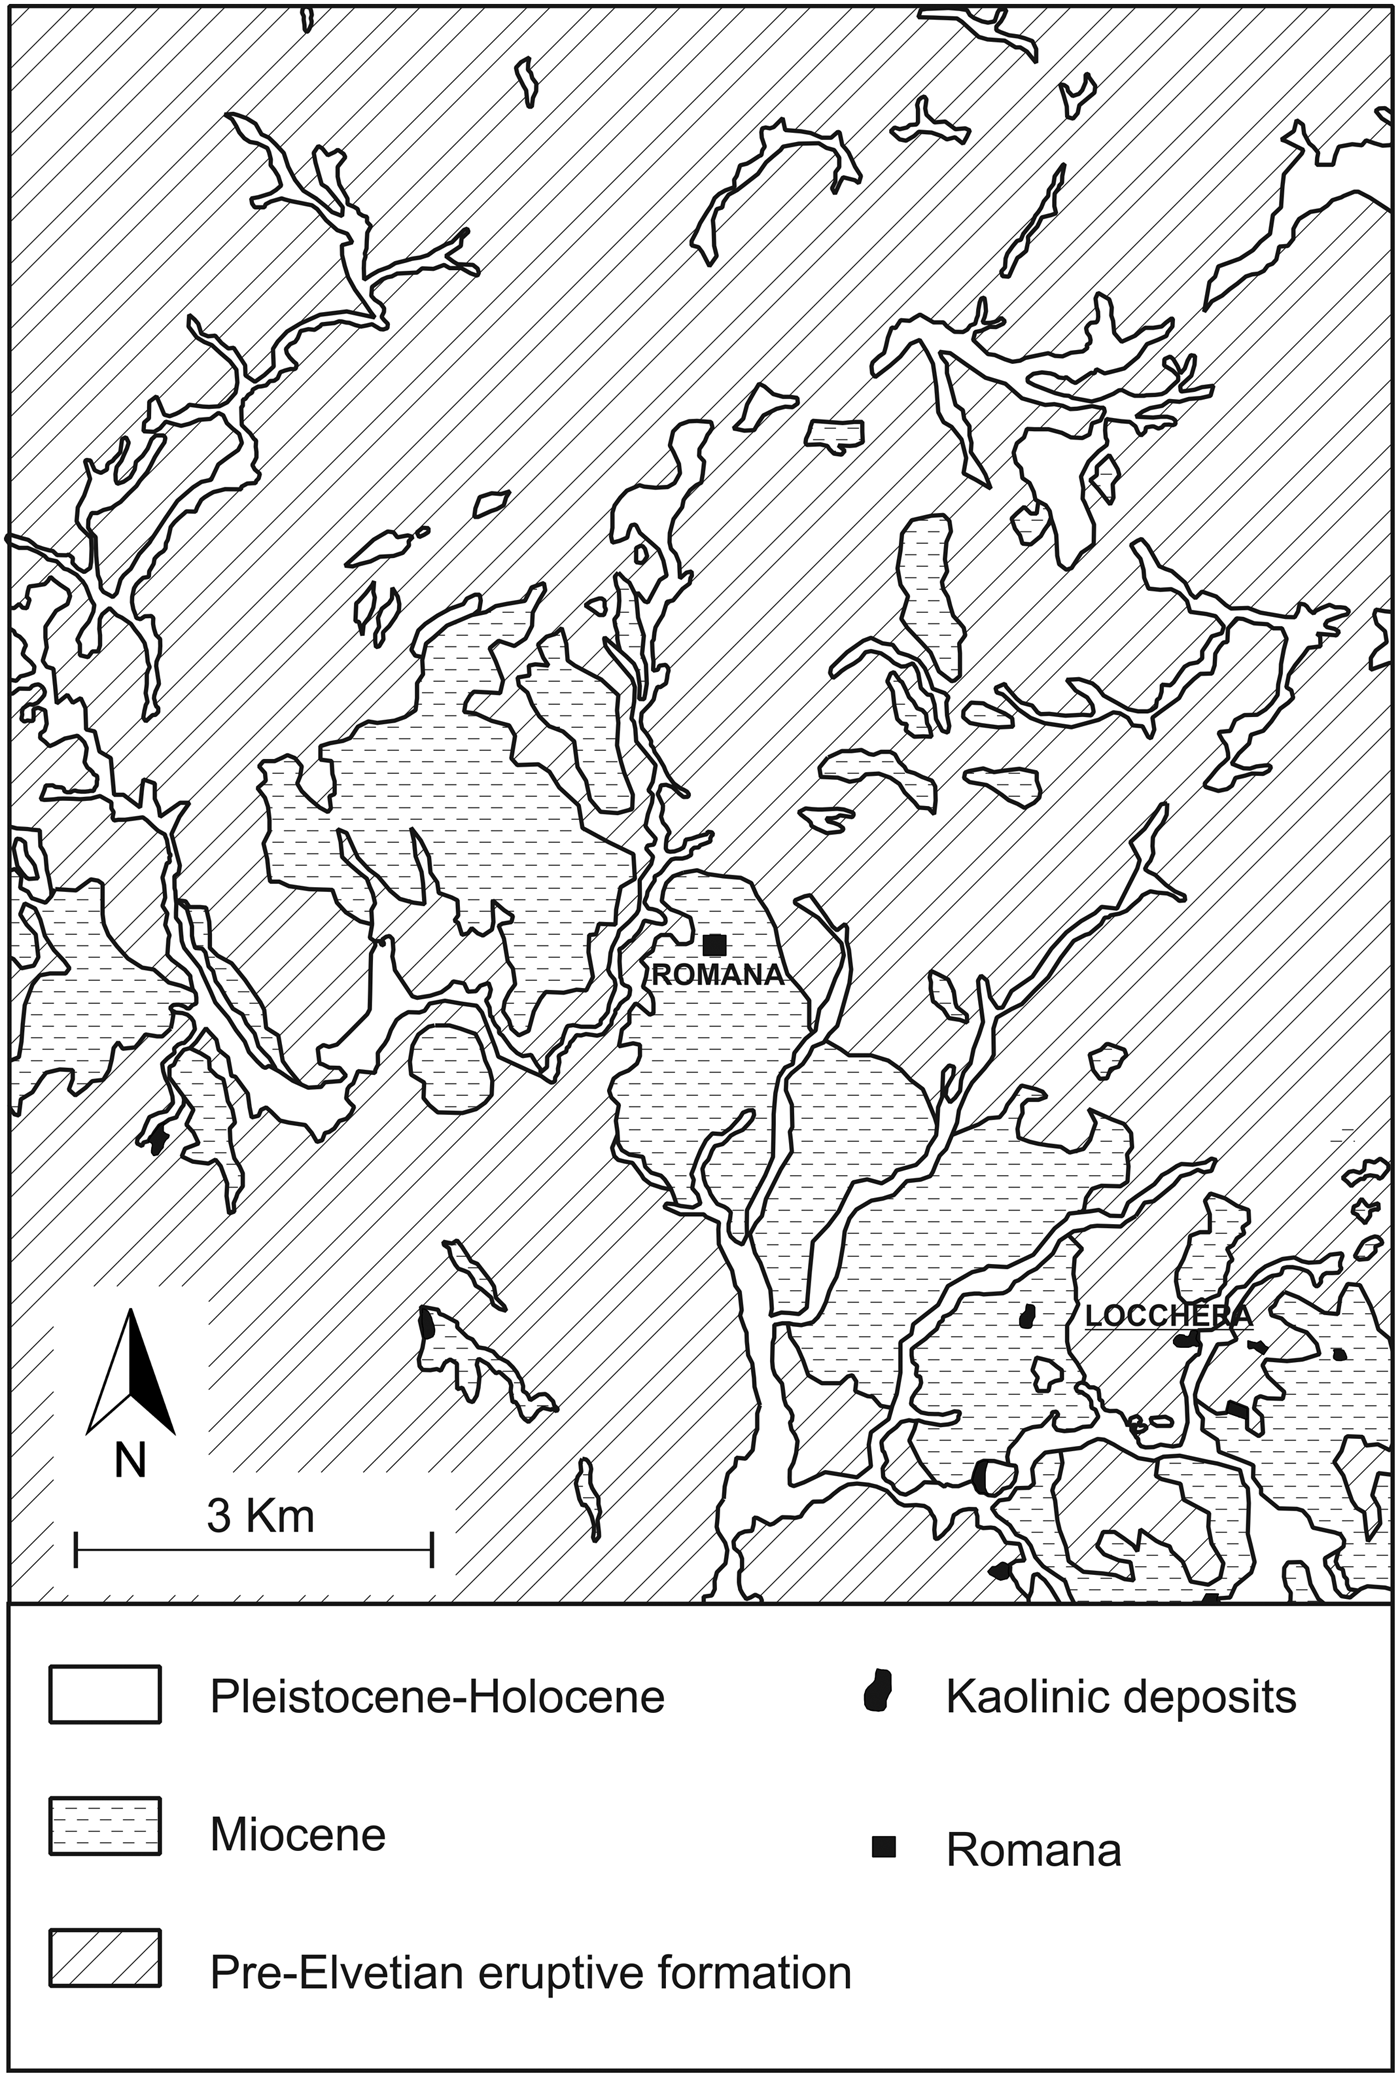
The kaolin samples used as starting material in our work were collected from an outcrop at the Locchera quarry (Fig. 1), in Romana, Sassari province, Sardinia, Italy. Kaolin from the Locchera quarry is cryptocrystalline, shows a thickness of ~20 m and generally appears compact and slightly oily.
Geological sketch map of the Romana area.
The kaolin was triturated, and the sandy fraction was separated by retention in a sieve. The fraction below 90 µm was then collected, suspended in distilled water, sonicated and centrifuged for separation of the silt fraction and collection of the clay fraction.
All the chemical reagents used in the synthesis protocol were purchased from Honeywell Riedel-de-Haën™ products (the purities of the reagents were ≥ 99%). The sunflower oil was a commercial product, purchased at a local supermarket; it was used to fry frozen chips for 10 min.
Synthesis of kalsilite
A solution of 0.86 M KOH was prepared by dissolving 1.35 g of KOH pellets in 28 mL of distilled water. Then 0.8 g of Al(OH)3 (65%, p/v) and 3.10 g of kaolin were mixed with the KOH solution. The resulting mixture was put inside a stainless-steel hydrothermal reactor and heated at 10°C/min until 190°C and kept for 12, 15 and 18 h.
Kalsilite catalysed transesterification of sunflower oil
Both fresh oils and those used for frying were titrated with KOH 0.1 M to establish the % of free fatty acids, expressed as oleic acid, following the common methodology for edible vegetable oils (AOAC Official Method 940.28 free fatty acids in crude and refined oils). Kalsilite was tested as the transesterification catalyst; the commercial edible sunflower oil and the filtered used oil in the presence of methanol, at 50°C, were stirred for 5 h (weight ratio: oil/methanol/kalsilite = 100/20/0.75). The ‘biodiesel phase’ was separated by using a separating funnel and washed three times with NaCl saturated aqueous solution. It was then characterized by 1H NMR (nuclear magnetic resonance) using CDCl3 as the solvent.
Characterization methods
Romana kaolin and synthesized powders were analysed by powder X-ray diffraction (PXRD); the instrument was a Siemens D5000 operating with a Bragg-Brentano geometry using CuKα radiation (λ=1.518 Å) at 40 kV and 40 mA, 4–45° scanning interval, step size 0.020°2θ with 10 s step–1, a divergence slit of 0.5° and a receiving slit of 0.1 mm.
Synthetic samples, collected at different time intervals, were washed thoroughly with distilled water and oven dried at 40°C for 24 h. Identification of mineral phases and relative peak assignments were performed with reference to the following JCPDS codes (powder diffraction files from the International Centre for Diffraction Data, http://www.icdd.com/): 00-011-0579 for kalsilite and 00-011-0313 for kaliophilite H2. Both the crystalline and amorphous phases in the synthesis powders were estimated using Quantitative Phase Analysis (QPA) applying the combined Rietveld and Reference Intensity Ratio (RIR) methods; corundum NIST 676a was added to each sample, amounting to 10% (according to the strategy proposed by Gualtieri, Reference Gualtieri2000 and Novembre et al., Reference Novembre, Pace and Gimeno2017), and the powder mixtures were homogenized by hand-grinding in an agate mortar. Data for the QPA refinement were collected in the angular range 5–110°2θ with steps of 0.02°2θ and 10 s step–1, a divergence slit of 0.5° and a receiving slit of 0.1 mm. Data were processed with the GSAS software (Larson and Von Dreele, Reference Larson and Von Dreele1997) and the graphical interface EXPGUI (Toby, Reference Toby2001). The unit-cell parameters were determined, starting with the structural models proposed by Andou and Kawahara (Reference Andou and Kawahara1984) for kalsilite. The following parameters were refined: background parameters, zero shift, cell parameters and peak profiles.
Fourier-transform infrared analyses (FTIR) of Romana kaolin and the synthesized products were conducted with an ABB FTLA2000 spectrometer, equipped by a separator of KBr and a DTGS detector; the source of IR radiation was a SiC (Globar) filament. Samples were treated according to the method of Robert et al. (Reference Robert, Della Ventura and Thauvin1989) using powder pressed pellets (KBr/sample ratio of 1/100, pressure undergone prior determination 15 t/cm2); spectra were processed with the program GRAMS-AI (ThermoFisher scientific), spectral range: 650–3800 cm–1.
Morphological analyses were carried out with a scanning electron microscope (SEM); the instrument was a JEOL JSM-840, with operating conditions of 15 kV and window ranging from 18 to 22 mm following the procedure reported in Ruggieri et al. (Reference Ruggieri, Saavedra, Fernandez-Turiel, Gimeno and Garcia-Valles2010), and a double coating (gold and graphite) procedure.
Kaolin composition was determined by X-ray fluorescence (XRF), by means of a Sequential X-Ray Spectrophotometer PHILIPS PW 2400. Major-element determination was carried out using fused beads (lithium tetraborate pearls at a dilution 1/20). The beads were made in triplicate in Pt crucibles and collector dishes, using LiI as a viscosity corrector, and were determined two times (original and duplicate; the third bead was used to clean the crucible which was also cleaned regularly with nitric acid). All the samples were carefully treated at 130°C in pyrex receptacles for 48 h prior to any other manipulation. We also obtained a value for the loss on ignition of 1 g of sample using a ceramic crucible in an oxidizing furnace.
Chemical analysis of synthesized powders was carried out with inductively coupled plasma optical emission spectroscopy (ICP-OES, Perkin Elmer Optima 3200 RL) following the procedure reported in Fernandez-Turiel et al. (Reference Fernandez-Turiel, Gimeno, Rodríguez, Carnicero and Valero2003) preceded by fusion in lithium meta-tetraborate beads and subsequent acid solubilization.
The density of kalsilite was calculated by He-pycnometry using an AccuPyc 1330 pycnometer as explained in Novembre et al. (Reference Novembre, Di Sabatino, Gimeno, Garcia Valles and Martinez Manent2004).
The NMR spectra were obtained using a Bruker Avance 300 spectrometer (7.05 Tesla) equipped with a high-resolution multinuclear probe that operated in the range of 30 MHz to 300 MHz and with a two-channel magic angle spinning (MAS) NMR probe using magic angle spinning speeds up to 5 kHz with standard Zirconia rotors with 7 mm of diameter. Spectra were processed by XWINNMR (Bruker program). Synthesized kalsilite was analysed using 29Si MAS NMR (4000 Hz speed of rotation, 100–400 scans, 8 μs 90° excitation pulse and 5 s relaxation delay time). The chemical shifts were referenced to trimethylsilyl propionic (2,2,3,3)- d4 acid, sodium salt (TSP) for 29Si. The 1H NMR spectra in CDCl3 solution were acquired in a NMR tube (5 mm) using tetramethylsilane as reference. A standard pulse sequence (zg) with a spectral width of –0.5 ppm to 12.5 ppm, a 90° excitation pulse (7.6 μs) and 1 s relaxation delay time was used to collect 32 scans.
Results and discussion
Characterization of the starting material
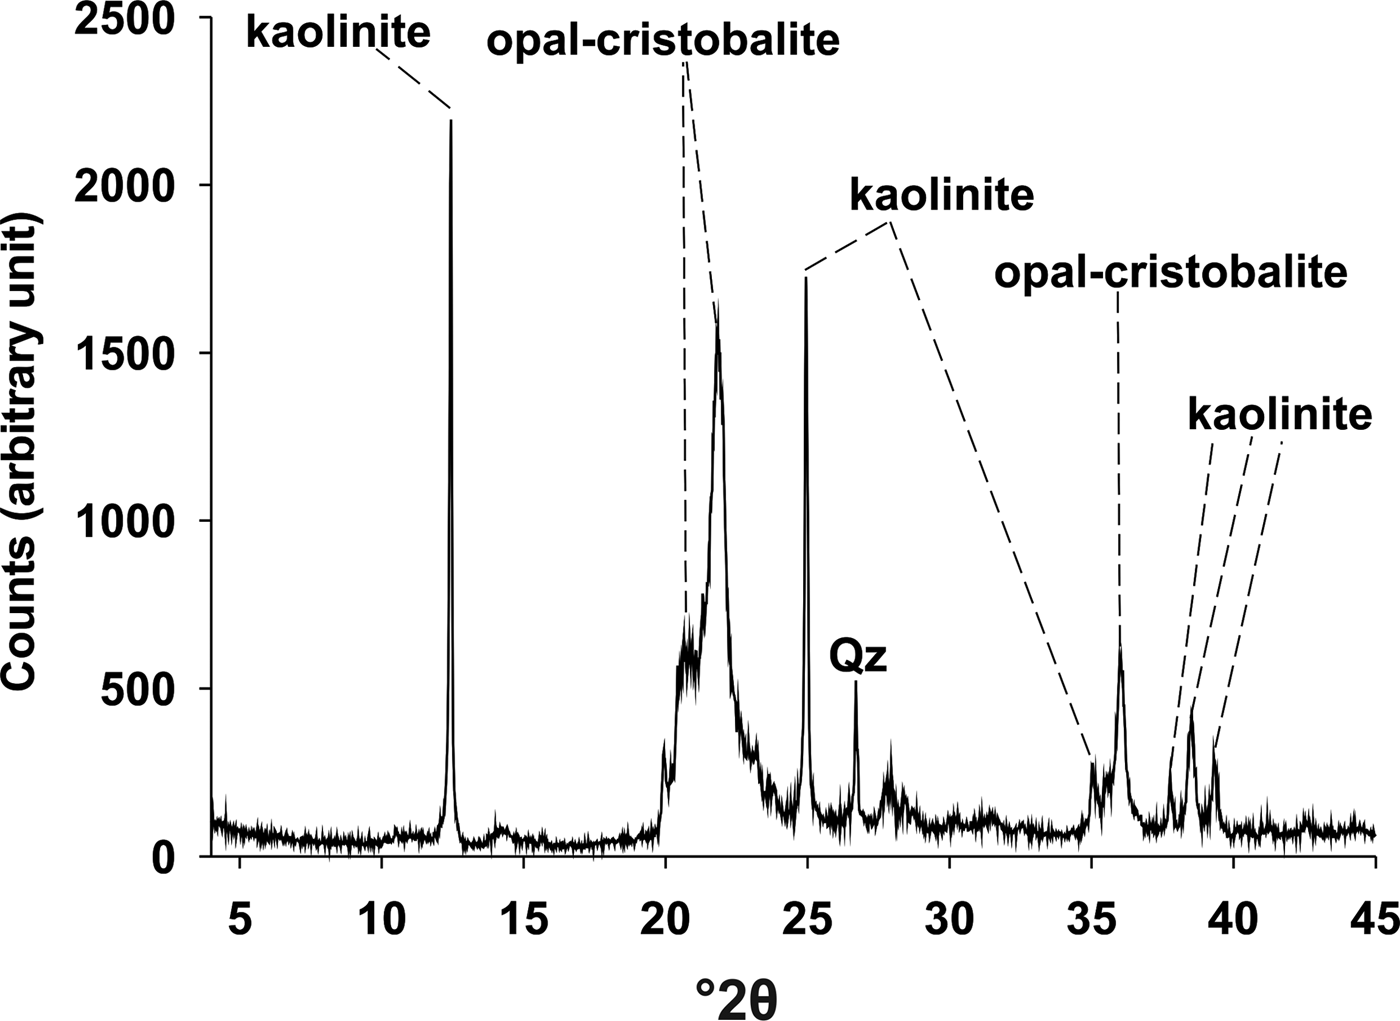
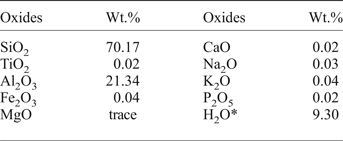
The chemical composition of kaolin is reported in Table 1. Romana kaolin shows a silica excess with respect to pure kaolinite, and the PXRD data were consistent with this observation, revealing a mineral assemblage of kaolinite plus small amounts opal/cristobalite and quartz (Fig. 2). This peculiar characteristic gives the material a Si/Al ratio greater than 1, unlike the typical commercial kaolins. For this characteristic and if Al(OH)3 was not added, Romana kaolin would be a material suitable for synthesis of minerals characterized by Si/Al ratio greater than 1, such as leucite type, silica-rich zeolites, etc. For the present study, with the intent of synthesizing kalsilite, Al(OH)3 was added to bring the kaolin stoichiometry to a Si/Al ratio of 1.
Diffraction pattern of raw kaolin.

Chemical composition of Romana kaolin.

* Loss on ignition
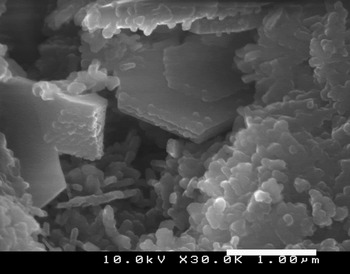
The morphological analysis showed that kaolin particles had an irregular flake shape, with a micrometre-scale grain size (Fig. 3).
Scanning electron microscope images of raw kaolin showing prismatic particles of kaolinite.

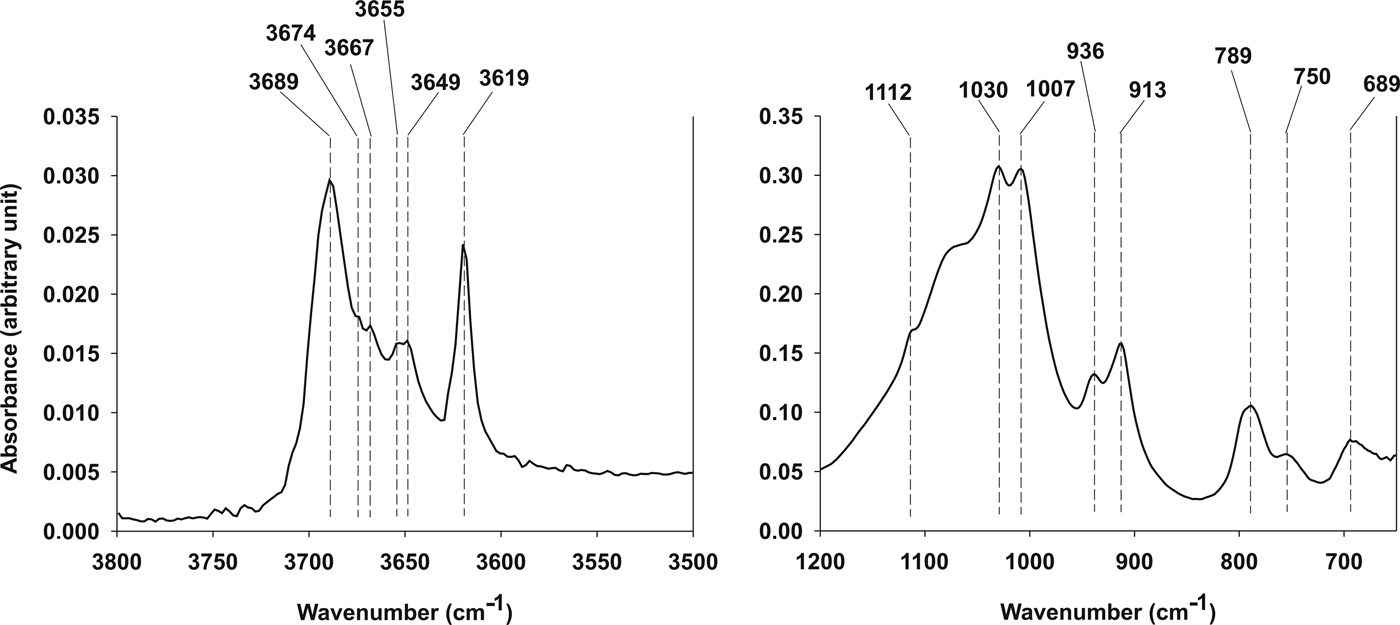
Infrared analysis was conducted on kaolin raw material (Fig. 4). The bands between 3750 and 3500 cm–1 are attributed to –OH stretching. In particular five bands were evidenced at 3649, 3655, 3667, 3674 and 3689 cm–1 and related to the inner surface –OH in-phase/out-of-phase stretching vibrations (Cheng et al., Reference Cheng, Liu, Zhang, Yang and Frost2010a; Frost et al., Reference Frost, Makó, Kristóf, Horváth and Kloprogge2001b); a band centred at 3619 cm–1 is related to the inner OH-stretching vibration. In the lower frequency region of the IR spectra (1800–400 cm–1) a band at 1112 cm–1 was observed and attributed to the apical Si–O stretching vibration (Cheng et al., Reference Cheng, Yang, Liu, Zhang and Frost2010b); in the same frequency region two bands located, respectively, at 1030 and 1007 cm–1 were attributed to apical Si–O stretching vibrations (Cheng et al., Reference Cheng, Yang, Liu, Zhang and Frost2010b); two other bands at 936 and 913 cm–1 were attributed to Al–OH bending vibrations (Qtaitat and Al-Trawneh, Reference Qtaitat and Al-Trawneh2005); three bands at 789, 750 and 689 cm–1 were related to –OH (Al–OH) translational vibrations (Frost et al., Reference Frost, Locos, Kristof and Kloprogge2001a). A strong stretching band is located at 1050 cm–1 and related to the presence of opal–cristobalite.
FTIR spectra of starting material. Left: high frequency range (3800–3500 cm–1); right: low frequency range (1200–650 cm–1).

Characterization of synthesized kalsilite
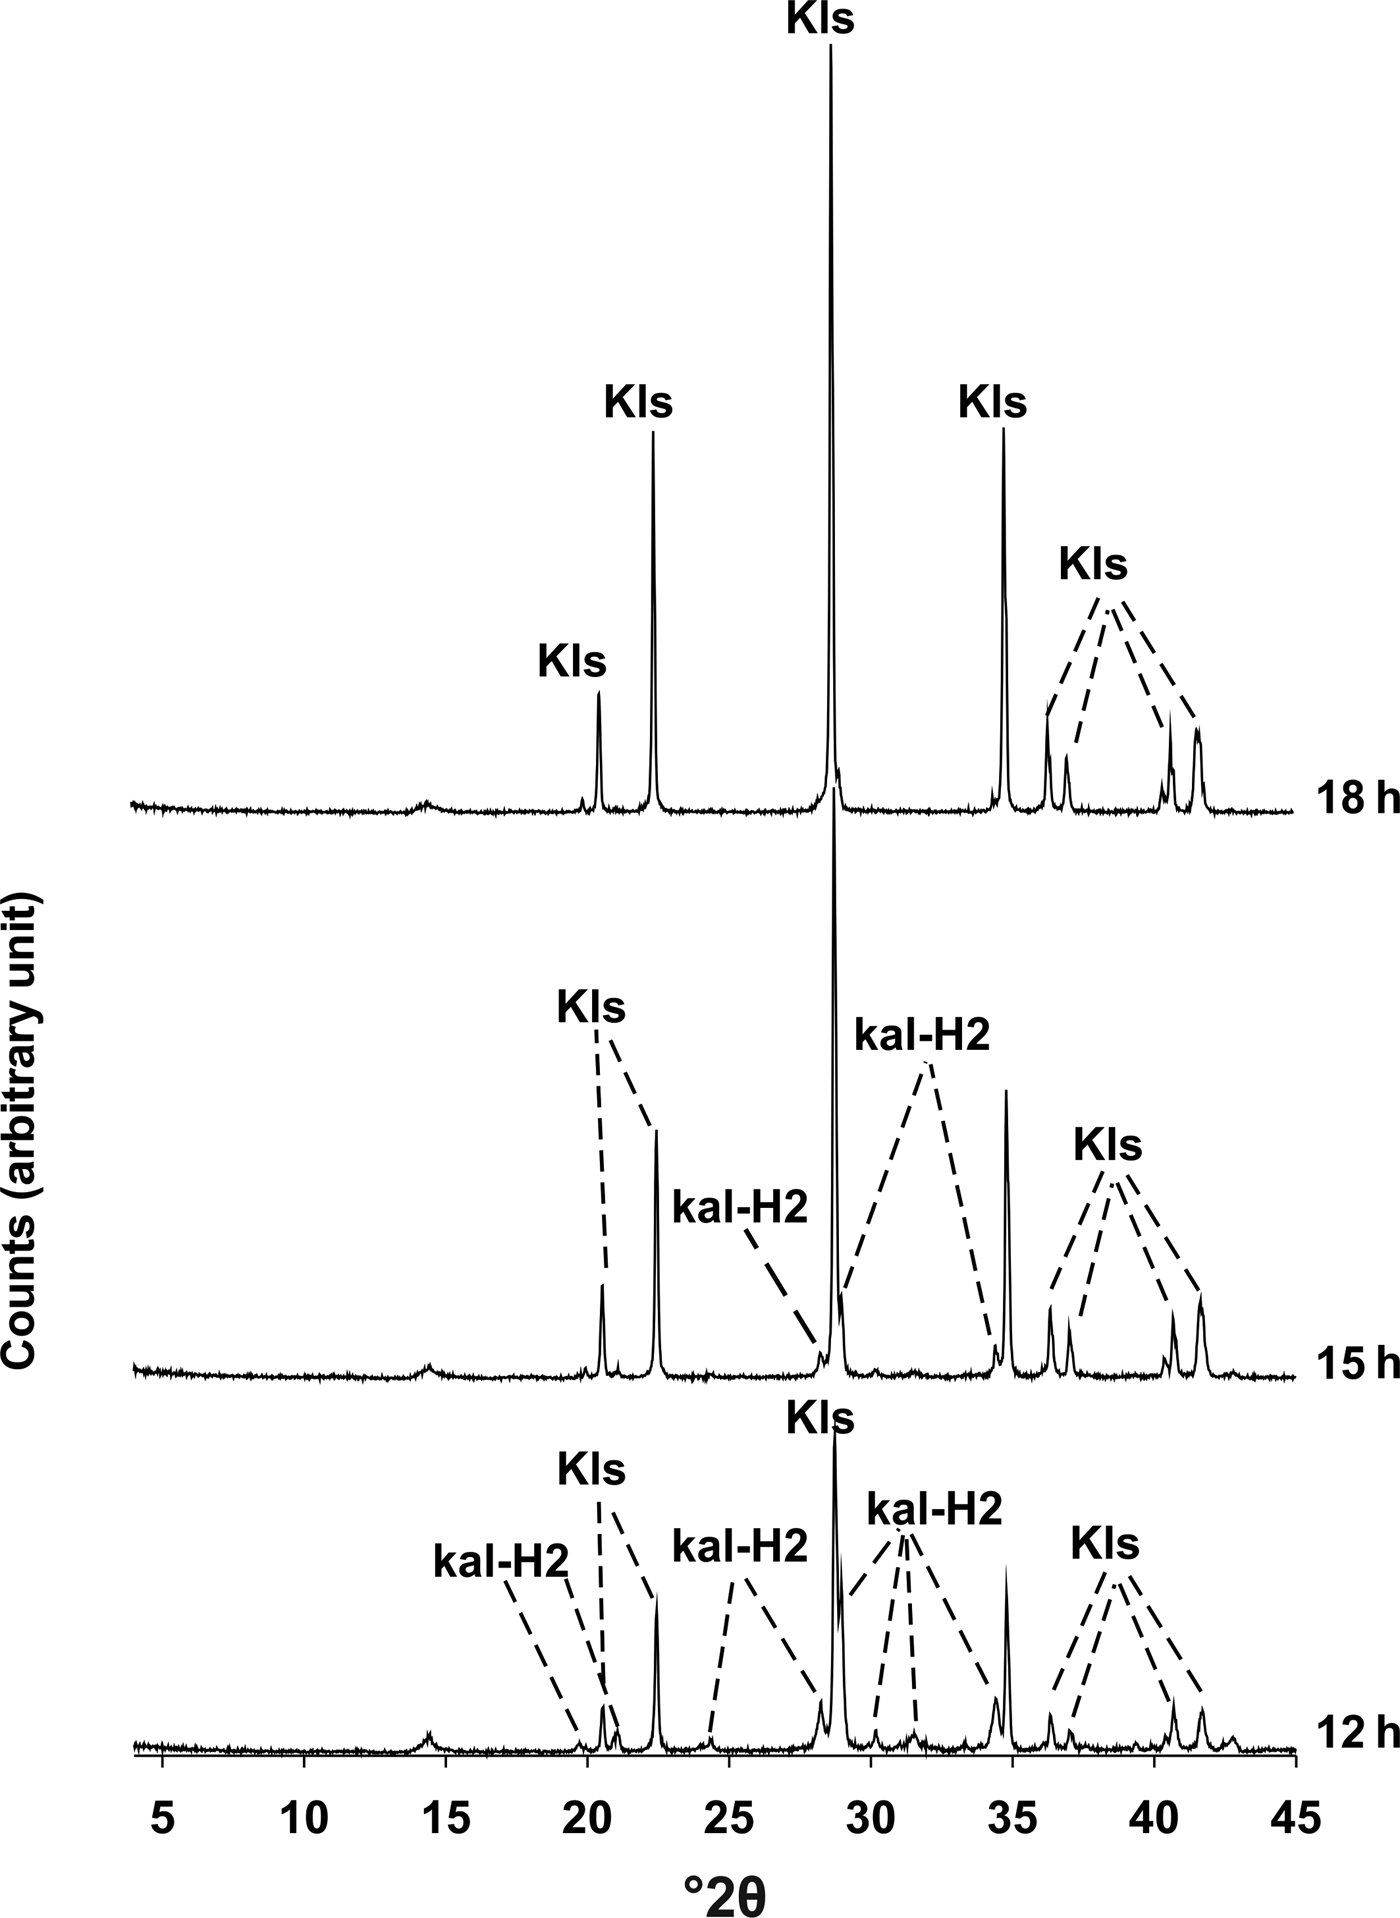
The crystallization of synthetic kaliophilite H2 as a metastable phase (sensu Tuttle and Smith, Reference Tuttle and Smith1958) was verified by the PXRD analyses (Fig. 5) in the time interval 12–15 h along with kalsilite. The disappearance of kaliophilite was observed after 18 h, at which time kalsilite remained as a unique phase.
X-ray diffractometric sequence of the synthesis run. Kal-H2: Kaliophilite H2; Kls: kalsilite.

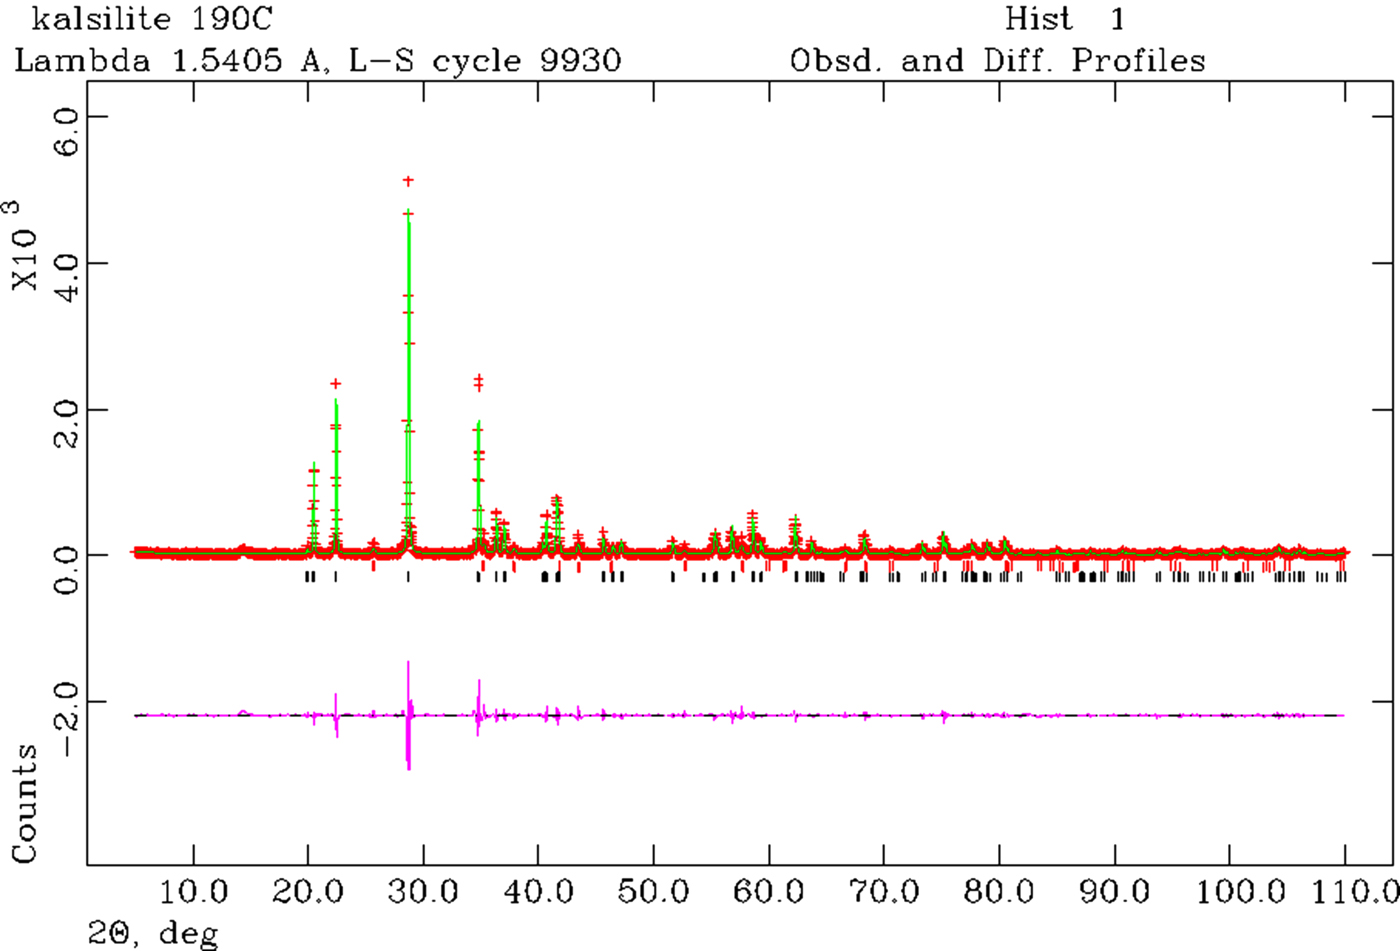
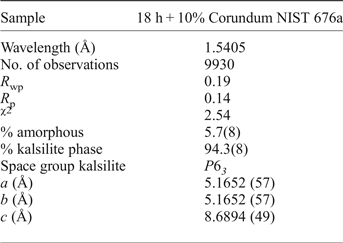
Rietveld refinement was performed on the products of reaction after 18 h. The observed and calculated profiles and difference plot for kalsilite and corundum NIST 676a with tick marks at the positions of the Bragg peaks are reported in Fig. 6. The cell parameters for kalsilite (Table 2), refined with a hexagonal symmetry, space group P6 3, were a 0 = b 0 = 5.1652(57) Å and the c 0 = 8.6894(49) Å. These parameters are in good agreement with those of Andou and Kawahara (Reference Andou and Kawahara1984).
Rietveld refinement plots: observed (red) and calculated profiles (green) and difference plot (pink) for kalsilite and corundum NIST 676a with tick marks at the positions of the Bragg peaks. Markers: kalsilite (black), corundum NIST 676a (red).

Experimental conditions and crystallographic data for kalsilite plus 10% corundum NIST 676a: samples at 18 h into synthesis run.

The results of the QPA indicated that the calculated amorphous phase in the sample is 5.7(8)%, thus resulting in a final product of 94.3(8)% kalsilite.
The chemical formula of kalsilite, calculated by the chemical analyses reported in Table 3, is K7.94Al7.88Si8.10O32 .
Chemical characterization (ICP-OES) of kalsilite. Values for the oxides, namely MgO, MnO, TiO2 and P2O5, are below the detection limits.

(*): Stebbins et al. (Reference Stebbins, Murdoch, Carmichael and Pines1986).
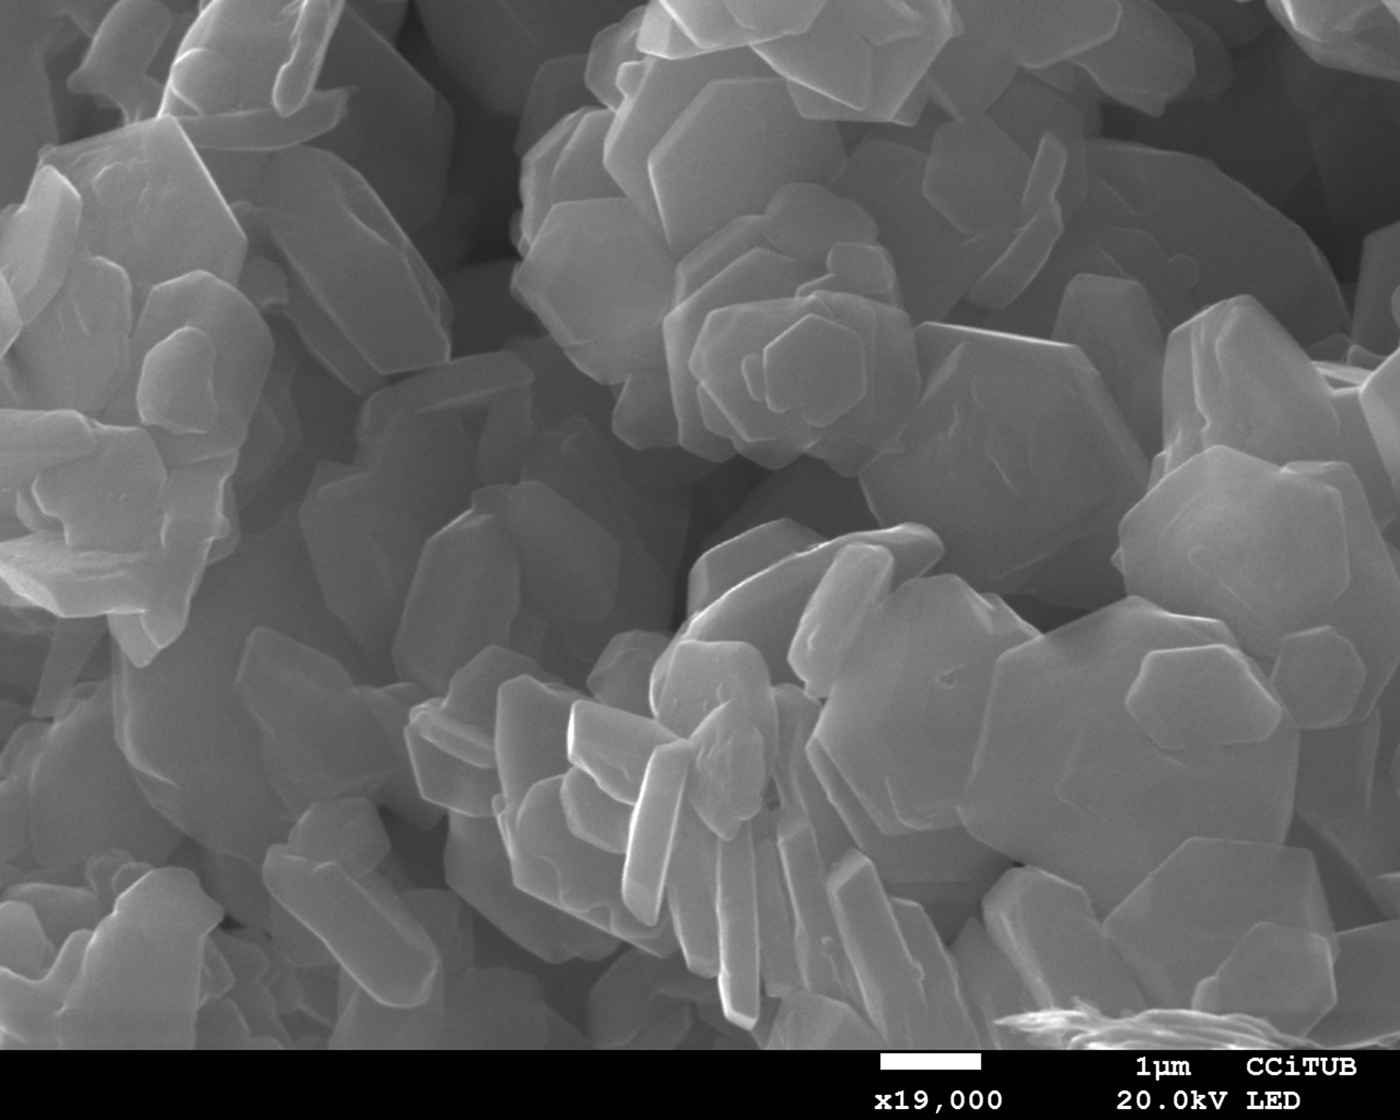
Morphological observations provided evidence of the crystalline growth of kalsilite hexagonal crystals of ~3 µm long (Fig. 7). Calculations gave a density of 2.609 g/cm3, close to the value of 2.64 g/cm3 reported in literature (Okamoto, Reference Okamoto1997).
Scanning electron microscope images of kalsilite at 18 h.

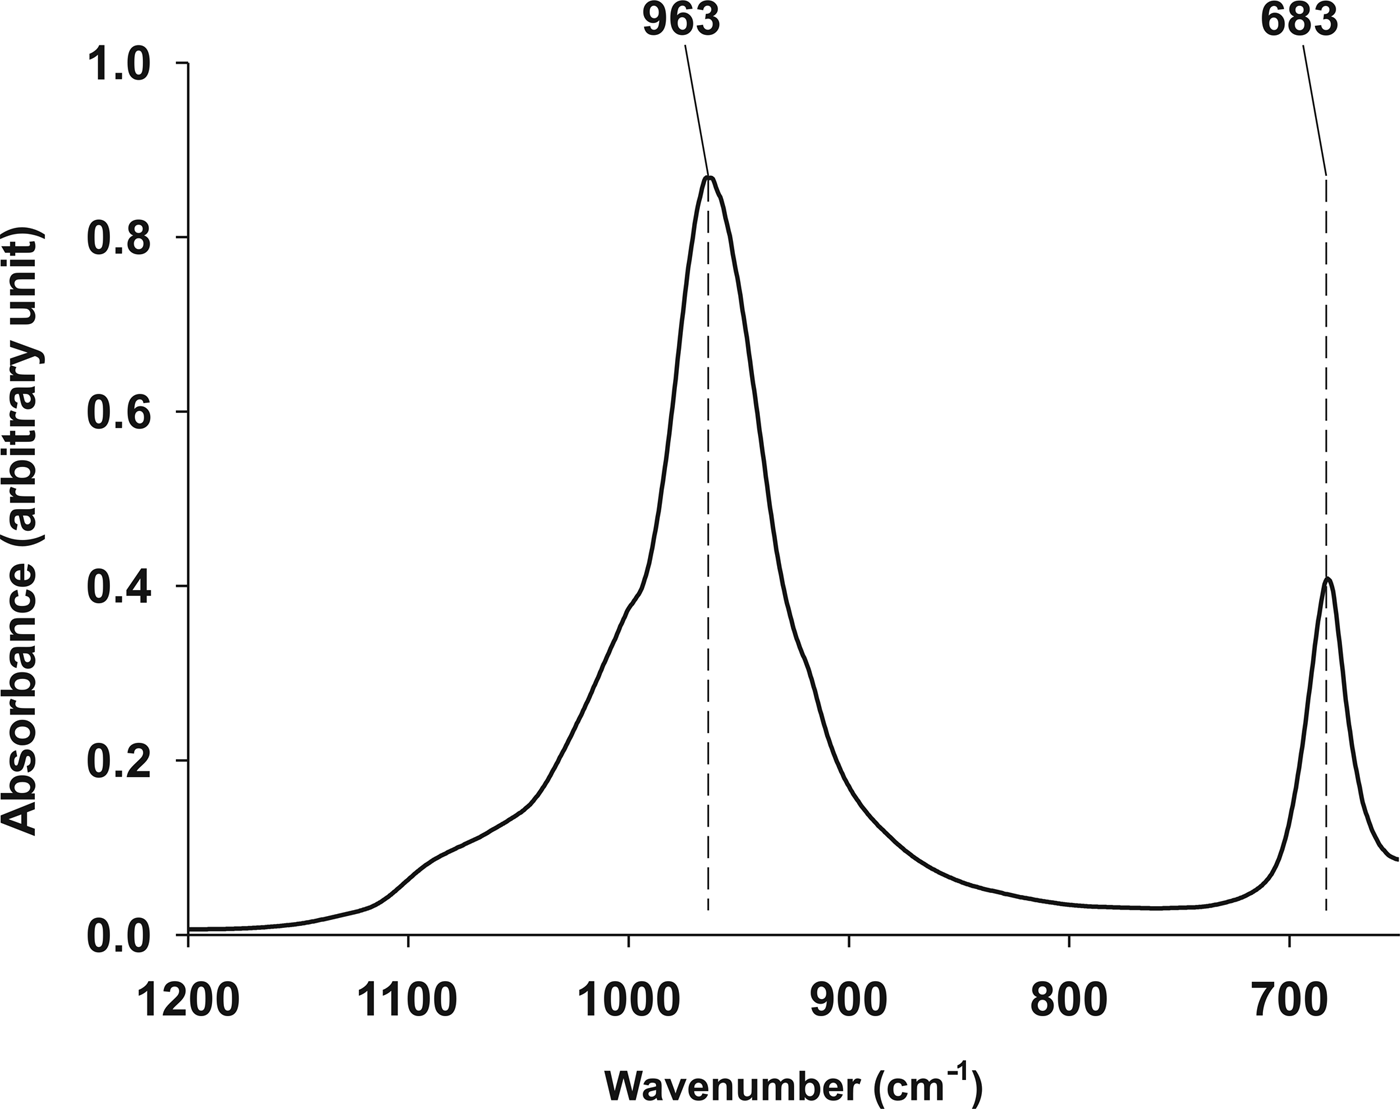
The FTIR spectrum for kalsilite revealed that tetrahedra present an asymmetric stretch of inner bonds at 963 cm–1 and a symmetric stretch of external bonds at 683 cm–1 (Fig. 8). For a comparison see Becerro et al. (Reference Becerro, Escudero and Mantovani2009a) and Henderson and Taylor (Reference Henderson and Taylor1988).
Infrared spectrum of synthesized kalsilite.

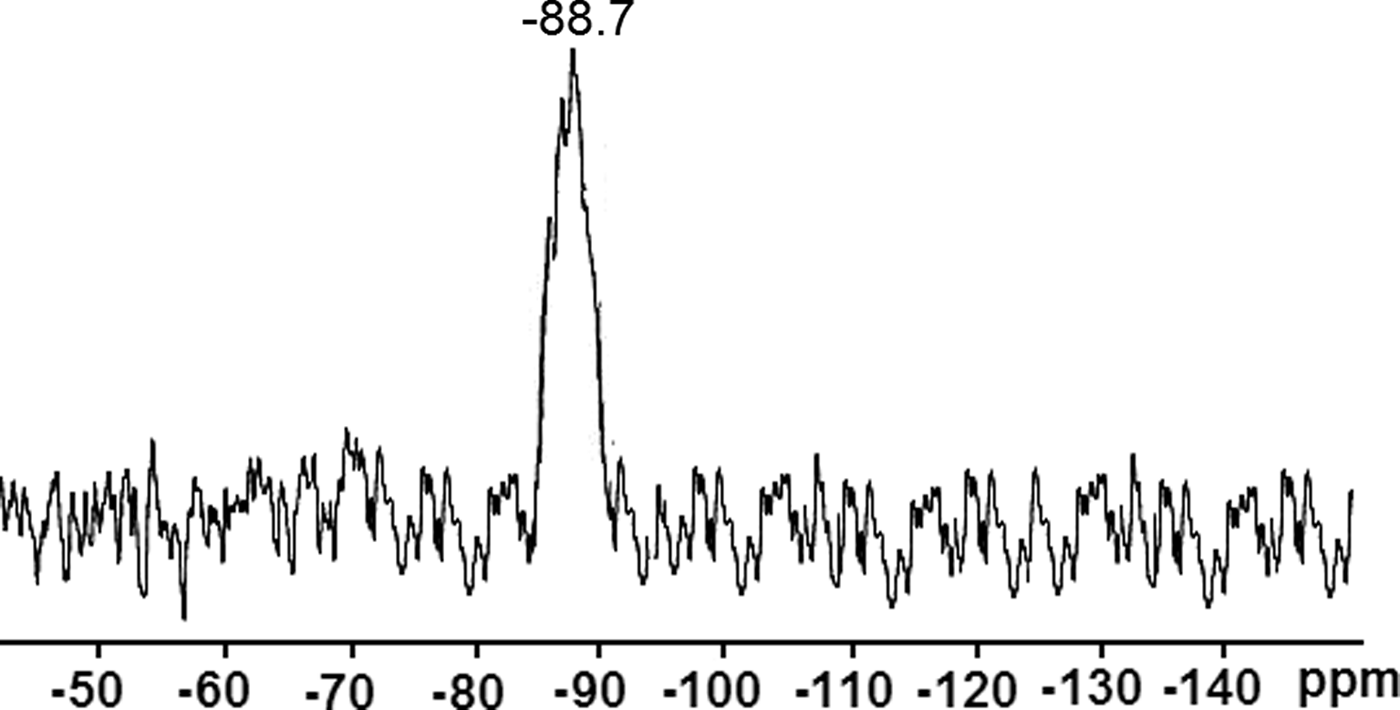
The 29Si MAS-NMR spectrum of the products of hydrothermal treatment after 18 h of reaction time (Fig. 9) revealed a single unique peak located at –88.7 ppm. Data are consistent with those reported for this mineral (Becerro et al., Reference Becerro, Escudero and Mantovani2009a; Dimitrijevic and Dondur, Reference Dimitrijevic and Dondur1995).
29Si MAS-NMR spectrum of synthesized kalsilite.

To evaluate the acid/base character of kalsilite, we performed some tests with several pH indicators. The basic character was clearly evident as a pink colour appeared on suspending kalsilite in a phenolphthalein methanol solution (pKa = 9.7). However, when we carried out the same experiment with other pH indicators having higher pKa values (i.e. 4-chloro-2-nitroaniline; pKa = 17.2), we observed that the colour solution remained yellow, showing a basicity lower than our indicator.
Kalsilite as a potential catalyst for biodiesel synthesis
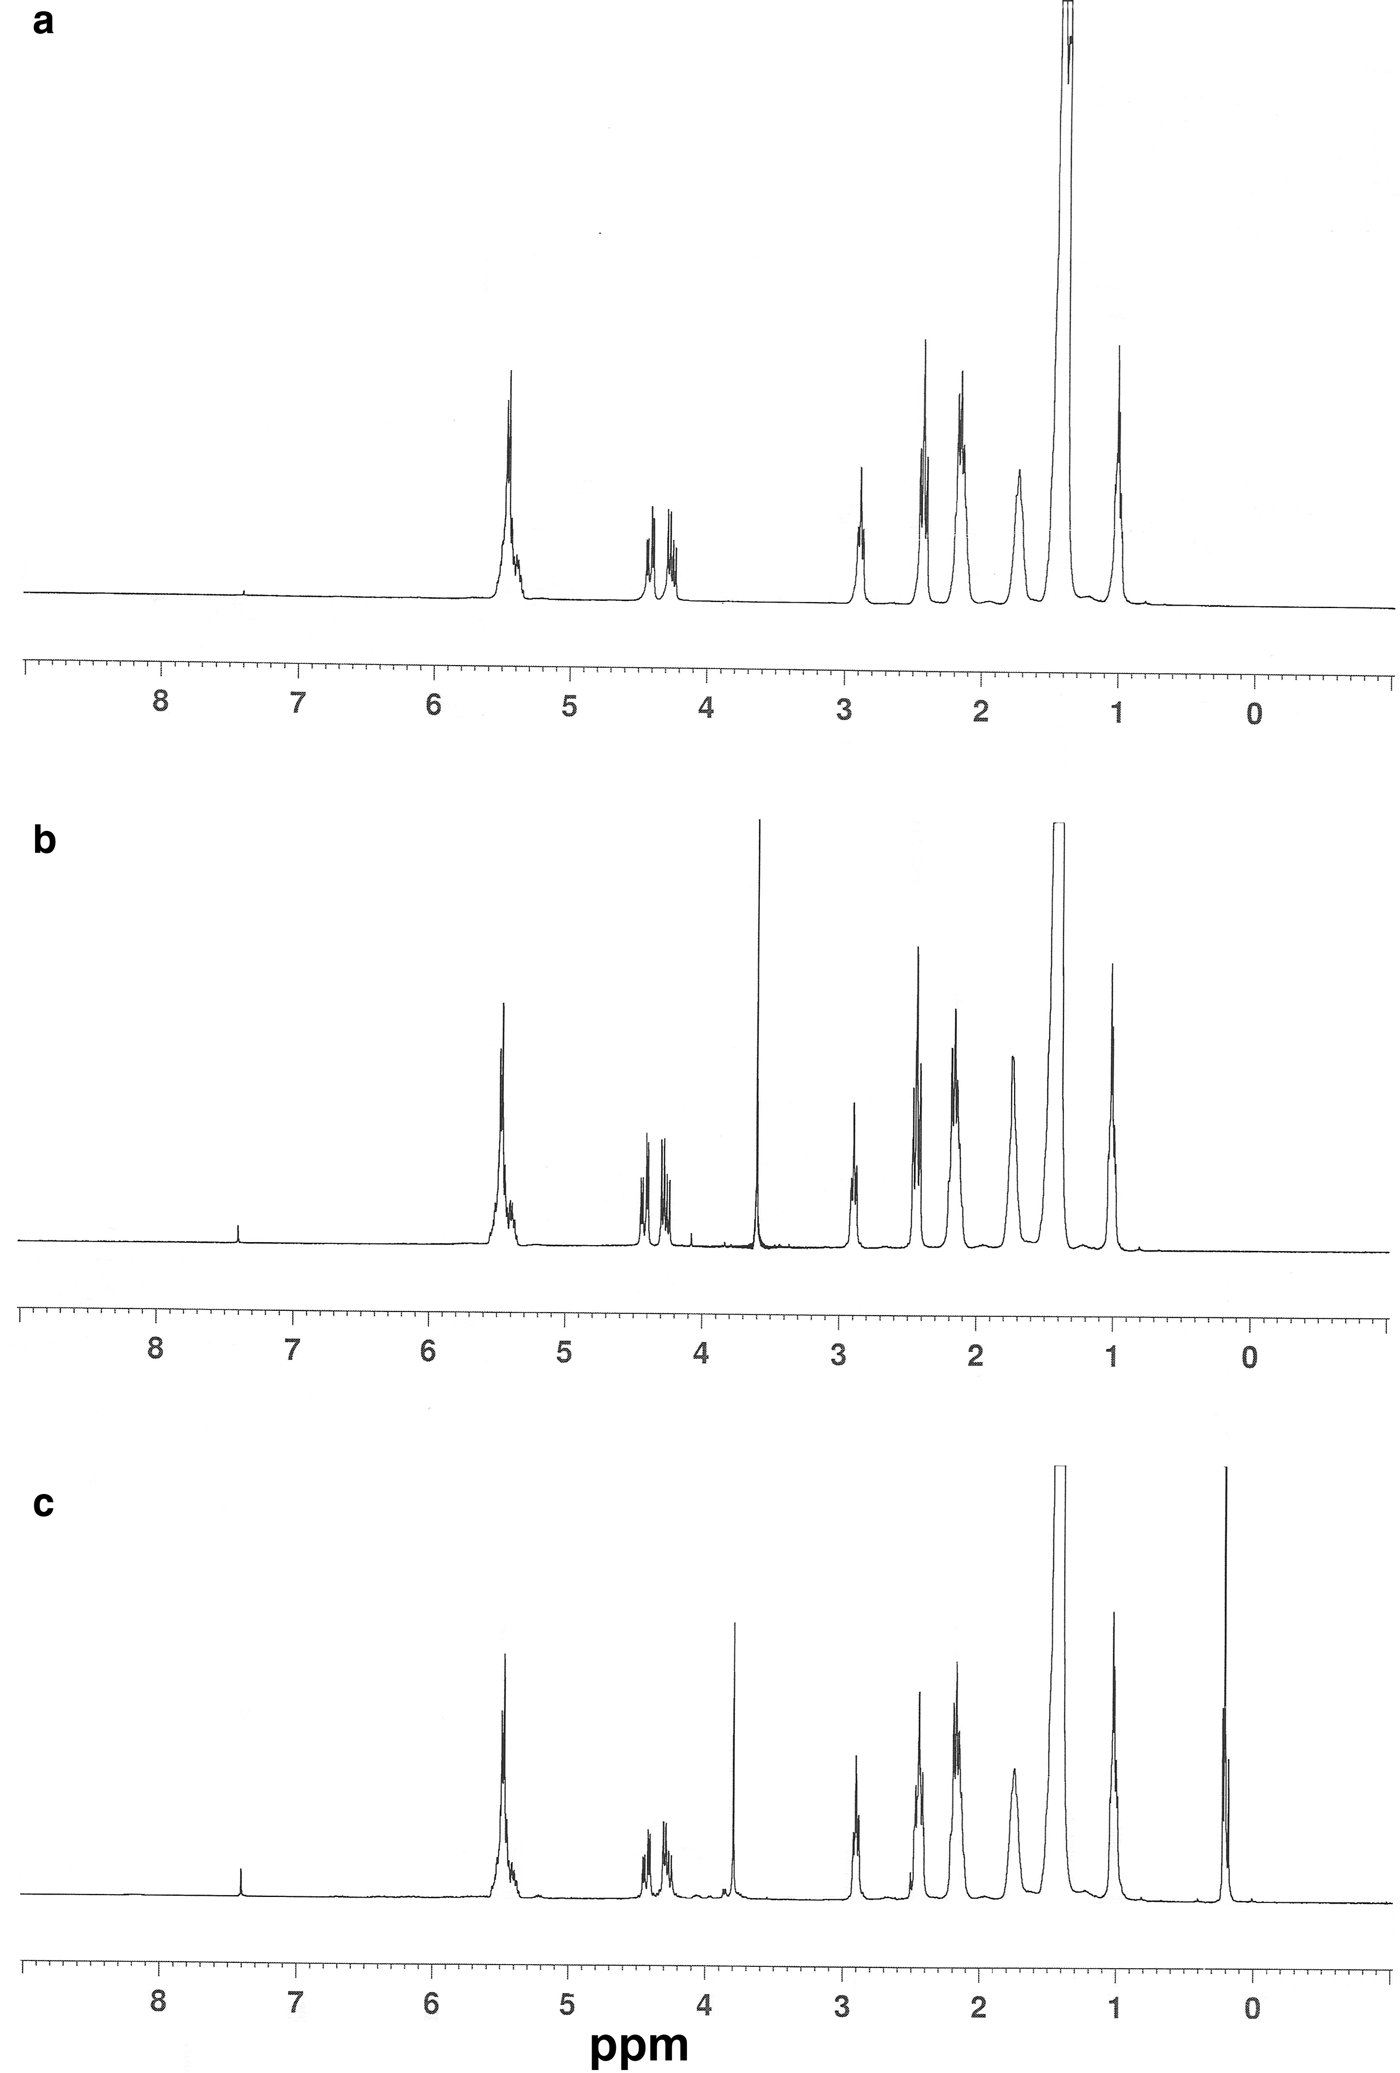
We tested kalsilite as a transesterification catalyst for sunflower oil, both fresh and used for frying, in presence of methanol at 50°C under vigorous stirring for 5 h. The oils were previously titrated to determine the free acidity that is crucial for the transesterification behaviour. It is known that oils with free acidity higher than 0.5% are not suitable for treatments with solid basic catalysts (Berrios et al., Reference Berrios, Martín, Chica and Martín2010). The sunflower oil samples showed free acidity of 0.3% for the used oil, while no free acidity was detectable in the fresh oil. The starting oil gave a 1H NMR spectrum typical for a triglyceride (Fig. 10a), where we can see all the characteristic signals: the methyl groups (at 1.0 ppm), the methylene fatty acid groups (from 1.3 to 3 ppm), the glyceride CH2 (from 4.2 to 4.5 ppm) and the unsaturated hydrogens plus the glyceride 2-CH (superimposed; at 5.3–5.6 ppm). At the beginning of the transesterification reaction, after the addition of methanol, we also observed, together with the previous signals, the typical singlet of the alcoholic methyl group at 3.6 ppm (Fig. 10b). The experimental evidence that proves the efficiency of the transesterification step is the presence of the singlet at 3.8 ppm attributable to the methyl ester groups (Fig. 10c). In fact, this peak was detected in the reaction samples previously submitted to an extended evaporation step (removing all the free methanol). Even though methyl alcohol and methyl esters possess similarly shaped signals, the shift of 0.2 ppm (from 3.6 to 3.8 ppm) demonstrates the presence of methyl esters. Transesterification yields were calculated by comparing the area of the signal relative to the methyl groups (1 ppm) with the area of the signal relative to the methyl ester group.
1H NMR spectra in CDCl3 of reaction mixture from used sunflower oil in presence of kalsilite as catalyst: (a) used oil alone; (b) reaction mixture at t = 0 min; and (c) final reaction mixture after vacuum evaporation (removing methanol).

This result confirmed the activity of kalsilite as the transesterification catalyst even at a low concentration and mild temperature: we obtained, with the used oil, a triglyceride transformation yield of 20% using a catalyst-to-oil weight ratio of 1% at 50°C (25% yield with the edible, not used, oil). We note that Wen et al., operating with a suitably modified kalsilite (with Li), obtained a total conversion but employed a 5% ratio of catalyst at a relatively higher temperature of 120°C.
Moreover, the use of an inedible but cheap and readily available oil such as used sunflower oil allows for an environmentally friendly and low-cost synthetic process. In fact, the cost of refined vegetable oils contributed to nearly 80% of the overall biodiesel production cost (Lam et al., Reference Lam, Tan, Lee and Mohamed2009); thus the alternative use of waste cooking oil as feedstock to biodiesel can reduce the overall costs of biodiesel by more than half (Lam et al., Reference Lam, Lee and Mohamed2010).
Leung et al. (Reference Leung, Wu and Leung2010) reported that actually more than 95% of biodiesel has been obtained from edible oils. This can produce several ethical and economical concerns, as these edible oils (or the equivalent raw vegetables) are subtracted from human and animal food markets, leading to higher food prices. As an alternative, it would be simple to implement recovery of used cooking oils in public eateries. We expect that used sunflower oil could become the dominant feedstock for biodiesel production in Europe, USA and much of the developed world, which vindicates our choice of this waste product for study.
Discussion and conclusions
This paper reports the synthesis and characterization of kalsilite from a kaolinitic rock, and its use in the production of biodiesel. The work both extracts further value from an abandoned kaolin quarry, and demonstrates a ‘green’ mineral synthetic process. Hydrothermal synthesis was at 190°C with pressure corresponding to the vapour pressure of water at that temperature. Crystallization of kalsilite was confirmed at 12 h in association with kaliophilite H2 as a metastable phase. After 18 h, kalsilite remained as the only silicate phase.
When comparing our work to those of other authors, a lowering of the costs of reagents, and an improvement in the temperature, yield and characterization of the final product is achieved. The temperature necessary for the transformation of kaolinite into kalsilite has been decreased from 300°C (Becerro et al., Reference Becerro, Escudero and Mantovani2009a,Reference Becerro, Mantovani and Escuderob) to 190°C, and although the reaction time had to be increased from 12 h to 18 h, an economization of the process was definitely achieved.
Becerro et al. (Reference Becerro, Escudero and Mantovani2009a,Reference Becerro, Mantovani and Escuderob), carried out the synthesis of kalsilite from a commercial kaolin that, as a starting material, is much more expensive than quarry recovery material. Generally, pure kaolin has a price ~$115/kg. More importantly, their yield was 70% and the final product contained a small percentage of anatase. In our case, however, a yield of 94.3% was achieved by quantitative analysis carried out using the QPA plus RIR methods.
The presence of opal/cristobalite in the kaolin does not represent an obstacle to the synthesis of kalsilite. As a matter of fact, Romana kaolin is used as a source of silica. The amorphous nature of some of the silica is advantageous from the point of view of reaction thermodynamics and kinetics. Similar benefits in reaction time and cost are widely documented in the literature referring to the synthesis of minerals (Novembre et al., Reference Novembre, Di Sabatino, Gimeno, Garcia Valles and Martinez Manent2004, Reference Novembre, Di Sabatino, Gimeno and Pace2011, Reference Novembre, Pace and Gimeno2014; Chaisena and Rangsriwatananon, Reference Chaisena and Rangsriwatananon2005).
This work has shown firstly that natural, impure kaolin can be used for environmentally friendly kalsilite synthesis at moderate temperature and hence low cost. Secondly, we have demonstrated that kalsilite can be used as an active transesterification catalyst with advantages in terms of low catalyst-to-oil value and low working temperature. The entire procedure, from the kalsilite synthesis to the transesterification step, can be considered particularly ‘green and low-cost’. The fact that the catalysed reaction also works with an inedible sunflower oil that has been used for frying, shows that kalsilite is a robust catalyst, able to be active even in the presence of several by-products formed during the cooking process.
Acknowledgements
The authors greatly acknowledge the technical staff at CCiT (UB) for their help during the development of the work. N.d'A. is grateful to the “Consorzio di Ricerca per l'Innovazione Tecnologica, la Qualità e la Sicurezza degli Alimenti S.C.R.L.” (ITQSA) (CIPE fundings 20.12.04; DM 28497) for financial support.