Implications
This study showed that sizeable differences in intake of grass silage exist in beef heifers for a given weight and growth and indicated that residual feed intake (RFI) has the potential to allow producers to select for more efficient cattle without any comprise in economically important performance traits when offered ensiled or grazed grass herbage. However, the absence of a difference in grazed herbage intake at pasture between animals classified on phenotypic RFI when offered a grass silage-based diet during the previous winter indoor period means that further studies emphasising intake of grazed pasture are warranted.
Introduction
The provision of feed for beef production systems is the single largest variable cost incurred by producers (Finneran et al., Reference Finneran, Crosson, Wallace, O'Kiely, Forristal and Shalloo2010). Consequently, large improvements in profitability can be gained by reducing the quantity of feed consumed per unit of production (Lancaster et al., Reference Lancaster, Carstens, Ribeiro, Tedeschi and Crews2009b). Traditionally, feed efficiency was expressed as the ratio of feed intake to live weight (LW) gain, that is, feed conversion ratio (FCR). However, FCR has a highly negative genetic correlation with average daily gain (ADG) and mature size in cattle (Schenkel et al., Reference Schenkel, Miller and Wilton2004), which indicates that selection to improve FCR would result in an increase in growth rate and mature cow size. In grass-based, calf-to-weanling and calf-to-beef systems, the cow herd consumes ∼0.85 and 0.50 of total feed inputs, respectively (McGee, Reference McGee2009). As about two-thirds of energy consumed by beef cattle is directed towards maintenance requirements, this means that maintenance of the cow herd is a considerable proportion of total costs in beef production systems (Ferrell and Jenkins, Reference Ferrell and Jenkins1985; Montano-Bermudez and Nielsen, Reference Montano-Bermudez and Nielsen1990). Thus, selecting animals on the basis of FCR may improve efficiency during the growth and finishing stages of beef production; however, it may not improve the efficiency or profitability of the whole production system (Archer et al., Reference Archer, Richardson, Herd and Arthur1999).
Koch et al. (Reference Koch, Swiger, Chambers and Gregory1963) proposed an alternative measure of feed efficiency called residual feed intake (RFI), which is independent of growth and body size. It is defined as the difference between an animal's actual feed intake and predicted feed intake, with negative or lower values desirable (Crews, Reference Crews2005). This trait is moderately heritable 0.45 (Crowley et al., Reference Crowley, McGee, Kenny, Crews, Evans and Berry2010); therefore, selecting herd replacements from low RFI animals should give rise to feed efficient cows and progeny with lower maintenance requirements, without compromising growth.
Research to date has predominately focused on examining the RFI trait in cattle fed high-energy-dense diets with little information pertaining to cattle offered grass-based diets. The objectives of this study were (i) to quantify the phenotypic variation in RFI of beef heifers offered a grass silage-based diet and to examine the associations between RFI and total tract digestibility, blood variables, ultrasonic and body measurements, performance traits and (ii) to quantify the difference in grazed herbage intake between beef heifers classified as low, medium or high phenotypic RFI when offered a grass silage-based diet during the previous winter indoor period.
Material and methods
Location and site characteristics
The study was carried out at Teagasc, Animal & Grassland Research and Innovation Centre, Grange (Longitude 6°40′W; Latitude 53°30′N; Elevation 92 m above sea level) between 30 October 2008 and 20 October 2009 and comprised an indoor winter period (November to April) and a grazing season (April to October). The soil type was a moderately well drained brown earth of medium to high base content and of clay loam texture, and the previous 20-year (1988 to 2008) mean annual rainfall, duration of sunshine hours and daily ground temperature were 864 mm, 1239 h and 9.3°C, respectively. The previous 10-year (1998 to 2008) mean annual grass production at the research centre was 11.2 t dry matter (DM)/ha, determined according to O'Riordan (Reference O'Riordan1997).
Animals and management
All animal procedures performed in this study were conducted under experimental licence from the Irish Department of Health and Children in accordance with the Cruelty to Animals Act 1876 and the European Communities (Amendment of Cruelty to Animals Act 1876) Regulation 2002 and 2005.
Eighty-five beef heifers, comprising 63 purebred Simmentals and 22 Simmental × Holstein–Friesians, were identified and purchased from Irish pedigree and commercial beef farms and assembled at Teagasc Grange in autumn 2006. Sire selection was based on their estimated breeding value (EBV) for RFI, calculated using a data set from the Irish National Beef Bull Performance Test Station, Tully, Co. Kildare (Crowley et al., Reference Crowley, McGee, Kenny, Crews, Evans and Berry2010). There were two individual animal feed intake measurement periods; the first, during the winter indoor feeding period (RFI measurement period: 19 December 2006 to 13 March 2007) and the second, when grazing autumn pasture (grazed herbage intake period: 17 September to 19 October 2007).
Before commencing the indoor feeding experiment, animals were rotationally grazed at pasture and offered 1 kg/head per day of a barley-based concentrate. At the end of the grazing season (27 November 2006), they were housed in a slatted floor building, and accommodated in pens of 4 to 6 animals (lying area = 2.87 m2/animal) with a Calan gate feeding system (American Calan Inc., Northwood, NH, USA). Mean age and weight at the beginning of the test period was 299 days (s.d. = 48.3) and 311 kg (s.d. = 48.8), respectively. Heifers were individually offered grass silage and 2 kg of concentrate once per day (at 0800 h), and each received 30 g of a top-dressed mineral and vitamin supplement daily. All animals had continuous access to clean, fresh water.
The grass silage was harvested from a primary growth sward, which consisted mainly of perennial ryegrass, on 2 June. It was mowed with a rotary mower and harvested, without additive, using a precision-chop harvester and stored in bunker silos and compacted to ensure expulsion of air before sealing with two layers of black polythene sheeting weighted with tyres. The concentrate offered contained 430 kg rolled barley, 430 kg beet pulp, 80 kg soya bean meal, 45 kg molasses and 15 kg minerals and vitamins per tonne. As supplementary concentrates are generally fed separate to grass silage in Ireland, the feeding regime employed reflected this practice.
Heifers were given an adaptation and training period of 21 days to acclimatise to the diet and the electronically controlled Calan gates before recording individual dry matter intake (DMI) over an 84-day period (RFI measurement period).
Animals were turned out to pasture 29 days after the RFI measurement period ended (11 April) and were bred to Simmental sires (low phenotypic RFI heifers bred to low EBV RFI bulls and high phenotypic RFI heifers bred to high EBV RFI bulls), commencing on 23 May, by either artificial insemination or natural mating for a 3-month period. For the duration of the grazing season, heifers were grazed as four groups of 21 (2 × low phenotypic RFI and 2 × high phenotypic RFI), except for the final 4 weeks of the breeding season when they grazed as two groups of 42 (one low and one high phenotypic RFI) to facilitate the introduction of two stock bulls (one of high and one of low EBV for RFI). Within the same paddocks, they rotationally grazed adjacent to one another as four (or two) separate herds separated by temporary electric fencing under a moderate stocking rate on predominately perennial ryegrass (Lolium perenne L.) pasture until housing on 30 October, when the experiment ended.
Before turn-out to pasture, three heifers were removed from the study for reasons unrelated to treatment, and in order to have the same stocking rate in the four grazing groups two comparable heifers were included to balance numbers.
Animal health
Upon arrival at the research centre, all heifers were immunised against infectious bovine rhinotracheitis virus (IBRv; Bovilis IBR; Intervet Ireland Ltd, Dublin, Ireland), bovine viral diarrhoea virus (BVDv), respiratory syncytial virus, parainfluenza III virus (Rispoval 3; Pfizer Animal Health, Cork, Ireland) and blackleg (Cl. Chauvoel; Blackleg Vaccine Suspension for Injection, Pfizer). The heifers were treated for the control of internal and external parasites at housing (Trodax 34%, Merial Animal Health Ltd, Buckinghamshire, UK; Dectamex Pour-On Solution, Pfizer) and during the grazing season (Qualimec Solution for Injection, Janssen Animal Health, High Wycombe, UK). Before the breeding season, they were immunised against leptospirosis (Leptovoid-H, Intervet, Schering-Plough Animal Health, Walton, UK) and BVD (Pregsure, Pfizer, Kent, UK).
Feed intake
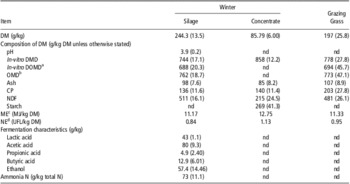
Grass silage offered was based on ∼1.1 times the previous day's intake. Refused silage was recorded daily for each animal and discarded twice weekly. Total daily DMI was computed as DM of silage offered daily minus DM of silage refused daily for each animal. Silage offered and refused was sampled three and two times weekly, respectively, and concentrate offered was sampled once weekly. All samples were stored at −20°C before processing. Samples of silage and concentrate were subsequently composited on a weekly and bi-weekly basis, respectively. Sample processing and chemical analysis was as described by Owens et al. (Reference Owens, McGee, Boland and O'Kiely2008a) with the exception that DM content of the grass silage was determined after drying at 40°C for 48 h. The chemical composition and in vitro dry matter digestibility (DMD) of the grass silage and concentrate offered is outlined in Table 1.
Mean (s.d. in brackets) chemical composition of the feeds offered

DM = dry matter; DMD = dry matter digestibility; DOMD = digestible organic matter in dry matter; OMD = organic matter digestibility; ME = metabolisable energy; NE = net energy; OM = organic matter.
aDigestible OM in the total DM, measured in vitro.
bOMD measured in vitro.
cEstimated based on in vitro digestible OM in total DM (AFRC, 1993).
d Unite Fourragere Lait (Jarrige, Reference Jarrige1989; O'Mara, Reference O'Mara1996).
Individual grass herbage DMI was estimated once for 82 heifers (out of the original 85 animals) over a 6-day period between mid-September and early October, using the n-alkane technique (Mayes et al., Reference Mayes, Lamb and Colgrove1986), by means of a ‘controlled release capsule’ (Captec (NZ) Ltd, Auckland, New Zealand). Dosing, sampling and processing methodology used was as described by Clarke et al. (Reference Clarke, Drennan, McGee, Kenny, Evans and Berry2009). For logistical reasons, grass herbage DMI was estimated over two consecutive periods using two groups (1 Low and 1 High RFI) of heifers on each occasion. To ensure unrestricted availability of herbage during the intake recording period, each grazing group was moved to a new paddock every second day.
Herbage measurements
During the grazing season and herbage intake period, compressed sward height and herbage mass (above the 4 cm horizon) was calculated in each paddock before and after grazing. Sward height was measured using an electronic rising plate meter (Jenquip, Fielding, New Zealand) with a metal plate (0.1 m2 and 4.97 kg/m2) by taking 50 measurements in a ‘W’ pattern across each paddock. Target post-grazing stubble height was 5.5 cm. Herbage mass was determined by cutting four strips of grass 5.0 m long per paddock with a rotary lawnmower (Honda HRD536C, Slough, Berkshire, UK, cutting blade width 0.53 m) and the grass harvested was collected and weighed.
Mean pre-grazing and post-grazing compressed sward heights during the grazing season were 11.5 cm (s.d. = 3.6) and 5.6 cm (s.d. = 1.11), respectively. Corresponding values during the herbage intake period were 7.7 cm (s.d. = 1.45) and 5.4 cm (s.d. = 1.19). Mean pre-grazing and post-grazing herbage mass was 2066 (s.d. = 911) and 896 (s.d. = 494) kg DM/ha during the grazing season and during the herbage intake period was 1378 (s.d. = 449) and 816 (s.d. = 499) kg DM/ha, respectively. In addition, apparent daily group herbage intake was estimated during the course of the grazing season. It was calculated as the difference between pre-grazing and post-grazing herbage mass divided by the number of animals in each grazing group and the grazing residence time.
To determine chemical composition of the sward during the grazed herbage intake estimation period, ∼30 representative herbage samples were taken with a Gardena hand shears (Accu 60, Gardena International GmbH, Ulm, Germany) from each paddock pre- and post-grazing. The sample (ca 0.3 kg) was thoroughly mixed and a sub-sample (ca 100 g) was dried for 24 h at 98°C for DM determination. Sample processing and chemical analysis was as described by Owens et al. (Reference Owens, McGee and Boland2008b). The chemical composition and in vitro digestibility of the grazed herbage offered is outlined in Table 1.
Morphological composition of the herbage was also determined during the herbage intake estimation period. Thirty samples (ca 150 g) were cut at random to ground level using a Gardena shears. Samples were then manually separated into leaf, stem and dead material and each component was weighed and oven-dried for 24 h at 98°C to determine morphological composition on a DM basis. During the grazed herbage intake period, the proportion of leaf, dead material and stem in the swards was 0.88, 0.07 and 0.05, respectively.
LW and body condition score (BCS)
Heifers were weighed (before feeding) and BCS (Lowman et al., Reference Lowman, Scott and Somerville1976) was determined on 2 consecutive days at both the beginning and end of the RFI measurement period and at 21-day intervals during the intervening period. Heifer LW and BCS was also recorded at turn-out to pasture, at the beginning and end of the grazed herbage intake estimation period, and at the end of the grazing season.
Ultrasonic measurements, skeletal and muscular scores
In order to characterise body composition, heifers were ultrasonically scanned at the beginning and end of the RFI measurement period. A dynamic imaging real-time scanner (model – Concept MLV, with a 3.5 MHz linear array transducer, Livingston, UK) was used to measure M. longissimus depth at the third lumbar vertebra, and fat depth at both the third lumbar vertebra and 13th thoracic rib on the animal's right side as described by Conroy et al. (Reference Conroy, Drennan, Kenny and McGee2010).
At the time of ultrasound scanning, linear body measurements (Campion et al., Reference Campion, Keane, Kenny and Berry2009) were determined on each animal to provide a quantitative measurement of skeletal size. The measurements taken were: length of back, height at withers, chest circumference, chest depth and width of pelvis.
During the middle of the RFI measurement period, visual muscular scores were assigned to each animal at three locations; roundness of hind-quarter, width of hind-quarter and width/depth of loin; on a scale of 1 (hollow, poor muscle development) to 15 (wide, heavily muscled) as described by Conroy et al. (Reference Conroy, Drennan, Kenny and McGee2010).
Blood variables
Blood samples were obtained by jugular venipuncture from each animal before feeding on days 16, 37, 58 and 79 of the RFI measurement period. On each occasion, blood was collected into a 9- and 4-ml evacuated tubes containing lithium heparin and sodium fluoride-ethylenediaminetetraacetic acid (EDTA) K3, respectively, as anticoagulants (Greiner Vacuette, Cruinn Diagnostics, Dublin, Ireland). Blood samples were then centrifuged (2500 × g, 20 min, 4°C), and the plasma was stored at −20°C until analysis. On each blood sampling occasion, plasma concentrations of albumin, urea, globulin, total protein, β-hydroxybutyrate (βHB), glucose, non-esterified fatty acid (NEFA), creatinine and triglycerides were determined according to the procedures described by Lawrence et al. (Reference Lawrence, Kenny, Earley, Crews and McGee2011a) and plasma insulin and insulin-like growth factor-1 (IGF-1) concentrations were determined according to the procedures described by Kelly et al. (Reference Kelly, McGee, Crews, Fahey, Wylie and Kenny2010a). In addition, plasma concentrations of aspartate aminotransferase, alkaline phosphatase, creatine kinase, fibrinogen, haptoglobin, total antioxidant status (TAS) and total bilirubin were determined on days 16 and 79 according to the procedures described by Lawrence et al. (Reference Lawrence, Kenny, Earley, Crews and McGee2011a).
On days 16 and 79, further blood samples were collected. One was collected into a 4-ml evacuated tube containing sodium citrate and one was collected into a 6-ml evacuated tube containing K3 EDTA. Blood haematology variables, white blood cell (WBC) number, red blood cell (RBC) number, haemoglobin (Hgb) concentration, haematocrit percentage (HCT %), and total circulating neutrophil, lymphocyte, monocyte, eosinophil and basophil numbers were determined using an automated electronic particle analyzer (Celltac, MEK-6108K, Nihon-Kohdon, Tokyo, Japan) within 1 h of blood sampling.
Blood collected into vacutainer tubes containing lithium heparin were used to determine the in vitro production of interferon-γ (IFN-γ) following stimulation of lymphocytes by the novel mitogen concanavalin A (Con A) and phytohaemaglutinin (PHA) in whole blood cultures as described by Gupta et al. (Reference Gupta, Earley and Crowe2007).
Total tract digestibility
At the end of the RFI measurement period, 18 purebred Simmental heifers were selected on the basis of divergence in phenotypic RFI (9 highest RFI and 9 lowest RFI) and were individually offered grass silage ad libitum plus 2 kg of concentrate daily through electronically controlled Calan gates. The nutritive value of the grass silage was lower (DM = 300 g/kg; DMD = 676 g/kg; CP = 152 g/kg; digestible organic matter in dry matter = 603 g/kg; NDF = 550 g/kg; organic matter digestibility = 662 g/kg) than that offered during the RFI measurement period and the concentrate was the same as that described earlier.
Using AIA as an indigestible marker, total tract digestibility coefficients were determined (Owens et al., Reference Owens, McGee, Boland and O'Kiely2008a). Faecal grab samples (2 × 200 g) were obtained from each animal via rectal palpation once daily at 0800 h before feeding over 5 consecutive days. Faecal samples were stored at −20°C, and at the end of the sampling period samples were thawed and pooled on an equal weight basis, per animal. During the sampling period, mineral and vitamin supplement was not offered, and feed offered and refused was sampled daily. Individual feed refusals were pooled per animal at the end of the sampling period.
Activity behaviour
The proportion of time spent lying, standing and active was measured indoors on the 18 purebred Simmental heifers selected on the basis of divergence in phenotypic RFI, by fitting IceTagTM pedometers (IceTagTM 2.004, IceRobotics, Midlothian, Scotland, UK) with Velcro straps (Trenel et al., Reference Trenel, Jensen, Decker and Skjøth2009) to the animals’ back left leg for a period of 5 consecutive days. Data for the last 4 days were used in the analysis. Activity behaviour was also measured on 76 heifers over 5 days during the grazed herbage intake estimation period. Data for the last 3 days were used in the analysis.
Computation of traits
ADG during the RFI measurement period for each animal was computed as the coefficient of the linear regression of LW (kg) on time by using the REG procedure (SAS Institute Inc., Cary, NC, USA). Mid-test metabolic LW (MLW) was determined as LW0.75 42 days before the end of the test, which was estimated from the intercept and slope of the regression line after fitting a linear regression through all LW0.75 observations. Total daily DMI was calculated as the mean of the daily quantities of feed offered minus the subsequent refusals over the 84-day recording period, corrected for DM concentration. FCR of each animal was computed as the ratio of average daily DMI to ADG.
RFI was calculated for each animal as the difference between actual DMI and expected DMI. Expected DMI was computed for each animal using a multiple regression model, regressing DMI on MLW and ADG with breed included as a fixed effect. The model used was

where Yj is the average DMI of the jth animal, β 0 is the partial regression intercept, τi is the fixed effect of breed, β 1 is the partial regression coefficient on MLW0.75, β 2 is the partial regression coefficient on ADG and ej is the uncontrolled error of the jth animal. The coefficient of determination (R 2) from this model was equal to 0.66 (P < 0.001) and the model was subsequently used to predict DMI for each animal. Standard deviations above and below the mean were used to classify animals to high RFI (RFI > 0.5 s.d. above the mean), medium RFI (RFI ± 0.5 s.d. above and below the mean) and low RFI (RFI < 0.5 s.d. below the mean) groupings. RFI was also calculated on a net energy intake (NE) basis (Unite Fourragere Lait (UFL)). The NE values for the grass silage and concentrate were estimated using the French NE system (Jarrige, Reference Jarrige1989), modified for Irish conditions (O'Mara, Reference O'Mara1996). Expected NE intake was determined for each animal as described above, using a multiple regression model, and NE RFI was computed as the difference between actual NE intake minus the expected NE intake.
Statistical analysis
Normality of data distribution was tested using the UNIVARIATE procedure of SAS 9.1 (SAS Institute Inc.). Data that were not normally distributed were transformed by raising the variable to the power of lambda. The required lambda value was calculated by conducting a Box–Cox transformation analysis using TRANSREG procedure of SAS. Data subject to transformation were used to calculate P-values. However, the corresponding least squares means and standard error of the non-transformed data are presented to facilitate interpretation of results. Least squares procedure of SAS was used to examine the effect of RFI groupings on intake, performance traits, body composition, total tract digestibility and activity behaviour. The initial statistical model included the fixed effects of RFI group (high, medium and low), breed, RFI group × breed, age and pen number. A random sire effect was included in the final model for all traits; however, potential relationships among sires and degree of inbreeding were ignored. In addition, the model used to analyse total tract digestibility included day of collection period as a random effect. Model effects were considered statistically significant when Type I error rate was less than 5%. Plasma metabolites having multiple observations were analysed using repeated measures ANOVA (PROC MIXED procedure of SAS), with terms for RFI group, day of test and their interaction included in the model and animal within RFI group set as the error term. If the interaction term was not statistically significant (P > 0.05), it was subsequently excluded from the final model. The type of variance–covariance structure used was chosen depending on the magnitude of the Akaike information criterion (AIC) for models run under compound symmetry, unstructured, autoregressive or Toeplitz variance–covariance structures. The model with the least AIC value was selected. Differences in RFI group were determined by F-tests using Type III sum of squares. The PDIFF option and the Tukey test was applied as appropriate to evaluate pairwise comparisons between the RFI group means. Data were considered statistically significant when P < 0.05. Pearson correlation coefficients among traits were determined using the CORR procedure of SAS.
Results
Animal performance and feed efficiency
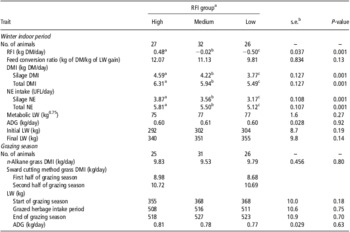
During the RFI measurement period, heifers had a mean DMI of 5.82 kg/day (s.d. = 0.73), NE intake of 5.40 UFL/day (s.d. = 0.62), an ADG of 0.53 kg (s.d. = 0.18) and an FCR of 12.24 kg DMI/kg of LW gain (s.d. = 4.60). RFI averaged 0.00 kg DM/day (s.d. = 0.43) and ranged from −0.87 to 1.02 kg DM/day, equating to a difference of 1.89 kg DM/day between the most and least efficient ranking heifers. Because a fixed amount of concentrate was offered and therefore low RFI animals consumed a diet of slightly greater (0.01) overall energy content than high RFI animals, RFI was also calculated on an NE basis. Animal ranking for RFI was identical when expressed on a DMI or NE basis (P < 0.001; r = 1.00); consequently, results are presented on a DMI basis.
Total NE intake paralleled total DMI, whereby heifers in the low RFI group consumed 0.06 and 0.15 (P < 0.001) less feed during the RFI measurement period than their counterparts ranked as either medium or high RFI groups, respectively (Table 2). There was no difference (P > 0.05) in grazed grass herbage intake between the RFI groups. Heifers in the high, medium and low RFI groups did not differ (P > 0.05) in LW, ADG or FCR at any stage of measurement. RFI was strongly correlated with DMI (r = 0.59; P < 0.001) during the RFI measurement period but not with DMI of grazed herbage (r = 0.06; P = 0.57). DMI during the RFI measurement period (r = 0.52) and the grazed herbage intake period (r = 0.28) was positively correlated (P < 0.05) with respective LW. During the RFI measurement period, DMI was positively correlated (P < 0.001) with ADG (r = 0.55) and negatively correlated (P < 0.05) with FCR (r = −0.27). FCR was negatively correlated (P < 0.001) with ADG during the RFI measurement period (r = −0.85).
Characterisation of intake, growth and energetic efficiency traits in beef heifers with high, medium and low RFI

RFI = residual feed intake; DM = dry matter; LW = live weight; DMI = dry matter intake; NE = net energy; UFL = Unite Fourragere Lait; ADG = average daily gain; LSmeans = least squares means.
Within a row, LSmeans without a common superscript letter differ (P < 0.05).
aHigh RFI = inefficient; Medium RFI = intermediate; Low RFI = efficient.
bs.e. = maximum standard error.
Body composition and skeletal measurements
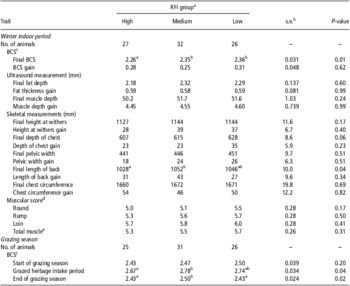
During the RFI measurement period, the RFI groups did not differ (P > 0.05) in ultrasonically scanned fat thickness, M. longissimus dorsi depth or visual muscular scores (Table 3). At the end of the RFI measurement period, high RFI animals had lower (P < 0.01) BCS than medium and low RFI animals, but BCS change did not differ (P > 0.05) between RFI groups. During the grazed herbage intake period, high RFI animals had lower (P < 0.05) BCS than medium RFI animals, with low RFI animals being intermediate; at the end of the grazing season, medium RFI animals had greater (P < 0.05) BCS than high and low RFI animals. Differences between RFI groups were not detected (P > 0.05) for skeletal measurements except for back length at the end of the RFI measurement period, which was shorter (P < 0.05) for high RFI than medium RFI animals, with low RFI animals being intermediate.
Characterisation of body composition in beef heifers with high, medium, and low RFI

RFI = residual feed intake; BCS = body condition score; LSmeans = least squares means.
Within a row, LSmeans without a common superscript letter differ (P < 0.05).
aHigh RFI = inefficient; Medium RFI = intermediate; Low RFI = efficient.
bs.e. = maximum standard error.
cScale of 0 (emaciated) to 5 (obese).
dScale of 1 (hollow, poorly muscled) to 15 (wide, thick muscled).
eMean of round, rump and loin.
Blood variables
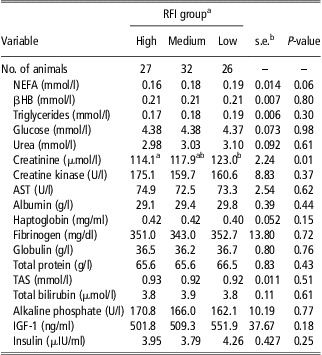
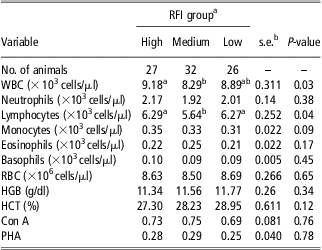
Sampling day affected (P < 0.05) concentrations of all metabolites except (P > 0.05) fibrinogen, TAS and metabolic hormone IGF-1 concentrations during the RFI measurement period, but there was no RFI × sampling day interactions for these variables. Therefore, the blood hormone and metabolite data presented in Table 4 is the mean of the 4 blood sampling days for animals with high, medium or low RFI. Concentrations of plasma metabolites did not differ (P > 0.05) between RFI groups except for creatinine concentrations, which were greater (P < 0.05) in low RFI than high RFI heifers, with medium RFI heifers being intermediate. There was no interaction (P > 0.05) between blood sampling day and RFI for haematology variables; hence, the results presented in Table 5 are mean values from the two blood sampling days (days 16 and 79). Ranking heifers on the basis of RFI had no effect (P > 0.05) on Con A or PHA-induced IFN-γ production or any of the blood haematological variables measured except WBC and lymphocyte count. High RFI animals had greater (P < 0.05) WBC than medium RFI animals, with low RFI animals being intermediate, and high and low RFI heifers had greater (P < 0.05) lymphocyte count than medium RFI heifers.
Characterisation of blood metabolite variables (LSmeans) in beef heifers with high, medium and low RFI

LSmeans = least squares means; RFI = residual feed intake; NEFA = non-esterified fatty acids; βHB = β-hydroxybutyrate; AST = aspartate aminotransferase; TAS = total antioxidant status; IGF-1 = insulin-like growth factor-1.
Within a row, LSmeans without a common superscript letter differ (P < 0.05).
aHigh RFI = inefficient; Medium RFI = intermediate; Low RFI = efficient.
bs.e. = maximum standard error.
Characterisation of blood haematology and immune variables (LSmeans) in cows with high, medium and low RFI

LSmeans = least squares means; RFI = residual feed intake; WBC = white blood cell count; RBC = red blood cell count; HGB = haemoglobin; HCT = haematocrit %; Con A = concanavalin A; PHA = phytohaemaglutinin.
Within a row, LSmeans without a common superscript letter differ (P < 0.05).
aHigh RFI = inefficient; Medium RFI = intermediate; Low RFI = efficient.
bs.e. = maximum standard error.
Total tract digestibility and activity behaviour
Total tract DM digestibility did not differ (P > 0.05) between the two divergent sub-populations for high and low phenotypic RFI (567 v. 582 g/kg). During this measurement period, there was a 0.12 difference (P < 0.05) in DMI between the high and low RFI groups (7.27 v. 6.40 kg).
There was no difference (P > 0.05) between the two sub-populations of high and low phenotypic RFI heifers in the proportion of time spent standing (0.512 v. 0.492), active (0.031 v. 0.032) or lying (0.457 v. 0.475) indoors. However, during the grazed herbage intake period, the proportion of time standing was greater (P < 0.05) for the high RFI (0.479) than medium (0.456) and low (0.456) RFI groups, and consequently the high RFI group spent less (P < 0.05) time lying than medium and low RFI groups (0.462 v. 0.486 v. 0.487, respectively). There was no difference (P > 0.05) in the proportion of time spent active between the three RFI groups.
Discussion
Production context
Grass, either grazed or conserved, is the main source of feed for beef cattle production systems in most regions of Northern and Western Europe because of the prevailing temperate climatic conditions. Seasonality of grass growth means that such production systems usually consist of a grazing season and an indoor winter period, with grass silage generally providing the winter forage (Mayne and O'Kiely, Reference Mayne and O'Kiely2005). Indeed, in Ireland, ∼0.54 of the lifetime weight gain of beef cattle is typically derived from grazed grass, 0.24 from grass silage and 0.22 from supplementary concentrates (O'Donovan et al., Reference O'Donovan, Lewis, Boland and O'Kiely2010).
Owing to the inverse relationship between LW gain of weanling cattle on grass silage-based diets in winter and subsequent gain at pasture (McGee, Reference McGee2005), the feeding strategy for the weanling heifers during the first winter was designed to exploit compensatory growth potential (Drennan and McGee, Reference Drennan and McGee2009). This feeding management is common commercial practice in grass-based beef systems. Animals are usually offered forage-based diets of moderate nutritive value (i.e. nutrient restriction) over the more expensive indoor winter period (store period), which results in compensatory growth subsequently when grazing more cheaply produced, higher nutritive value grass herbage (Kyne et al., Reference Kyne, Drennan and Caffrey2001). Typically, concentrates are offered separately to grass silage.
Published literature examining the RFI trait in beef cattle is predominately based on studies where animals were offered non-grass forages and typically high concentrate diets under finishing regimen. There is little published information examining RFI calculated on breeding females within the context of grass-based suckler beef production systems.
Animal performance and feed efficiency
In the current study, a fixed level of concentrates was offered to all animals, and thus consequently RFI was ‘expressed’ by the animal on the forage component of the diet. Although low RFI animals consumed proportionately less grass silage (0.69 v. 0.73) and therefore proportionately more concentrates in their diet than high RFI animals, NE intake per kg DM consumed was similar (0.93 and 0.92 UFL/kg DM, respectively). In addition, RFI was calculated on an NE basis to determine whether animal ranking in RFI was affected. This was not the case under the conditions employed here as ranking of animals based on DMI or NE intake was identical.
The base RFI regression model (DMI explained by MLW and ADG) in this study accounted for 0.66 of the variation in DMI, which is comparable to other studies (Lancaster et al., Reference Lancaster, Carstens, Riberio, Davis, Lyons and Welsh2008 and Reference Lancaster, Carstens, Crews, Welsh, Forbes, Forrest, Tedeschi, Randel and Rouquette2009a; Shaffer et al., Reference Shaffer, Turk, Wagner and Felton2011) where high forage diets were fed (R 2 range from 0.53 to 0.64). These values are lower than those (0.71 to 0.77) obtained when RFI is determined on cattle fed high-energy diets (Basarab et al., Reference Basarab, Price, Aalhus, Okine, Snelling and Lyle2003; Lancaster et al., Reference Lancaster, Carstens, Ribeiro, Tedeschi and Crews2009b; Kelly et al., Reference Kelly, McGee, Crews, Fahey, Wylie and Kenny2010a). This may be partially due to the diets offered. As DMI depends on forage ingestibility or rumen fill value (Dulphy et al., Reference Dulphy, Faverdin and Jarrige1989) and the fill value of grass silage is higher than energy-dense concentrate-based diets, feeding high forage diets may restrict an animal's inherent feed intake capacity. This restriction in intake is largely due to the slow rate at which ruminal fermentation allows digestion of fibre and onward passage of digesta (Steen et al., Reference Steen, Gordon, Dawson, Park, Mayne, Agnew, Kilpatrick and Porter1998; Forbes, Reference Forbes2005). The DMD of the grass silage offered in the current study was higher than that typically produced on farms in Ireland (Keating and O'Kiely, Reference Keating and O'Kiely1997) but similar to that typically used in research farm systems studies (Drennan and McGee, Reference Drennan and McGee2009).
The phenotypic variance of RFI (0.18) in this study was similar to the values reported by Kelly et al. (Reference Kelly, McGee, Crews, Fahey, Wylie and Kenny2010a and Reference Kelly, McGee, Crews, Sweeney, Boland and Kenny2010b) who fed a high-energy total mixed ration-based diet to heifers. Studies using low-energy roughage-based diets (Arthur et al., Reference Arthur, Renand and Krauss2001b; Lancaster et al., Reference Lancaster, Carstens, Crews, Welsh, Forbes, Forrest, Tedeschi, Randel and Rouquette2009a; Shaffer et al., Reference Shaffer, Turk, Wagner and Felton2011) generally report larger s.d. of RFI (range of 0.71 to 0.97 v. 0.61 to 0.88) compared with those using high-energy grain-based diets (Nkrumah et al., Reference Nkrumah, Basarab, Wang, Li, Price, Okine, Crews and Moore2007; Lancaster et al., Reference Lancaster, Carstens, Riberio, Davis, Lyons and Welsh2008 and Reference Lancaster, Carstens, Ribeiro, Tedeschi and Crews2009b). However, Durunna et al. (Reference Durunna, Mujibi, Goonewardene, Okine, Basarab, Wang and Moore2011) found that the s.d. of RFI measured in the same cohort of steers fed a low-energy diet during the growing phase was lower than when RFI was measured using a high-energy diet during the finishing phase. As stated earlier, this may be due to the bulky nature of roughage-based diet and may therefore restrict the animals’ true inherent ability to consume food.
As expected, there were no correlations between RFI and ADG and LW, because of the mathematical design of the trait (Crews, Reference Crews2005). Contrary to FCR, there was no association observed between RFI and age or LW at the beginning of the test, indicating that RFI is a robust measure of feed efficiency (Kelly et al., Reference Kelly, McGee, Crews, Sweeney, Boland and Kenny2010b). The correlation between DMI and RFI during the RFI measurement period is in accordance with the values obtained (0.47 to 0.70) in previous studies (Arthur et al., Reference Arthur, Archer, Johnston, Herd, Richardson and Parnell2001a; Lancaster et al., Reference Lancaster, Carstens, Crews, Welsh, Forbes, Forrest, Tedeschi, Randel and Rouquette2009a; Kelly et al., Reference Kelly, McGee, Crews, Fahey, Wylie and Kenny2010a). The strong relationship between DMI and LW provides further evidence that DMI increases with body size (Petit et al., Reference Petit, Jarrige, Russel and Wright1992), resulting in greater feed consumption and therefore greater maintenance energy requirements, as described by Archer et al. (Reference Archer, Richardson, Herd and Arthur1999). During the RFI measurement period, low RFI heifers consumed 0.15 less feed than their high RFI contemporaries. Similarly, Kelly et al. (Reference Kelly, McGee, Crews, Fahey, Wylie and Kenny2010a) found a similar difference in DMI in heifers offered a 70 : 30 corn silage : concentrate diet.
FCR was negatively correlated with ADG as also observed by Schenkel et al. (Reference Schenkel, Miller and Wilton2004) and Kelly et al. (Reference Kelly, McGee, Crews, Lynch, Wylie, Evans and Kenny2011). Given the positive relationship with ADG and mature size (Herd et al., Reference Herd, Oddy and Richardson2004), this would suggest that selecting animals on the basis of FCR would likely result in increasing growth rates and mature size and thus maintenance energy costs particularly in the breeding herd (Basarab et al., Reference Basarab, McCartney, Okine and Baron2007). Unlike previous studies (Lancaster et al., Reference Lancaster, Carstens, Crews, Welsh, Forbes, Forrest, Tedeschi, Randel and Rouquette2009a; Smith et al., Reference Smith, Davis and Loerch2010; Kelly et al., Reference Kelly, McGee, Crews, Fahey, Wylie and Kenny2010a), there was no difference in our study between the RFI groups for FCR. This may be attributed to feeding a lower energy diet during the winter period, whereby the animals were grown at a relatively slow rate in order to amplify compensatory growth during the subsequent grazing season when animals were fed high digestible herbage.
To date, there is a paucity of published information measuring grazed pasture intake for beef cattle and little is known whether inter-animal differences in feed intake measured indoors persist at pasture. In agreement with previous studies with beef cows (Herd et al., Reference Herd, Richardson, Hegarty, Woodgate, Archer and Arthur1998; Meyer et al., Reference Meyer, Kerley and Kallenbach2008; Lawrence et al., Reference Lawrence, Kenny, Earley and McGee2011b), no statistically significant difference was found for herbage intake between the different RFI categories. This may be attributed to a number of factors. First, there is the possibility of animals re-ranking for RFI. In beef heifers, Kelly et al. (Reference Kelly, McGee, Crews, Sweeney, Boland and Kenny2010b) estimated a moderate to high repeatability for RFI (r = 0.62), calculated during growing and finishing periods when fed the same diet, indoors. Second, differences in the diets employed between the two measurement periods, that is, ensiled grass herbage plus supplementary concentrates v. grazed grass herbage, may be a factor as feed efficiency ranking can be affected by diet type (Durunna et al., Reference Durunna, Mujibi, Goonewardene, Okine, Basarab, Wang and Moore2011). In steers, Clarke et al. (Reference Clarke, Drennan, McGee, Kenny, Evans and Berry2009) reported a correlation of 0.30 between intake of grazed herbage determined using n-alkanes and subsequent individual intake of grass silage (weighed in and out) following housing 3 months later. Third, the change in physiological status of the heifers may have influenced intake but this is unlikely to be biologically significant around the end of the first trimester of pregnancy. Finally, it is inherently difficult to quantify herbage intakes in grazing cattle, and all commonly used techniques have an associated error that varies in magnitude (Macoon et al., Reference Macoon, Sollenberger, Moore, Staples, Fike and Portier2003). The n-alkane marker technique employed in this study is subject to variation (Arthur and Herd, Reference Arthur and Herd2005), such as the inaccuracy of marker technology and the relatively short measurement period. However, there are few alternative technologies available to measure individual intake of grazing cattle.
Mean daily herbage DMI during the herbage intake period was 9.77 kg or 18.9 g/kg when expressed relative to LW. These relative values are comparable to recent results obtained at this Centre using n-alkanes with Limousin ×Holstein–Friesian (20.2 g/kg), Limousin × Simmental (20.6 g/kg), Charolais × Limousin (20.0 g/kg) and Charolais × Simmental (19.1 g/kg) heifers in early pregnancy (W. Minchin and M. McGee, 2010, unpublished). They are also comparable to mean values (19.0 g/kg) reported for yearling beef heifers (Gould et al., Reference Gould, Minchin, Kenny, Fahey and McGee2011) but higher than values (15.0 to 16.1 g/kg) obtained with late-maturing beef crossbred steers (Clarke et al., Reference Clarke, Drennan, McGee, Kenny, Evans and Berry2009) grazing similar pastures.
During this study, apparent herbage intake was also estimated throughout the grazing season using the sward cutting method (disappearance rate between pre-grazing and post-grazing herbage mass) with mean values of 8.98 and 8.68 kg DM/day for the two high and low RFI groups, respectively, during the first half of the grazing season. Corresponding values for the second half of the grazing season, which overlaps with the n-alkane measurement period, were 10.72 and 10.69 kg DM/day.
Similarly, Weldon et al. (Reference Weldon, Laidlaw and Black2011) found no statistically significant difference (P = 0.156) in mean herbage intake when comparing these two methods of measurement, but the variation associated with the sward cutting technique was substantial. Smit et al. (Reference Smit, Taweel, Tas, Tamminga and Elgersma2005) also found that the n-alkane method was a more consistent method to estimate herbage intake of grazing animals and yielded less variable results than the sward cutting technique. When using the n-alkane method, there is greater replication than the sward cutting method because DMI is measured on an individual animal rather than on a group basis. Therefore, it is easier to have greater homogeneity of the grazing area and less variation in grass chemical composition as plot replication is not required.
Total tract digestibility and activity
Dietary digestibility may account for 0.14 of the variation in RFI (Herd et al., Reference Herd, Oddy and Richardson2004). In this study, using acid insoluble ash as a marker, the absence of a relationship between RFI and total tract digestibility may be related to the nature of the diet offered, as the effect of level of feed intake on digestion is of less magnitude with forage-based diets than with concentrate-based diets (Chilliard et al., Reference Chilliard, Doreau, Bocquier and Lobley1995). A number of studies where high concentrate diets were offered to cattle have found that diet digestibility was negatively correlated with RFI (Richardson et al., Reference Richardson, Herd, Archer and Arthur2004; Nkrumah et al., Reference Nkrumah, Okine, Mathison, Schmid, Li, Basarab, Price, Wang and Moore2006; McDonald et al., Reference McDonald, Nichols, Harbac, Norvell and Paterson2010), although some have found no relationship (Cruz et al., Reference Cruz, Trovo, Oltjen and Sainz2011). However, whether the association with digestion and RFI is an inherent efficiency or mainly related to a higher passage rate of digesta due to intake is unclear.
Susenbeth et al. (Reference Susenbeth, Dickel, Südekum, Drochner and Steingaß2004) found that cattle consumed an additional 19.2% kJ/kg of BW when standing than they do when lying, showing that animals’ physical activity influences energy expenditure and feed efficiency. Similar to the findings of Lawrence et al. (Reference Lawrence, Kenny, Earley, Crews and McGee2011a), results from this study ‘indoors’ suggest that differences in physical or locomotion activity between high and low RFI groups does not noticeably contribute to variation in phenotypic RFI. However, during the grazing period, when animals had greater special allowance and thus greater capacity to express physical activity behaviour, high RFI animals spent more time standing and less time lying than medium and low RFI animals. In beef bulls, Richardson et al. (Reference Richardson, Kilgour, Archer and Herd1999) reported a phenotypic correlation of 0.24 between RFI and daily pedometer count during the RFI test period, also indicating greater physical activity in inefficient animals.
Body composition and skeletal measurements
According to Herd et al. (Reference Herd, Oddy and Richardson2004), differences in body composition, particularly fat deposition, may account for ∼5% of the variation in RFI. To date, some studies on growing cattle have shown that high RFI is phenotypically correlated with body fatness (Basarab et al., Reference Basarab, Price, Aalhus, Okine, Snelling and Lyle2003; Lancaster et al., Reference Lancaster, Carstens, Crews, Welsh, Forbes, Forrest, Tedeschi, Randel and Rouquette2009a; Kelly et al., Reference Kelly, McGee, Crews, Fahey, Wylie and Kenny2010a), indicating that low RFI cattle are leaner, unlike the present study where no difference between RFI groups was observed in ultrasonic fat measurements. This discrepancy may be attributed to the fact that in the present study animals were growing slowly (0.53 kg/day – store period), and less physiologically mature than in other comparable studies where cattle consumed high-energy diets and ADG ranged between 1.01 and 1.52 kg/day (Basarab et al., Reference Basarab, Price, Aalhus, Okine, Snelling and Lyle2003; Lancaster et al., Reference Lancaster, Carstens, Crews, Welsh, Forbes, Forrest, Tedeschi, Randel and Rouquette2009a; Kelly et al., Reference Kelly, McGee, Crews, Fahey, Wylie and Kenny2010a). Consequently, the rate of adipose tissue gain was less and hence more difficult to detect in the present study. Although differences were detected between RFI groups in BCS during the study, these effects were small and inconsistent, possibly reflecting the subjectivity in measuring BCS.
Previous studies have reported neutral to strong negative (−0.01 to −0.45; Basarab et al., Reference Basarab, Price, Aalhus, Okine, Snelling and Lyle2003; Nkrumah et al., Reference Nkrumah, Basarab, Price, Okine, Ammoura, Guerico, Hansen, Li, Benkel, Murdoch and Moore2004; Mader et al., Reference Mader, Montanholi, Wang, Miller, Mandell, McBride and Swanson2009) and neutral to strong positive (0.06 to 0.40; Arthur et al., Reference Arthur, Archer, Johnston, Herd, Richardson and Parnell2001a; Lancaster et al., Reference Lancaster, Carstens, Ribeiro, Tedeschi and Crews2009b; Kelly et al., Reference Kelly, McGee, Crews, Lynch, Wylie, Evans and Kenny2011) phenotypic correlations between RFI and longissimus muscle development. Results from this study indicate that growing heifers ranked on the basis of RFI do not differ in longissimus muscle depth or visual muscular scores.
Skeletal measurements are used to supplement BW as a measure of productivity (Gilbert et al., Reference Gilbert, Bailey and Shannon1993) and are useful physical indicators of growth rate and size (Drennan et al., Reference Drennan, McGee and Keane2008). In the present study, phenotypic RFI was not associated with any of the skeletal measurements, except back length, and in this case there was no significant difference between low and high RFI groups. Studies with heifers (Kelly et al., Reference Kelly, McGee, Crews, Fahey, Wylie and Kenny2010a), beef cows (Lawrence et al., Reference Lawrence, Kenny, Earley, Crews and McGee2011a) and steers (Basarab et al., Reference Basarab, Price, Aalhus, Okine, Snelling and Lyle2003; Nkrumah et al., Reference Nkrumah, Basarab, Price, Okine, Ammoura, Guerico, Hansen, Li, Benkel, Murdoch and Moore2004) found that animals ranked on the basis of RFI did not differ in morphological size. Similarly, Crowley et al. (Reference Crowley, Evans, McHugh, Pabiou, Kenny, McGee, Crews and Berry2011) found no significant genetic correlation between RFI and skeletal measurements; however, they did detect a negative phenotypic correlation (P < 0.05) between RFI and pelvis length (r = −0.15) and width of hips (r = −0.19).
Blood variables
Plasma metabolites are useful biochemical indicators of energy metabolism and nutritional status of beef cattle (Agenas et al., Reference Agenas, Heath, Nixon, Wilkinson and Philips2006). The absence of an effect of RFI grouping or an interaction between RFI group and time of sampling of concentrations of NEFA and βHB is in accordance with the findings for ultrasonic body fat. Creatinine is a break-down product of creatine phosphate, an energy storage compound in the muscle and a proposed marker for muscle mass in cattle (Istasse et al., Reference Istasse, Van Eenaeme, Gabriel, Clinquart, Maghuin-Rogister and Bienfait1990). A study by Richardson et al. (Reference Richardson, Herd, Archer and Arthur2004) reported a negative (r = −0.45) correlation between RFI and plasma creatinine concentration. Similarly in this study and in a study with beef cows by Lawrence et al. (Reference Lawrence, Kenny, Earley, Crews and McGee2011a) plasma creatinine concentrations were greater in low RFI animals than in high RFI animals. However, Lawrence et al. (Reference Lawrence, Kenny, Earley, Crews and McGee2011a) also observed greater ultrasonic muscle depth and visual muscularity score at the beginning of the experiment for low RFI cows, which was not replicated with heifers in this study.
IGF-1 hormone is produced in the liver and regulates growth and cellular metabolism (Wood et al., Reference Wood, Archerb and van der Werf2004). Interest has been shown in the use of IGF-1 as potential physiological biomarker of feed efficiency in cattle (Richardson et al., Reference Richardson, Herd, Archer and Arthur2004; Wood et al., Reference Wood, Archerb and van der Werf2004; Kahi and Hirooka, Reference Kahi and Hirooka2007) but results of studies to date are contentious. Moore et al. (Reference Moore, Johnston, Graser and Herd2005) and Kahi and Hirooka (Reference Kahi and Hirooka2007) have shown significant correlations between RFI and IGF-1, whereas similar to the present study others found minimal or no correlation (Lancaster et al., Reference Lancaster, Carstens, Riberio, Davis, Lyons and Welsh2008; Kelly et al., Reference Kelly, McGee, Crews, Fahey, Wylie and Kenny2010a). Therefore, IGF-1 may not be a reliable predictor of RFI as originally thought, and further investigation is warranted.
There are few published studies pertaining to the relationship between RFI and systemic concentrations of insulin. Richardson et al. (Reference Richardson, Herd, Archer and Arthur2004) reported that divergently selected high RFI steers tended to have higher insulin concentrations than low RFI steers at the end of the feedlot test period, and suggested that this difference may be due to increased fat deposition as insulin plays a major role in lipogenesis in adipose tissue. However, in agreement with the present study, Kelly et al. (Reference Kelly, McGee, Crews, Fahey, Wylie and Kenny2010a) found no association with insulin concentration and RFI.
Differences in an animal's response to stress may also be associated with variation in RFI (Richardson et al., Reference Richardson, Herd, Archer and Arthur2004). Blood cell constituents are sensitive indicators of the physiological or pathological responses of animals to stress (Radostits et al., Reference Radostits, Blood and Gay1994), with neutropenia and lymphopenia common findings in stressed animals (Gupta et al., Reference Gupta, Earley and Crowe2007; Lynch et al., Reference Lynch, Earley, McGee and Doyle2010). Results from Richardson et al. (Reference Richardson, Herd, Colditz, Archer and Arthur2002) indicated that divergently selected high RFI steers had more neutrophils, less lymphocytes and a lower WBC count compared with their low RFI contemporaries and were viewed as being more stressed. Similar to the findings of Lawrence et al. (Reference Lawrence, Kenny, Earley, Crews and McGee2011a), high RFI animals had a greater WBC and lymphocyte count than medium RFI animals. However, in the present study and that of Lawrence et al. (Reference Lawrence, Kenny, Earley, Crews and McGee2011a), animals exhibited normal leukograms with an absence of neutrophilia and no changes in plasma concentrations of the acute phase proteins (haptoglobin and fibrinogen), indicating no difference in immune status between low and high RFI groups.
In addition to examination of circulating concentrations of immune-related blood cells, lymphocyte functional assays, in terms of PHA-induced and Con A-induced IFN-γ production, were used to assess immune function (Earley and Crowe, Reference Earley and Crowe2002; Gupta et al., Reference Gupta, Earley and Crowe2007). IFN-γ is a cytokine produced by activated T-lymphocytes and natural killer cells IFN-γ production and is evaluated as a mediator of cell-mediated immunity. A reduction of in vivo IFN-γ production can occur in situations where an animal undergoes a period of stress or injury, and is considered an indicator of immunosuppression (Earley and Crowe, Reference Earley and Crowe2002). In the present study, lymphocyte functional assays in terms of PHA- and Con A-induced IFN-γ production were used to assess immune function. Induction of a proliferative response-induced antigen in vitro has been shown to be representative of cellular immunocompetence (Swanson et al., Reference Swanson, Lee and Sarders2001). This study showed that there were no major differences in immune-specific production of IFN-γ in response to stimulation with PHA and Con A between heifers differing in phenotypic RFI.
Estimated maintenance energy requirements
Considering that there were no significant differences between RFI groups in ultrasonic body composition traits, maintenance energy requirements (UFL/kg LW0.75) can be estimated for weight equilibrium for each RFI group, assuming that animals not changing in weight can be considered to be at maintenance. Daily LW gain (g/kg LW0.75) was regressed against NE intake (UFL/kg LW0.75) and maintenance energy requirements were taken as NE intake when weight change was zero as described by Dawson and Steen (Reference Dawson and Steen1998), but in that study energy retention rather than weight change was used. As mean daily LW gain in our study was relatively low, many data points were reasonably close to the x-axis and extrapolation beyond the data set was relatively limited. Estimated maintenance energy values were 0.057, 0.051 and 0.047 UFL/kg LW0.75 equivalent to 98, 88 and 80 kcal of NEL/kg0.75 for high, medium and low RFI groups, respectively. This implies that maintenance energy requirements were 0.18 lower for low compared with high RFI animals.
Economic implications
Given that feed constitutes such a large proportion of total costs in beef production and therefore is a significant determinant in producer profitability, any improvement in output of beef per unit of feed consumed over the whole production system would be of considerable economic benefit to producers. In particular, winter feed costs represent a substantial proportion of the annual feed budget as the cost of grass silage and concentrates is generally greater than that of grazed grass (Finneran et al., Reference Finneran, Crosson, Wallace, O'Kiely, Forristal and Shalloo2010). Depending on site location, soil type and grass growth potential the grazing period typically consists of 232 days and a housing period of 133 days (Finneran et al., Reference Finneran, Crosson, O'Kiely, Shalloo, Forristal and Wallace2011). According to Finneran et al. (Reference Finneran, Crosson, O'Kiely, Shalloo, Forristal and Wallace2011 and Reference Finneran, Crosson, O'Kiely, Shalloo, Forristal and Wallace2012), the average cost, in Ireland, of providing grazed grass, grass silage and concentrates was €74, €158 and €217 per tonne DM, respectively. Calculations based on these data and DMI values from this study resulted in a feed cost difference between the high and low RFI groups of heifers of ∼€0.12 or €17 (€146 v. €129) for the indoor winter period. However, as this winter period differential in DMI was not as evident during the grazing season, feed costs for this latter period were similar for the high and low RFI groups (€169 v. €168). Combining the two production periods, the difference in the annual feed budget between low and high RFI heifers would be ∼€18/heifer.
Conclusions
Results from this study show that despite the 0.16 difference in DMI between low and high RFI heifers during the indoor winter period there were no differences observed in growth, and other economically important performance traits measured. In addition, herbage intake and growth during the subsequent grazing season did not differ between heifers divergent in phenotypic RFI. Therefore, improving feed utilisation while maintaining performance levels should improve producer profitability through lower feed costs. However, because of difficulties that exist with current methodology to measure individual intakes of grazed herbage, further research is needed to determine more accurate estimates of intake during the grazing season in beef cattle differing in RFI.
Acknowledgements
The authors gratefully acknowledge E. Mulligan for skilled technical assistance, the farm staff at Teagasc, Grange Beef Research Centre for the care and management of the animals, the staff of Grange laboratories for feed analysis, J. Larkin and M. Murray for blood analysis, N. Galvin from Moorepark Dairy Production Research Centre for n-alkane analysis and P. Furney from University College Dublin for blood hormone analysis. P. Lawrence was in receipt of a Teagasc Walsh Fellowship.