Geopolymers – the usual name for the more conventional denomination of ‘alkali aluminosilicate gels’ – are inorganic solids obtained by the alkaline activation of an aluminosilicate precursor. The precursor can be either a calcined clay (usually metakaolin, a dehydroxylated natural kaolin) or low-calcium industrial aluminosilicate byproducts (e.g. fly ashes). In most cases these precursors are activated using an alkaline aqueous silicate solution based on sodium or potassium. This induces the dissolution of the precursors followed by the polymerization of [AlO4]5– and [SiO4]4– tetrahedra into a highly disordered three-dimensional interconnected network. The solid obtained is completely amorphous (Provis et al., Reference Provis, Duxson, van Demeter and Lukey2005; Duxson et al., Reference Duxson, Fernández-Jiménez, Provis, Lukey, Palomo and van Demeter2007a; Provis & Van Deventer, Reference Provis and van Deventer2009; Chlique et al., Reference Chlique, Lambertin, Antonucci, Frizon and Deniard2015), mesoporous (Kong et al., Reference Kong, Sanjayan and Sagoe-Crentsil2007; Kriven et al., Reference Kriven, Bell and Gordon2007; Provis & Van Deventer, Reference Provis and van Deventer2009) and presents interesting mechanical properties after setting (Palomo et al., Reference Palomo, Blanco-Valera, Granizo, Puertas, Vazquez and Grutzeck1999; Li et al., Reference Li, Chen and Zhang2013). Geopolymers belong to the family of inorganic binders; however, their setting mechanism and setting products – linked to the geopolymerization reaction (Babushkin et al., Reference Babushkin, Matveyev and Mchedlov-Petrossyan1985; Xu & van Deventer Reference Xu and van Deventer2000; Duxson et al., 2007; Dimas et al., Reference Dimas, Giannopoulou and Panias2009) – are fundamentally different from the hydration process of conventional hydraulic cements. Geopolymer binders significantly reduce CO2 emissions compared to Portland cement production (Duxson et al., Reference Duxson, Provis, Lukey and van Deventer2007b; Weil et al., Reference Weil, Dombrowski and Buchwald2009; McLellan et al., Reference McLellan, Williams, Lay, van Riessen and Corder2011; Habert & Ouellet-Plamondon, Reference Habert and Ouellet-Plamondon2016), present unusual thermal and acid resistance (Barbosa & MacKenzie, Reference Barbosa and MacKenzie2003; Fernández-Jiménez et al., Reference Fernández-Jiménez, Palomo, Pastor and Martin2008; Pacheco-Torgal et al., Reference Pacheco-Torgal, Abdollahnejad, Camões, Jamshidi and Ding2012; Li et al., Reference Li, Chen and Zhang2013; Malviya & Goliya, Reference Malviya and Goliya2014), stabilize various types of waste and represent a potential solution for some radioactive wastes for which there is no other solution today (Palomo & Lopez de la Fuente, Reference Palomo and Lopez de la Fuente2003; Pacheco-Torgal et al., Reference Pacheco-Torgal, Castro-Gomes and Jalali2006; Lambertin et al., Reference Lambertin, Frizon, Blachere, Bart, Sillekens, Agnew, Neelameggham and Mathaudhu2011; Cantarel et al., Reference Cantarel, Nouaille, Rooses, Lambertin, Poulesquen and Frizon2015).
Geopolymers are characterized by high thermal stability, which makes them promising candidates for various applications. Recently, an in-depth characterization of a geopolymer-type material with argillite additive formulated for a fireproof coating application (for radioactive waste containers within the framework of the Cigéo project) was carried out (Gomes et al., Reference Gomes, Petit, Frezet, Nedelec, Gharzouni, Rossignol and Renaudin2020a, Reference Gomes, Petit, Frezet, Thirouard, Taviot-Gueho and Gharzouni2020b, Reference Gomes, Frezet, Petit, Petlickaia, Rossignol, Texier-Mandoki and Renaudin2021). Cigéo is the radioactive waste disposal facility project led by the French National Radioactive Waste Management Agency (Andra) for the long-term management of high- and intermediate-level long-lived radioactive waste. In the two first related research works, the authors emphasized the thermal stability of a model K-geopolymer matrix up to a temperature of 700°C for its mesoporous features (Gomes et al., Reference Gomes, Petit, Frezet, Nedelec, Gharzouni, Rossignol and Renaudin2020a) and to 900°C for its amorphous characteristics (Gomes et al., Reference Gomes, Petit, Frezet, Thirouard, Taviot-Gueho and Gharzouni2020b). A third contribution demonstrated the positive impact of adding an argillite filler because of its dimensional and mechanical stability at high temperatures (Gomes et al., Reference Gomes, Frezet, Petit, Petlickaia, Rossignol, Texier-Mandoki and Renaudin2021). Indeed, the added Callovo-Oxfordian (COx) argillite is a natural carbonated aluminosilicate material that itself undergoes an alkaline activation reaction leading to a consolidated material, in particular due to a prior thermal activation at 750°C (Gharzouni et al., Reference Gharzouni, Dupuy, Sobrados, Joussein, Teixier-Mandoki, Bourbon and Rossignol2017; Dupuy et al., Reference Dupuy, Gharzouni, Teixier-Mandoki, Bourbon and Rossignol2018). The present paper completes the description of the behaviour of the mesoporous network of all of the materials formulated in this project, and in particular its variation as a function of temperature, relative humidity (RH) and ageing (characterizations and results extracted from our previous studies are therefore considered as known; the reader is invited to refer to Gomes et al., Reference Gomes, Petit, Frezet, Nedelec, Gharzouni, Rossignol and Renaudin2020a, Reference Gomes, Petit, Frezet, Thirouard, Taviot-Gueho and Gharzouni2020b, Reference Gomes, Frezet, Petit, Petlickaia, Rossignol, Texier-Mandoki and Renaudin2021). For this purpose, a non-destructive characterization method was chosen: alternative current impedance spectroscopy (AC-IS). The data collected after scanning the materials at various frequencies and temperatures make it possible to refine their physicochemical parameters, which thus indirectly provide an understanding of the hydric properties specific to these materials that present an open and interconnected porosity.
Electrical methods have been used for more than 25 years to characterize the porous network of cementitious materials. In 2016, the review of Tang et al. (Reference Tang, Cai, He, Zhou, Shao and Li2016) presented the various experimental configurations (direct or alternative current, electrode contact or non-contact design, resistivity or impedance measurement) encountered in the literature. They highlighted the necessity but also the difficulty of using an equivalent electrical circuit (EEC) that exactly reproduces the behavior of the material probed and to its pore structure, as well as of being able to produce a meaningful interpretation capable of establishing a link between pore structure and diffusion properties. The importance of using an appropriate EEC model is also highlighted in the recent review by Wang et al. (Reference Wang, He, Shi, Zhang, Chen and Dai2022) dedicated to cement-based materials. The various microstructure models used in the literature to describe all of the liquid–solid interfaces present in a concrete-type material are described there: the layer model (Gu et al., Reference Gu, Xie, Beaudoin and Brousseau1992), the brick model (Xie et al., Reference Xie, Gu and Beaudoin1993), the T and I model (Moss et al., Reference Moss, Christensen, Mason and Jennings1996), the barrier/pin-hole model (Ford et al., Reference Ford, Hwang, Shane, Olson, Moss, Jennings and Mason1997) and the conductive path models (McCarter & Garvin, Reference McCarter and Garvin1989; McCarter, Reference McCarter1994; McPhee et al., Reference McPhee, Sinclair and Stubbs1996, Reference McPhee, Sinclair and Cormack1997; Cormack et al., Reference Cormack, McPhee and Sinclair1998; Song, Reference Song2000). The idea underlying these successive models was to implement new conductive paths specific to the microstructure of hydraulic binders: a connected pore path filled with electrolyte, a disconnected pore path, a blocked pore path, a C-S-H gel hydration product in the pore path, a C-S-H gel hydration product around unreacted cement particles and unreacted cement particles themselves (Wang et al., Reference Wang, He, Shi, Zhang, Chen and Dai2022). However, the complexity of such EECs makes their modelling very uncertain and strongly brings into question the interpretation of the results obtained. This is why some authors have instead attempted to assign inherent physical interpretations to the EEC elements, such as the resistances related to different scales of ionic conduction and the admittance of constant-phase elements (CPE) attributed to electrical double layers formed at various solid–solution interfaces (Keddam et al., Reference Keddam, Takenouti, Novoa, Andrade and Alonso1997; Cabeza et al., Reference Cabeza, Merino, Miranda, Novoa and Sanchez2002, Reference Cabeza, Keddam, Novoa, Sanchez and Takenouti2006; Cruz et al., Reference Cruz, Fita, Soriano, Paya and Borrachero2013; Dong et al., Reference Dong, Qiu, Xiang, Huang, Xing, Han and Lu2014; Ortega et al., Reference Ortega, Sanchez and Climent2015; Li et al., Reference Li, Ji, Fang, Liu, Xing, Liu and Dong2016; Tang et al., Reference Tang, Cai, He, Zhou, Shao and Li2016; Chi et al., Reference Chi, Wang, Lu, Zhao and Yao2019; Wang et al., Reference Wang, He, Shi, Zhang, Chen and Dai2022). Electrical methods have mainly been used to probe the porosity of cementitious materials in order to characterize their microstructure as well as to quantify the tortuosity of their pore structures (Sanish et al., Reference Sanish, Neithalath and Santhanam2013; Gui et al., Reference Gui, Qin and Li2016; Mendes et al., Reference Mendes, Oliveira, Cremonez, Pereira, Pereira and Medeiros-Junior2018). Other works aimed at linking electrical investigations to predictions in terms of durability (Sengul, Reference Sengul2014; Mendes et al., Reference Mendes, Oliveira, Cremonez, Pereira, Pereira and Medeiros-Junior2018), mechanical resistance (Tang et al., Reference Tang, Li, Shao and Chen2014; Li et al., Reference Li, Ji, Fang, Liu, Xing, Liu and Dong2016; Grammatikos et al., Reference Grammatikos, Ball, Evernden and Jones2018; Chi et al., Reference Chi, Wang, Lu, Zhao and Yao2019; Guo et al., Reference Guo, Wu, Gao, He, Ma, Huang and Bai2021), resistance to carbonation (Dong et al., Reference Dong, Qiu, Xiang, Huang, Xing, Han and Lu2014), resistance to corrosion (Melara et al., Reference Melara, Mendes, Andreczevecz, Braganca, Carrera and Medeiros-Junior2020) and the impact of the addition of nanomaterials (Da Silva et al., Reference Da Silva, Martini, Moraes and Teles2021). The latter study (Da Silva et al., Reference Da Silva, Martini, Moraes and Teles2021) has indicated the value of using a simple and robust EEC model to be able to link the refined electrical parameters to a physical characterization of the material, particularly to the porosity characterization (as we have done in the present study).
Among the various families of hydraulic binders, geopolymers present a much simpler pore structure, which then renders them much simpler to model. Our previous study demonstrated the diffusive and open character of the mesoporous network of a geopolymer (Gomes et al., Reference Gomes, Petit, Frezet, Nedelec, Gharzouni, Rossignol and Renaudin2020a). Thus, a simple ionic conduction path, through the continuous porous network, should first be considered when interpreting the impedance measurements (Melar et al., Reference Melar, Renaudin, Leroux, Hardy-Dessources, Nedelec and Taviot-Gueho2015; Song et al., Reference Song, Wang, Dong, He and Lu2019; Biondi et al., Reference Biondi, Perry, McAlorum, Vlachakis and Hamilton2020; Liu et al., Reference Liu, Lu, Bai, Han, Xie and He2020; Shen et al., Reference Shen, Han, Guo, Wang, Song and Bai2022). Moreover, the impedance measurements presented here were conducted on temperature cycles (78 AC-IS spectra for each sample between 243 and 313 K) to characterize the electrical phenomena according to Arrhenius laws, as previously stated (Leroux et al., Reference Leroux, Russias, Cau-dit-Coumes, Frizon and Renaudin2011; Melar et al., Reference Melar, Renaudin, Leroux, Hardy-Dessources, Nedelec and Taviot-Gueho2015). This makes it possible to associate an activation energy (E a) with the modelled electrical phenomenon without having to overinterpret the refined EEC values. The objective here is to obtain a clearer interpretation of the pore structure present in the K-geopolymer formulations (dedicated to fireproof coating applications), mainly by probing the K+ cations and focusing on the changes observed with temperature and RH. All of the samples previously described (Gomes et al., Reference Gomes, Petit, Frezet, Nedelec, Gharzouni, Rossignol and Renaudin2020a, Reference Gomes, Petit, Frezet, Thirouard, Taviot-Gueho and Gharzouni2020b, Reference Gomes, Frezet, Petit, Petlickaia, Rossignol, Texier-Mandoki and Renaudin2021) were scrutinized using AC-IS: from pure model K-geopolymer to 100% argillite-activated materials, from as-synthesized room-temperature samples up to 900°C post-treated samples and for samples stored at 30% and 95% RH, the entire series comprised ∼50 samples.
Materials and methods
Argillite/K-geopolymer composite synthesis, thermal treatment and storage conditions
The samples were based on the model K-geopolymers previously investigated (Gomes et al., Reference Gomes, Petit, Frezet, Nedelec, Gharzouni, Rossignol and Renaudin2020a, Reference Gomes, Petit, Frezet, Thirouard, Taviot-Gueho and Gharzouni2020b). As a summary, the model geopolymer was obtained via the potassium silicate activation of a metakaolin of high purity – a non-commercial product supplied by Imerys (AGS Quarrying, F-17270 Clérac, France). Alkali-activated materials were obtained by substituting X wt.% of metakaolin by COx preheated at 750°C for 4 h (with X = 0, 33, 67 or 100; i.e. from pure model K-geopolymer to purely K-activated COx argillite material; see Gomes et al., Reference Gomes, Frezet, Petit, Petlickaia, Rossignol, Texier-Mandoki and Renaudin2021). COx argillite was described previously (Dupuy et al., Reference Dupuy, Gharzouni, Teixier-Mandoki, Bourbon and Rossignol2018; Gomes et al., Reference Gomes, Frezet, Petit, Petlickaia, Rossignol, Texier-Mandoki and Renaudin2021).
The samples were named XCOx-TRH, with X being 0, 33, 67 or 100 of the COx argillite (750°C preheated) proportion, T being the heat treatment temperature after alkaline activation and setting (25°C, 100°C, 200°C, 450°C, 600°C or 900°C) and RH being the relative humidity of the storing conditions after heat treatment (‘95’ for 95% RH or ‘30’ for 30% RH; for at least 2 months to reach equivalent equilibrium for all pellets stored at a given RH). The intent behind the two storing conditions was to vary the water-filling levels inside the porous network – from fully water saturated (XCOx-T 95 series) to a weak filling level (XCOx-T 30 series) – so as to produce varying behaviour in terms of ionic conduction. Note that 0COx-TRH samples correspond to pure model K-geopolymers (Gomes et al., Reference Gomes, Petit, Frezet, Nedelec, Gharzouni, Rossignol and Renaudin2020a, Reference Gomes, Petit, Frezet, Thirouard, Taviot-Gueho and Gharzouni2020b).
Alternative current impedance spectroscopy
Methods and equipment
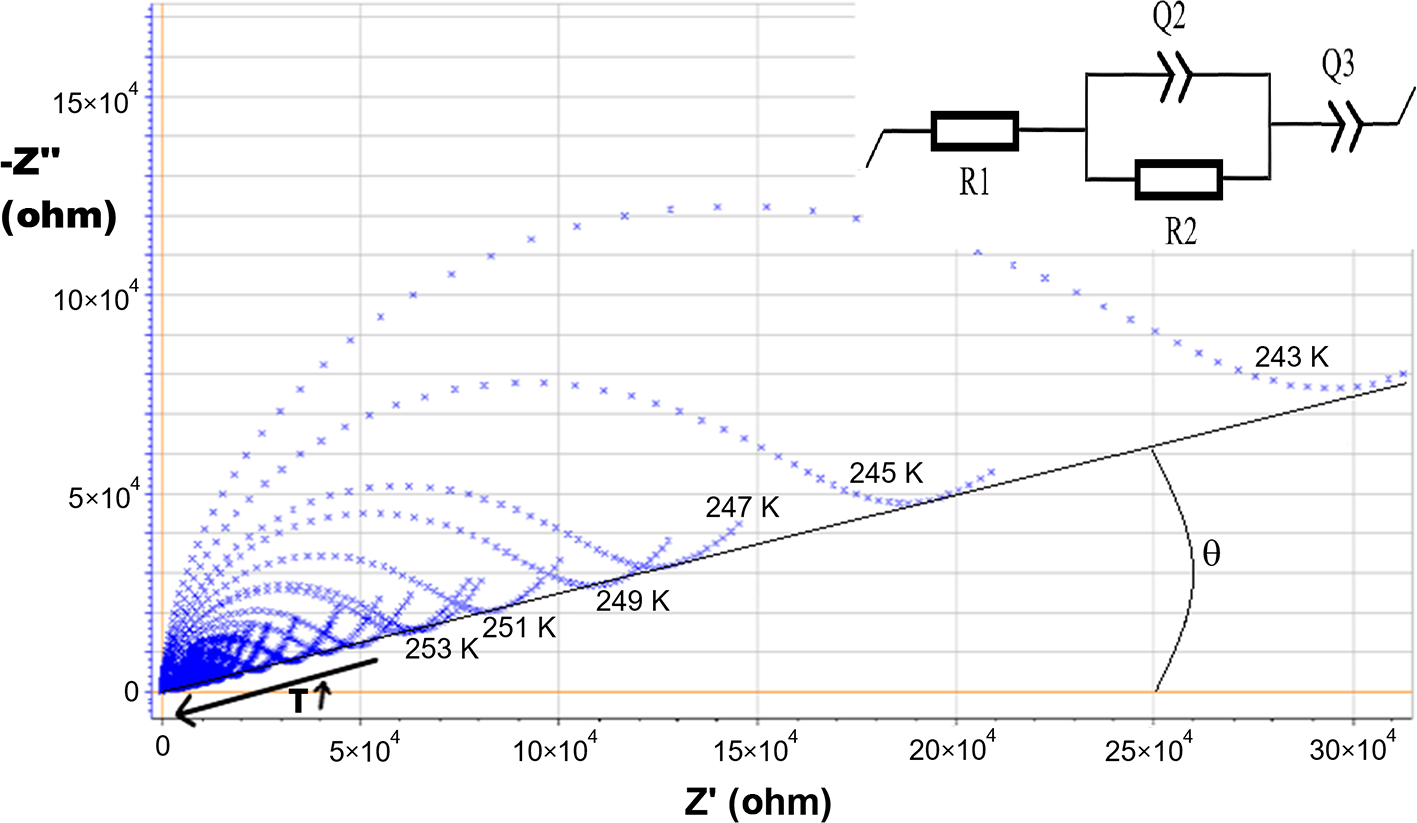
AC-IS measurements were performed on monolithic pellets with two Au contacting electrodes in the form of a plain capacitor (14 mm diameter, between 4 and 5 mm thick). Monolithic pellets were obtained directly by demoulding after setting and hardening following alkaline activation. The cell (CESH-type sample holder controlled in temperature by the ITS chamber from BioLogic, F-38170 Seyssinet-Pariset, France) was directly wired to a 7260-type impedance analyser (Materials Mates, F-38700 Sarcenas, France) whose connectivity was customized by BioLogic. Measurements were performed over a temperature cycle ranging from 243 to 313 K in the frequency interval 100–107 Hz. The first temperature ramp was set from 293 to 243 K in steps of –2 K (ramp 1); the second ramp was from 243 to 313 K (+2 K steps; ramp 2); and the third ramp was from 313 to 293 K (–2 K steps; ramp 3). Frequency measurements were carried out with 20 acquisitions per logarithmic decade corresponding to a total of 120 points per scan. Figure 1 shows the set of 78 scans recorded for the 0COx-2595 sample at various temperatures.
Nyquist representation of the 78 curves Z”–Z’ (ω) for the 0COx-2595 pellet with the superimposition of the EEC (top right) used for the impedance modelling. The depression slope θ, related to high-frequency depleted (non-ideal) semicircles, is shown.

Data processing
The impedance data were fitted using the impedance formalism defined by adopting an equivalent circuit of Ri and Qi/αi CPE. A minimum number of time constants RiCi (one in most cases) was used to reproduce the Z’ + jZ” spectra (i.e. the real and imaginary part of the experimental impedance Z at a given temperature). The EEC with one time constant (R1 + Q2/R2 + Q3) used in this paper is shown in Fig. 1 (top right), and Fig. S1 provides an example of the model obtained using EC-Lab software from BioLogic.
The total impedance was then formulated as per Equation 1:
 \begin{equation}Z\left( {\text{f}} \right) = {\text{R}}1 + { }\frac{{{\text{R}}2}}{{{\text{R}}2.{\text{Q}}2.{{\left( {j.2{\pi }.f} \right)}^{{\alpha }2}} + 1}} + \frac{1}{{{\text{Q}}3.{{\left( {j.2{\pi }.f} \right)}^{{\alpha }3}}}}\end{equation}
where j is an imaginary number and f is the frequency. α2 is called the ‘arc depression factor’ (0 < α2 ≤ 1; with a value of 1 for an ideal capacitor), and it is directly associated with the θ depression angle shown in Fig. 1. Both parameters refer to a non-Euclidean interface; that is to say, the ionic conduction mechanism characterized does not occur at a perfectly smooth interface. The Q3 CPE from the EEC represented in Fig. 1 corresponds to the interface between the gold electrode and the pellet that presents a purely capacitive behaviour (in agreement with the constant refined value of 1 for α3 in Equation 1; see also Da Silva et al., Reference Da Silva, Martini, Moraes and Teles2021).
Activation energy
The refined R2 value was then converted to a σ conductivity value for each temperature (Equation 2, with Kc being the cell constant determined from the thickness-over-surface ratio of the pellet), and an Arrhenius plot was used assuming the following temperature-dependent behaviour for ionic conductivity (Equations 3 & 4):
 \begin{equation}\sigma=\frac{{\text{K}}_\text{c}}{\text{R}2}\end{equation}
 \begin{equation}\sigma.T=\sigma_0.\text{e}^{\left(-\frac{E_\text{a}}{\text{k}T}\right)}\end{equation}
 \begin{equation}{\text{log}}\left( {\sigma.T} \right) = {\text{log}}\left( {\sigma_0} \right){ } - { }\frac{{{\text{log}}\left( {\text{e}} \right)\,.\,{E_{\text{a}}}}}{{1000\,{\text{k}}}}{ }.{ }\frac{{1000}}{T}\end{equation}
where T is the temperature and k is the Boltzmann constant. An example of the Arrhenius plot is shown in Fig. S2 for the two 0COx-25RH pellets. The linear dependence of the plot log (σ.T) vs 1000/T is clearly visible, and the corresponding fitted slope (sl) was used to calculate the E a related to the conduction path, in accordance with Equation 5:
 \begin{equation}{E_{\text{a}}}{ }\left( {{\text{eV}}} \right) = \frac{{1000{\text{ k}}}}{{{\text{log}}\left( {\text{e}} \right)}}\,.\,sl = 0.1984\,.\,sl\end{equation}
Interestingly, a single E a for the 0COx-2530 pellet stored in a dry atmosphere was obtained, whereas two were required for the 0COx-2595 pellet stored in a wet atmosphere (Fig. S2), indicating that a change in the physical state of the interstitial water occurred when decreasing the temperature from liquid water to solid ice (as previously observed and exploited for thermoporosimetry measurements in Gomes et al., Reference Gomes, Petit, Frezet, Nedelec, Gharzouni, Rossignol and Renaudin2020a). The E a values thus calculated will be discussed as being exclusively attributed to the K+ alkali cations. This is obviously a simplistic view of all charge carriers participating in ionic conduction, but it is validated by a previous study that clearly attributed E a values to the nature of the alkali used for the metakaolin activation with Na+, K+ or Cs+ (Melar et al., Reference Melar, Renaudin, Leroux, Hardy-Dessources, Nedelec and Taviot-Gueho2015).
Diffusion coefficient (D293)
The diffusion coefficient, indicating the number of charge carriers involved in the conduction mechanism being probed, was systematically determined at 293 K using the Nernst–Einstein equation (Equation 6):
 \begin{equation}D_{293}\left(\text{c}\text{m}^2.\text{s}^{-1}\right)=\frac{R.T.\sigma}{F^2.C}=2.66.10^{-7}.\frac\sigma C\end{equation}
where C is the concentration of the charge carrier and F is Faraday’s constant. In the following we assume that ionic conduction was only due to the motion of K+ cations, and its corresponding concentrations were determined to be 7571.6 and 5531.0 mol m–3 in the pellets stored in dry  $(C_{\text{K}^+}^{30\%\;RH}$) and wet
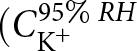 $(C_{\text{K}^+}^{95\%\;RH}$) atmospheres, respectively, in accordance with our previous characterizations of these samples (Gomes et al., Reference Gomes, Petit, Frezet, Nedelec, Gharzouni, Rossignol and Renaudin2020a, Reference Gomes, Petit, Frezet, Thirouard, Taviot-Gueho and Gharzouni2020b). The concentrations to be considered for these calculations are related to the overall composition relative to the quantity of water present because the Nernst–Einstein equation considers an isotropic conduction mode throughout the volume of the pellet. Thus, only two K+ concentrations were used: one under high humidity and the other under low humidity (assuming that storing the pellets for at least 2 months under strict humidity control allows them to reach a common equilibrium and water content that clearly differentiates between RHs of 30% and 95%). Considering only alkali cations to model ionic conduction is an approximation that does not allow discussion of the absolute calculated D 293 values but allows comparison of pellets within a series. Such a simplification of the studied system is assumed because all of the omitted ionic concentrations (major hydroxyl and minor solvated aluminate and silicate) are equivalent for all pellets stored under the same humidity conditions. Again, the aim is to describe our system using the simplest model in order to make it robust.
Surface fractal dimension (D s)
The depression angle θ (Fig. 1), correlated to the high-frequencies-depleted semicircle, is related to the α2 exponent (from Equation 1) by Equation 7. This depression factor was linked to the fractal dimension D s of the interface of the conduction paths within the geopolymer matrix by the empirical Equation 8 (1 < D s ≤ 3, D s approaching the value of 3 for an ideal capacitor, with α2 = 1, with a smooth surface):
 \begin{equation}\alpha2\text{ }=\text{ }1\text{ }-\text{ }(2\vartheta/\pi)\end{equation}
 \begin{equation}{D_s}\approx 2a2{\text{ }} + {\text{ }}1\end{equation}
The concept of fractal geometry used here is related to surface irregularities (more or less smooth interfaces), which was defined more than 40 years ago (Nyikos & Pajkossy, Reference Nyikos and Pajkossy1985), subsequently confirmed (Imre et al., Reference Imre, Pajkossy and Nyikos1992; Massey, Reference Massey1996) and used for porous media (Risovic et al., Reference Risovic, Mahovic, Furic and Gojo2008; Xia et al., Reference Xia, Wei, Liu, Cai, Zhang and Cai2021). The rougher the interface (the more it deviates from a smooth surface – in other words, from a Euclidean particle), the more dispersed the ionic motion facilities and therefore the flatter the high-frequency semicircle on the measured impedance spectrum. This notion of the fractal dimension being linked to the depression factor is related to the notion of material homogeneity, and also to the tortuosity of the porosity, discussed by Da Silva et al. (Reference Da Silva, Martini, Moraes and Teles2021).
Results
The pure model K-geopolymer: the 0COx-TRH series
Cell control: reproducibility of AC-IS acquisitions (0COx-2595 sample)
To check the tightness of the measuring cell, and therefore to ensure a constant pellet hydration rate for the 78 recordings during the temperature cycle (between 2 and 3 days of acquisition time), and to check the reproducibility of the results, two kinds of tests were performed: (1) three successive temperature cycles on the same pellet without extracting it from the cell between the three acquisitions; and (2) three AC-IS acquisitions on triplicated equivalent pellets. These tests were performed on the 0COx-2595 sample.
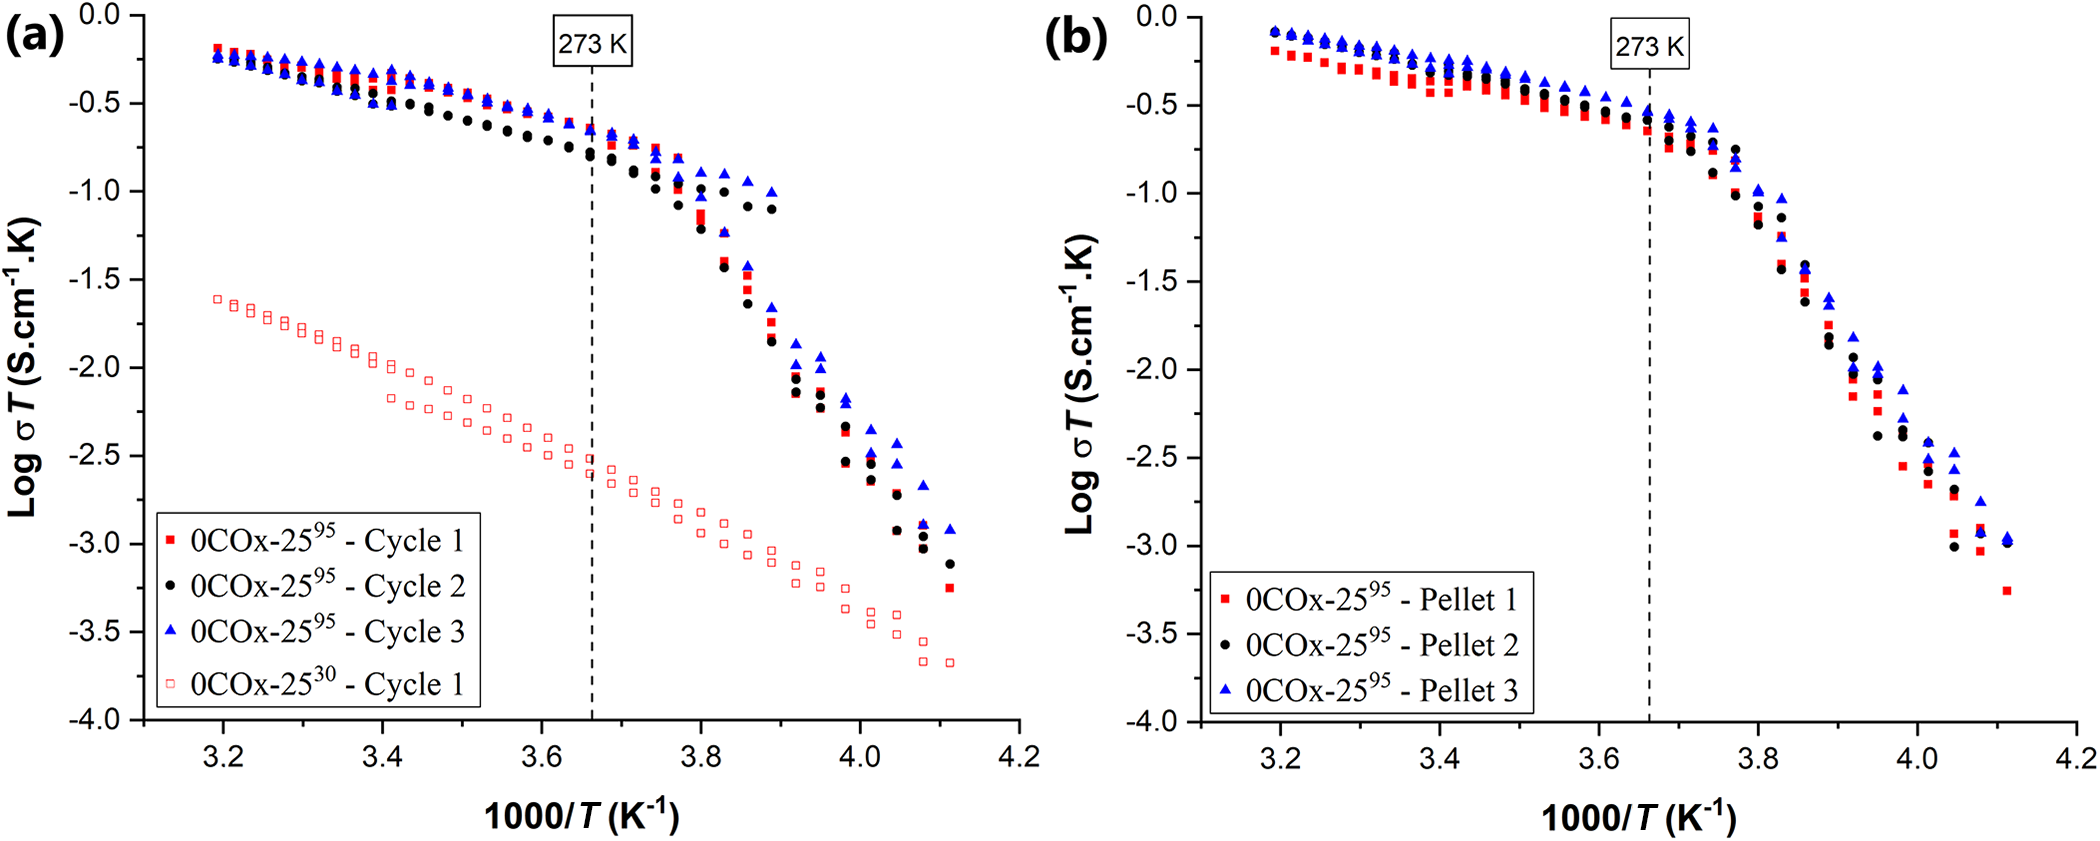
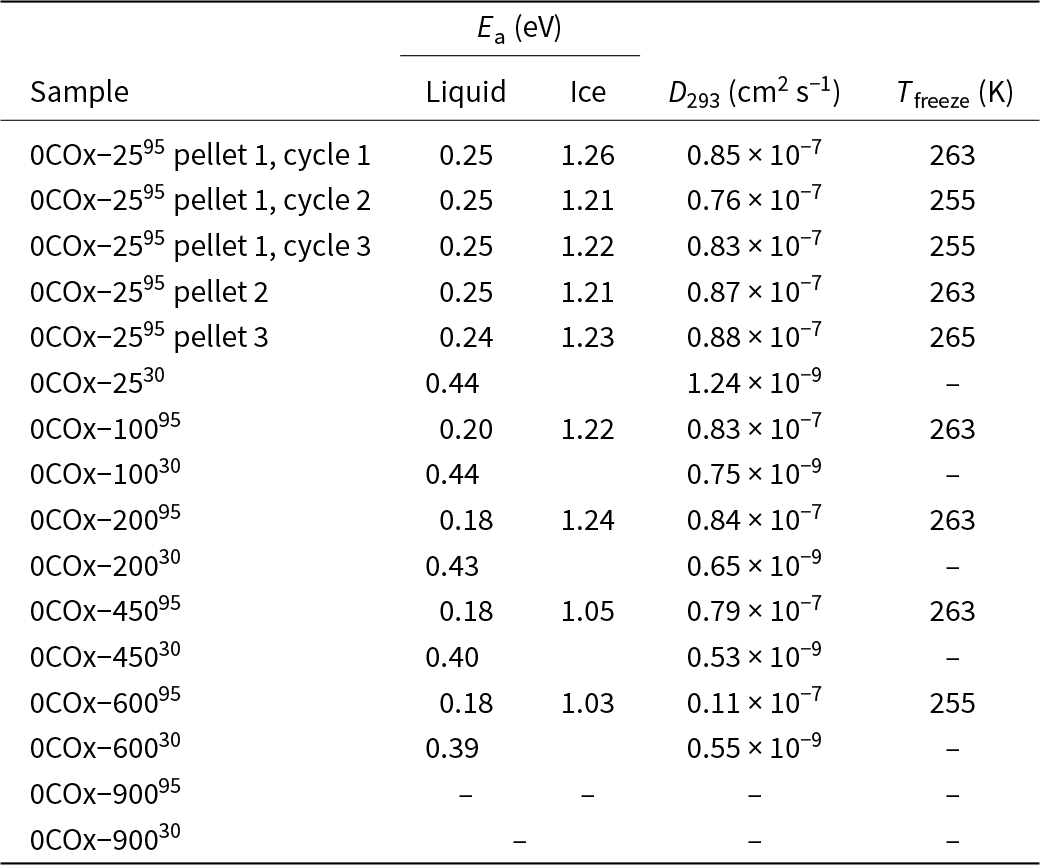
The three successive temperature cycles performed on the same 0COx-2595 pellet show highly similar results. The Arrhenius plots (Fig. 2a) are perfectly superimposable and lead to similar numerical values for E a and the diffusion coefficient (Table 1). The three E a (liquid) values were identical (0.25 eV) for the three successive cycles, whereas a slight decrease was observed in the solid-state E a (ice) from 1.26 to 1.22 eV. The main difference lies in the temperature at which the slope breaks during the first temperature drop ramp (ramp 1). This break in the slope corresponds to the change in the physical state of the water from liquid to ice, which is an indication of its state of confinement. The water molecules probed here constitute the pore solution; this temperature (less than 273 K) is therefore indicative of their confinement imposed by the mesoporosity (pore radius ∼3 nm), but also of the chemical composition (very alkaline and K+ concentrated; see Gomes et al., Reference Gomes, Petit, Frezet, Nedelec, Gharzouni, Rossignol and Renaudin2020a). The slope break decreases from 263 K for the first cycle to 255 K for the two following ones. With the composition of the solution being invariable during these temperature cycles, it is concluded that this lowering in temperature at which the change of state occurs is due to a confinement effect, which is apparently stronger than for the first temperature cycle. We can therefore surmise that during the freezing of the interstitial solution, internal mechanical stress led to the formation of additional micro-cracks, thus shrinking the average pore size. Furthermore, the absence of a shift in the thaw temperature during ramp 2 (269 K for the three temperature cycles) is explained by confinement engendered by the mesoporosity that is assimilated to cylinders, as already demonstrated by thermoporosimetry experiments (Gomes et al., Reference Gomes, Petit, Frezet, Nedelec, Gharzouni, Rossignol and Renaudin2020a). The formation of micropores does not modify the preferential ionic conduction paths through the mesoporosity and therefore does not modify the values extracted from the three temperature cycles for E a (not at all in the liquid state, and shifted very slightly because such formation is easier in the solid state) and for the diffusion coefficient at room temperature.
Arrhenius plots of the reproducibility tests: (a) three successive cycles on the same 0COx-2595 pellet superimposed on one cycle on a 0COx-2530 pellet; (b) one cycle on triplicated 0COx-2595 pellets.

Values extracted from the EEC modelling of the spectra recorded on pure K-geopolymer 0COx-TRH samples: E a from the Arrhenius plot, diffusion coefficient calculated at 293 K during ramp 2 and freezing temperature for 0COx-T 95 samples observed during ramp 1.

The three acquisitions carried out on triplicated 0COx-2595 pellets (Fig. 2b) ensure reproducibility. The extracted values (Table 1) show the reproducibility of E a as well as of the diffusion coefficient. According to these reproducibility tests, uncertainties were evaluated and fixed at ±0.02 eV for E a in liquid, ±0.05 eV for E a in ice and 10% uncertainty for D 293 (uncertainties indicated here therefore correspond to the standard deviations derived from replicates).
Effect of storage relative humidity: 0COx-25R H samples
Figure 2a also superimposes the same pellet preparation (0COx-25RH) followed by storage in wet (95% RH) or dry (30% RH) humidity conditions for almost 2 months of equilibration before AC-IS acquisition. Two striking facts emerge from this superimposition: (1) there is an absence of a break in the slope for sample 0COx-2530; and (2) there is a lower conductivity (∼10–3 S cm–1 at 95% RH and ∼10–5 S cm–1 at 30% RH at room temperature). This is linked to the difference in water saturation present within the mesoporous network: from fully saturated for 0COx-2595, with the liquid solution filling the pore structure, to a simple layer of physisorbed alkaline solution at the pore interface for 0COx-2530. The pellets stored under low RH, with a pore network that is far from being saturated, do not show any change in the physical state of the solution (i.e. a physisorbed layer that does not transform from liquid to solid state), which is associated with a significantly lower quantity of diffusive ions (resulting in a lower diffusion coefficient). However, it should be noted that E a remains in the same order of magnitude for the two storage conditions: 0.25 eV for 0COx-2595 considering the liquid phase and 0.44 eV for 0COx-2530. The values obtained here are in perfect agreement with a previous study in which the nature of alkali cations was investigated: E a for samples dried for 2 months was 0.53 eV for a Na-geopolymer, 0.46 eV for a K-geopolymer (to be compared with the value of 0.44 eV in the present study) and 0.31 eV for a Cs-geopolymer (Melar et al., Reference Melar, Renaudin, Leroux, Hardy-Dessources, Nedelec and Taviot-Gueho2015). This reveals that the ionic conduction mechanism, through mesoporosity, should mainly be attributed to the alkaline cation and is facilitated by the saturation of the interstitial solution. Therefore, this indicates that ionic motion is mediated by a hopping mechanism via surface sites at the solid/liquid interface of the mesoporosity. We can thus conclude that the ions present in the pore solution, which are mainly K+ (with the OH– anions appearing to be secondary for the ionic conduction mechanism here), are preferentially located at this liquid/solid interface, even when the pore volume is saturated with interstitial solution. Such a similarity in the mechanism of ionic conduction under dry or wet atmospheres (i.e. under water saturation or not of the porous network) may seem counterintuitive. However, recent data from the literature provide greater understanding regarding this observation: the molecular dynamic behaviour of water molecules confined in a clay pore shows a strong increase in aqueous viscosity with decreasing pore size (Zhang et al., Reference Zhang, Tan, Zhu, Pei and Shi2025). The nanometric pore sizes measured in our samples (Gomes et al., Reference Gomes, Petit, Frezet, Nedelec, Gharzouni, Rossignol and Renaudin2020a) are perfectly consistent with there being a limited number of water molecules around each solvated K+ cation. Consequently, in this confined state (whether under low or high humidity) the ions never behave like species in solution, and their motion occurs near the solid/liquid interface via a hopping mechanism. Such a mechanism of ionic transport by hopping from site to site at the solid/liquid interface may represent the transposition of the electrically activated attachment/detachment model mechanism for the migration of species in strongly alkaline solutions through a porous media (Bai et al., Reference Bai, Wu, Nie, Liu and Jia2025a, Reference Bai, Wu, Zhou, Wu and Zhang2025b).
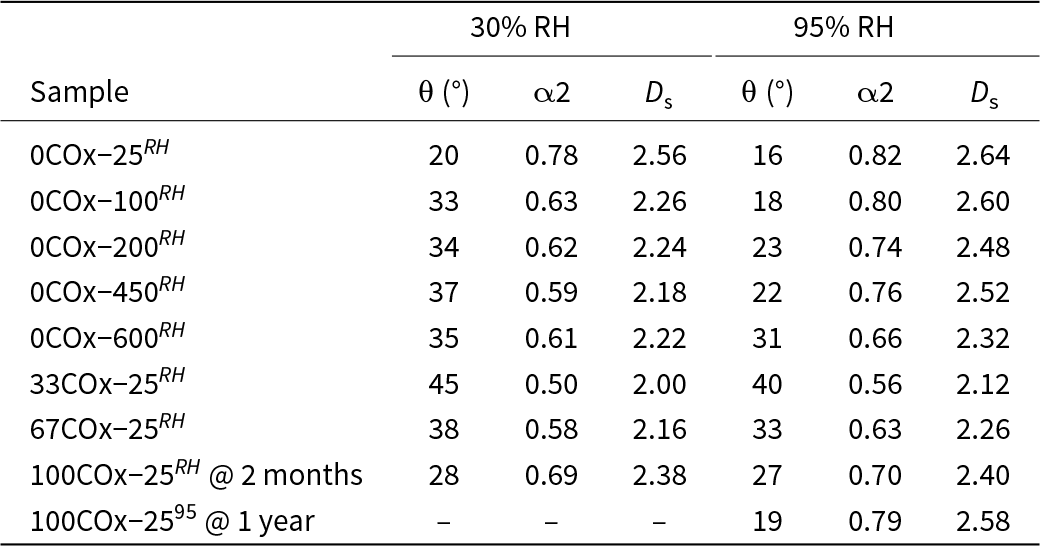
The calculation of the D s fractal dimension associated with the conduction paths indicates a relatively equivalent state of the mesopore interface whatever the capillary liquid saturation, with values of 2.56 and 2.64 (Table 2) for the 0COx-2530 and 0COx-2595 pellets, respectively. Such D s values – not so far from the ideal value of 3 – indicate a relatively smooth interface, in agreement with continuous, uniform and little-disturbed ionic conduction paths. The slightly lower D s value under low RH is then easily explained by conduction paths that are slightly disturbed by the absence of a continuous aqueous medium in the mesoporous network, in agreement with the previously mentioned higher E a value for 0COx-2530.
Determined depression angle θ, corresponding arc depression factor α2 and calculated D s fractal dimension of the mesopore interface corresponding to the ionic conduction mechanism.

We can also notice in Fig. 2 that the last spectra (no. 78) at 293 K is almost equivalent to the starting spectra (no. 1; already at 293 K), as well as spectra no. 51 (still at 293 K, during ramp 2), which remains true for both storage media. This is a new indication of the airtight nature of the cell used, and this makes it possible to validate all of the 78 acquisitions carried out during the temperature cycle for each pellet. From this point on for the rest of this paper, only the points corresponding to ramp 2 (rise in temperature from 243 to 313 K) will be shown in the figures for the sake of concision and clarity. This ramp 2 was used for the Arrhenius plot of each measured pellet to determine and compare their activation energies and diffusion coefficients at 293 K.
Effect of post-synthesis thermal treatment: 0COx-TRH series
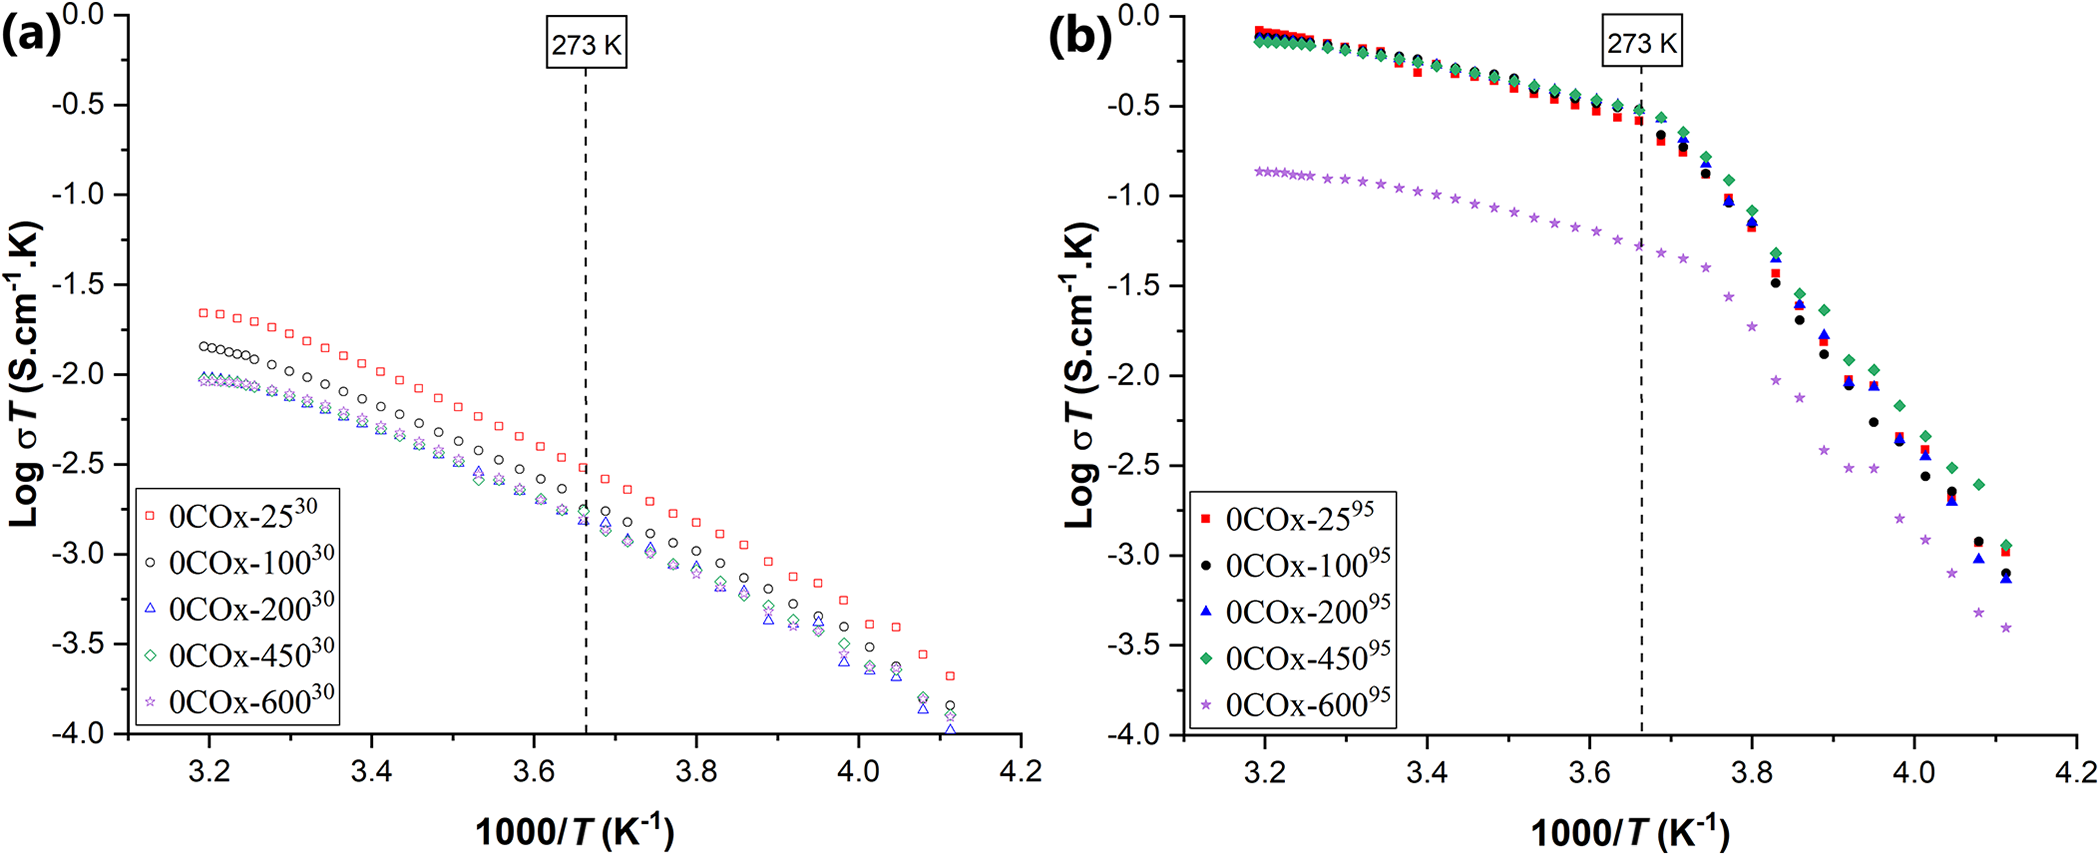
All of the Arrhenius plots regarding pure K-geopolymers are shown in Fig. 3, consisting of 0COx-TRH samples with post-synthesis heat treatment up to 600°C followed by dry and wet storage. Visually, the heat treatment up to 450°C does not greatly affect E a (similar slopes) and impacts only slightly the diffusion coefficient (straight lines slightly shifted downwards). However, the measurements carried out on the samples heated to 900°C (wet and dry storage) cannot be represented in Fig. 3 because the recorded AC-IS spectra cannot be modelled by an EEC. They actually correspond to an infinite resistivity, indicating the absence of any ionic conduction paths (i.e. the closure of the ‘through-hole’ mesoporosity as clearly established previously by dilatometry (Gomes et al., Reference Gomes, Frezet, Petit, Petlickaia, Rossignol, Texier-Mandoki and Renaudin2021) and by direct measurements using thermoporosimetry and sorption nitrogen isotherms (Gomes et al., Reference Gomes, Petit, Frezet, Nedelec, Gharzouni, Rossignol and Renaudin2020a)).
Superposition of the Arrhenius plots extracted from the pure K-geopolymers: (a) 0COx-T 30 dry pellets; and (b) 0COx-T 95 wet pellets.

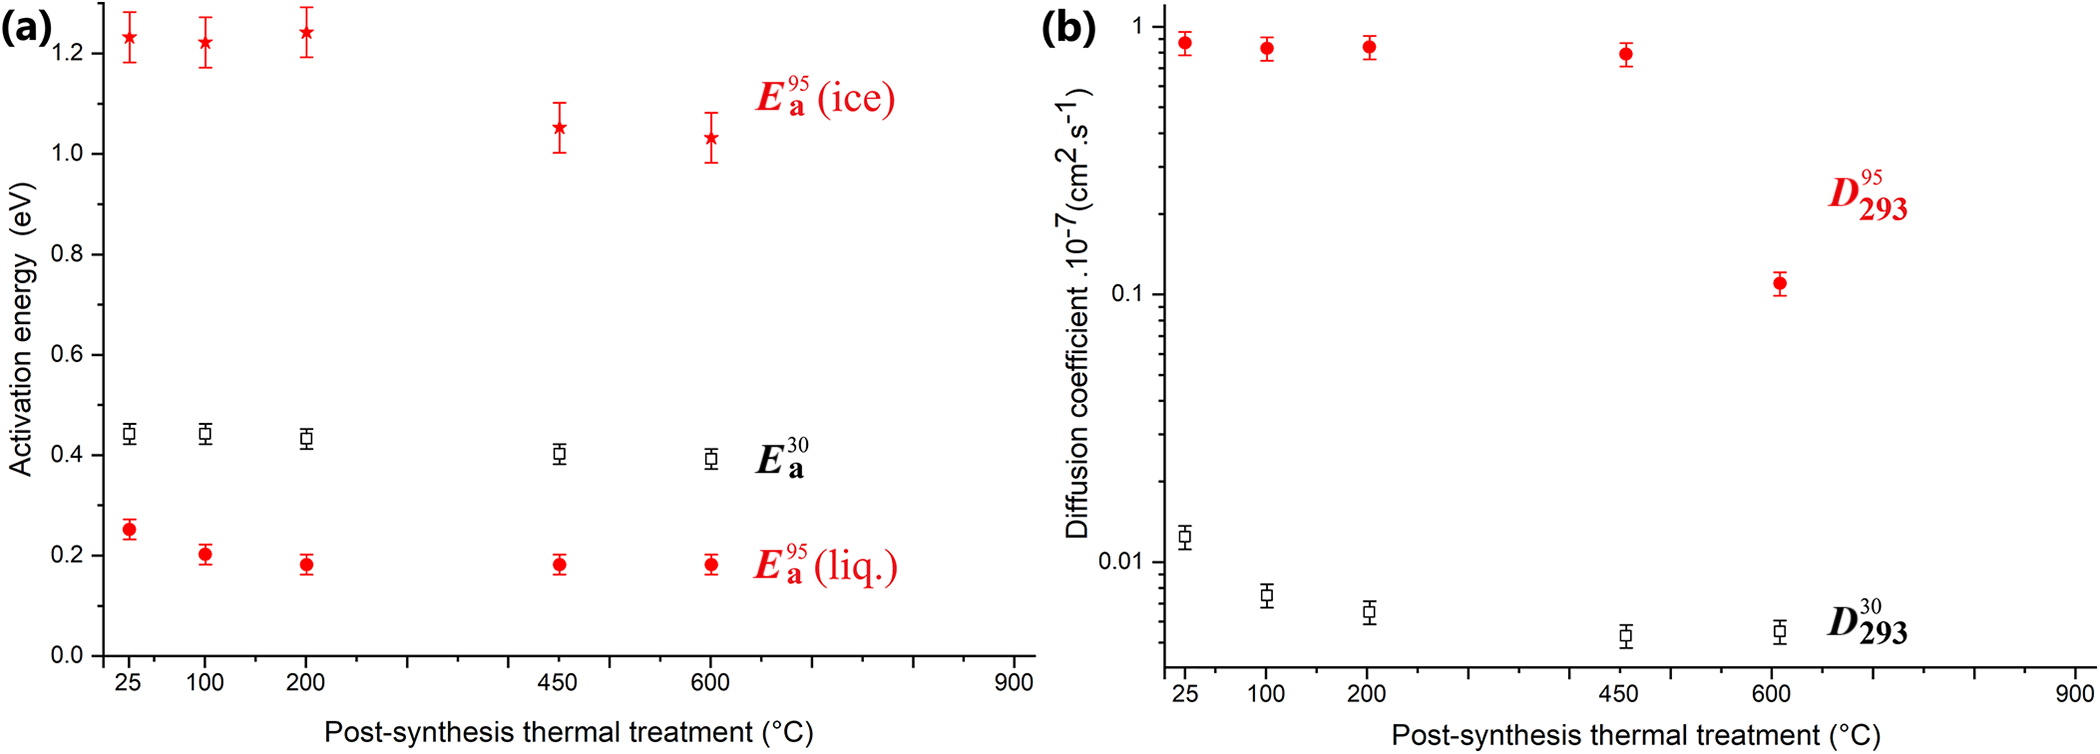
Further observation of the effect of heat treatment is based on the values compared in Fig. 4a & Table 1. The activation energies change only moderately, with relatively similar variation for both storage media, showing a slight decrease in energies with temperature, indicating a facilitation of K+ motion. Again, this confirms the identical ionic conduction mechanism, with the same K+ charge carriers, for both physical states and both storage conditions. The facilitation of ionic displacement (indicated by the decrease in E a) is to be compared with the decrease in the fractal dimension present at the interface associated with the involved mechanism (from 2.6 for 0COx-25RH pellets to 2.2 for heat treatment at 600°C; Table 2). As observed during the three successive cycles on the same 0COx-2595 pellet (see ‘Cell control: reproducibility of AC-IS acquisitions (0COx-2595 sample)’ section earlier), the 0COx-60095 pellet shows a decrease in the freezing temperature to a value of 255 K. Again, this can be explained by the formation of micro-cracks due to the effects of the thermal treatment (inducing dimensional stress; see Gomes et al., Reference Gomes, Frezet, Petit, Petlickaia, Rossignol, Texier-Mandoki and Renaudin2021). This micro-crack formation could explain the decrease in both E a and D s values via an increase in more heterogeneous conduction paths.
Variations in (a) E a and (b) diffusion coefficient with the temperature of the post-synthesis thermal treatment for the pure K-geopolymer 0COx-TRH pellets (0COx-T 30 series in black and 0COx-T 95 series in red). liq. = liquid.

The variation in the diffusion coefficient is more noticeable (Fig. 4b & Table 1), especially under high RH, with a strong decrease after heat treatment at 600°C (reduced by almost 10-fold). As the mechanism is not blocked (decrease in E a) and the porosity is not yet closed (Gomes et al., Reference Gomes, Petit, Frezet, Nedelec, Gharzouni, Rossignol and Renaudin2020a), this significant drop in  $D_{293}^{30}$ indicates the loss of the main charge carriers from the mesoporous interface. It is interesting to note that even if the diffusion coefficients for dry 0COx-T 30 geopolymers are very low, they still show a clear change, with a notable decrease up to 450°C, even though the mechanism is not hampered (decrease in E a). It therefore seems that heat treatments generate a progressive loss of charge carriers, which leave the interstitial liquid. We can then deduce that, in humid storage, the transfer of K+ ions to the mineral matrix is reversible up to 450°C, whereas such reversibility does not exist under dry conditions. Such a transfer of alkali cations from the mesoporous liquid to the mineral matrix, across the interface, is similar to the chemisorption and physisorption phenomena recently described for the theoretical and experimental coupling of Al3+ (Long et al., Reference Long, Yan, Wu, Qiu, Zhou and Qiu2025).
Variations in the interface fractal dimension also differentiate the two storage conditions (Table 2). The D s value already decreases at 100°C for dry storage under 30% RH, showing D s values of 2.3 for 0COx-10030 and then ∼2.2 for 0COx-T 30 pellets (T = 200°C, 450°C and 600°C). Under wet 95% RH storage, D s variation is delayed, still being ∼2.5 for heat treatment up to 450°C and decreasing to 2.3 only for the 0COx-60095 sample. This indicates a change in the interface, which becomes rougher from 100°C, with a reversible feature for temperatures up to 450°C in the case of wet storage. Both micro-crack formation and K+ chemical transfer could be responsible for the observed decrease in D s.
Impact of argillite loading: XCOx-TRH series with X > 0
Effect of the added argillite filler amount: XCOx-2530 samples
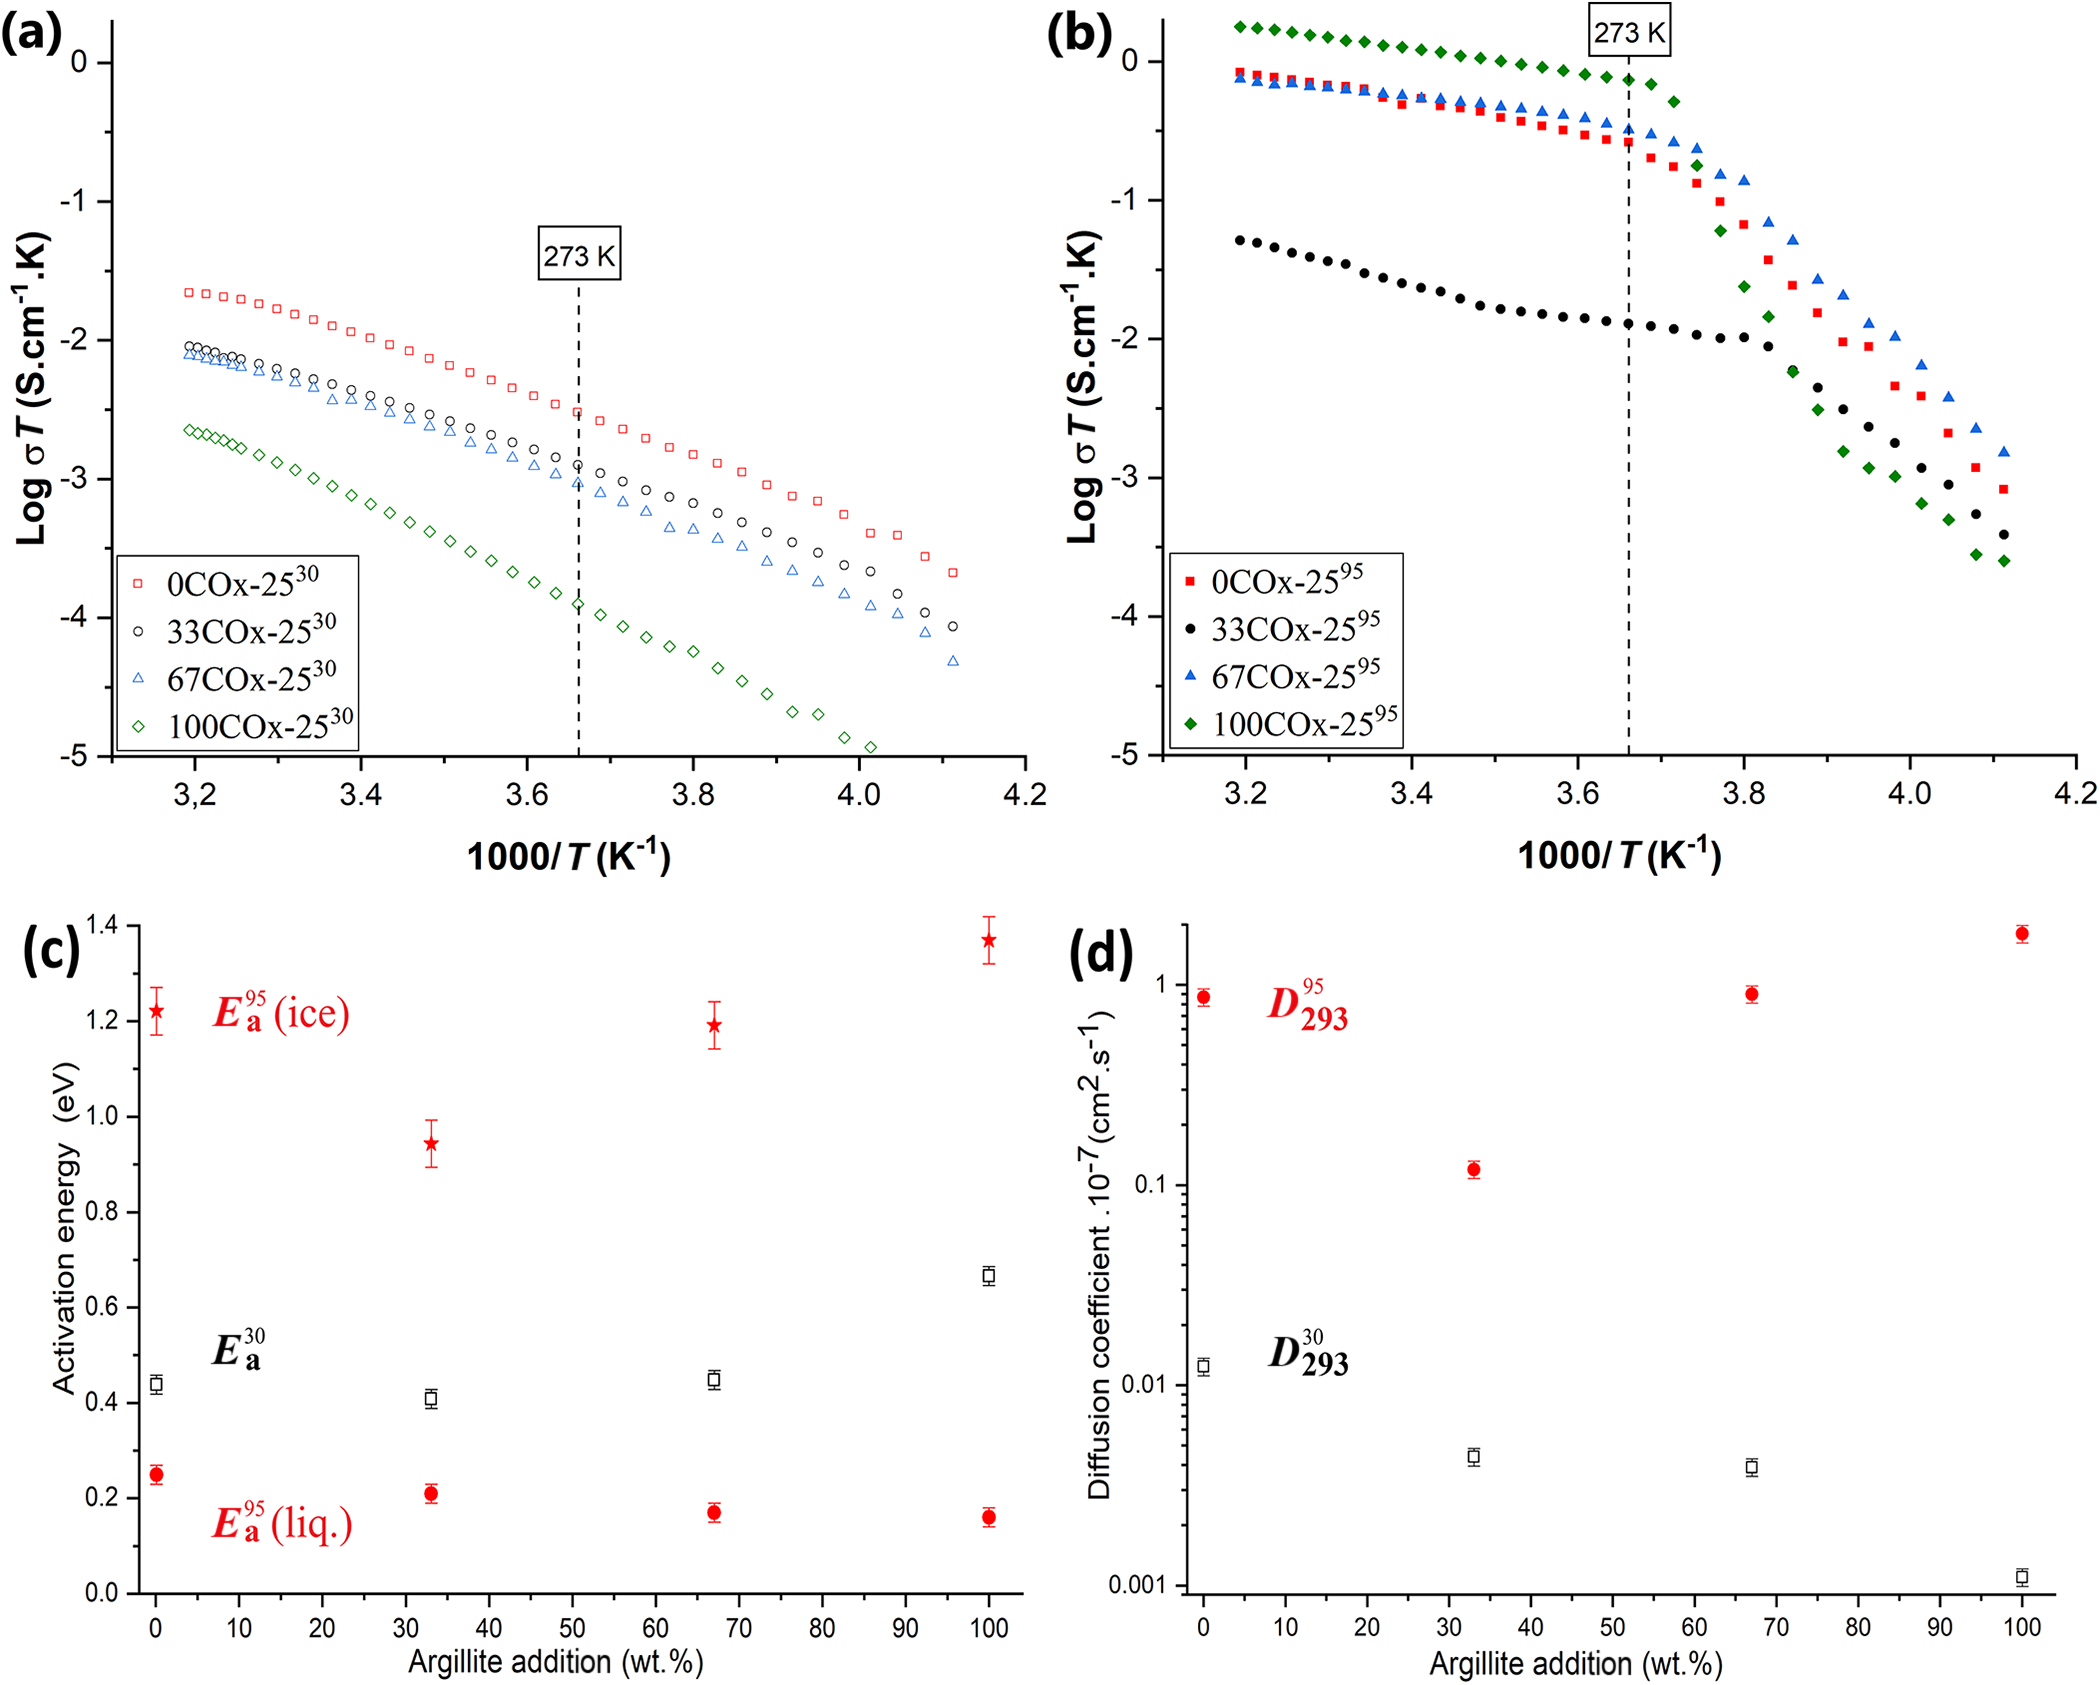
As shown in Fig. 5a, a decrease in conductivity is observed under dry storage with the addition of argillite, which is confirmed by the numerical values of ${\text{D}}_{293}^{30}$ diffusion coefficients in Fig. 5d & Table 3. This observation is directly correlated with the loss of mesoporous volume that was measured previously with the addition of argillite filler (Gomes et al., Reference Gomes, Frezet, Petit, Petlickaia, Rossignol, Texier-Mandoki and Renaudin2021). This highlights the fact that the alkaline activation of argillite does not lead to a mesoporous matrix. The decrease in pore volume is naturally correlated with the reduction in the part of the material corresponding to the metakaolin alkaline activation (i.e. the pure K-geopolymer part).
Superposition of the Arrhenius plots extracted from the XCOx-25RH samples: (a) XCOx-2530 dry pellets; and (b) XCOx-2595 wet pellets. Variation in the extracted (c) activation energies and (d) diffusion coefficients with argillite addition is also shown. liq. = liquid.

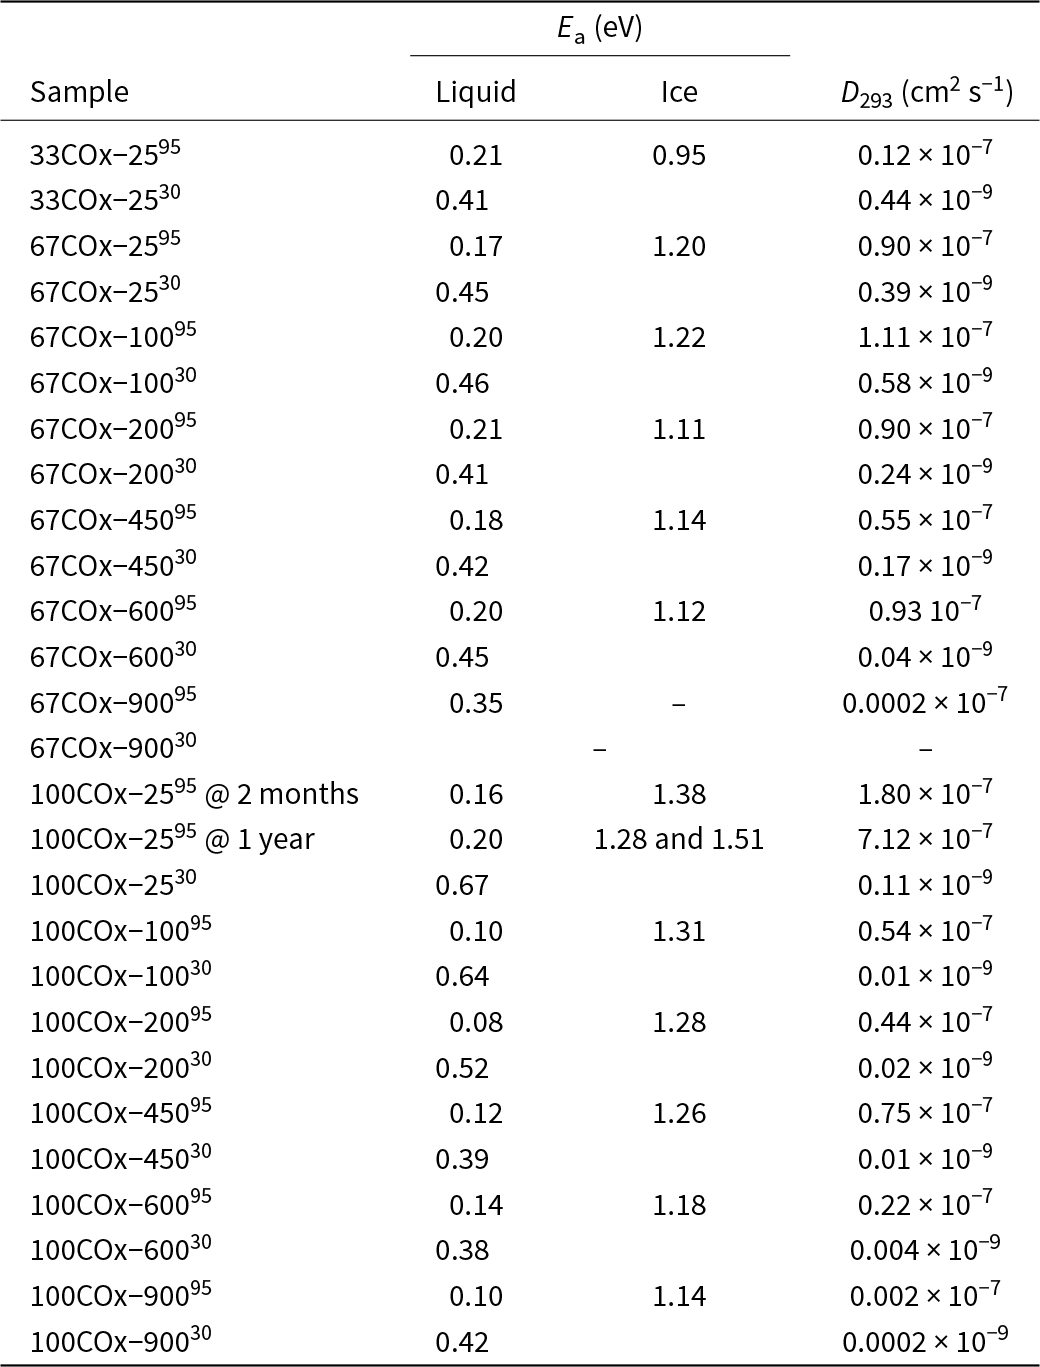
Values extracted from the EEC modelling of the spectra recorded on argillite-added XCOx-TRH (X = 33, 67 and 100) samples: E a from the Arrhenius plot and the diffusion coefficient calculated at 20°C.

The case of the pure alkali-activated argillite 100COx-2530 sample is somewhat different. Not only do we observe a strong decrease in the diffusion coefficient but also an increase in the associated E a (Fig. 5c & Table 3), corresponding in Fig. 5a to the rise in the slope for the 100COx-2530 plot compared to the other XCOx-2530 plots. We can therefore see here that the ionic conductivity mechanism in the materials based on the alkaline activation of the argillite is different from that corresponding to the pure geopolymer part. This new conduction path having a higher E a of 0.67 eV for the 100COx-2530 sample vs ∼0.44 eV for the pure geopolymer (Fig. 5c & Tables 1 & 3) indicates that the activated argillite inorganic framework reduces the ease of mobility for the charge carriers. Moreover, the diffusion coefficient gradually decreases with the addition of argillite filler (i.e. with the decrease in the pure geopolymer part), being three-fold less for the intermediate composite compositions of 33COx-2530 and 67COx-2530 and then by a factor of almost 10 for the 100COx-2530 purely argillite activated sample compared to 0COx-2530. Again, the reduction by an order of magnitude for the diffusion coefficient has to be correlated with a decrease in the mesopore volume between the two 0COx-25RH and 100COx-25RH limit compositions (Gomes et al., Reference Gomes, Frezet, Petit, Petlickaia, Rossignol, Texier-Mandoki and Renaudin2021).
Interface fractal characterization for XCOx-2530 pellets (Table 2) confirmed the non-homogeneous nature of the mineral matrix upon addition of argillite. The D s value sharply decreased to 2.0 for the 33COx-2530 pellet, then rose slightly to 2.2 and 2.4 for 67COx-2530 and 100COx-2530, respectively. The value of 2.4 for the 100COx-2530 pellet (compared to 2.6 for 0COx-2530) indicated a less ideal (i.e. less smooth) interface for argillite alkaline activation (compared to metakaolin activation). The lowest D s values observed for the two mixed XCOx-2530 (X = 33 and 67) pellets suggest the coexistence of the two poorly connected mineral subnetworks, each providing its own ionic conduction paths.
Effect of storage relative humidity: XCOx-2595 samples
The results from the AC-IS spectra recorded from samples stored in the 95% RH wet atmosphere show a different trend with argillite addition. Although we clearly observe the expected drop in conductivity between the 0COx-2595 and 33COx-2595 samples, we then see a clear recovery in conductivity when further increasing the amount of argillite (Fig. 5b). Sample 67COx-2595 is equivalent in conductivity to pure K-geopolymer, and the pure alkali-activated argillite sample 100COx-2595 outperforms every other sample when considering the liquid state of the interstitial solution. Regarding the ice part of the Arrhenius plot for this 100COx-2595 pellet, we visually observe an increase in the slope (directly related to an increase in E a; Table 3), along with a loss in linearity at the lower temperatures. These observations indicate a change in the mineral matrix formed by the alkali-activated argillite, induced by storage under water-saturated conditions. Although initially this matrix had very little or no porosity, as shown by the Arrhenius plots for dry samples (Fig. 5a), new paths were created that enabled ionic conduction when stored under high-humidity conditions. A small decrease in E a (considering the liquid state of the interstitial solution) was then measured with the addition of argillite in wet storage (∼0.18 eV for the 67COx-2595 and 100COx-2595 samples compared to ∼0.25 eV for the 0COx-2595 and 33COx-2595 samples). Moreover, it should be noted that sample 33COx-2595 seems to present these two activation energies, with an Arrhenius plot parallel to 0COx-2595 for T > 290 K and parallel to 100COx-2595 (or 67COx-2595) for 260 K < T < 290 K. This limited change in E a is combined with a clearer variation in the diffusion coefficients, consisting of a sharp decrease at first (seven-fold reduction for 33COx-2595 compared to 0COx-2595), followed by a strong increase (two-fold increase for 100COx-2595 compared to 0COx-2595). This therefore calls into question the occurrence of a resumption of the alkaline activation induced by the presence of water, as had been assumed previously (Gomes et al., Reference Gomes, Frezet, Petit, Petlickaia, Rossignol, Texier-Mandoki and Renaudin2021). This continuation of alkaline activation in a wet atmosphere leads to the formation of a new kind of open porous network, facilitating ionic conduction to a significant extent. The freezing temperature observed for sample 33COx-2595 (T freeze ≈ 260 K; Fig. 5b) supports the notion of the existence of a mesoporous network of extremely small diameter with extremely confined interstitial liquid.
As mentioned earlier for dry storage, XCOx-2595 pellets (X > 0) present low fractal surface dimensions, particularly for mixed samples (X = 0.33 and 0.67; Table 2). Again, this suggests the coexistence of two distinct mineral subnetworks, each one with its own ionic conduction mechanism. It is interesting to note the increase in interface fractal dimension for the 100COx-2595 sample, increasing from 2.4 to 2.6 after 1 year (Table 2).
Ageing effect in a humid atmosphere: the 100COx-2595 sample
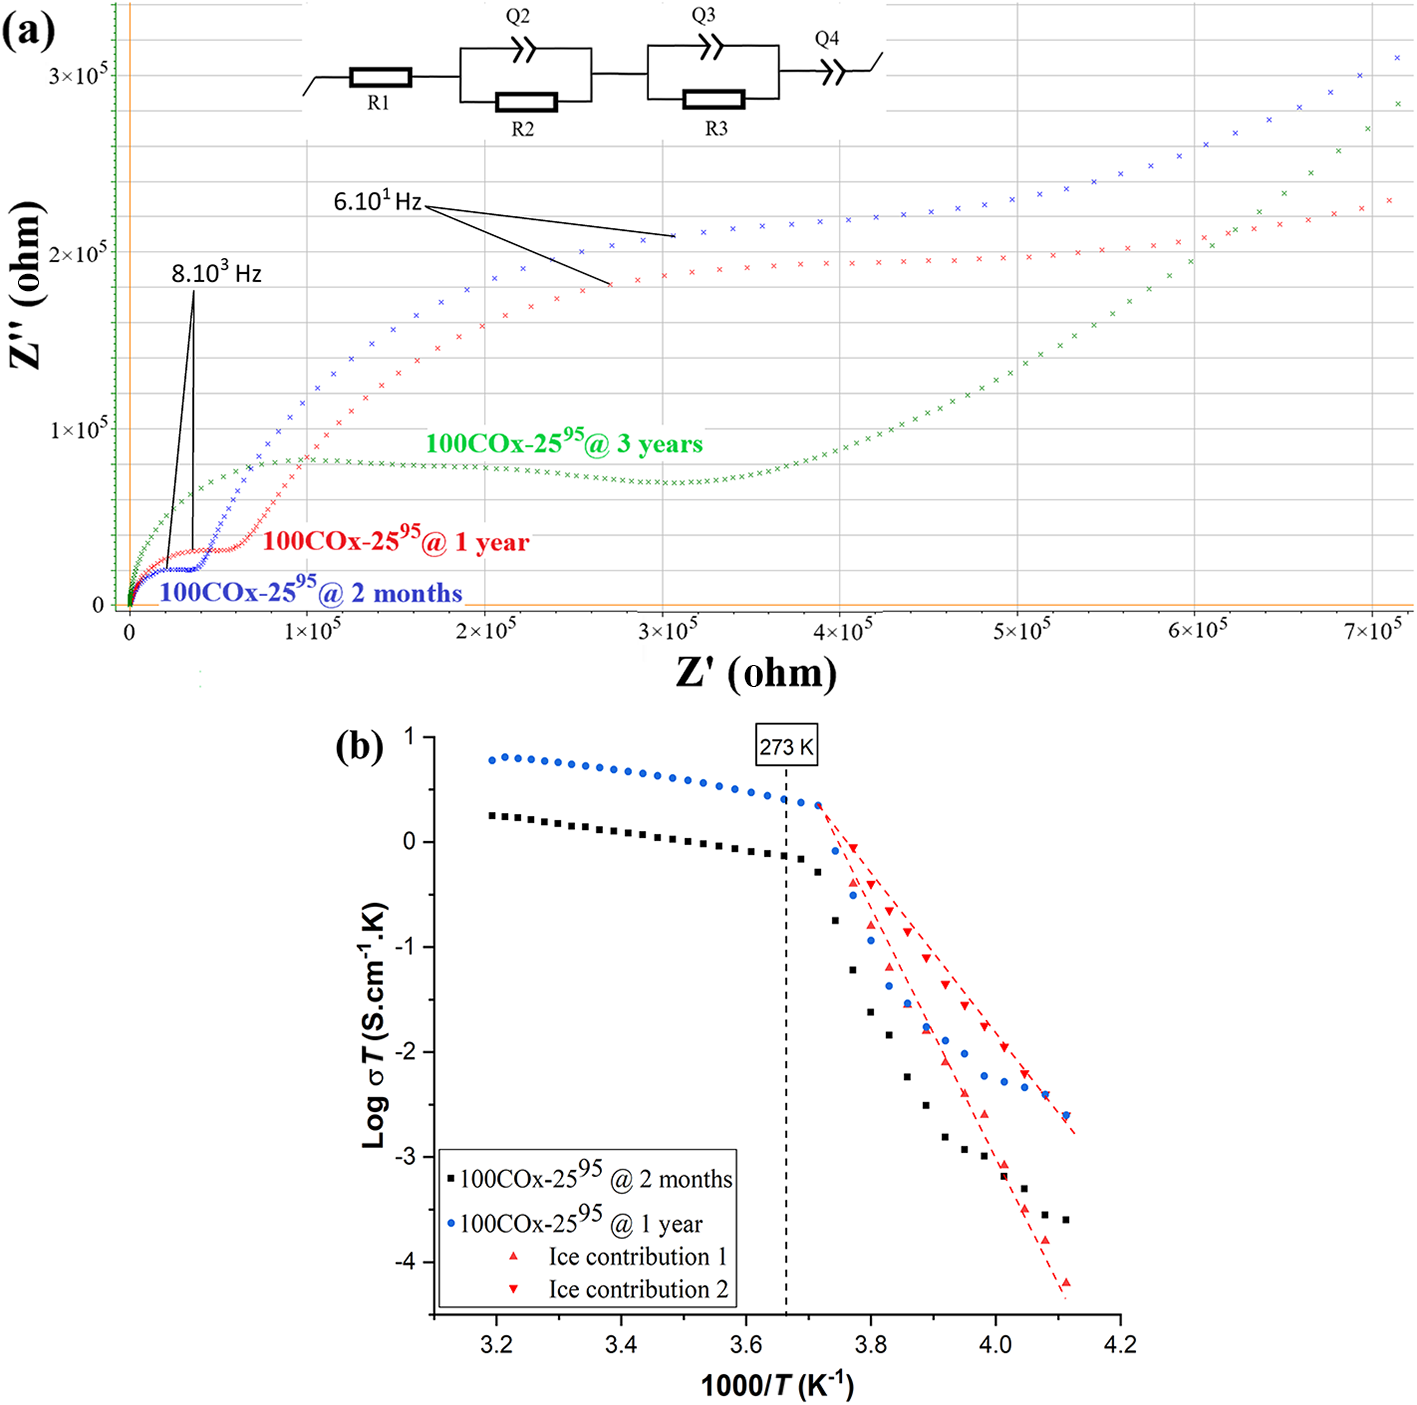
The Arrhenius plot of sample 100COx-2595 is somewhat different from all of the others due to the loss of linearity at very low temperatures (T < 255 K; Fig. 5b), which can be correlated with the existence of two distinct conduction paths. Indeed, the electrical response of the pure alkali-activated argillite material conserved in a humid atmosphere (100COx-2595 pellet) is very different from those of the other samples, particularly due to the presence of two separate capacitive arcs (Figs 6a & S3). These two capacitive reactance arcs are linked to two time constants (τα = RC, where τ is the time constant, α is the arc depression factor, R is the resistance and C is the capacity), each coming from its own conduction path. The first capacitive arc observed at high frequencies presents a τ2 value of a few microseconds (as is commonly observed for all of the pellets studied here with a single capacitive arc), whereas the second capacitive arc (mid-frequencies) presents a τ3 value of a few tenths of a millisecond, corresponding to a denser structure correlated with lower D s values. The two conduction paths may correspond to what has been described as a polymer gel and internal pore solution by Guo et al. (Reference Guo, Wu, Gao, He, Ma, Huang and Bai2021) in a red mud-coal metakaolin geopolymer. Similarly to this previous study, we used an EEC with two CPEs in series (see inset in Fig. 6a). The ‘first’ capacitive arc (i.e. that observed for the high frequencies: 8000 Hz) corresponds to those observed in all of the samples from the present study (K+ ionic motion through the mesoporous network of the geopolymer; i.e. internal pore conduction). The ‘second’ capacitive arc (i.e. observed for intermediate frequencies: 60 Hz) should correspond to more difficult ionic motion (the moderate alkaline activation of argillite; i.e. polymer gel). However, it should be noted that this second capacitive arc is highly flattened, indicating a strong deviation from the ideal Debye case for its associated conduction mechanism.
(a) Nyquist representations of the spectra Z”–Z’ (ohm) measured at 243 K for the three 100COx-2595 pellets conserved for up to 3 years in a humid atmosphere. The EEC used for the impedance modelling of the spectra with two capacitive arcs is also shown. (b) Superposition of the Arrhenius plots extracted from the 100COx-2595 sample after 2 months and 1 year of conditioning in a humid atmosphere.

It is interesting to look at the variation in the electrical response of this 100COx-2595 sample stored for 1 year in a humid atmosphere (Fig. 6a). Ageing in a humid atmosphere for 1 year resulted in a better resolution of the high-frequency capacitive arc, which allowed the refinement of the two corresponding CPEs (Fig. 6b). The total impedance (Z), separated into four distinct elements, was then formulated as in Equation 9 for the 100COx-2595 pellet after 1 year:
 \begin{align}Z\left( f \right) = {R}1 + { }\frac{{{R}2}}{{{R}2.{Q}2.{{\left( {j.2{\pi }.f} \right)}^{{\alpha }2}} + 1}} &+ \frac{{{R}3}}{{{R}3.{Q}3.{{\left( {j.2{\pi }.f} \right)}^{{\alpha }3}} + 1}}\nonumber\\ &\quad+ \frac{1}{{{Q}4.{{\left( {j.2{\pi }.f} \right)}^{{\alpha }4}}}}\end{align}
The more defined high-frequency arc is attributed to domains where the ionic conduction is facilitated, most probably through the mesoporous network that is usually characteristic of geopolymers. This therefore reflects the resumption of alkaline activation of the argillite, leading – after a long shelf life – to a mesoporous mineral matrix of a geopolymer type. The loss of linearity observed for the 100COx-2595 sample below the freezing temperature in fact reflects the characterization of E a of the first ionic conduction path observable between 269 and 259 K (1.51 eV; Fig. 6b & Table 3), and then the characterization of E a of the second ionic conduction path observable between 247 and 243 K (1.28 eV; Fig. 6b & Table 3). The intermediate temperature, from 259 to 247 K, corresponds to the superimposition of both conduction regimes.
The pellet stored for 3 years in the 95% RH environment again exhibits an increase in the high-frequency capacitive arc, combined with increased flattening of the second contribution. However, we should note that this presence of two capacitive arcs (and consequently the loss of linearity of the Arrhenius plot below freezing temperature) was only observed for the pure argillite-activated pellets. Despite the large amount of argillite in its formulation, sample 67COx-2595 displayed an electrical response with a single capacitive loop, corresponding to the easiest ionic motion. The weak D s fractal dimension of 2.3 for this 67COx-2595 pellet is an indication of relatively limited percolation between the two mineral subnetworks, implying different K+ motion mechanisms.
Effect of post-synthesis thermal treatment: 67COx-TRH and 100COx-TRH series
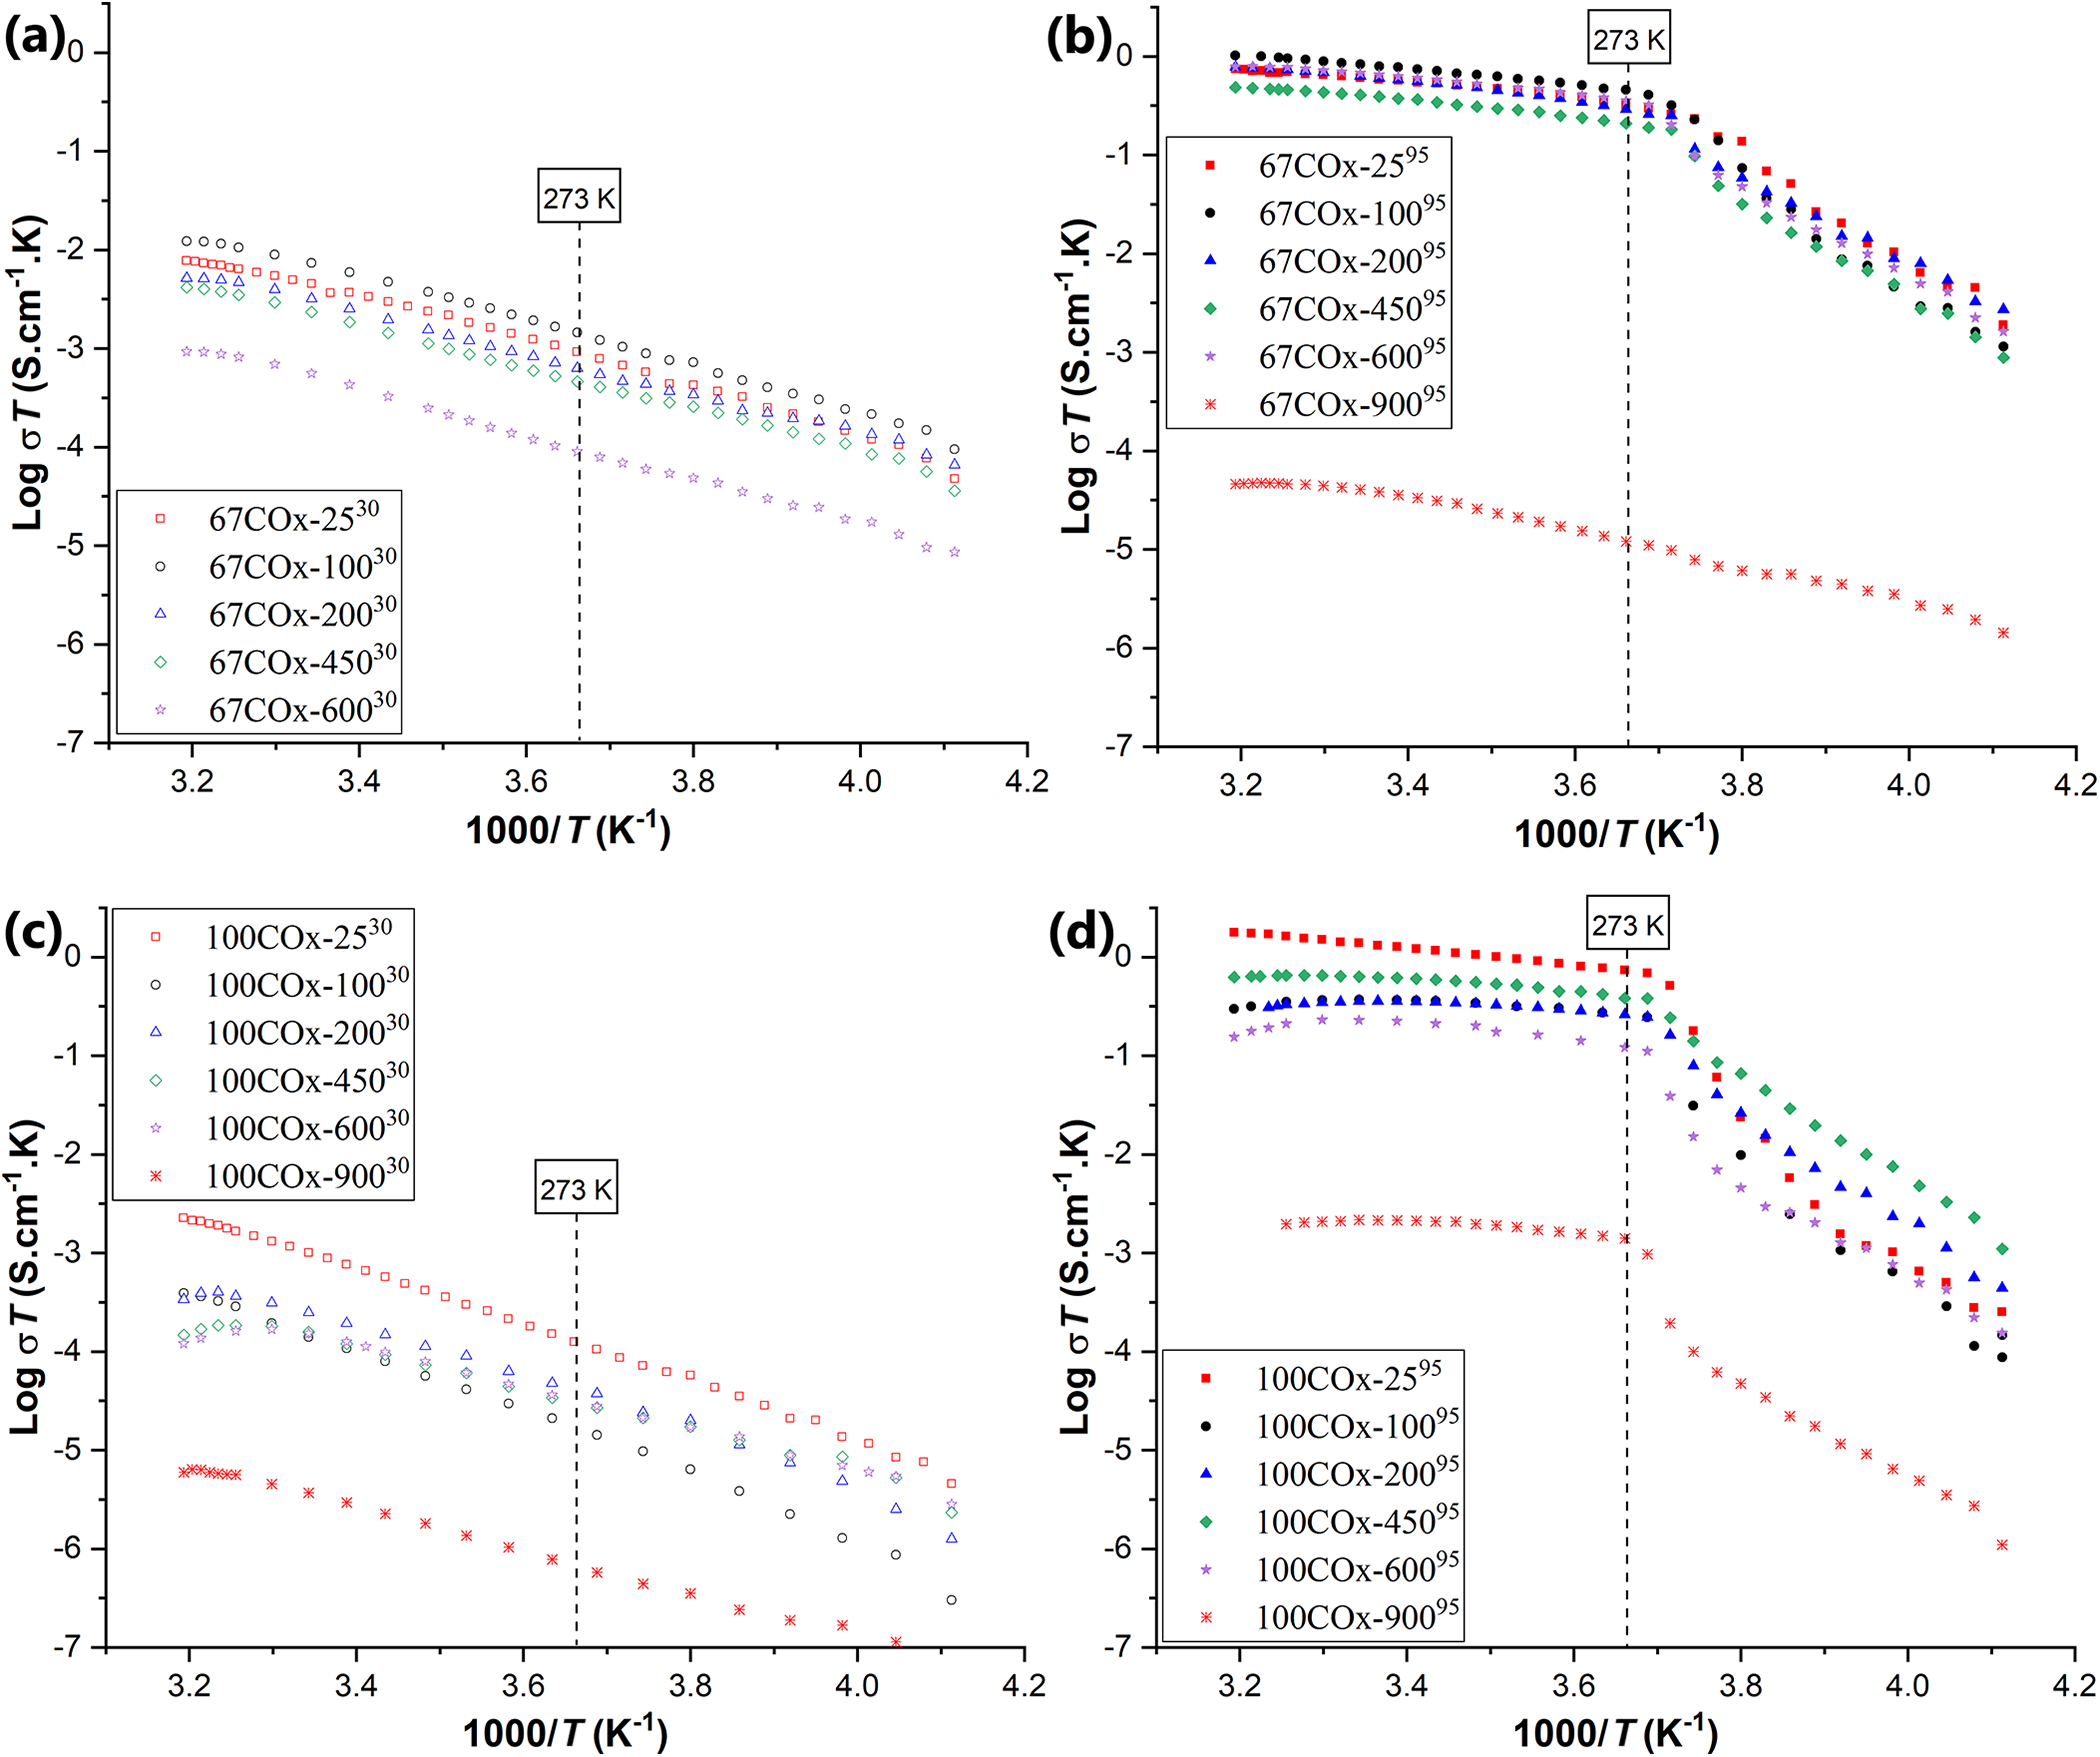
The effects of a post-synthesis thermal treatment were observed for the two 67COx and 100COx formulations, and both dry and wet storage conditions were considered. All of the corresponding Arrhenius plots are shown in Fig. 7 for 67COx-TRH and 100COx-TRH pellets. Extracted activation energies and diffusion coefficients are listed in Table 3 and represented in Fig. S4.
Superposition of the Arrhenius plots extracted from the 67COx-TRH samples for (a) dry and (b) wet conditioning, and the 100COx-TRH samples for (c) dry and (d) wet conditioning.

When considering the dry storage of pellets (at 30% RH), it appears that an increase in the heat treatment temperature generates a reduction in the diffusion coefficient. E a is only very slightly affected by the heat treatment for the 67COx-T 30 series. However, we can observe a reduction in E a from 450°C for the 100COx-T 30 series, with values close to the geopolymer 0COx-2530 sample. Furthermore, it can be noted for the first time that it was possible to process the response of the pellet treated at 900°C and stored in a dry atmosphere (Fig. 7c). Although the conductivity was extremely low, we found a conduction mechanism with an E a corresponding to the mesoporosity of the geopolymer. This also seemed to indicate that the heat treatment reactivated the geopolymerization process (i.e. the alkaline activation of the argillite).
Under high humidity (95% RH storage), the resumption of alkaline activation was already visible for the 67COx formulation, with an Arrhenius plot extracted from the electrical responses of the 67COx-90095 pellet, although no change in the physical state of the capillary liquid was detectable (due to the very small quantity of charge carriers involved). The diffusion coefficients of the 100COx series were higher than those observed for the 67COx series (Table 3 & Fig. S4). This comparison, associated with a greater E a, indicates a more rapid frontal diffusion in the former series, but which is also more temperature-dependent than for the latter. Again, this indicates slowed and hampered conduction in the gel from the activated argillite material, which is then facilitated by the resumption of the alkaline activation initiated by the heat treatment, which then generates a more classic geopolymer mesoporous network (such as that stored in a wet atmosphere).
Discussion
All of the results obtained concerning the ionic conduction properties in our alkali-activated materials were evaluated by comparison with the previously reported results extracted from other solid characterization techniques. This allowed us, initially, to validate our interpretations of the responses of the pellets prepared and analysed using AC-IS. Thus, the results presented here subsequently enabled a complete description of the prepared alkali-activated composites, and in particular they enabled the confirmation of what had been previously and tentatively inferred without definitive experimental proof (Gomes et al., Reference Gomes, Petit, Frezet, Nedelec, Gharzouni, Rossignol and Renaudin2020a, Reference Gomes, Petit, Frezet, Thirouard, Taviot-Gueho and Gharzouni2020b, Reference Gomes, Frezet, Petit, Petlickaia, Rossignol, Texier-Mandoki and Renaudin2021).
Open and highly traversable character of the mesoporous network
The results extracted from AC-IS analyses carried out on the pure geopolymer 0COx-25RH samples are in agreement with the presence of open porosity passing through the prepared monolithic pellets. The E a of the ionic conduction mechanism of 0.44 eV for dry atmosphere storage (0COx-2530 in Table 1) is in perfect agreement with the data from the literature (Melar et al., Reference Melar, Renaudin, Leroux, Hardy-Dessources, Nedelec and Taviot-Gueho2015) and clearly indicates that the ionic conduction mechanism examined corresponds mainly to the migration of solvated K+ cations along the mesopores characteristic of a geopolymer matrix. The filling of the mesoporosity by water in a high-humidity atmosphere only moderately facilitates ionic conduction through the pellet (E a decreases to 0.25 eV for 0COx-2595; Table 1), indicating a quite similar ionic conduction mechanism that is therefore ensured by jumps from site to site at the solid/liquid interface (i.e. at the surfaces of the mesopores). This is in agreement with residual water levels under a dry atmosphere and corresponds to a physisorbed layer on the surface of the internal porosity of the geopolymer (Gomes et al., Reference Gomes, Petit, Frezet, Nedelec, Gharzouni, Rossignol and Renaudin2020a). The results for the whole 0COx-TRH series agree with the thermal variation of the mesoporous network already characterized by the nitrogen adsorption isotherm and thermoporosimetry (Gomes et al., Reference Gomes, Petit, Frezet, Nedelec, Gharzouni, Rossignol and Renaudin2020a, Reference Gomes, Frezet, Petit, Petlickaia, Rossignol, Texier-Mandoki and Renaudin2021), with there being almost no variation from room temperature up to 600°C, then the closure of the mesoporosity at 900°C due to viscous sintering. The mesopore interface, being the location of the chemical diffusion mechanism, is relatively smooth (D s value of ∼2.6; Table 2) and changes little with the temperature.
For storage in a dry atmosphere, E a does not show any change up to 600°C (indicating that the conduction mechanism remains the same), but the diffusion coefficient gradually decreases from 1.24 × 10⁻⁹ cm2 s–1 for 0COx-2530 to 0.55 × 10⁻⁹ cm2 s–1 for 0COx-60030 (Fig. 4b & Table 1). This ratio of ∼2.5 corresponds to the reduction in the quantity of water physisorbed at 30% RH (13 wt.% at 25°C vs 5 wt.% at 600°C; see Gomes et al., Reference Gomes, Petit, Frezet, Nedelec, Gharzouni, Rossignol and Renaudin2020a), thus corresponding to the water of solvation of the K+ cations ensuring ionic conduction in these monolithic pellets. In the same way, the diffusion coefficient at 25°C and 30% RH decreases very significantly with the addition of argillite from 1.24 × 10⁻⁹ cm2 s–1 for 0COx-2530 to 0.11 × 10⁻⁹ cm2 s–1 for 100COx-2530 (Fig. 5d & Table 3); this must be linked to the sharp reduction in the amorphous part of the activated materials (from 99 wt.% for 0COx-2530 to 43 wt.% for 100COx-2530), associated with a net decrease in the mesopore volume (from 0.282 cm3 g–1 for 0COx-2530 to 0.009 cm3 g–1 for 100COx-2530; see Gomes et al., Reference Gomes, Frezet, Petit, Petlickaia, Rossignol, Texier-Mandoki and Renaudin2021). Furthermore, the decrease in the fractal dimension of the ionic conduction interface with the addition of argillite (Table 2) indicates the coexistence of two poorly connected mineral sublattices.
K+ location at the mesoporous interface
For the pure geopolymer 0COx-TRH series, activation energies vary very little up to 600°C under both humidity storage conditions, indicating that the conduction paths are maintained (Fig. 4a & Table 1). As expressed earlier, the heat treatment followed by storage under a dry atmosphere showed a decrease in the diffusion coefficient attributed to the gradual passage of K+ cations from the interstitial liquid to the mineral matrix in the vicinity of the mesoporous interface, as already anticipated by pair distribution function analyses (Gomes et al., Reference Gomes, Petit, Frezet, Thirouard, Taviot-Gueho and Gharzouni2020b). Regarding storage in a wet atmosphere, only the diffusion coefficient at 600°C showed a sharp decrease (from 0.85 × 10⁻⁷ cm2 s–1 for 0COx-2595 to 0.11 × 10⁻⁷ cm2 s–1 for 0COx-60095; i.e. no loss of charge carriers was observed up to 450°C, still being 0.79 × 10⁻⁷ cm2 s–1 for 0COx-45095). These results for the 0COx-T 95 series indicate the return of the K+ solvated cations into the mesopore liquid cavities in the case of wet storage, except in the case of excessive heat treatment. We thus have confirmation of the reversibility (for moderate temperatures) of K+ cation diffusion, which had also been anticipated previously (Gomes et al., Reference Gomes, Petit, Frezet, Thirouard, Taviot-Gueho and Gharzouni2020b). This reversibility was also observed when considering D s values for wet storage (0COx-T 95 series; Table 2), which change little up to 450°C before decreasing at 600°C, whereas the D s decrease was notable already at 100°C for storage in a dry atmosphere.
Presence of two distinct polymeric mineral submatrices
The Arrhenius plot of the 33COx-2595 pellet (Fig. 5b) presents two interesting outcomes: (1) the very low freezing temperature, certainly indicating the presence of a gel-type matrix that is different from the characteristic mesoporous matrix for a pure geopolymer; and (2) a broken-type plot in the liquid state. The linear fit for  ${\text{E}}_{\text{a}}^{95}$(liquid) for the 33COx-2595 pellet gives a value of 0.21 eV, which is the mean value between 0.25 eV for the 0COx-2595 pellet and 0.17 eV for the 67COx-2595 pellet. In fact, we first observe linear behaviour between 263 and 287 K, with a slope corresponding to an E a value of 0.17 eV, then a second linear section above 287 K, with a slope corresponding to an E a value of 0.25 eV. These two activation energies at 25°C should correspond to two distinct conduction paths, each characterizing a domain within which ionic conduction is permitted. The E a value of 0.25 eV is then characteristic of the mesopores intrinsic to the geopolymer matrix resulting from the alkaline activation of a metakaolin. It follows that the E a value of 0.17 eV should be characteristic of the mineral matrix obtained by the alkaline activation of the argillite, which also enables ionic mobility through a different path/domain.
It should be noted that the E a variation for the series XCOx-2595 when considering the freezing state (labelled  ${\text{E}}_{\text{a}}^{95}$(ice) in Fig. 5c) shows the opposite trend, being higher for an argillite-activated material compared to a pure geopolymer. In the same way, the storing of these compositions under dry conditions (i.e. the XCOx-2530 pellets) induced an increase in
 $E_{\text{a}}^{30}$ for the pure alkali-activated argillite material (0.67 eV for 100COx-2530 vs ∼0.45 eV for the other compositions; Fig. 5c & Table 3). These opposite variations, although of the same order, between E a in the liquid state (
 $E_{\text{a}}^{95}$(liquid)) and in the ‘dry’ state (
 $E_{\text{a}}^{30}$ and
 $E_{\text{a}}^{95}$(ice)) as a function of the argillite amount must indicate that ionic conductions through the geopolymer matrix and through the argillite-activated matrix are both provided by the same ionic species (solvated K+) using surface sites that describe different interfaces, therefore crossing two different and poorly connected polymeric mineral matrices.
An additional confirmation of the existence of these two distinct amorphous mineral domains was provided by the 100COx-2595 pellet, which indicated a two-path mechanism for ionic conduction at low temperatures (i.e. below the freezing temperature). This double conduction path was clearly identifiable by the presence of two capacitive arcs identified in its electrical responses (Figs 6 & S3). Two activation energies could be determined from these spectra refinements (Fig. 6b & Table 3): one of 1.28 eV, corresponding to the ionic conduction path through the geopolymer matrix, and the other of 1.51 eV, which should be attributed to the argillite-activated gel. The coexistence of two amorphous mineral subnetworks has already been indicated for geopolymers loaded with C-type (calcium-containing) fly ashes leading to the formation of C-S-H gels intimately mixed within the geopolymer matrix (Bai et al., Reference Bai, Bai, Nie and Jia2023).
Resumption of argillite alkaline activation
A supplementary experimental proof of the existence of an argillite-activated gel, which should be differentiated from the purely mesoporous geopolymer matrix, is the resumption of argillite alkaline activation, initiated either by thermal treatment or more effectively by long-term conditioning in a humid atmosphere. This resumption of argillite activation had already been supposed in a previous study from nitrogen isotherm adsorption results (Gomes et al., Reference Gomes, Frezet, Petit, Petlickaia, Rossignol, Texier-Mandoki and Renaudin2021). The most explicit experimental result on this topic is the time-dependent variation in the electrical response for the 100COx-2595 pellet, which was even more pronounced with long-time storage (Fig. 6). The two capacitive arcs are representative of two conduction paths already being present after 2 months. Over time, the subnetwork attributed to argillite alkaline activation is replaced by a geopolymer-type network with a smoother ideal interface. This means that the resumption of alkaline activation in humid conditions favours the formation of a mesopore network that is topologically similar to that present in a pure geopolymer coming from the activation of a reactive metakaolin. Finally, the decrease in E a in the 100COx-T 30 and 100COx-T 95 series (Table 3 & Fig. S4b) with temperature is also an indication of the fact that this resumption of the alkaline activation of argillite is thermally facilitated.
Conclusion
The study presented here enabled us, as a first step, to validate the AC-IS method for the fine characterization of the mesoporous network features of geopolymers. The relatively simple nature of these mesoporous networks enables the use of a simple and robust EEC model and consequently the interpretation of values extracted from this electrical model in physicochemical characterizations of the material. The main results of this study have experimentally confirmed previously formulated hypotheses.
The presence of a single conduction path is related to the description of an open and homogeneous mesoporosity that crosses the material from one side to the other following the activation of a reactive metakaolin. Considering that ionic conduction is mainly attributed to K+ cations, it was possible to locate these cations in the interstitial liquid (therefore being solvated) of the synthesized geopolymer. It was shown that these cations diffused into the mineral matrix during heat treatment. This diffusion is reversible for moderate temperatures (up to 450°C) in the case of subsequent exposure to high RH.
The presence of argillite, being less reactive than metakaolin, generates a gel with a different microstructure from that of a typical geopolymer, and so this induces a different ionic conduction mode (one that is more difficult but with a larger number of charge carriers). This gel network will be able to evolve over the long term when exposed to a wet atmosphere and also under moderate temperatures, resulting in a mesoporous network whose characteristics are close to those of pure geopolymers.
Supplementary material
The supplementary material for this article can be found at https://doi.org/10.1180/clm.2026.10022.
Financial support
This project was supported by Andra under the ‘Investments for the Future’ programme; selected under the Andra Call for Projects: ‘Optimisation of post-dismantling radioactive waste management’, organized in cooperation with the French National Research Agency (ANR).
Competing interests
The authors declare none.