
I. INTRODUCTION
β-Ga2O3 has recently emerged as a promising wide-bandgap material for future power electronic and optoelectronic applications. There have been several experimental demonstrations on high-power MOSFETS, Reference Higashiwaki, Sasaki, Kamimura, Hoi Wong, Krishnamurthy, Kuramata, Masui and Yamakoshi1–Reference Higashiwaki, Sasaki, Murakami, Kumagai, Koukitu, Kuramata, Masui and Yamakoshi3 Schottky diodes, Reference Oishi, Koga, Harada and Kasu4–Reference Higashiwaki, Sasaki, Goto, Nomura, Thieu, Togashi, Murakami, Kumagai, Monemar, Koukitu and Kuramata6 and deep UV photodetectors. Reference Oshima, Okuno, Arai, Suzuki, Ohira and Fujita7 Well-developed crystal growth technology and conventional processing techniques make it a further strong candidate beside its competitors SiC and GaN. Accuracy in n-type doping and difficulty in achieving a p-type doping make electrons the primary charge carrier of interest. So studying electron transport in this material is crucial to engineer the electronic device operation. Theoretical investigations on the electronic structure (both ground states and excited states) in this material have been performed several times. Reference He, Orlando, Blanco, Pandey, Amzallag, Baraille and Rérat8–Reference Zhang, Yan, Zhao and Xie11 Lattice dynamical calculations predicted thermal conductivity and elastic properties. Reference Sasaki, Higashiwaki, Kuramata, Masui and Yamakoshi12–Reference Schubert, Korlacki, Knight, Hofmann, Schöche, Darakchieva, Janzén, Monemar, Gogova, Thieu, Togashi, Murakami, Kumagai, Goto, Kuramata, Yamakoshi and Higashiwaki15 Hall measurements Reference Parisini and Fornari16 are also performed to study temperature-dependent mobility, and field-dependent mobility was investigated to study crystal-orientation dependance of mobility. Recently, we reported low-field Reference Ghosh and Singisetti17 transport calculations in this material from first principles. It was found that the low-field mobility is limited by electron scattering due to polar optical phonon (POP) modes. This clearly reflects an intrinsic mobility limit of the material, where the room-temperature mobility hovers between 110 and 140 cm2/V s based on the direction of the applied field. On one hand, the anisotropy of the mobility requires a firm understanding to help device design and on the other side improving the mobility is crucial for efficient power electronic operation which demands a high on-state current. A traditional way of improving impurity-controlled mobility is to use hetero-junctions to spatially isolate the dopants from the electrons. The intrinsic mobility could be potentially improved by enhancing the free-carrier screening of the POP interaction. Our previous work Reference Ghosh and Singisetti17 did not consider any free carrier screening while estimating mobility. A recent work Reference Kang, Krishnaswamy, Peelaers and VandeWalle18 did consider such screening under a static Lindhard dielectric function, but it did not account for any dynamic frequency-dependent effects. However, considering the dynamic effects on the screening is important to probe the scattering rates accurately. It becomes further interesting for β-Ga2O3 due to the presence of many longitudinal optical (LO) modes as, for a given electron density, the plasmon mode will couple with the different LO modes differently (some of them will be screened while the other will be antiscreened).
In this work, we study some important aspects of the electron mobility in β-Ga2O3 with significant details on the physics of plasmon-phonon coupling, dynamic screening, and anisotropy. Initially lattice dynamical calculations are performed using the density functional perturbation theory (DFPT) under local density approximation. Plasmon–phonon coupling is thoroughly investigated in the long-wavelength limit incorporating a frequency-dependent dynamic screening model under the Lyddane–Sachs–Teller (LST) theory and the plasmon-pole approximation. Scattering rates mediated by the coupled modes are computed using the Fermi–Golden rule and then the Boltzmann transport equation (BTE) is solved iteratively to estimate the mobility at room temperature. The electron concentration dependence of the mobility is studied thereby. The anisotropy of the electron transport is studied through an interesting picture of anisotropic polar phonon emission based on Monte Carlo simulations. The mobility of the two-dimensional electron gas (2DEG) formed at a heterojunction is studied, including the coupled mode scattering and remote impurity (RI) scattering.
II. ELECTRON-LO PHONON COUPLING IN β-Ga2O3
Low-field electron transport in β-Ga2O3 is controlled by the interaction between electrons and POPs as was revealed in our previous work and also in other recent studies.
Reference Ghosh and Singisetti17,Reference Ma, Verma, Guo, Luo and Jena19
The room-temperature intrinsic electron mobility is limited by the POP even at a moderate doping of 1.0 × 10¹⁷/cm3, which clearly reflects the strong polar coupling between electrons and phonons. In our previous work, this coupling,
 $g_{{\rm{POP}}}^\upsilon \left( {\bi{q}} \right)$
, for a given phonon mode υ and the wave vector
q
were computed using the Vogl model,
Reference Verdi and Giustino20
 $$g_{{\rm{POP}}}^\upsilon \left( {\bi{q}} \right) = {{{e^2}} \over {\Omega {\varepsilon _0}}}\sum\limits_\kappa {{{\left( {{\hbar \over {2{M_\kappa }{\omega _{{\bi{q}}\nu }}}}} \right)}^{{1 \over 2}}}} {{{\bi{q}} \cdot {{\bi{Z}}_{{\boldikappa }}} \cdot {{\bi{u}}_{{{\boldikappa \upsilon }}}}\left( {\bi{q}} \right)} \over {{\bi{q}} \cdot {\varepsilon _\infty } \cdot {\bi{q}}}}\quad ,$$
here,
Z
κ
, ω
q
ν, and
u
κυ
(
q
) are the Born-effective charge tensor, phonon eigen energies, and cell-normalized phonon displacement patterns for an atom κ for the mode (
q
, υ) respectively. ε∞ represents the high-frequency dielectric tensor elements that contain a screening contribution from the valence band electrons. M
κ s denotes the atomic masses, while Ω is the unit cell volume. e, ħ, and ε0 are the unit electronic charge, reduced Planck’s constant, and vaccum permittivity, respectively.
Z
κ
, ε∞, ω
q
ν, and
u
κυ
(
q
) are calculated under the DFPT
Reference Baroni, Gironcoli and Corso21
using Quantum ESPRESSO.
Reference Giannozzi, Baroni, Bonini, Calandra, Car, Cavazzoni, Ceresoli, Chiarotti, Cococcioni, Dabo, Dal Corso, de Gironcoli, Fabris, Fratesi, Gebauer, Gerstmann, Gougoussis, Kokalj, Lazzeri, Martin-Samos, Marzari, Mauri, Mazzarello, Paolini, Pasquarello, Paulatto, Sbraccia, Scandolo, Sclauzero, Seitsonen, Smogunov, Umari and Wentzcovitch22
To obtain a
q
-space fine-resolution in
 $g_{{\rm{POP}}}^\upsilon \left( {\bi{q}} \right)$
, ω
q
ν and
u
κυ
(
q
) are interpolated using a Wannier–Fourier interpolation scheme.
Reference Noffsinger, Giustino, Malone, Park, Louie and Cohen23,Reference Giustino, Cohen and Louie24
Note that the overlap of the electronic wave functions is taken to be unity due to the long-range nature (
q
→ 0) of the coupling.
An important feature that accounts for the strength of the POP coupling is the splitting of the LO and transverse optical (TO) modes near the zone-center. We compute this by adding the nonanalytic macroscopic polarization contribution Reference Gonze and Lee25 to the DFPT-produced force constants. The nonanalytical force-constant elements Reference Baroni, Gironcoli and Corso21 have a form
 $$C_{\kappa \kappa '}^{\alpha \beta }\left( {\bi{q}} \right) = {{4\pi {e^2}} \over \Omega }{{{{\left( {{\bi{q}}{{\bi{Z}}_\kappa }} \right)}_\alpha }{{\left( {{\bi{q}}{{\bi{Z}}_{\kappa '}}} \right)}_\beta }} \over {{\bi{q}} \cdot {\varepsilon _\infty } \cdot {\bi{q}}}}\quad ,$$
where α and β are the Cartesian directions. Diagonalizing the overall dynamical matrix (force-constants scaled by reduced atomic masses,
 $\sqrt {{M_\kappa }{M_{\kappa '}}}$
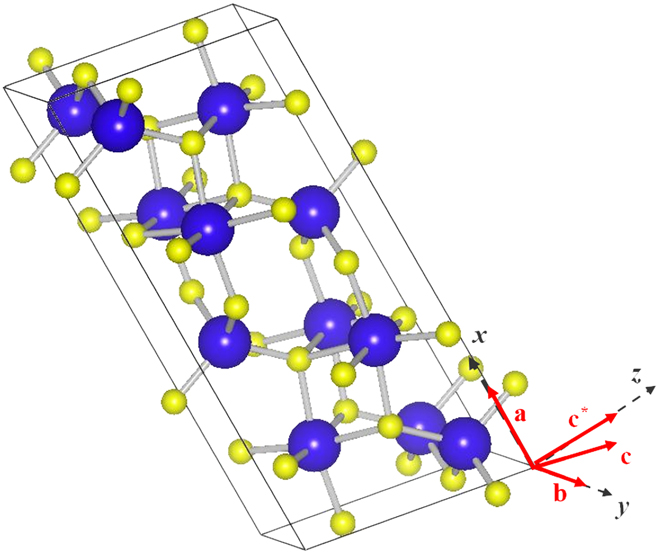
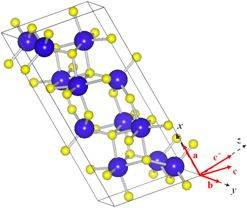
) yields the LO eigen values. Figure 1 shows the conventional unit cell (visualized by Vesta
Reference Momma and Izumi26
) of β-Ga2O3 along with the Cartesian direction convention used in this work. There are 12 IR active phonons that could be categorized into two types—Au modes that are polarized along the y direction and the Bu modes that are polarized on the x–z plane. The LO–TO splitting data obtained for all the IR-active modes for three different Cartesian directions of the phonon wave vector are shown in our previous work
Reference Ghosh and Singisetti17
that reveals the anisotropy of the LO–TO splitting. For example, the Bu
1 mode has a high splitting for
q
along the z direction but very low splitting for the same along the x direction.
The conventional unit cell of β-Ga2O3 visualized by Vesta. Reference Momma and Izumi26 Bigger atoms are Ga and smaller ones are O. The Cartesian direction convention that is followed throughout this work is shown.

The important point to understand from this electron-POP coupling calculation is that the screening of the coupling elements contains only the contribution from the valence electrons which is clearly an underestimation of the overall screening that contains contributions from other phonons and plasmon. Especially in β-Ga2O3, with 12 IR active phonon modes, the phonon contribution is expected to take a major role in shaping the frequency dependence of the dielectric tensor elements. In our previous work, we made a very simple attempt to include this effect by using a conventional LST relation applicable to systems with orthogonal polarization vectors. This is an over simplification of the screening problem given the nonorthogonal displacement patterns of the different phonon modes. Moreover, at high doping, screening contribution from free carriers becomes important as well. The coupling between plasmon and phonon need to be addressed under such a situation to accurately predict the role of free carrier screening.
III. ELECTRON—LOPC IN β-Ga2O3
Plasmons are longitudinal vibrational modes of collective electrons. The vibrational energy of such oscillations in a bulk semiconductor under long-wavelength limit is given by Reference Diff and Brennan27
 $$\omega _{\rm{P}}^2 = {{{\hbar ^2}{n_{\rm{s}}}{e^2}} \over {{m^ * }{\varepsilon _\infty }}}\quad ,$$
here, n s is the conduction electron density and m* is the electron effective mass. So for practical doping levels ranging from 1017/cm3 to 1019/cm3, the plasmon energy varies from about 10 to 100 meV in β-Ga2O3, considering an isotropic effective mass of 0.3 and an average isotropic high-frequency dielectric constant of 4.3 as calculated from our DFT and DFPT calculations, respectively. This energy range is same as the range where all the LO phonon energies lie. Hence for transport calculations and subsequent device applications LO-plasmon coupling (LOPC) is expected to play a vital role.
A. The LOPC modes at arbitrary wave vectors
Although the pure plasmon energy is fairly isotropic, the LOPC modes would be highly anisotropic due to the anisotropy of the LO modes. Hence, we compute the LOPC modes for each wave-vector separately. For a given wave vector
q
, the pure LO modes
 $\omega _{{\rm{LO}}}^i\left( {\bi{q}} \right)$
are computed by diagonalizing the DFPT-computed dynamical matrix at the Γ point after adding the macroscopic polarization [Eq. (2)]. The effective dielectric constant along the direction of
q
is formulated from the LO mode polarization (see Supplementary Material) and the plasmon-pole approximation.
 $${\varepsilon _\omega }\left( {\bi{q}} \right) = {\varepsilon _\infty }\prod\limits_{i = 1 - 12} {{{{{\left( {\omega _i^{{\rm{LO}}}\left( {\bi{q}} \right)} \right)}^2} - {\omega ^2}} \over {{{\left( {\omega _i^{{\rm{TO}}}} \right)}^2} - {\omega ^2}}}} - {{{\varepsilon _\infty }\omega _{\rm{P}}^2} \over {{\omega ^2}}}\quad ,$$
where,
 $\omega _i^{{\rm{TO}}}$
is the corresponding TO mode energies. The valence electron contribution to the dielectric elements is ε∞. The plasmon contribution is taken to be present along
q
since plasma oscillation is a longitudinal oscillation. Note that Eq. (4) already accounts for the displacement patterns of the modes since
 $\omega _i^{{\rm{LO}}}\left( {\bi{q}} \right)$
is calculated explicitly for each
q
. Hence comparing with the work of Schubert et al.,
Reference Schubert, Korlacki, Knight, Hofmann, Schöche, Darakchieva, Janzén, Monemar, Gogova, Thieu, Togashi, Murakami, Kumagai, Goto, Kuramata, Yamakoshi and Higashiwaki15
the effect of the cosine terms [Eqs. (21a)–(21d) of Ref. Reference Schubert, Korlacki, Knight, Hofmann, Schöche, Darakchieva, Janzén, Monemar, Gogova, Thieu, Togashi, Murakami, Kumagai, Goto, Kuramata, Yamakoshi and Higashiwaki15) arising on the net dipole oscillation strength of the different modes is included in Eq. (4) of this work. So essentially, Eq. (4) of this work is equivalent to Eqs. (21a)–(21d) of Ref. Reference Schubert, Korlacki, Knight, Hofmann, Schöche, Darakchieva, Janzén, Monemar, Gogova, Thieu, Togashi, Murakami, Kumagai, Goto, Kuramata, Yamakoshi and Higashiwaki15. However, as for transport properties, we are only interested on the dielectric tensor along a given
q
, we consider the LO–TO splitting only along that direction since the latter accounts for the lattice polarization along that
q
. The zeros of εω(
q
) yield the LOPC mode energies. However, if one is interested in obtaining the LOPC patterns (which are not required for our transport calculations), then the knowledge on the other two transverse components of the dielectric tensor is also needed. While the method of Schubert et al.
Reference Schubert, Korlacki, Knight, Hofmann, Schöche, Darakchieva, Janzén, Monemar, Gogova, Thieu, Togashi, Murakami, Kumagai, Goto, Kuramata, Yamakoshi and Higashiwaki15
is valid at
q
= 0, a method of obtaining the patterns at an arbitrary
q
is described in the Supplementary Material.
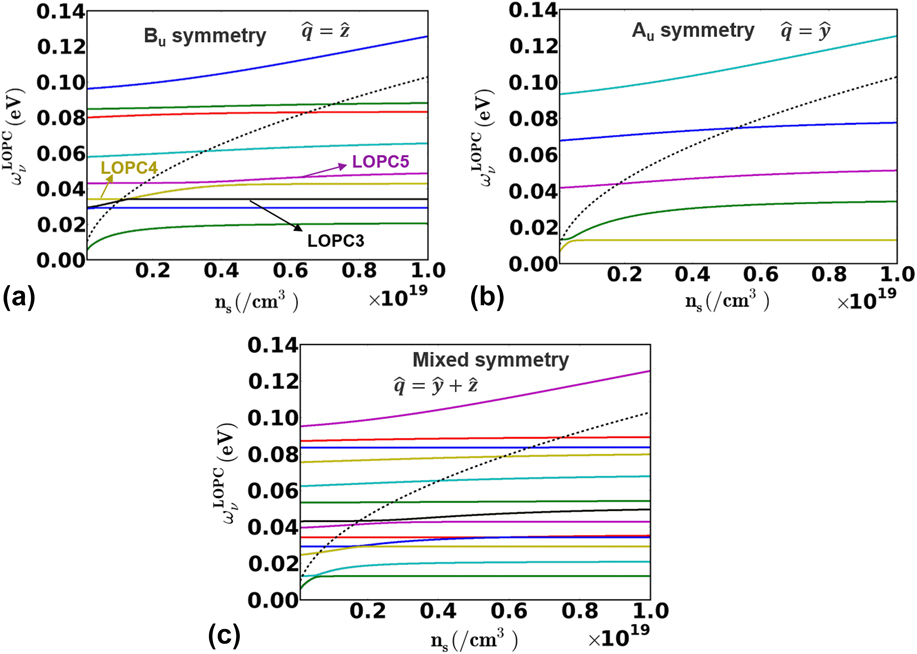
Figures 2(a)–2(c) show the LOPC mode energies for varying electron concentrations (n s) at three different wave vectors. Figure 2(a) shows 9 LOPC modes that possess pure Bu symmetry since the wave vector lies on the x–z plane and hence there is no coupling to the Au modes. Similarly, Fig. 2(b) shows 5 LOPC modes that possess pure Au symmetry since the wave vector lies along the y direction. On the other hand, in Fig. 2(c) we see 13 LOPC modes which have mixed symmetry. The black dashed lines in Figs. 2(a)–2(c) show the pure plasmon energy. At low n s, modes that have much higher energy than that of the plasmon [say, the blue line in Fig. 2(a) or the cyan line in Fig. 2(b)] possess the uncoupled LO mode energy. However, at higher n s, modes that are below the plasmon mode [say, the green lines in both Figs. 2(a) and 2(b)] possess the energy of the TO mode. The high-energy plasmon could efficiently screen the macroscopic polarization thereby mitigating the splitting. This has a significant effect in scattering rates that cannot be ignored. In the case of Bu symmetry, Fig. 2(a) considers the situation when the q vector is along the z direction. But modes that are polarized more along the x direction couple less with the plasmon and hence their energy remains more or less flat [like the red line on Fig. 2(a)]. This is of course a result of the low symmetry of monoclinic crystals.
(a) The Bu symmetry LOPC modes for the wave vector along the z direction. (b) The Au symmetry LOPC modes. (c) Mixed symmetry modes for the wave vector along
 ${\bi{\hat{y}}} + {\bi{\hat{z}}}$
. The pure plasmon modes are shown in the dashed line for all the three cases.
B. Plasmon and phonon content of the LOPC modes
To calculate the electron scattering rates mediated by the LOPC modes, we need to separate out the plasmon and phonon contents for each mode. This is because scattering with pure plasma does not effectively provide any average momentum relaxation for the ensemble of electrons rather it just renders exchange of momentum among electrons. In the following, we follow a method originally proposed by Fischetti et al. Reference Fischetti, Neumayer and Cartier28 for studying coupling between interface phonons from the dielectric and plasmons in the semiconductor. We compute the plasmon content in an LOPC mode ν as
 $$\Lambda _\nu ^{\rm{P}}\left( {\bi{q}} \right) = {{\prod\limits_i {\left( {{{\left( {\omega _\upsilon ^{{\rm{LOPC}}}\left( {\bi{q}} \right)} \right)}^2} - {{\left( {\omega _i^{{\rm{LO}}}\left( {\bi{q}} \right)} \right)}^2}} \right)} } \over {\prod\limits_{i \ne \upsilon } {\left( {{{\left( {\omega _\upsilon ^{{\rm{LOPC}}}\left( {\bi{q}} \right)} \right)}^2} - {{\left( {\omega _i^{{\rm{LOPC}}}\left( {\bi{q}} \right)} \right)}^2}} \right)} }}\quad ,$$
 $\omega _i^{{\rm{LO}}}\left( {\bi{q}} \right)$
is the pure LO mode obtained in absence of any plasmon. The total phonon content of the mode would be
 $1 - \Lambda _\nu ^{\rm{P}}\left( {\bi{q}} \right)$
.
The relative contribution of the individual phonon modes in a given LOPC mode could also be computed under a similar technique.
 $$R_\nu ^{{\rm{LO}}j}\left( {\bi{q}} \right) = {{\prod\limits_i {\left( {{{\left( {\omega _\upsilon ^{{\rm{LOPC}}}\left( {\bi{q}} \right)} \right)}^2} - {{\left( {\omega _i^{{\rm{LOPC}}, - {\rm{LO}}j}\left( {\bi{q}} \right)} \right)}^2}} \right)} } \over {\prod\limits_{i \ne \upsilon } {\left( {{{\left( {\omega _\upsilon ^{{\rm{LOPC}}}\left( {\bi{q}} \right)} \right)}^2} - {{\left( {\omega _i^{{\rm{LOPC}}}\left( {\bi{q}} \right)} \right)}^2}} \right)} }}\quad ,$$
here
 $\omega _i^{{\rm{LOPC}}, - {\rm{LO}}j}\left( {\bi{q}} \right)$
are the modes obtained by forming Eq. (4) without the response of the jth LO mode and then setting its magnitude to zero. The net contribution of the jth LO mode in the LOPC mode ν would be
 $$\Lambda _\nu ^{{\rm{LO}}j}\left( {\bi{q}} \right) = {{R_\nu ^{{\rm{LO}}j}\left( {\bi{q}} \right)} \over {\sum\limits_{\bi{k}} {R_\nu ^{{\rm{LO}}k}\left( {\bi{q}} \right)} }}\left( {1 - \Lambda _\nu ^{\rm{P}}\left( {\bi{q}} \right)} \right)\quad .$$
Two important sum rules are to be verified here. First one of them is trivial,
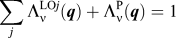 $\sum\limits_j {\Lambda _\nu ^{{\rm{LO}}j}\left( {\bi{q}} \right)} + \Lambda _\nu ^{\rm{P}}\left( {\bi{q}} \right) = 1$
, which says that the total contribution of the plasmon mode and the LO modes to a particular LOPC mode must be 1. The second one is
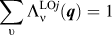 $\sum\limits_\upsilon {\Lambda _\nu ^{{\rm{LO}}j}\left( {\bi{q}} \right)} = 1$
and
 $\sum\limits_\upsilon {\Lambda _\nu ^{\rm{P}}\left( {\bi{q}} \right)} = 1$
, which says that the sum of the relative contributions of any LO mode (or the plasmon mode) to all the LOPC modes must be 1. The sum rules are verified for all the electron densities considered in this work.
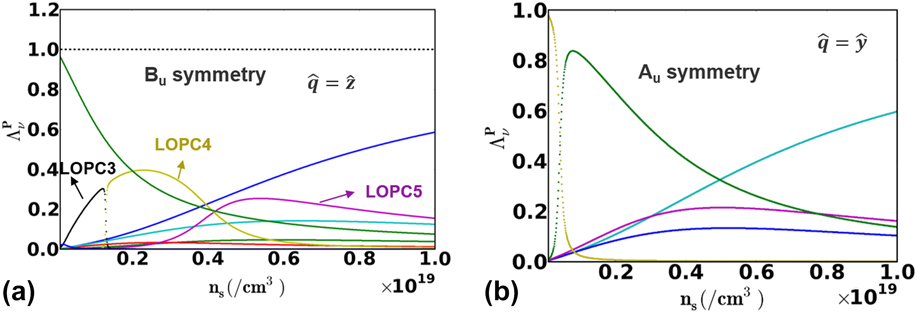
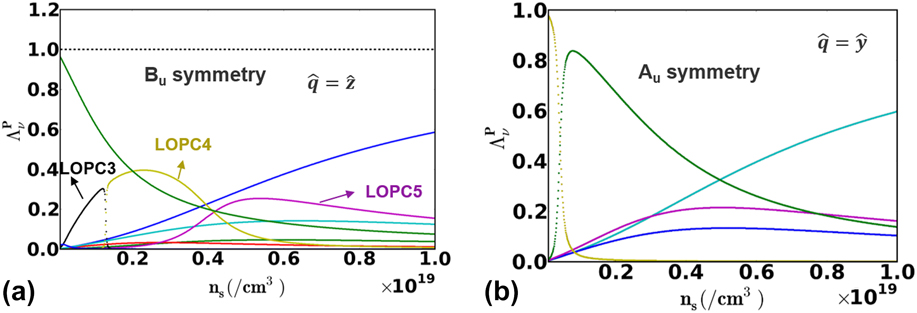
Figures 3(a) and 3(b) show the plasmon contents in the different LOPC modes as we sweep up the electron concentration for modes with Bu and Au symmetry, respectively. The strong entanglement among the different branches is a signature of strong coupling. The sum over all modes for the plasmon content
 $\left( {\sum\limits_\upsilon {\Lambda _\nu ^{\rm{P}}\left( {\bi{q}} \right)} } \right)$
is shown by the dashed curve on Fig. 3(a). The color scheme of the different branches in Figs. 3(a) and 3(b) is consistent with that used in Figs. 2(a) and 2(b), and the same scheme is maintained in subsequent figures. With increasing n
s, the higher LOPC modes get more of the plasmon flavor, and the lower modes retain back their LO flavor. Bu modes that are polarized more along the x direction have a low plasmon content since the
q
vector in Fig. 3(a) is along the z direction.
(a) The plasmon content of the Bu symmetry LOPC modes and (b) similar plots for the Au modes. The strong entanglement reflects the possible influence of the plasmon in the scattering strength. See text for details.
C. The dressed interaction
The undressed Frölich vertex for the electron-LO phonon interaction has the form Reference Fröhlich29
 $${\left| {g_\upsilon ^{{\rm{LO}}}\left( {\bi{q}} \right)} \right|^2} = {{{e^2}} \over {2\Omega {\varepsilon _0}}}\left[ {{{\omega _\upsilon ^{{\rm{LO}}}} \over {{q^2}}}\left\{ {{1 \over {{\varepsilon _\infty }}} - {1 \over {{\varepsilon _{{\rm{DC}}}}}}} \right\}} \right]\quad .$$
As we can see from the term within the bracket, the squared interaction strength is proportional to the difference of the two inverse dielectric constants—εDC includes a ‘full response’ of the LO mode, while ε∞ takes the LO mode to be frozen. Under the same spirit, we calculate the interaction elements for each LOPC mode. For a given LOPC mode, a pair of dielectric constants are evaluated for each LO mode (LOj) −
 $\boldivarepsilon _{\omega _\upsilon ^{{\rm{LOPC}}}}^{ + \bf{LO}{\bi{j}}}\left( {\bi{q}} \right)$
that includes the ‘full response’ of that LO mode and
 $\boldivarepsilon _{\omega _\upsilon ^{{\rm{LOPC}}}}^{ - \bf{LO}{\bi{j}}}\left( {\bi{q}} \right)$
that keeps the LO mode frozen while all others are active. Here we are interested only on the element of the dielectric tensor that is along the
q
vector (see Sec. III.A for details). Note that this type of formulation of the interaction strength includes all the screening (and also antiscreening) contribution in the long wavelength. Hence the dressed interaction term could be cast as
 $${\left| {g_{{\rm{LOPC}}}^{\upsilon ,{\rm{LO}}j}\left( {\bi{q}} \right)} \right|^2} = {{{e^2}} \over {2\Omega {\varepsilon _0}}}\left[ {{{\omega _\upsilon ^{{\rm{LOPC}}}\left( {\bi{q}} \right)} \over {{q^2}}}\left\{ {{1 \over {\boldivarepsilon _{\omega _\upsilon ^{{\rm{LOPC}}}}^{ - \bf{LO}{\bi{j}}}\left( {\bi{q}} \right)}} - {1 \over {\boldivarepsilon _{\omega _\upsilon ^{{\rm{LOPC}}}}^{ + \bf{LO}{\bi{j}}}\left( {\bi{q}} \right)}}} \right\}\Lambda _\nu ^{{\rm{LO}}j}\left( {\bi{q}} \right)} \right]\quad .$$
In terms of the actual calculations performed,
 ${\boldivarepsilon} _{\omega _\upsilon ^{{\rm{LOPC}}}}^{ - \bf{LO}{\bi{j}}}\left( {\bi{q}} \right)$
is estimated from Eq. (4) with the product running over all i for i ≠ j, and
 $\boldivarepsilon _{\omega _\upsilon ^{{\rm{LOPC}}}}^{ + \bf{LO}{\bi{j}}}\left( {\bi{q}} \right)$
is also estimated from Eq. (4) with the condition on the product that ω = 0 for i = j. The anisotropic dependence of the interaction is completely taken care of under this manifold because all the dielectric elements are formed taking into account the displacement patterns of the modes.
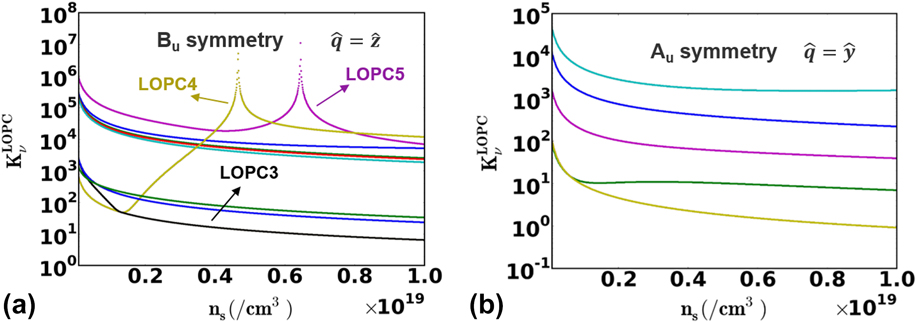
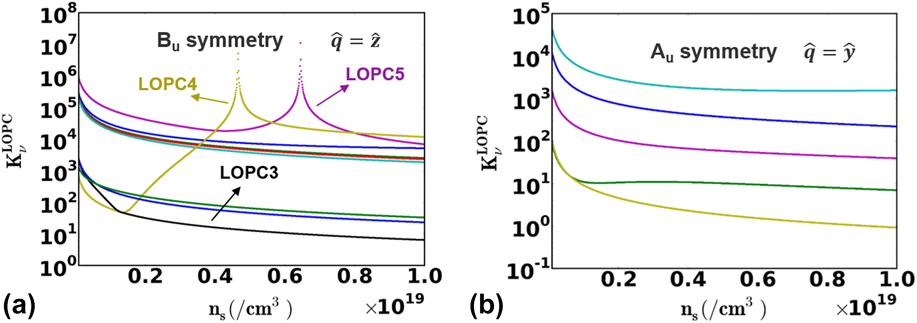
Figures 4(a) and 4(b) show the dressed oscillator strengths [
 $K_\upsilon ^{{\rm{LOPC}}}$
, the term within the curly braces in Eq. (9)] for Au and Bu symmetry modes, respectively, with the contribution from each LO flavor being summed up,
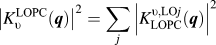 ${\left| {K_\upsilon ^{{\rm{LOPC}}}\left( {\bi{q}} \right)} \right|^2} = {\sum\limits_j {\left| {K_{{\rm{LOPC}}}^{\upsilon,{\rm{LO}}j}\left( {\bi{q}} \right)} \right|} ^2}$
. Just to avoid confusion, the color scheme of the different branches in Figs. 4(a) and 4(b) is consistent with that used in Figs. 2(a) and 2(b) The important message to convey from here is the effect of dynamic screening on the interaction strengths. To illustrate, let us consider the black, yellow, and purple curves (here we refer to them as LOPC3, LOPC4, and LOPC5, respectively) in Fig. 4(a). Under low electron density, all the modes are LO flavored. With increasing density, first the LOPC3 gets the plasmon character and starts antiscreening LOPC4 and hence around a density of 2 × 10¹⁸/cm3, the LOPC4 interaction starts rising. Gradually, the LO character shifts from LOPC3 to LOPC4. Then, LOPC4 starts antiscreening LOPC5, and the interaction strength of the latter starts growing. Next, the plasmon character shifts from LOPC4 to LOPC5. Since LOPC5 is higher than LOPC4, the former starts screening the latter and hence the interaction strength of LOPC4 goes down. Finally as the plasmon character shifts further high in energy, LOPC5 also gets well screened, and its scattering strength goes down as well. So in a material like β-Ga2O3 with several LO modes, as the plasmon character propagates from one mode to the other, the screening and antiscreening of the modes shift accordingly. Hence, for a given electron density, one mode could be screened while the other could be antiscreened and hence a generic trend of the electron scattering rates and the mobility with an increasing electron density is not expected. In the next Section while discussing electron mobility, this issue is further explored.
(a) The dynamically screened oscillation strength of the Bu symmetry LOPC modes and (b) similar plots for the Au modes.
D. Plasmon damping
Plasmons cease to behave as collective excitations in the electron–hole pair continuum (EHC). This is going to influence the LOPC modes and the dynamic screening depending upon the magnitude of the wave vector,
q
. This damping becomes particularly important for degenerate doping. We treat this effect (approximately) by turning off the plasmon mode in the EHC. The upper boundary of EHC is given by,
Reference Diff and Brennan27
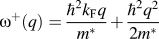 ${\omega ^ + }\left( q \right) = {{{\hbar ^2}{k_{\rm{F}}}q} \over {{m^ * }}} + {{{\hbar ^2}{q^2}} \over {2{m^ * }}}$
, where k
F is the Fermi wave vector calculated at zero temperature. Due to isotropic conduction band minima, the upper boundary of EHC is taken to be isotropic in β-Ga2O3 and hence the plasmon damping is dependent only on the magnitude of
q
. In terms of the actual calculation performed, the plasmon mode is taken off from the dispersion and dynamic screening calculation whenever, ωP < ω+(q). The data shown in Figs. 2–4 do not take into account the effect of plasmon damping in order to clearly convey the LOPC picture in β-Ga2O3. However, the transport calculations are done including the effects of the damping. It is to be noted that this damping is different from the finite-temperature plasmon damping arising from electron–phonon interactions that give rise to the imaginary part of the dielectric function. The latter type of damping is not considered in this work because that would involve selfconsistently finding out the electron relaxation rates and the imaginary part of the dielectric constant which the authors believe would be extremely challenging, especially for Ga2O3 with so many phonon modes.
E. Electron scattering mediated by the LOPC modes
Having found out the interaction elements, we are ready to compute the electron scattering mediated by the LOPC modes for electron wave vectors k . The scattering rate is computed under the Fermi–Golden rule as
 $${S_{{\rm{LOPC}}}}\left( {\bi{k}} \right) = \sum\limits_{j,\upsilon ,{\bi{q}}} {{w_{\bi{q}}}{{\left| {g_{{\rm{LOPC}}}^{\upsilon ,{\rm{LO}}j}\left( {\bi{q}} \right)} \right|}^2}} {1 \over {\left( {{E_{{\bi{k}} + {\bi{q}}}} - {E_{\bi{k}}} \,\,\pm\,\, \omega _\upsilon ^{{\rm{LOPC}}}\left( {\bi{q}} \right) - i\delta } \right)}}\quad ,$$
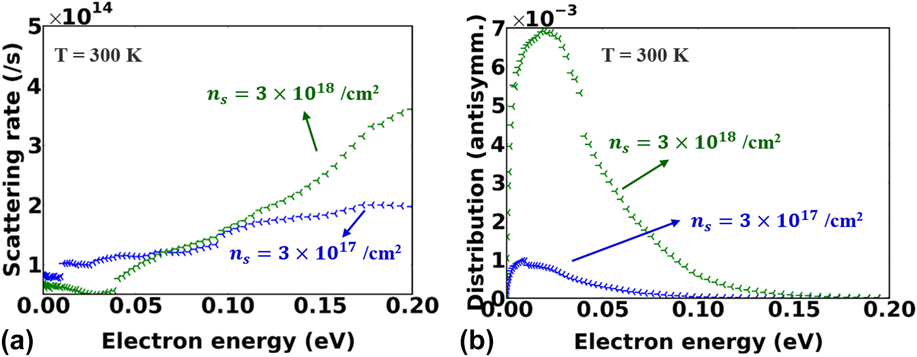
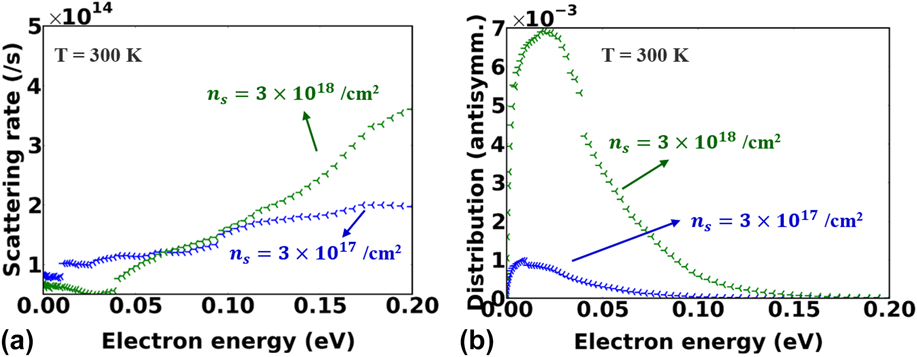
here E k denotes the electron energy at wave vector k and w q is the weight of the q point from the Brillouin zone sampling. δ is a small energy smearing chosen to be 10 meV in this work. We used an isotropic parabolic electron band which is a very good assumption for β-Ga2O3 near the Γ-point. However, the scattering rates are computed at each k point separately to probe the anisotropy in the later transport calculation. Figure 5(a) shows the electron scattering rate for two levels of electron concentrations. The scattering rate at a lower electron concentration is higher at lower electron energies. This is because of the antiscreening of the low energy phonon modes. On the other hand, at relatively higher electron concentrations, the lower energy phonon modes are screened, but the higher energy phonons are antiscreened. This suppresses the scattering rate at lower electron energies but boosts it up at higher energies. This has a significant role in deciding the electron mobility.
(a) The LOPC-mediated electron scattering rates for two different levels of electron densities. (b) The electron distribution functions after the convergence of the iterative BTE scheme.
IV. ELECTRON MOBILITY
The electron mobility is calculated by solving the BTE using our in-house codes based on the Rode’s iterative scheme. Reference Rode30 The scattering mechanisms included are the LOPC scattering and the ionized impurity scattering. The ionized impurity scattering rate is calculated using a simple Brooks-Herring model with an isotropic parabolic electronic band with an effective mass of 0.3m 0. The trend of mobility is studied with respect to varying electron concentrations for bulk β-Ga2O3 and for the 2DEG formed at heterojunctions like Al x Ga2−x O3/Ga2O3.
A. Iterative BTE solver
The iterative BTE solver goes beyond the relaxation time approximation as it takes care of the inelasticity of the scattering which is particularly important at low electron energies. The electronic distribution function, f(k), is split in two parts as f( k ) = f 0(k) + f′(k)cos θ. While the equilibrium part f 0(k) is the Fermi-Dirac function, the nonequilibrium part f′(k) is evaluated selfconsistently using the scattering information as discussed below. The angle θ is between the applied electric field, and the electron wave vector k . f′(k) under electric field F is calculated as
 $${f_{i + 1}}^\prime \left( k \right) = {{\left( {S_i^{{\rm{IN}}}\left( k \right) - {{eF} \over \hbar } \cdot {\nabla _{\bi{k}}}\,{f^0}\left( k \right)} \right)} \over {\left( {{S^{{\rm{OUT}}}}\left( k \right) + {1 \over {{\tau _{{\rm{el}}}}}}} \right)}}\quad ,$$
here the subscripts denote the iteration number in the self-consistent scheme. S OUT(k) and S IN(k) are the net out-scattering and net in-scattering terms, respectively, from an electronic wave vector k . Note that, although a scalar notation of the wave vector is used for the arguments S OUT and S IN in Eq. (11), they are calculated along each three directions separately and hence Eq. (11) is for any given direction at a time. The anisotropic effects that are supposed to arise from the anisotropic electron-LOPC are inherent in the out-scattering and in-scattering terms while evaluating them using the Fermi–Golden rule. However, anisotropy from the band structure (which is very minimal in β-Ga2O3) is not incorporated in this formulation. S IN(k) is dependent upon f′(k) by
 $${S^{{\rm{IN}}}}\left( k \right) = \int {Xf'\left( {k'} \right)\left[ {{P_{{\bi{k'}} \to {\bi{k}}}}\left( {1 - {f^0}\left( k \right)} \right) + {P_{{\bi{k}} \to {\bi{k'}}}}{f^0}\left( k \right)} \right]} {\rm{d}}{\bi{k'}}\quad ,$$
here, P
k
′→
k
is the Fermi–Golden transition rate and X is the cosine of the angle between
k
′ and
k
. Eqs. (11) and (12) form a selfconsistent pair which is solved iteratively starting from the initial condition given by RTA,
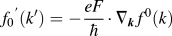 ${f_0}^\prime \left( {k'} \right) = - {{eF} \over \hbar } \cdot {\nabla _{\bi{k}}}\,{f^0}\left( k \right)$
.
Figure 5(b) shows the antisymmetric part (f′(k)) of the distribution function after the convergence in the iteration has been achieved. The small discontinuities in the distribution functions are results of the onset of emission of the dominant LOPC modes. Under a low electron concentration such an onset occurs at a lower energy because the lower LOPC modes are antiscreened, while with increasing the electron concentration, the onset point shifts to higher energies since the antiscreening behavior shifts to higher LOPC modes. On the other hand, the symmetric part of the distribution does not contribute to the net drift mobility. The electron mobility is calculated from the antisymmetric part of the distribution function as
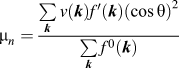 ${\mu _n} = {{\sum\limits_{\bi{k}} {v\left( {\bi{k}} \right)f'\left( {\bi{k}} \right){{\left( {\cos \theta } \right)}^2}} } \over {\sum\limits_{\bi{k}} {{f^0}\left( {\bi{k}} \right)} }}$
, where v(
k
) is the group velocity of the electrons at a wave vector
k
and v(
k
)cos θ represents the drift velocity along the electric field.
B. Bulk mobility and anisotropy
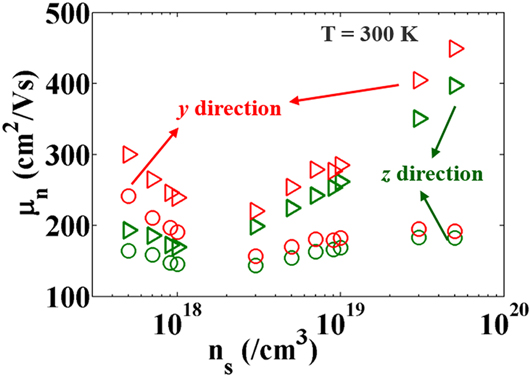
The room-temperature bulk mobility is calculated under two conditions—with ionized impurity scattering and without that. The electron concentration is taken to be same as the dopant concentration for the former case. The calculated mobility is shown in Fig. 6. For the case without any impurity scattering, the mobility initially shows a decline which is attributed to the antiscreening of low-energy LOPC modes and hence a stronger scattering strength. At higher doping, the mobility increases with increasing the doping due to strong screening of the LOPC modes. It is to be noted here that the screening in Ref. Reference Kang, Krishnaswamy, Peelaers and VandeWalle18 is essentially static which is good under high-electron densities when the plasmon energy is higher than all the LO energies and hence the dielectric constant can be represented by static limits like the Thomas–Fermi model. However, at moderate electron densities like 1018/cm3, some of the LO modes are screened while others are antiscreened which would have consequences on the electron transport and mobility. Using a dynamic model is crucial to capture the interplay of screening and antiscreening. As seen from Ref. Reference Kang, Krishnaswamy, Peelaers and VandeWalle18, the phonon-limited electron mobility shows an increase at moderate electron densities due to free-carrier screening which is correct under the static limit. This work augments that fact by adding the contribution of antiscreening. In the case where ionized impurity scattering is present (circles in Fig. 6), the enhancement of mobility at higher doping is negligible since the scattering due to impurities compensates the reduction of LOPC-mediated scattering under strong screening. The mobility, including ionized impurity scattering, at an electron concentration of 5 × 10¹⁹/cm3 is about 182 cm2/V s. However, for devices where the electronic channel is separated from the dopants, an intermediate mobility (between the circles and triangles) is to be expected due to the presence of remote ionized impurity scattering, which is discussed next during the 2DEG mobility analysis.
Electron density dependence of bulk mobility for two different Cartesian directions. The triangles show the mobility computed without any ionized impurity scattering while the circles show the mobility including ionized impurity scattering.
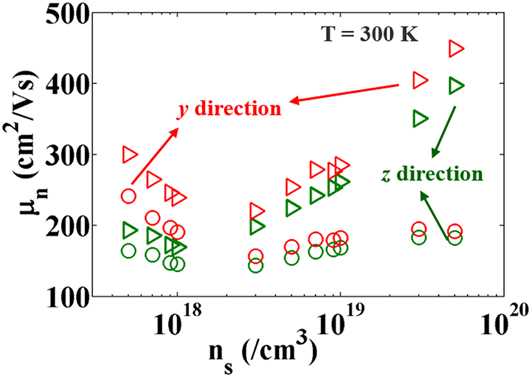
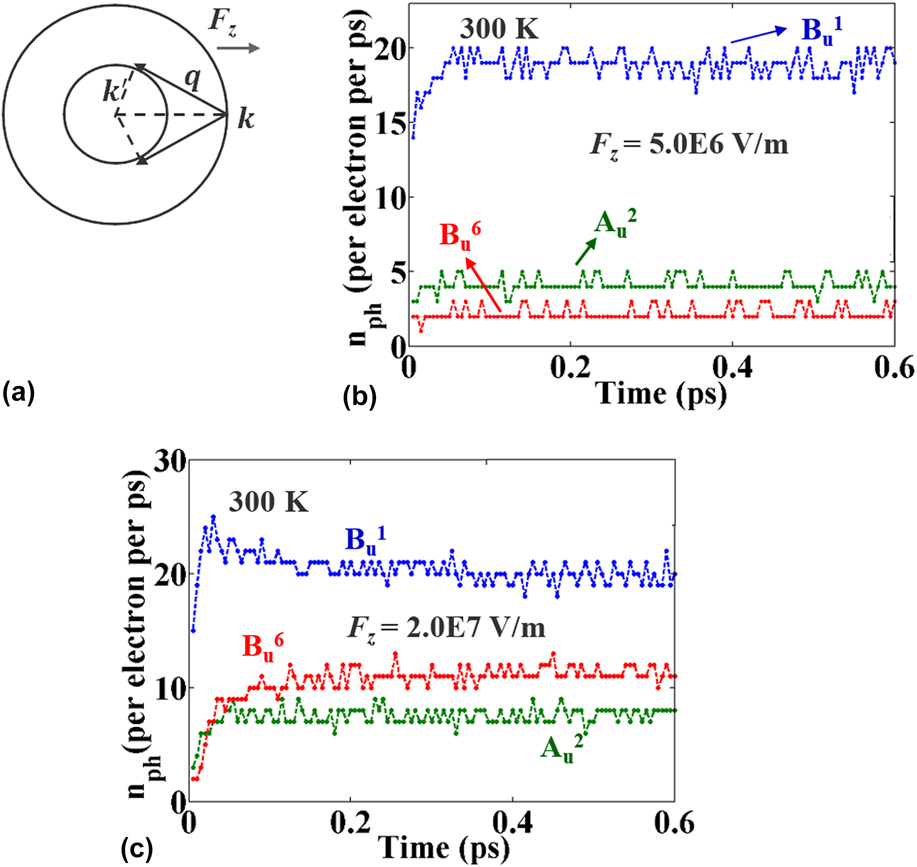
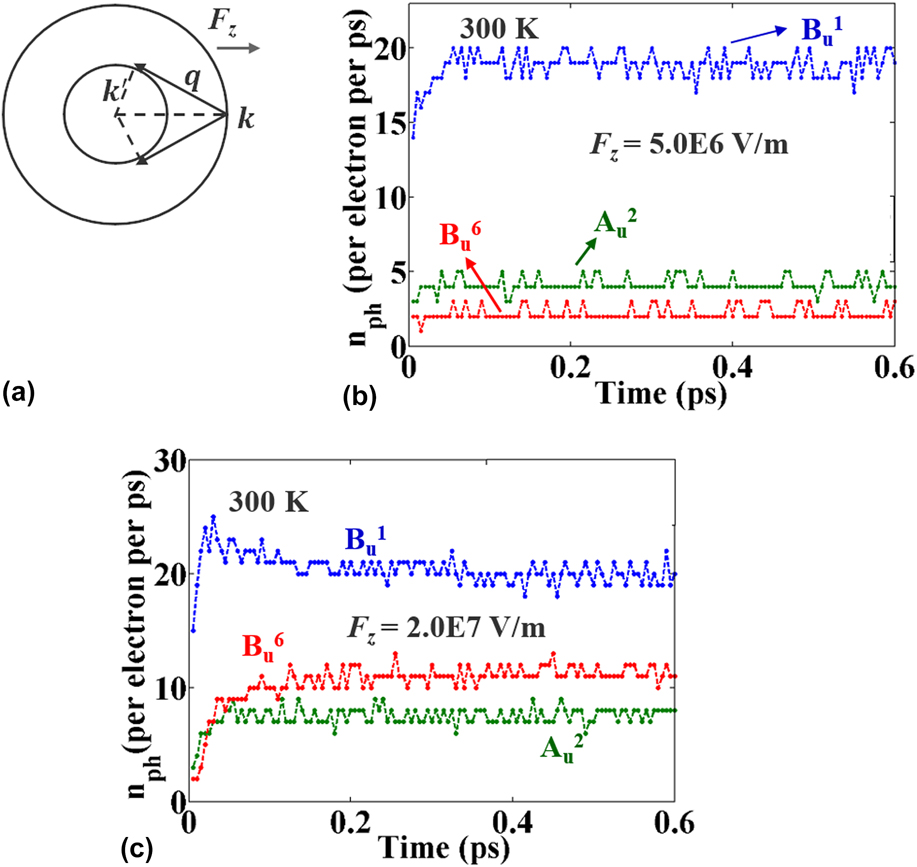
Next, we turn to discuss the anisotropy of the computed mobility in the two different directions. As seen from Fig. 6, the mobility is higher along the y direction compared to that in the z direction. The anisotropy is about 20% at a moderate doping. Such anisotropy is experimentally observed, Reference Wong, Sasaki, Kuramata, Yamakoshi and Higashiwaki31 but its origin is not clearly understood since it is well known that the electronic bands in β-Ga2O3 near the Γ point is isotropic. We attribute this anisotropy of the long-range interaction between the electrons and the LO modes (even in absence of any plasmon). The dominating Bu 1 mode as found in our previous work has a high projection of polarization along the z axis. Now low-energy electrons moving along the z direction will get scattered by phonons with a wave vector along the z direction. This idea is shown on Fig. 7(a). To better convey the idea behind the origin of the anisotropy, we carried out a Monte Carlo simulation to probe the emission rates of the different phonons mediated by the long-range interactions with electrons. No plasmon is considered in the MC simulation for simplicity and that does not affect the fundamental concept behind this anisotropy. Figure 7(b) shows the emission rates of the three modes Bu 1, Au 2, and Bu 6 under an external electric field of 5 × 10⁶ V/m applied along the z direction. The emission rate of the Bu 1 is higher because of the stronger interaction. The Bu 6 mode has a relatively higher energy, and only a few electrons have enough energy under this electric field to emit Bu 6 modes. Now as the electric field is enhanced, as shown in Fig. 7(c), the emission rate of the Bu 6 mode increases because electrons gain enough energy. However, although Au 2 has a lower energy than that of Bu 6, its emission rate increases by a smaller amount than that of Bu 6. This is because for an applied electric field along the z direction, the momentum of the electrons are more incline along the z direction and hence they couple more with phonons with wave vectors along z. This explains the experimentally observed Reference Wong, Sasaki, Kuramata, Yamakoshi and Higashiwaki31 anisotropy in electron mobility. Hence, this anisotropy completely follows from the anisotropy of the long-range electron–phonon interaction, and on the contrary to most conventional semiconductors, this anisotropy is not a result of any conduction band anisotropy rather it is a clear signature of the low symmetry of the monoclinic β-Ga2O3 crystal that results to anisotropic LO–TO splitting. The anisotropy decreases with increasing impurity scattering (see Fig. 6) since the latter is isotropic.
(a) The momentum conservation requires low-energy electrons to be scattered by phonons whose wave vectors are inclined toward (opposite) to the electron wave vectors. (b) Emission rate of three IR active phonons mediated by long-range interactions with electrons under an external applied field of 5 × 10⁶ V/m. (c) Same plots when the applied field is 2 × 10⁷ V/m.
C. 2DEG mobility
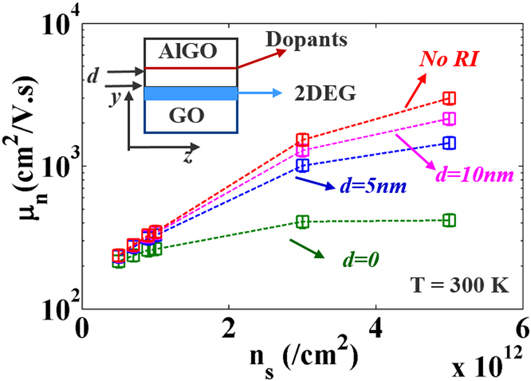
Two-dimensional electron gas in β-Ga2O3 has been very recently demonstrated experimentally. Reference Krishnamoorthy, Xia, Joishi, Zhang, McGlone, Johnson, Brenner, Arehart, Hwang, Lodha and Rajan32 Theoretical mobility limits are not well known yet. Here, we study the mobility of the 2DEG formed in the inversion layer of a simple Al x Ga2−x O3/Ga2O3 (ALGO/GO) heterojunction with varying electron concentrations. The typical structure is shown in the inset of Fig. 8, where the 2DEG is situated at a distance d from the dopants. The dopants are taken to be as a sheet charge density behaving like a δ Coulomb potential, and it is assumed that the 2DEG density at the channel is same as the sheet charge density of the dopants (such assumption could be relaxed by using a Poisson solver and is not addressed here for the sake of clearly conveying the trend of the mobility with increasing electron concentration). The scattering rate from such a RI center is modeled using a statically screened Coulomb interaction Reference Walukiewicz, Ruda, Lagowski and Gatos33,Reference Ando, Fowler and Stern34
 $${S_{{\rm{RI}}}} = {{{N_{\rm{I}}}{e^4}{m^ * }} \over {4\pi {\hbar ^3}{{\left( {{\varepsilon _{\rm{s}}} + {{\varepsilon '}_{\rm{s}}}} \right)}^2}}}\int_0^{2\pi } {{{\left( {1 - \cos \varphi } \right)} \over {\left( {{q^2} + {q_{{\rm{TF}}}}^2} \right)}}} {A^2}\left( q \right){\rm{d}}\theta \quad ,$$
here N
I is the surface dopant charge density present at the interface, εs and
 ${\varepsilon '_{\rm{s}}}$
are the static dielectric constants of the electron channel (in GO) and the dopant location (ALGO). We considered
 ${\varepsilon _{\rm{s}}} = {\varepsilon '_{\rm{s}}}$
, which is not a bad approximation for the small aluminum content in ALGO. q
TF is the two-dimensional Thomas–Fermi (TF) screening wave vector given by Refs. Reference Walukiewicz, Ruda, Lagowski and Gatos33 and Reference Ando, Fowler and Stern34
 ${2 \over {a_{\rm{B}}^ * }}$
, where
 $a_{\rm{B}}^ *$
is the effective Born radius. Note that the 2D TF wave vector is independent of the electron concentration. A(q) is the overlap function between the confined out-of-plane envelope function of the electron gas and the exponentially decaying Coulomb potential envelope from the remote impurities. The envelope function for the 2DEG is taken as the usual Fang–Howard form Refs. Reference Walukiewicz, Ruda, Lagowski and Gatos33 and Reference Ando, Fowler and Stern34 with an average inversion layer thickness of 5 nm. The (1—cos φ) term in the numerator of Eq. (13) accounts for the effective momentum relaxation with φ being the angle between the in-plane electron wave vector (
k
) and
q
. Due to the elastic nature of the impurity scattering,
 $q = 2k\sin {\varphi \over 2}$
.
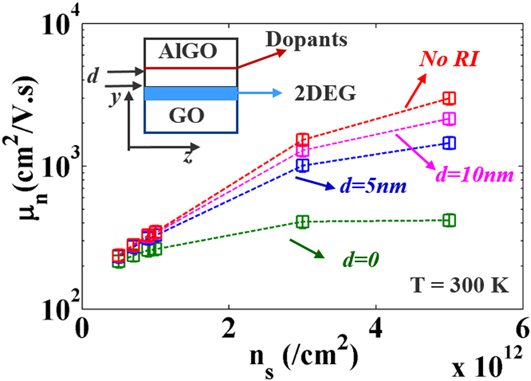
Electron density dependence of 2DEG mobility along the z direction. The mobility improves drastically as the RI center moves away from the interface. Error bars are included due to the approximations (see text for details). (Inset) shows the spatial location of the 2DEG and dopants.
The LOPC scattering formulation in the case of 2DEG follows the same steps as that for the bulk case except that the plasmon energy is modified by the first-order term, of the plasmon dispersion for a 2DEG,
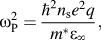 $\omega _{\rm{P}}^2 = {{{\hbar ^2}{n_{\rm{s}}}{e^2}q} \over {{m^ * }{\varepsilon _\infty }}},$
as shown by Stern.
Reference Stern35
The 2DEG is taken to be in the 1st sub-band, and no LOPC mode mediated intersubband transition is considered due to the high enough energy gap with the second sub-band. The confined direction is taken to be the y direction. This implies that only the Bu character LOPC modes are able to cause the scattering under this circumstance since momentum conservation will not allow the LOPC modes with a wave vector along the y direction to cause intrasubband transition. The computed mobility along the z direction is shown on Fig. 8 for several cases. Like the bulk case, the mobility improves with increased electron concentration due to enhanced screening of the LOPC modes. The antiscreening behavior is not observed since that occurs at a lower electron concentration than what is shown in Fig. 8. The mobility at a 2DEG density of 5 × 10¹²/cm2, when the RI center is at the interface, is around 418 cm2/V s, which is more than 2× higher than the bulk case. As the RI center moves away from the interface, the mobility improves on the higher n
s side due to low scattering by the RI. Reduction of the phase space for the final state after scattering and the remoteness of the impurities are responsible for the improvement in mobility. The error bars in Fig. 8 are showing a ±10% offset that might arise from issues like a dielectric mismatch at the interface, truncating the plasmon dispersion after the first order, and any numerical inaccuracies. In reality, this δ doping is only a few nanometers far from the interface to maximize the electron concentration in the channel. So, as seen from Fig. 8, it is expected that the mobility would be close to 1000 cm2/V s in the absence of any other scattering mechanisms that could potentially originate from surface-roughness, alloy disorder, or remote interface phonons.
V. CONCLUSION
We have calculated the electron density dependence of the mobility of β-Ga2O3 in bulk and 2DEG form. The enhanced screening at higher electron densities provides promise for improved mobility which is important for device operation. The interplay of screening and antiscreening of the LOPC modes at intermediate electron densities gives rise to interesting trends in the electron mobility. The anisotropy of the electron mobility is explained by an anisotropic polar phonon emission picture produced by Monte Carlo simulations. The 2DEG mobility shows more than 2× improvement than that of the bulk mobility. Further study on the 2DEG mobility is required by changing the separation of the dopants and the 2DEG. Also the confinement direction can be changed from y to z for studying any further improvement of mobility.
Supplementary Material
To view supplementary material for this article, please visit https://doi.org/10.1557/jmr.2017.398.
ACKNOWLEDGMENTS
The authors acknowledge the support from the National Science Foundation (NSF) grant (ECCS 1607833). The authors also acknowledge the excellent high-performance computing cluster provided by the Center for Computational Research (CCR) at the University at Buffalo.