During the manufacture of many industrial dairy products, milk may undergo a series of concentration processes using membrane filtration, such as microfiltration, ultrafiltration (UF) and diafiltration (DF) (Brans et al. Reference Brans, Schroen, van der Sman and Boom2004). While it is widely accepted that these processes keep the overall micellar state of the caseins (Mulvihill & Ennis, Reference Mulvihill, Ennis, Fox and Mcsweeney2003), much less is understood about the effect of these methods, if any, on the interior structure of the micelles. The casein micelle is viewed as an aggregate of four main proteins held together by hydrophobic interactions and bridged via calcium phosphate nanoclusters (Holt & Horne, Reference Holt and Horne1996; Horne, Reference Horne1998). In the past few years, there has been growing evidence that the amount of calcium associated with the casein micelles (most often approximated to the concentration of insoluble calcium) is not only fundamental in keeping the integrity of the casein micelles but plays an important role in determining the cheese making properties of milk. Colloidal calcium phosphate (CCP) is very important in the second stage of the renneting reaction (Lucey & Fox, Reference Lucey and Fox1993), losses of insoluble calcium induce formation of weaker, more flexible gels (Choi et al. Reference Choi, Horne and Lucey2007). The CCP content also strongly influences the buffering capacity of cheese (Lucey & Fox, Reference Lucey and Fox1993), being a key factor during acidification in cheese-making. Manipulation of CCP allows for modification of cheese texture properties such as meltability and stretchability (Choi et al. Reference Choi, Horne, Johnson and Lucey2008).
Milk has a very delicate ionic equilibrium between serum and micelles (Holt et al. Reference Holt, Dalgleish and Jenness1981), and membrane filtration processes could shift this equilibrium and have a lasting effect on the functionality of the resulting products. For example, it is known that the proportion of casein-to-colloidal calcium and phosphorous are changed during prolonged ultrafiltration, and that ionic deposition may occur on the surface of filtration membranes (Kulozik, Reference Kulozik1998; Jimenez-Lopez et al. 2008). Nevertheless, very little attention has been paid to date, to the effect of UF or DF on the internal structure of the casein micelles and even less is understood about the impact that UF and DF might bring on their processing functionality.
In order to investigate possible changes occurring in the interior of the micelle, new experimental approaches may be needed. Small Angle Neutron Scattering (SANS) is a well-established experimental technique which uses neutrons as a probe to investigate structure of matter (Pynn, Reference Pynn1990). It has a wide probing range of length scales, from the nanometer scale to the micron and the contrast of a system can by easily modified without changing the overall chemical properties by using D2O. Neutron scattering also has the advantage of being a non-invasive and non-destructive technique and it works well in highly concentrated and visually opaque samples, which becomes important when investigating industry-relevant food systems, such as milk.
Early SANS work on the casein micelles focused on testing the validity of the sub-micelle model. Stothart and co-workers reported a series of SANS results on fresh pellets of skim milk, where a noticeable peak was observed at a scattering vector q=0·035 Å−1 (see below for definition), which they assigned to coherent scattering from the “sub-micelle” unit (Stothart & Cebula, Reference Stothart and Cebula1982; Stothart, Reference Stothart1989). Following this interpretation, Hansen et al. (Reference Hansen, Bauer, Lomholt, Qvist, Pedersen and Mortensen1996) measured the size of casein micelles and of the proposed sub-micelle. These authors found that by varying the amount of D2O, the radii of the scattering unit decreased as the index matching increased. They interpreted this result as an indication that it is the surface of the sub-micelles which is contrast-matched. Upon the addition of chymosin and formation of a gel, no structural or size changes of the sub-micelles were identified by SANS (Hansen et al. Reference Hansen, Bauer, Lomholt, Qvist, Pedersen and Mortensen1996). This work also showed that the calcium nanoclusters were located in the midst of the constitutive units present in the micelle (what they called “sub-micelles”). In 1998, Holt et al. (Reference Holt, Timmins, Errington and Leaver1998) revisited the model of the casein structure after careful analysis of SANS data. These authors also performed a contrast variation SANS study on calcium phosphate nanoclusters in solutions containing different ratios of D2O/H2O. Subsequent work exploring the substructure of the casein micelle by x-ray and neutron scattering (Holt et al. Reference Holt, De Kruif, Tuinier and Timmins2003) suggested that the peak at q=0·035 Å−1 was attributed to a relatively uniform protein matrix containing a disordered array of calcium phosphate ion clusters with an overall characteristic separation distance (i.e., a characteristic length).
The purpose of this work was to investigate the effect of ultrafiltration and diafiltration on the distribution of these calcium phosphate clusters inside the casein micelle. SANS has been shown to be a very effective technique for the characterization of calcium phosphate nanoclusters, and therefore can be employed to observe the possible changes in the internal structure of the casein micelles occurring during membrane filtration. The results were compared with analytical determinations of soluble and insoluble calcium measured by non-suppressed ion chromatography, to understand the response of calcium clusters to the stress derived from UF and DF.
Neutron scattering theory
Small Angle Neutron Scattering, SANS, is a scattering technique in which neutrons are used as probes and thereby set the length scale for optimum resolution to investigate certain details of food structure. SANS is still rarely used in the structural characterization of food systems (Lopez-Rubio & Gilbert, Reference Lopez-Rubio and Gilbert2009). Like most scattering techniques, a neutron beam of wavelength λ (of a few Angstroms) passes through and interacts with a sample, being scattered through different angles, θ. The detected scattered neutron intensity I(q), as a function of the scattering vector q, (defined as 4π sin(θ/2)/λ) is the square of the spatial Fourier transform of the fluctuations in neutron scattering length density (NSLD) in the system of interest. In the case of isotropic, monodispersed particles, I(q) is related to the size and shape of the particle, which is known as the form factor, P(q), as well as to the interparticle correlations or interactions between particles, known as the structure factor, S(q) (Kerker, Reference Kerker1969) by:

One of the key features of neutron scattering is the ability to change the contrast characteristics of the sample to enhance different domains of the structure through partial or total replacement of the hydrogen atoms of water by deuterated water. By matching the NSLD of certain domains of a sample to that of the background, we can effectively make the matched part “invisible” (with respect to the background) thus enhancing the unmatched part. This is known as the “contrast-matched” condition. It has been reported before that the proteins in the casein micelles can be contrast-matched with a ratio of D2O/H2O of around 45/55 (v/v) (Hansen et al. Reference Hansen, Bauer, Lomholt, Qvist, Pedersen and Mortensen1996; Holt et al. Reference Holt, De Kruif, Tuinier and Timmins2003). The same authors also demonstrated that the optimal D2O/H2O ratio at which the distinctive peak, at q=0·035 A−1 is seen and the scattering of calcium clusters is most enhanced, is 60/40 (v/v). It must be pointed out, however, that in reality, the casein micelle is not perfectly homogeneous but has spatial fluctuations in density and structure. Furthermore, with this amount of D2O, the NSLD of the 60/40 (v/v) is around 3·5×10−6 A−2 compared with 2·8×10−6 A−2 for protein. It is very likely then, that a portion of the scattering signal arising from the protein fraction of the micelle will always remain detected at these D2O/H2O ratios.
Experimental Methods
Instant low heat skim milk powder (SMP) was supplied by Parmalat (London, Ontario, Canada). Fresh milk was collected from the Elora Dairy Research Station of the University of Guelph (Elora, Ontario, Canada) and sodium azide (0·02% w/v) was immediately added to prevent bacterial growth. The raw milk was skimmed at 6000 g for 20 min at 4°C in a Beckman-Coulter centrifuge (model J2-21, Beckman Coulter, Mississauga, Ontario, Canada) and filtered four times through Whatman glass fiber filters (Fisher Scientific, Mississauga, Canada).
Concentration of skim milk
To prepare the ultrafiltered sample, skimmed raw milk was concentrated to 5 times its original volume (UF 5×) by ultrafiltration (PLGC10k regenerated cellulose cartridge, Millipore Corp., Bedford, MA), by measuring the volume of collected permeate (i.e., milk serum). The concentrated sample was then diluted to its original volume fraction, i.e. 10%, by re-addition of the extracted permeate in order to re-suspend the micelles in their original milk concentration. To contrast-match the samples with addition of D2O without disruption of the ionic equilibrium in the milks, both control skim milk and UF 5× were dialyzed against reconstituted skim milk powder prepared as follow: 20 g SMP and 0·04 g NaN3 (as a bacteriostatic) were dispersed in a mixture of 117·6 ml D2O +62·4 ml H2O at 30°C yielding a D2O/H2O ratio of 65/35. The mixture was stirred at moderate speed for about 20 min and then left to cool to 22°C. Each sample (raw skim milk and redispersed ultrafiltered milk) was poured independently into cellulose dialysis tubing with a nominal cut-off of 6–8 kDa and immersed in 100 ml of this deuterated reconstituted skim milk powder for dialysis (24 h at 4°C). After volume correction for the added, immersed milk, a final D2O level of 60% in the samples was obtained. In the present work, a D2O/H2O contrast of 60% was purposely used to replicate that used by Holt et al. (Reference Holt, De Kruif, Tuinier and Timmins2003) as it was at this ratio that the height of the peak was maximized.
For the remainder of the manuscript, the untreated milk is denoted as SM(D) (skim milk dialyzed) and the next ultrafiltered sample is denoted as UF5×(D) (concentrated by UF 5 times, redispersed in its own serum to its original volume fraction and then re-equilibrated by dialysis).
Diafiltration of skim milk
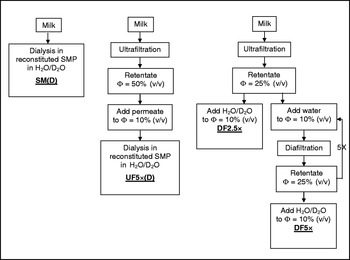
Skimmed raw milk was concentrated to 2·5 times its original volume by ultrafiltration. A portion of the concentrated milk was then collected and diluted back to the original casein volume fraction (10%) by addition of a H2O/D2O solvent mixture. This sample, which has gone through the process of ultrafiltration with further redispersion in H2O/D2O, is denoted as DF2·5×. The remaining concentrate from the ultrafiltration process was redispersed to its original volume by addition of the corresponding amount of purified water (Milli-Q, Bedford, MA) and the concentration process was carried out, once again to 2·5 times of the original volume. The concentrate was re-diluted to 10% volume fraction of the casein micelles by addition of Milli-Q water and this step was repeated for a total of 5 times until the concentration of serum constituents was less than 1% of the concentration in the initial milk. At this point the sample was diluted to its original volume fraction of casein micelles (10%) by addition of the H2O/D2O solution (as explained above), to a final 60% concentration of D2O for the subsequent neutron scattering experiments. This sample which has been diafiltered 5 times and redispersed in normal/deuterated water is denoted as DF5×.
Figure 1 shows a schematic of the different processing conditions for the milks. All processing was carried out within 24 h of receiving the fresh milk from the farm.
Flow chart detailing the conditions used to prepare the 4 different milk samples. Φ indicates the approximate volume fraction of the casein micelles after concentration and dilution.

Neutron Scattering Experiments
SANS experiments were conducted using the NG3 SANS instrument located at the National Institute of Standards and Technology (NIST) Centre for Neutron Research (NCNR, Gaithersburg, Maryland). A λ of 6 Å (full width at half maximum=15%) and the sample-to-detector distance of 4 m were employed to cover a q-range from 0·008 to 0·1 Å−1, which corresponds to real space dimensions of 6 to 78 nm. SANS data were collected by a 2-D detector and corrected for detector sensitivity. The empty cell and background scattering were subtracted from the raw data after transmission correction. The corrected data were then circularly averaged with respect to the beam centre to obtain the 1-D scattering profile as a function of q. The reduced data were normalized to the incident neutron flux, and put on an absolute scale. Milk permeate from each sample was used for the background scattering subtraction.
Determination of cations by non-suppressed ion chromatography
To determine the amount of soluble and total calcium present in the samples, samples were centrifuged at 25,000 g using a Beckman Coulter Optima™ LE-80 K ultracentrifuge with rotor type 70·1 Ti (Beckman Coulter) for 30 min at 20°C to sediment casein micelles. Samples and centrifugal supernatants were frozen at −18°C, until analysis. A non-suppressed ion chromatography method for the determination of cations in milk was employed as previously reported (Ferrer et al. 2011; Rahimi-Yazdi et al. Reference Rahimi-Yazdi, Ferrer and Corredig2010), using a pre-separation step with Amberlite (Fluka, Sigma, Germany) and an advanced Compact IC (Metrohm Ltd., Herisau, Switzerland).
The mobile phase used was a solution of 4 mm-Dicarboxylic acid and 1 mm-Pyridine-2, 6-dicarboxylic acid in isocratic elution (0·9 ml/min). The cation-enriched acceptor solutions were injected in the column (Metrosep C2-150, Metrohm Ltd., Herisau, Switzerland) through the sample loop. Calcium, Potassium and Magnesium standard solutions (1–10 mg/kg) were prepared and the concentration of each cation was determined using the ICnet software by comparing the area under the elution peak with the corresponding calibration curves.
Results
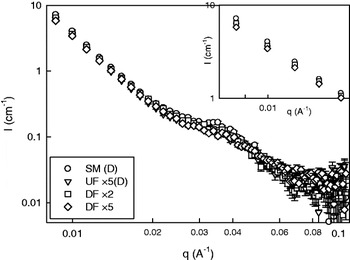
Figure 2 shows the results observed by SANS for the different milk systems described above. The figure plots the scattering intensity as a function of the scattering vector, q. The overall scattering profile of the four samples was remarkably similar, with nearly identical low q behaviour. This could be expected as all the samples were composed of skim milk and have the same protein concentration. There were, however, some differences arising in the middle q-range (∼0·03 to 0·045 A−1), which will be discussed later in the manuscript.
SANS scattering intensity results as a function of scattering vector for SM(D), UF5×(D) DF2·5× and DF5×.

The first feature arising from the data is the fact that, at small q, the intensity profile of all treated samples was similar, and arose from the contribution of the form factor, P(q), of the samples showing a decay of q −3·7. To help data interpretation, it would be important to note that the available q-range in this work corresponded, dimensionally, to a length-scale smaller than the average size of a casein micelle (i.e. 200 nm), that is to say, the information acquired in this work relates to the interior of the casein micelle. Similar work using SAXS has shown that at this q-range the scattering profile is independent of the casein micelle particle size (and polydispersity) (Marchin et al. Reference Marchin, Puteaux, Pignon and Leonil2007).
A detailed observation of the initial decay of the samples (inset Fig. 2) suggests that the neutron scattering intensity decreased with the extent of milk processing since all samples were brought to the same casein concentration (the standard deviations are smaller than the symbols). The control skim milk had the highest scattering intensity at small q, whereas the DF5× (with less than 1% of the original background serum present) had the lowest scattering. These differences in intensity could be, in principle, assigned to small differences in the D2O/H2O ratios, however the experimental protocol makes this highly unlikely. On the other hand, the SANS results at small q can possibly be attributed to a decrease in the contrast between the scattering particles and the serum background. Previous diffusing wave spectroscopy studies of both the ultrafilterd and diafiltered milks (albeit without the D2O/H2O substitution) have shown that the size of the casein micelles did not change after processing and/or dialysis (Ferrer et al. 2011). Furthermore, tests performed on the serums of these samples showed no loss of soluble caseins into solution after membrane processing. On the other hand, measurements of turbidity of the same samples did show a significant decrease in all three processed milks. Therefore, this decrease in the neutron scattering intensity of the casein micelle as a function of the extent of membrane filtration can also be obtained using light as a probe (Ferrer et al. 2011); the exact mechanism which gives rise to these effects remains to be investigated. Nevertheless, it should be stressed again that all four samples shared the same feature of q −3·7 decay at low q, indicating invariance in the nature of the scattering particles.
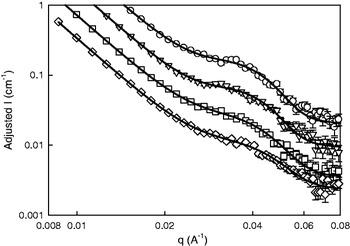
Another salient feature of the neutron scattering profile for the skim milk (Fig. 2, circles) was the existence of a broad peak between q=0·029 and 0·045 Å−1. This peak has been observed before (Stothart, Reference Stothart1989; Hansen et al. Reference Hansen, Bauer, Lomholt, Qvist, Pedersen and Mortensen1996; Holt et al. Reference Holt, De Kruif, Tuinier and Timmins2003) and different authors gave it different interpretations, either arising solely from casein sub-micelles or solely from inter-calcium cluster positional correlations [i.e., S(q)] within the micelles. Figure 2 also shows that the milk samples that underwent processing also retained the broad peak in the same q-range however; in contrast to their behaviour at low q's, the profiles for each milk were different. Figure 3 shows the same results as Fig. 2 but, for better clarity, the curves in Fig. 3 have been arbitrarily shifted in intensity (vertical axis) and range of q has been expanded. Furthermore, to compare the differences in the features of the peaks, the SANS data were fitted with the following phenomenological equation, in the q-range between 0·01 and 0·1 Å−1:

where the first term mimics the intensity decay at low q, with a slope of q−n (which, as shown above, is constant for all samples), the second term mimics a Gaussian peak with a peak position, q o and peak width, Δq, and finally, a background at large q. The pre-factor c represents the height of the peak and is related to the intensity contribution from each sample at that given q. The background was assumed to be a constant in each case. Table 1 shows the results of the fit of the data (before the y-shift) to Eqn 2. This equation is not intended to reproduce the quantitative aspects of the scattering model shown in Eqn 1, but rather, it was used to detect differences between the samples. A theoretical, comprehensive calculation of P(q) and S(q) for the different milk samples shown here was beyond the scope of this work.

Parameters obtained from the best fit (± fit errors) of the SANS experimental data to Equation 2

It is clear that the processes of diafiltration and ultrafiltration had an impact on the neutron scattering profile of the samples. SM showed the highest peak (c=0·091±0·002), while the heavily diafiltered milk, DF5×, had the lowest (c=0·055±0·002). Both the DF2·5× milk and the UF5×(D) had similar peak heights with intermediate values and, as stated above, slight differences in the D2O/H2O ratios between the samples (due to experimental error) would manifest themselves in a similar manner. However, the relative heights of the peaks change between 25 and 45% and such large changes cannot be explained by minor differences in deuteration). Most interestingly, the position of the peak, q o, was invariant throughout the 4 samples. The value of q o was calculated to be 0·034 Å−1, corresponding to an average characteristic length scale (d)=186 Å of the clusters. This characteristic length scale is in full agreement with that calculated and obtained experimentally in previous work (Holt et al. Reference Holt, De Kruif, Tuinier and Timmins2003), of an inter-particle scattering arising from the calcium phosphate at q=0·035 Å−1.
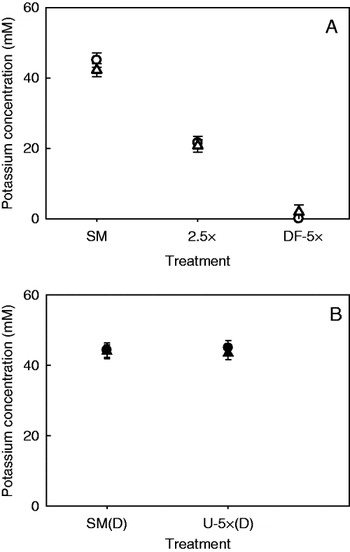
Analytical determinations of total and soluble potassium and calcium ions in the various samples were carried out to highlight possible differences in ionic equilibrium between the samples. Figure 4 shows the amounts of total and soluble potassium ions in the milk samples for control and filtered milks (SM, DF2·5× and DF5×; Fig. 4A) (SM(D) and UF5×(D); Fig. 4B). While the DF retentates were re-dispersed in water and not dialyzed, the samples in Fig. 4B were dialyzed against reconstituted milk powder (see methods).
Total (circles) and soluble (triangles) potassium ion concentration measured by non suppressed ion chromatography. A) Control skim milk (SM), DF2·5× and DF5×. These samples did not undergo dialysis. B) Control skim milk (SM(D)) and ultrafiltered (UF5×(D)), equilibrated by dialysis against reconstituted skim milk powder. Data are averages and bars are standard deviations.

The values of K+ reflect changes occurring to the serum ions, as K+ ions do not specifically interact with caseins, in contrast to Ca2+ ions. The process of diafiltration (Fig. 4A) exchanged the milk serum with water, thereby gradually depleting the samples of K+ as the serum was systematically replaced. Eventually, in the case of DF5×, where 99% of the background permeate had been substituted by water, the level of potassium dropped to nearly 0 (below the limit of detection). On the other hand, the process of ultrafiltration of milk and reconstitution of the concentrated in its own serum, UF5×(D), did not affect the amount of K+ in the system (Fig. 4B), as the amount measured corresponded exactly to that in the control, dialyzed skim milk. This was expected, as it is known that all of the potassium ions in milk are soluble (Gaucheron, Reference Gaucheron2005) and reconstituting the concentrated milk back in its own serum reinstated the ions that had been removed by the ultrafiltration process back to their original concentrations.
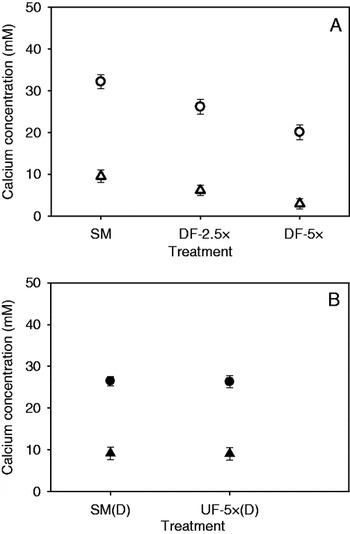
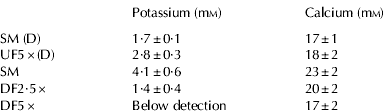
The total and soluble amounts of calcium in milk were also measured by ion chromatography and are shown in Fig. 5. Table 2 also shows the amount of insoluble Ca2+ ions present, calculated as the difference between the total and that recovered in the centrifugal supernatant, after correcting for the density of the serum and the caseins, the non-solvent water and the volume occupied by the casein micelles, as previously described by Gaucheron (Reference Gaucheron and Gaucheron2008). When comparing the SM, DF2·5× and DF5× in Fig. 5A, it is clear that in addition to the decrease noted for K+, these samples also showed a decrease in soluble Ca2+ with diafiltration. The insoluble Ca2+ concentration also decreased in these samples, as shown in Table 2.
Total (circles) and soluble (triangles) calcium ion concentration measured by non suppressed ion chromatography. A) Control skim milk (SM), DF2·5× and DF5×. These samples did not undergo dialysis. B) Control skim milk (SM(D)) and ultrafiltered (UF5×(D)) equilibrated by dialysis against reconstituted skim milk powder. Data are averages and bars are standard deviations.

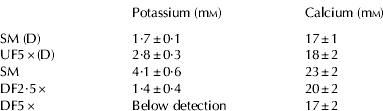
The total concentration of Ca2+ in SM was 32±2 mm, with a soluble portion of 10±1 mm, and a concentration of 22±2 mm-insoluble calcium (see Table 2). These values of soluble and insoluble calcium and potassium ions were in agreement with previous published results (Gaucheron, Reference Gaucheron2005). As the casein micelles were concentrated to 2·5 times their volume fraction and diluted back to 10% using water, the total amount of Ca2+ decreased to 26±2 mm, and both soluble and insoluble Ca2+ decreased (to 6 and 20 mm, respectively). Figure 5A confirmed that diafiltration not only decreased the levels of soluble calcium but also those of insoluble calcium, as the colloidal calcium became solubilized in an attempt to reach equilibrium with the diminishing calcium in solution, as previously published (St-Gelais et al. Reference St-Gelais, Hache and Groslouis1992). Figure 5A also shows that, as the amount of residual permeate in the milk reached less than 1% (DF5×), both the total and soluble concentration of calcium decreased markedly. In contrast with what was observed in Fig. 4 for the potassium ions, there was still residual calcium present in the DF5×, as it is associated with the micelles. However, results in Table 2 suggest that the amount of insoluble calcium gradually decreased with the extent of DF, as increasing the substitution of serum by water by diafiltration caused increased level of removal of colloidal calcium from the micelles.
On the other hand, there were no statistically significant differences in total or insoluble calcium between dialyzed skim milk and UF5×(D) (Fig. 5B, Table 2). It was also clear that for the insoluble calcium, which is often assumed to be equal to the amount present as colloidal calcium in the casein micelles, there were no statistical differences between SM(D) and UF5×(D). The analytical determination of ions therefore did not show discernible differences in the amount of insoluble calcium after the milk had been subjected to ultrafiltration, re-dispersion of the concentrated micelles in their own serum, and subsequent dialysis with reconstituted skim milk. These results are in disagreement with what has been reported by Ferrer et al. (2011) who found a decrease in the insoluble calcium caused by high levels of concentration by ultrafiltration. In the present work the difference can be attributed to the overall effect of dialysis of the samples against a much higher volume of reconstituted skim milk powder. It is indeed recognized that reconstituted skim milk powder have decreased levels of soluble calcium compared with raw skim milk (de la Fuente, Reference de la Fuente1998; Daufin, Reference Daufin and Gaucheron2004). The smaller amount of soluble calcium in the SM(D) of Fig. 5B compared with that of SM in Fig. 5A supports the fact that the dialysis step using reconstituted milk decreased the levels of total and soluble calcium in SM(D) and UF5×(D), perhaps masking the effect of ultrafiltration on the concentration of insoluble calcium.
Discussion
It is widely accepted that the neutron contrast match point of proteins is near 40–42% D2O, while that of calcium clusters is around 74–88%, depending on whether the authors used dispersions of low-heat skim milk powder (Hansen et al. 1996) or fresh casein micelles dispersed either in simulated milk ultrafiltrate (Stothart, Reference Stothart1989) or in a buffer saturated with respect to micellar calcium phosphate (Holt et al. Reference Holt, De Kruif, Tuinier and Timmins2003). Ideally, when perfectly matching either one or the other, any features arising from the scattering of that particular species should disappear.
Initial neutron scattering work on the casein micelles in milk (Stothart, Reference Stothart1989) assigned the origin of the inflection at q=0·035 Å−1 to protein structural effects. The peak was visible at a D2O content of 74% and 41% and the anomaly was attributed to the inhomogeneities in the protein matrix of the micelle. On the other hand, Holt et al. (Reference Holt, De Kruif, Tuinier and Timmins2003) investigated a range of D2O from 20% to 90% and showed that the peak can be detected at all D2O contents tested; however, it is the most prominent close to the match point of the protein. Holt et al. (Reference Holt, De Kruif, Tuinier and Timmins2003) therefore concluded that this feature arose from inter-particle scattering interference (or S(q)) of the calcium clusters within the micelle. The fact that the peak was clearly present at all the D2O contrast conditions (between 20 and 100%) was explained as arising from spatial correlations in the “holes” left in the protein matrix when the calcium clusters are fully matched.
The shapes of the curves shown in Fig. 3 are reminiscent of those obtained by Holt et al. (Reference Holt, De Kruif, Tuinier and Timmins2003) and Stothart & Cebula (Reference Stothart and Cebula1982). When these authors varied the contrast factor, they attributed the change in peak height to the different contrast levels (it is worth pointing out that these authors also inherently assumed that the interior of a casein micelle (nature of the interactions) did not change with different levels of deuterated water). It remains clear then, that the peak at q=0·035 Å−1 arises due to typical correlation lengths inside the casein micelles but that the relative height of this peak will be dominated (in this system) by the relative contrast between the protein, the calcium clusters and the serum as well as by the amount of scattering species in the micelle. In order to assert this, we have made several justified assumptions. The composition of the samples was not changing (calcium clusters plus protein background in serum) and the nature of their interactions was also unchanged. This invariance guaranteed no changes to the shape of the correlation peak and no variations in the mechanisms which give rise to the changes in the peak at 0·035 Å−1 between the treatments.
For the case of the DF2·5× and DF5× milk treatments the SANS results showed correlation between a decrease in the amount of micellar calcium as measured by IC (Table 2, Fig. 5) and a decrease in the relative height of the peak measured by SANS. The process of diafiltration dissolved the calcium clusters, effectively “thinning away” the large number of ions present in them. The nanoclusters are composed of a number of calcium and phosphate ions interconnected to phospho-serine residues. A decrease in neutron signal arising from the calcium clusters (which have a higher NSLD than the caseins) would be fully consistent with the partial (or total) dissolution of the calcium cluster. The characteristic length-scale of the system would be preserved (the average relative positions of the clusters would remain intact) but the scattering from each clusters would have been reduced.
In the case of ultrafiltered milk, UF5×(D), SANS experiments showed differences caused by processing which cannot be detected measuring ion concentrations. The height of the SANS peak decreased in the UF5×(D), compared with the SM(D) and, again, this decrease can be readily explained as a partial dissolution of the calcium clusters inside the micelles, however, no measurable differences in the amount of total and soluble calcium were noted by ion chromatography. This result is consistent with previous reports on milk at similar concentration levels, suggesting that a high extent of concentration by UF can promote the migration of the colloidal calcium phosphate clusters out of the micelle (Ferrer et al. 2011).
It is important to point out that, analytically; one can only measure the amount of total and soluble calcium, and assume that the value of insoluble calcium (the difference between total and insoluble) is equal to the colloidal calcium present in nanoclusters inside the casein micelles. This may not be the case and these seemingly discrepant results are fully compatible by viewing SANS results as a measure of the “micellar” calcium decrease with extensive ultrafiltration, and the ionic composition as a measure of the “insoluble” calcium (that is to say, calcium precipitating after centrifugal sedimentation either because of its association with the casein micelles or because it is present as insoluble salt.
In the present work SANS results clearly showed that the effects an extensive ultrafiltration treatment (UF5×(D)) were similar to those of a mild diafiltration process (DF2·5×). SANS can probe the interior of the casein micelle “directly”, overcoming the limitations of assuming that all the calcium precipitating during centrifugation of milk is micellar. These results, along with those shown for DF2·5× and DF5×, are consistent with the notion of a gradual thinning and removal of calcium clusters as the extent of processing was increased.