INTRODUCTION
Research studies are often conducted with the goal of generalizing to wider populations. Precisely for this reason, many experts duly remind applied researchers that for such studies “failing to plan is planning to fail” (Kruschke, 2015, p. 4). While such planning may cover a wide range of research practices, quantitative researchers are traditionally advised to plan for their required sample size such that achieving a sufficient level of statistical power is ensured (Cohen, Reference Cohen1988). The ultimate goal of this power-analytic approach (PAA) is to enable researchers to dichotomously distinguish between the statistically significant findings and the statistically nonsignificant findings in their intended studies. Over the years, however, PAA has shown to be incapable of accommodating one of the main goals of researchers (Cumming & Calin-Jageman, Reference Cumming and Calin-Jageman2017). Specifically, while researchers often aim to accurately estimate the actual size of an effect of interest in their studies, “an accurate estimate need not be significant and a significant estimate need not be accurate” (Kelley & Rausch, Reference Kelley and Rausch2006, p. 380).
In this article, I present an alternative method of sample size planning that focuses on ensuring that L2 researchers obtain an adequately narrow confidence interval (CI) for their effect sizes of interest thereby ensuring accuracy in estimating the actual size of those effects. I refer to this new approach as the accuracy in effect size estimation (AESE). To this end, I take five systematic steps. First, I compare the practical underpinnings of the PAA and AESE approaches to sample size planning in quantitative L2 research. Second, using L2 methodological literature, I present a general definition of narrow CIs for three effect sizes (i.e., Cohen’s d, R-squared [R2], and partial eta-squared) in L2 research. Third, I apply the AESE approach to a wide range of actual L2 research studies in the literature that involve comparison of two paired or independent groups (t-tests), comparison of multiple groups with preexisting differences (ANCOVA), comparison of multiple groups in factorial designs (factorial ANOVA), and evaluation of relational models (multiple regression). Fourth, I show that despite its intuitive appeal, AESE planning may not be currently used with complex mixed repeated measures (MRM) designs, in which case PAA, with all its limitations, remains as the only sample size planning option. Finally, I offer a repository of free and flexible R programs to enable the practical use of the methods discussed in the present article.
Before moving on, however, a point of clarification is in order. Much of the methodological (and eventually substantive) practices in science are driven by either epistemological or/and ontological assumptions. For example, when studying a continuously measured L2 variable (e.g., proficiency), a researcher may assume that scores from an infinitely large, unseen population of participants’ TOEFL iBT test results will form a normal, bell-shaped distribution. In the absence of other evidence, this solely epistemological assumption provides a platform for researchers to conservativelyFootnote 1 generalize their results to their actual, unseen population of interest. However, one may put forth hard evidence from relevant large-scale empirical efforts or several other continuously measured human attributes (e.g., IQ; intelligence quotient) that are known to be normally distributed as ontological evidence to justify the existence of normally distributed proficiency scores. Indeed, the case of normal-population assumption seems to be concurrently backed by both epistemological and ontological evidence (McElreath, Reference McElreath2016). Likewise, in this article, the sample size planning procedures discussed are premised on similar epistemological or/and ontological assumptions and work best when those assumptions are at least approximately met.
POWER ANALYSIS VERSUS ACCURACY IN EFFECT SIZE ESTIMATION
POWER-ANALYTIC APPROACH
The goal of PAA is to enable researchers to plan for their required sample size such that they can systematically decide whether a finding signals the existence of some effect (true signal) in the target population or not (random noise). Driven by this binary view, the workhorse of PAA is the well-known null hypothesis significance testing (NHST). Under the NHST framework, if an observed treatment effect seems to fit well under the central premise of the null hypothesis, such that the treatment produces absolutely no effect in the target population, then the observed treatment effect seems to be a random, nongeneralizable finding (Norouzian et al., Reference Norouzian, De Miranda and Plonsky2019; Thompson, Reference Thompson2006). Otherwise, the null hypothesis is rejected, albeit without determining what alternative hypothesis might provide a better premise for the observed treatment effect. Power analysis starts from right here. If one wants to plan for a future study, they must first offer an alternative hypothesis. This means that a researcher should conservatively lay out their expectation regarding what the actual size of the treatment effect could be, beyond the null hypothesis position. This way, in the intended study, when using NHST to determine whether a finding is generalizable, the null hypothesis rejection behavior can be regulated in relation to the researcher-specified alternative. From this point on, PAA will find the required sample size such that the null hypothesis rejection behavior meets the researcher’s preset conditions.
For better illustration, let us use PAA to find the required sample size for a meaningful L2 study based around a pre–post–control research design as shown in Figure 1.
Pre–post–control design layout. R = random assignment; T = treatment; C = control; Pre = pretest; Post = posttest.

Specifically, suppose the researcher is seeking to plan for the number of required participants in a study focused on measuring the short-term efficacy of indirect feedback in improving written accuracy of advanced English as a foreign language (EFL) learners with respect to a target linguistic feature. Through indirect feedback, one only signals the location of “errors without presenting the correct form” (Norouzian & Farahani, Reference Norouzian and Farahani2012, p. 12). Following the pretesting, randomly assigned members of the experimental group will receive indirect feedback on three of their written works while the members of the control group will receive their usual, classroom feedback during this time. Finally, both groups will be posttested to reveal any gains in the written accuracy. The intended analytic plan is “to compute for each group pretest–posttest gain scores and to compute a t [i.e., independent samples t] between experimental and control groups on these gain scores” (Campbell & Stanley, Reference Campbell and Stanley1963, p. 23). But to start the PAA sample size planning for such a study, how can we specify an alternative hypothesis? When available, a recent meta-analysis of relevant research is always a good choice for providing a conservative alternative hypothesis. In the case of indirect feedback, a recent meta-analysis by Kang and Han (Reference Kang and Han2015) suggests that indirect feedback could produce an effect quantified by a meta-analytically standardized mean difference effect size (i.e., Cohen’s d) of .361. In other words, we may offer an alternative hypothesis premised on the assumption that instead of zero (the null position), the population size of the effect of indirect feedback on written accuracy could be .361 in standardized units of mean difference. At this point, perhaps a software package can better help us visualize the PAA planning procedure for this example. To do so, I suggest using my suite of R functions accessible by running the following in R or RStudio®:
source("https://raw.githubusercontent.com/rnorouzian/i/master/i.r")
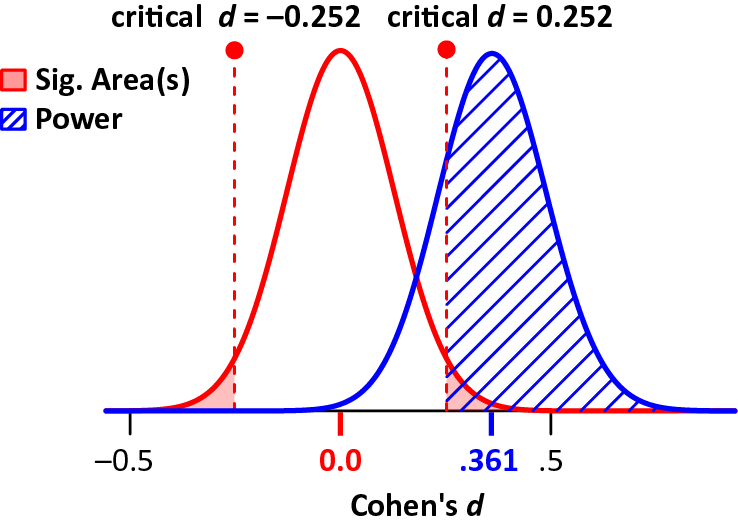
Because the intended analytic plan is to compare the gain scores (i.e., posttest – pretest) of two independent groups using a t-test, our R function plan.t.test can visually illustrate the PAA sample size planning process for this intended analysis with the results shown in Figure 2:
Null (left) and alternative (right) hypotheses for the effect of indirect feedback.

The left curve is the null hypothesis centered around the idea that indirect feedback has no effect on written accuracy. The right curve is the alternative hypothesis based around the recent meta-analytic results (Cohen’s d = .361) of Kang and Han (Reference Kang and Han2015). The preset conditions conventionally are to regulate the rejection of the null in relation to the alternative such that, if our exact same study were to be repeated large many times, 80% of the time the null is rejected when it is false (power), and 5% of the time the null is rejected when it is true (Type I error rate). Under these two preset conditions, it turns out that if we are able to recruit 122 participants for each group in our study, then we can expect to safely distinguish statistically significant findings from the random findings in our future study. As is discussed in the next section, however, PAA’s suggested sample size could dramatically change, if the underlying effect of indirect feedback on written accuracy was smaller or larger than .361 in Cohen’s d metric.
ACCURACY IN EFFECT SIZE ESTIMATION
Under PAA, planning the sample size for a future study only revolves around gaining power to dichotomously distinguish between statistically significant and nonsignificant study effects. Recent years, however, have witnessed a dramatic shift away from the binary mindset of PAA in favor of an alternative that emphasizes accurate estimation of the actual size of study effects in the target populations (Kelley & Rausch, Reference Kelley and Rausch2006; Norouzian et al., Reference Norouzian, De Miranda and Plonsky2018). Succinctly put, accuracy in estimation is best captured through the width of the CI around an observed effect. When the CI around an observed effect is wide, our accuracy in estimating the actual size of an effect in the population is decreased. Conversely, a narrow CI around an observed effect denotes that one has accurately estimated the actual size of the effect in their target population (for a full discussion on CIs see Cumming & Calin-Jageman, Reference Cumming and Calin-Jageman2017).
AESE uses this principle as its main goal for planning the sample size for a future study. Specifically, AESE seeks to plan the sample size of a future study such that researchers either (a) expect or (b) are guaranteed to obtain an adequately narrow CI. Norouzian et al. (Reference Norouzian, De Miranda and Plonsky2019) discuss in detail why situations (a) and (b) exist and are important for practical purposes. As a quick reminder, CIs are based on the frequentist theory of statistical inference that assumes, the “average” width of all say, 95% CIs from endless replications of one’s exact same study will successfully indicate the actual width of the 95% area in effects distributed around the true population value. Therefore, if we only expect to obtain a Cohen’s d CI that is no wider than, say .4, then AESE will give us a sample size plan that if followed to do the exact same study innumerable times, on average produces a CI that is no wider than .4. Thus naturally, there is no guarantee that following this application of AESE will lead to the desired CI width of .4 in a single intended study. Note that because restrictions of this nature relate to the underlying concept of long-run repetitions (i.e., frequentist theory), they extend to PAA, albeit in a different form. For example, although in theory, say, 80% of the replication studies following PAA’s sample size plan will correctly reject the null hypothesis (i.e., 80% power), that does not mean that any one planned study that rejects the null hypothesis has done so with 80% certainty.
While such natural, yet undesired restrictions are not addressed under PAA, they have been well explored under the AESE framework. To be clear, as researchers, we want some degree of assurance to know that if we plan our future study’s sample size according to AESE, then we are guaranteed to obtain our desired, narrow CI in our own specific case. The technical details of how such a method of assurance works falls outside the scope of the present applied article (Cumming & Calin-Jageman, Reference Cumming and Calin-Jageman2017; Kelley & Rausch, Reference Kelley and Rausch2006; Norouzian & De Miranda, Reference Norouzian and De Miranda2019). Indeed, methods of assurance for each research design, and each type of effect size are different. The good news is that for several research situations, there is an efficient method of assurance that produces satisfactory results.
Having laid out the foundation of AESE planning, let us apply the method to plan for the case of indirect feedback study planned earlier using the PAA. To do so, we use our R function plan.t.ci. This R function will require the researcher to provide the proposed size of the effect of indirect feedback on written accuracy as well as the desired width for the CI for that effect size. Similar to PAA, when available a recent meta-analytic result may provide a good basis for these required pieces of information. In our case, a closer look at Kang and Han (Reference Kang and Han2015) reveals that their 95% CI for the effect of indirect feedback is not particularly narrow. Specifically, Kang and Han’s meta-analytically derived standardized mean difference of .361 for the efficacy of indirect feedback has a lower limit of .035 and an upper limit of .686. Therefore, the width of their 95% CI is easily obtained by subtracting the upper limit from the lower limit: .686 − .035 = .651. If we are to plan for a future study on indirect feedback, we might want to achieve a narrower CI, for example, width of .5, that would more accurately help us estimate the actual size of the effect of indirect feedback in the population of advanced EFL learners (see next section for width specification). The R function plan.t.ci can be used to expect a CI of width .5 in a future study:
This will result in 125 participants needed for each group. However, if we want to have 99% assurance that, in our own specific case, we will observe a CI no wider than .5 for our effect size, then, we can set the argument expect to FALSE:
This 99% assurance requires recruiting five additional participants, that is, 130 participants for each group.
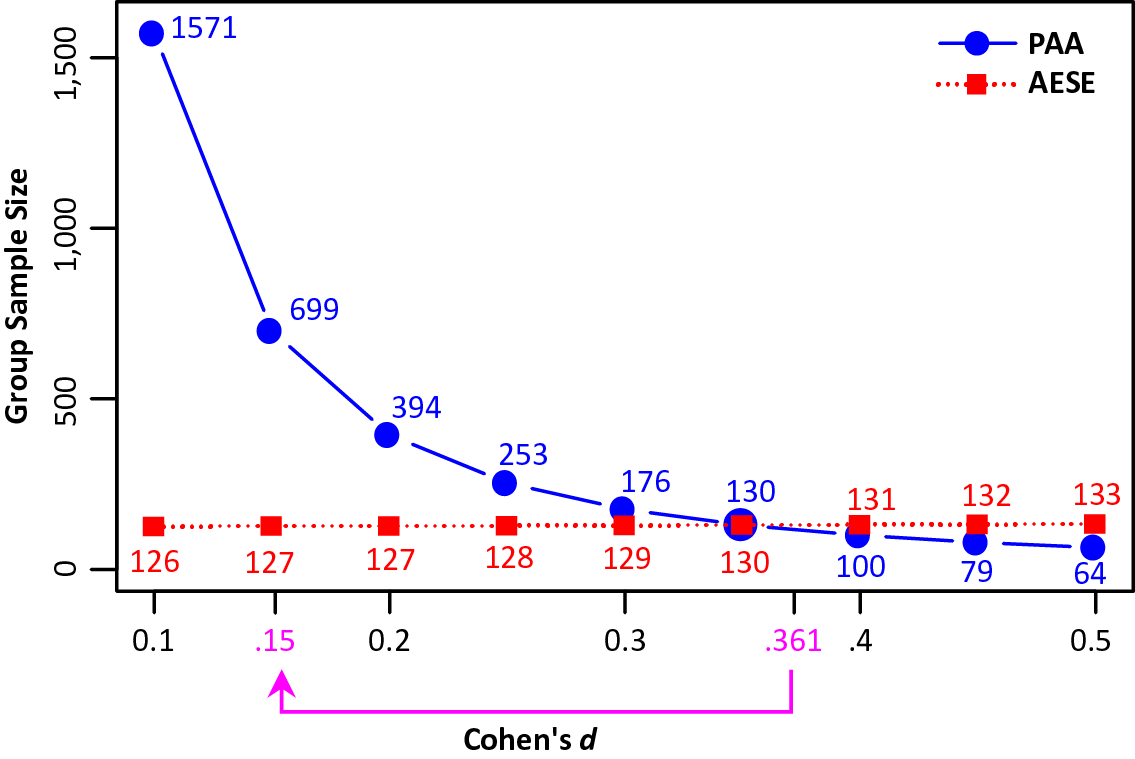
Comparing PAA and AESE for our example, three subtle points arise. First, notice that the difference between the 99% assurance planning (i.e., 130) and the expect planning (i.e., 125) is not so much (i.e., only 5 participants). This is not always the case, and depending on the design and researchers’ specified conditions (e.g., CI width), the difference between the assurance planning and the expect planning may change to varying degrees. Second, you may have also noticed that the number of participants required under the AESE and the PAA (i.e., 122) planning is close. Indeed, this is not often the case. If we compare the required sample sizes under a range of effect size values for indirect feedback using both PAA and AESE, then we can see that the two methods of planning lead to very different sample sizes. Figure 3 illustrates this point visually (to further explore Figure 3 see: https://github.com/izeh/n/blob/master/1.r).
Comparison of PAA and AESE sample sizes as effect size changes.

For instance, if instead of .361, we used .15, as the proposed effect size of indirect feedback, AESE would only change from 127 to 130 participants. But PAA, would change its suggested number of participants from 122 to 699! That is, while PAA can radically change its suggested sample size as we change the effect size of indirect feedback, AESE is quite robust in relation to this change. Third, under PAA, setting power to 80% and Type I error rate to 5% are widely practiced conventions, and thus if a researcher is logistically unable to recruit 122 participants for each group of their study on indirect feedback, then, perhaps they might abandon using PAA for planning purposes. However, as shown in later sections, AESE can accommodate the expectations of a researcher to the extent that relevant meta-analytic findings and the design of the study allow to arrive at a practically feasible sample size plan. Together, these three points should make clear that PAA and AESE are two different approaches to sample size planning that aim to achieve two different goals.
SPECIFYING CI WIDTH FOR EFFECT SIZES
In some cases, there might not be an appropriate meta-analytic study to gain some insight regarding the width of CI for an effect size in a specific L2 research domain. Fortunately, recent methodological efforts in L2 research allow us to shed more light on the concept of CI width in the context of commonly employed effect sizes in L2 research. To facilitate the fieldwide use of AESE planning, in this section, I use the L2 methodological literature to provide some insight into the current width of CIs for three effect sizes: (a) Cohen’s d used in between- and within-groups comparisons, (b) R2 used in regression studies, and (c) partial eta-squared used in AN(C)OVA designs.
CI WIDTH FOR COHEN’S d
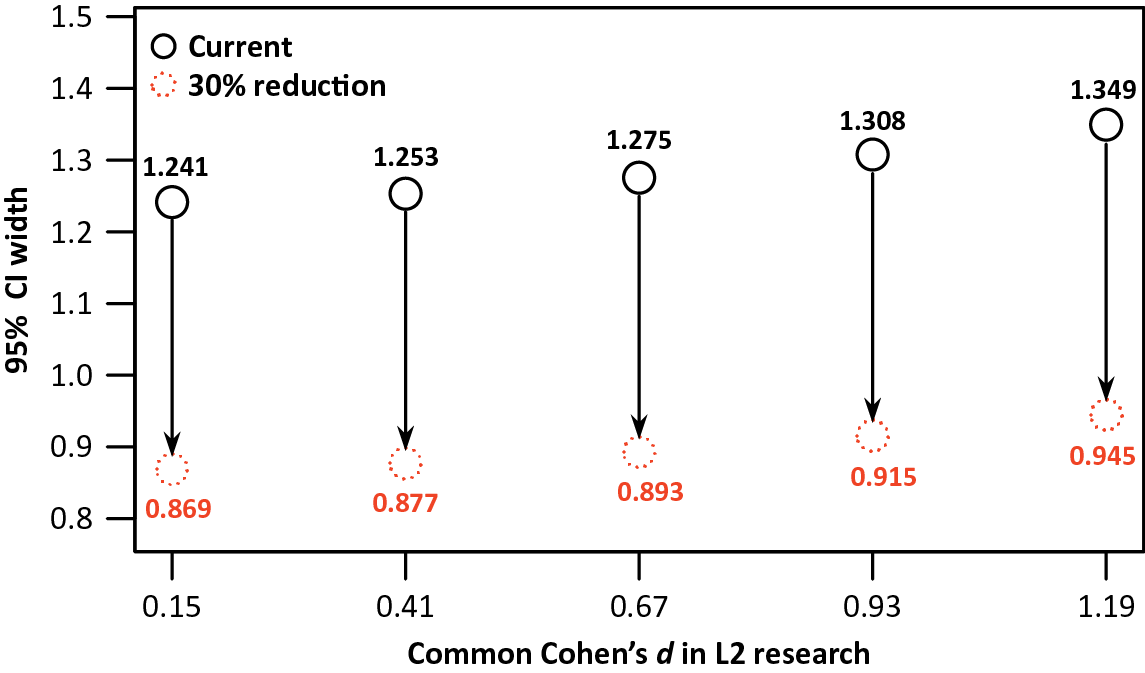
Ideally, a researcher may want to reduce the CI width of their effect size estimates in a future study relative to the CI width of a relevant meta-analytic study.Footnote 2 However, when appropriate meta-analytic studies are not available, it is useful to gain a general understanding of the common width of CIs for Cohen’s d in L2 research. To do so, we use the results of Plonsky and Oswald (Reference Plonsky and Oswald2014). Specifically, in their examination of the magnitude of Cohen’s d effect size in 346 primary L2 studies and 91 meta-analyses of L2 studies, Plonsky and Oswald (Reference Plonsky and Oswald2014) found that for between-groups comparisons, Cohen’s d often ranges from .15 to 1.19 with a median of .62. We do also know that group sample sizes in L2 research, on average, are about 20 participants (Plonsky, Reference Plonsky2014). With these details from the L2 methodological literature, we can provide a general picture regarding the current width of the CIs for Cohen’s d in L2 research. To do so, we use our R function d.width.plot with the results presented in Figure 4:
Commonly observed CI width of between-groups Cohen’s d in L2 research.

The black circles in Figure 4 display the current width of the CIs for Cohen’s d in between-groups comparisons in L2 research informed by the findings of Plonsky and Oswald (Reference Plonsky and Oswald2014) and Plonsky (Reference Plonsky2014). We can plan to achieve narrower CIs for Cohen’s d by reducing these CI widths to varying degrees. Displayed as a possible reduction plan, the dotted circles represent width of these CIs when we reduce them by 30%. Also, the output of the d.width.plot R function shows that to achieve this 30% reduction, the mean group samples size of 20 in L2 research (Plonsky, Reference Plonsky2014) has to rise to somewhere between 44 and 49 participants depending on the size of Cohen’s d. Therefore, in the absence of a prior meta-analytic study, we may ideally want to reduce the median width of between-group Cohen’s d CI (the black cricle in the middle in Figure 4) by any percentages (5%, 10%, etc.) based on our available resources.
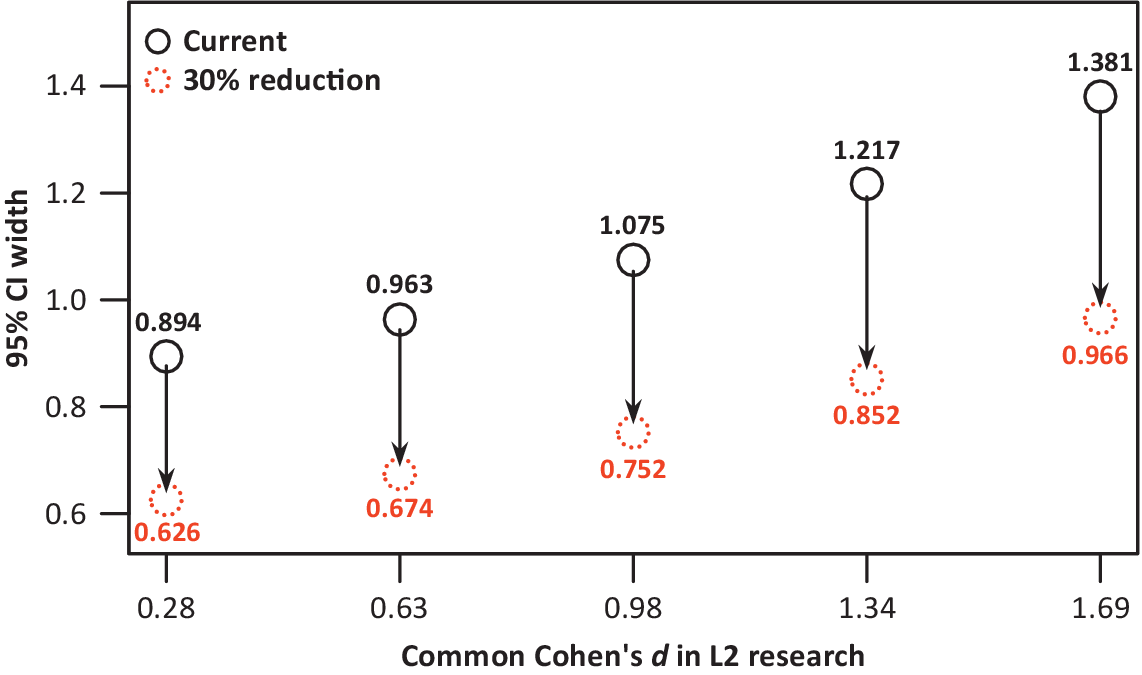
Similarly, for within-groups comparisons that occur when researchers compare the same group at two different times, Plonsky and Oswald (Reference Plonsky and Oswald2014) found that the magnitude of Cohen’s d could range from .28 to 1.69 with a median of ~1.00. To find the common CI widths for Cohen’s d in this case, we can again use the R function d.width.plot with the results presented in Figure 5:
Commonly observed CI width of within-groups Cohen’s d in L2 research.

For these within-groups comparsions, the R function indicates that to achieve a 30% reduction in the width of CIs for Cohen’s d, the common group samples size has to rise from 20 to somewhere between 49 and 62 participants depending on the size of Cohen’s d. Again, in the absence of a prior meta-analytic study, we may ideally want to reduce the median width of within-groups Cohen’s d CI (the black cricle in the middle in Figure 5) by any percetages (5%, 10%, etc.) based on our available resources.
CI WIDTH FOR R2
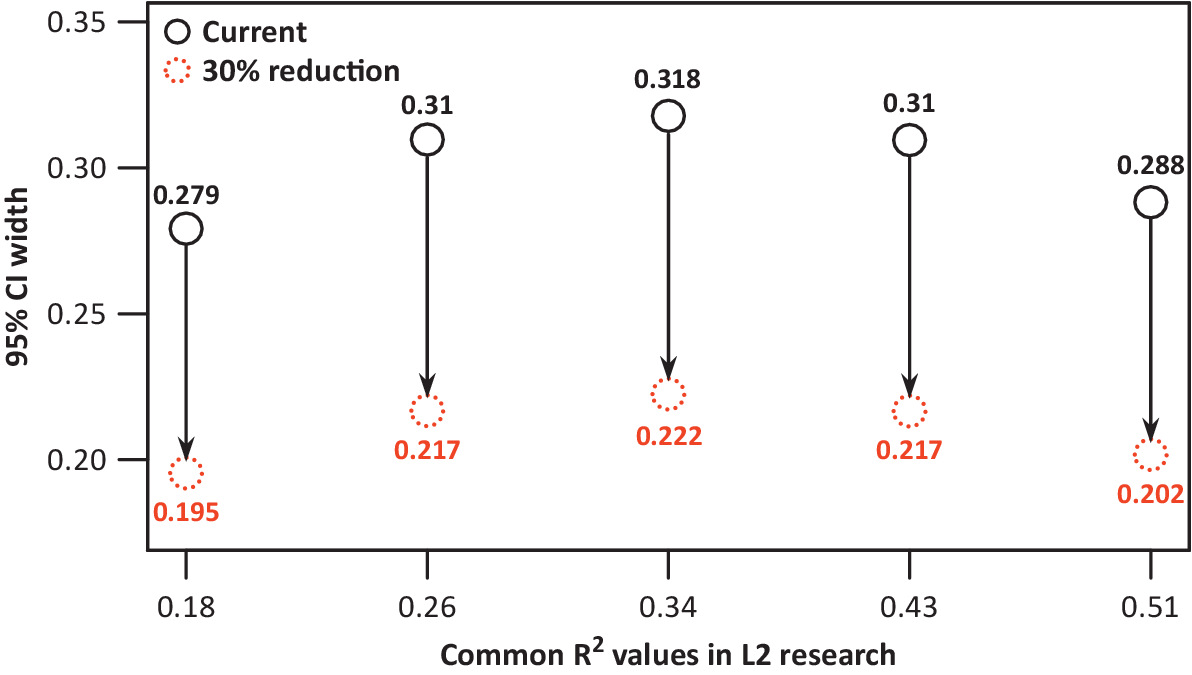
Similar to Cohen’s d, squared multiple correlation coefficient (R2) is a key measure of effect size that quantifies the explanatory power of a linear model in a regression study (Norouzian & Plonsky, Reference Norouzian, Plonsky, Phakiti, De Costa, Plonsky and Starfield2018a). As demonstrated in later sections, past meta-analytic research in any specific L2 domain should be directly consulted to get an insight about the width of CI of R2 for the studies in that domain. But thanks to the recent effort by Plonsky and Ghanbar (Reference Plonsky and Ghanbar2018), it is also possible to gain some insight about the common width of CIs for the R2 effect size in L2 research. In their examination of 8,492 articles published in 16 L2 journals, Plonsky and Ghanbar found that in the majority of the L2 regression studies, the number of predictor (n.pred) variables often does not go beyond four. Also, the median sample size for this large sample of studies was 77 participants. Additionally, Plonsky and Ghanbar discovered that the R2 values commonly found in L2 research range between .18 and .51 (median = .32). We can incorporate these findings into our R function R2.width.plot to determine the common width of CIs for R2 with the results shown in Figure 6:
Commonly observed CI width of R2 in L2 regression studies.

Once again, in the absence of previous domain-specific meta-analytic results, Figure 6 helps us understand that regression studies in L2 research may commonly produce R2 effect sizes whose median CI width is ~.32 (the middle black circles in Figure 6). Therefore, in planning for a future regression study, we may want to reduce this width by any percentages given our resources as demonstrated in the later sections. Finally, the output of the R2.width.plot R function shows that to achieve a 30% reduction in the width of R2, the current median sample size of 77 participants in L2 regression studies should increase to at least 156 participants.
CI WIDTH FOR PARTIAL ETA-SQUARED
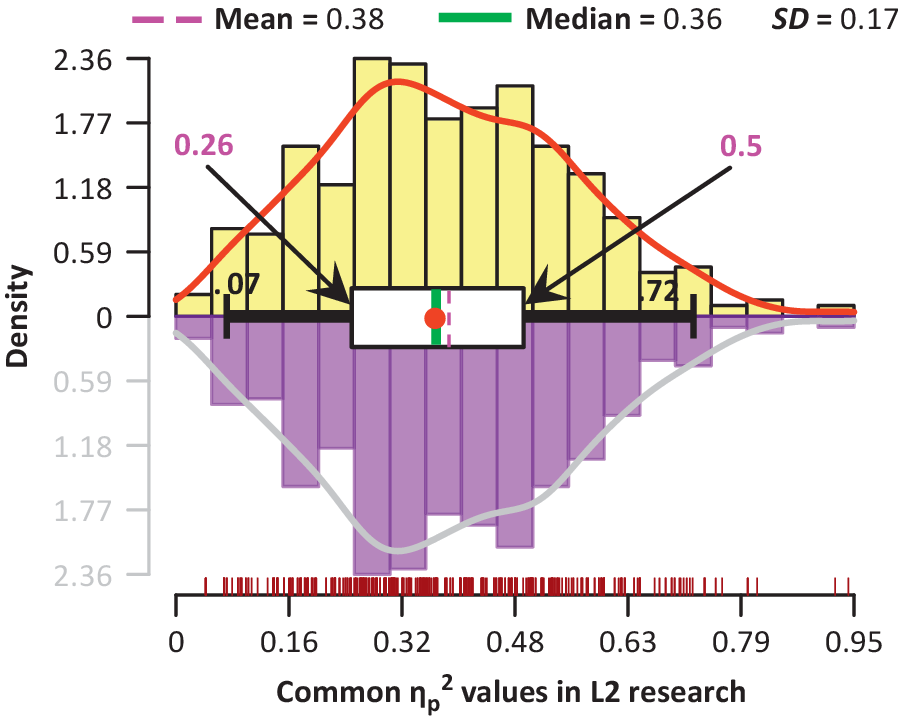
Partial eta-squared (ηp2) is another critical measure of effect size often used in conjunction with analyses of variance and covariance (AN[C]OVA), the first of which is the most commonly used analytical approach in L2 research (Norouzian & Plonsky, Reference Norouzian and Plonsky2018b). As Norouzian and Plonsky (Reference Norouzian and Plonsky2018b) discuss, this effect size shows the explanatory power of a factor partialing out other factors in the research design. As part of their examination of ANOVA effect sizes from five L2 journals, Norouzian and Plonsky (Reference Norouzian and Plonsky2018b) recorded the magnitude of partial eta-squared in the L2 research reports published between 2005 and 2015. This empirical dataset is publicly available at: https://github.com/izeh/i/blob/master/e.csv. Figure 7 shows the distributional properties of this dataset.
Commonly observed ηp2 values in L2 AN(C)OVA studies.

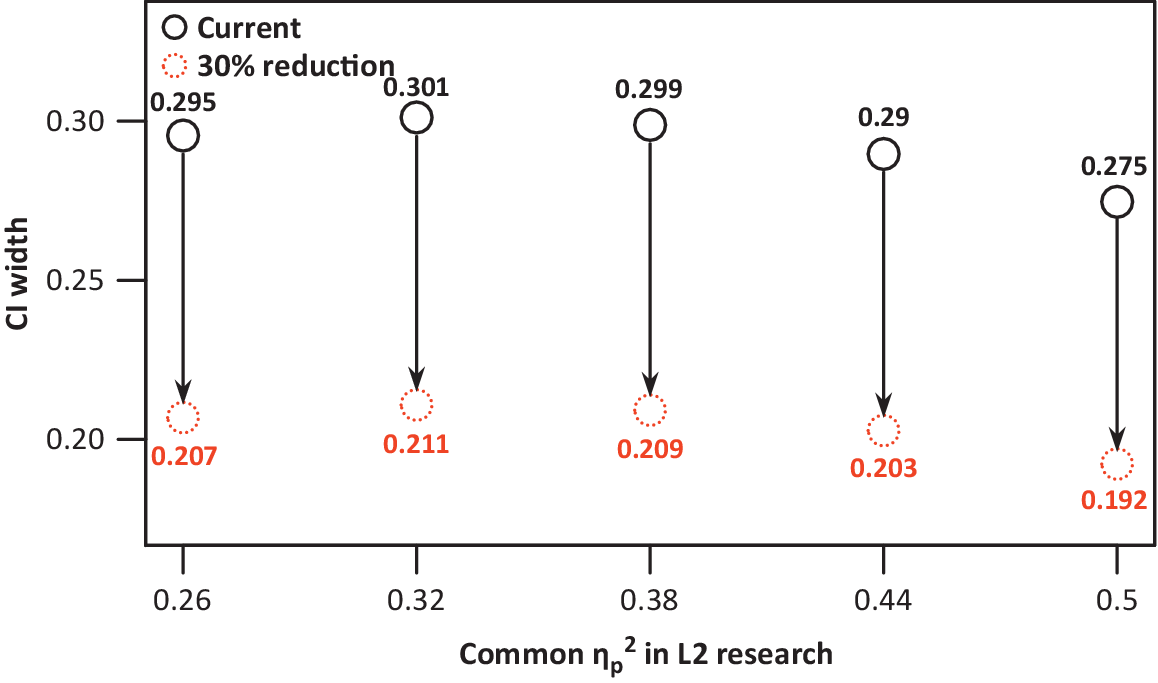
As shown in Figure 7, despite their variability, much of the partial eta-squared values in L2 research are concentrated between .26 and .5, with a median of .36. Combined with the observations that average group sample sizes in L2 research is ~20 participants with studies often organized in four groups (Plonsky, Reference Plonsky2014), then for a typical 2 × 2 multifactor ANOVA design in L2 research with four groups (80 participants), the common CI widths for partial eta-squared can be obtained using our R function peta.width.plot with the results are visually displayed in Figure 8.
Commonly observed CI width of ηp2 in L2 AN(C)OVA studies.

Figure 8 indicates that a typical ANOVA study in L2 research may currently produce ηp2 effect sizes whose median CI width is ~.3 (the middle black circle). If in planning for a future ANOVA study, we may want to reduce this width by any reasonable degree to achieve narrower CIs. For example, if we aim for 30% CI width reduction, then the resultant width will be similar to those shown as dotted circles in Figure 8. The interested reader may use argument n.covar to add the number of covariates (e.g., n.covar = 1) to confirm that the CI width of ηp2 effect sizes displayed in Figure 8 are almost identical to those for typical ANCOVA designs with one or two covariates.
As is discussed next, the view presented in the preceding text is quite useful in specifying the width of CI for various effect sizes when appropriate domain-specific meta-analyses are not available. Because given the available resources (e.g., time and budget), one can clearly express, and also adjust their expectations for the amount of accuracy gain (in percentages) they desires and plan for the number of required participants in a future study accordingly.
APPLYING AESE PLANNING TO ACTUAL L2 RESEARCH DESIGNS
The knowledge gained in the previous section will prove crucial in at least three sample size planning situations. First, in the absence of updated meta-analytic studies, the previous section can serve as a general guide for specifying various effect sizes as well as their CI widths required for the AESE sample size planning. Second, certain types of effect size on which the AESE or PAA planning might be based are traditionally not employed in meta-analytic studies (see the next section). Third, fixed-effects meta-analyses that are based on a relatively large number of primary studies (e.g., ≥ 20) can produce extremely narrow CIs (e.g., Cohen’s d CI width ≤ ~.15) for the meta-analyzed effect sizes (see Sánchez-Meca & Marín-Martínez, Reference Sánchez-Meca and Marín-Martínez2008) that may not be suitable for AESE planning purposes.Footnote 2 In all these situations, the knowledge about the median size of various measures of effect as well as their CI widths will provide a reasonable basis for planning the sample size for a future study.
At this point, it would be instructive to apply the AESE planning to a variety of actual L2 research studies for two important reasons. First, we can practically examine the critical decisions made during the planning process for real L2 research problems. Second, we can demonstrate both the flexibility as well as limitations of AESE planning to determine the required number of participants for direct replication of those real L2 studies (Marsden et al., Reference Marsden, Morgan‐Short, Thompson and Abugaber2018a, 2018b). Specifically, in this section, we apply the AESE planning to published studies in L2 literature that involve comparison of two paired groups (t-test), comparison of multiple groups with preexisting differences (ANCOVA), factorial designs (multifactor ANOVA), and relational models (multiple regression). Additionally, we show that despite its overall superiority, AESE may not be used with the complex MRM designs, in which case we demonstrate the use of PAA as the alternative sample size planning option.
AESE PLANNING FOR PAIRED COMPARISONS
Yang and Lin (Reference Yang and Lin2015) examined the effect of online collaborative note-taking strategies on EFL literacy (reading and writing) development. To do so, they recruited 52 beginning-level EFL learners, 26 of whom were assigned to a control group and the remaining 26 to an experimental group. After pretesting, members of the experimental group were asked to make use of a computer-supported collaborative learning (CSCL) environment where they could see and share multiple revised drafts of their written summaries on an assigned reading with their peers, clarify unclear information in the text, receive peer feedback, and utilize an online dictionary. Instead, the control group “had no access to the [CSCL] system and lacked the opportunity to observe their peers’ reading and writing processes [e.g., initial drafts of summaries]” (p. 132), and thus exchanging the final draft of summaries, providing peer feedback, and using a dictionary all occurred face-to-face.
While Yang and Lin (Reference Yang and Lin2015) followed a pre–post–control design (see Figure 1), they chose to separately measure the possible gains within each group using two paired samples t- tests.Footnote 3 The results revealed that the experimental group significantly improved from pretest to posttest (Cohen’s d = .61). However, despite reaching statistical significance, the control group’s improvement (Cohen’s d = .36) was “without practical significance” (p. 133).
Let us suppose we are planning to replicate Yang and Lin (Reference Yang and Lin2015). Because no previous meta-analytic study on the topic is available, to apply the AESE planning, we can use the median of commonly observed within-groups (i.e., paired) Cohen’s d (i.e., ~1.00) along with its CI width (i.e., ~1.07) in L2 research (see Figure 5) as the basis of our participant planning. Also, as noted earlier, when planning for a future study, we may ideally want to reduce the width of the reference CIs—thus increase the accuracy of our findings—to the extent that our resources permit. The R function plan.t.ci can reduce the width of the reference CIs to the degree (in percentages) desired by a researcher. For example, in our future study, we may want to plan for a CI for Cohen’s d that is 20% narrower than the common (i.e., median) CI width observed in L2 research (see Figure 5), we can use plan.t.ci as follows:
Note that the argument paired denotes the paired (i.e., within-groups) nature of the comparison that is being planned for. This planning requires 47 participants for any one group in the study (94 participants for the entire study). If our resources allow, we can aim for higher accuracy by further reducing the width, or otherwise keep the accuracy the same (i.e., reduce.by = "0%").
AESE PLANNING FOR COMPARISONS WITH PREEXISTING DIFFERENCES
Using intact classes has historically been commonplace in L2 research (Hatch & Lazaraton, Reference Hatch and Lazaraton1991). Despite the random assignment of classesFootnote 4 to different study groups, the preexisting differences (i.e., covariates) in participants’ knowledge on the L2 quality to be examined can cause so much variability in participants’ performances that the isolated effect of treatments will be hard to measure. This can specially occur in instructed L2 acquisition (ISLA) studies where the use of intact classes is prevalent. When appropriate (see Thompson, Reference Thompson2006), an analysis of covariance (ANCOVA) can reduce the noise due to such covariates, and provide a clearer picture of the treatment effect. The following is one such actual ISLA study that will require us to explore AESE planning in new ways.
Recognition of pragmatic competence as one of the pillars of language ability (Bachman, Reference Bachman1990) has been the driving force behind several ISLA studies focused on instructed L2 pragmatic development (Norouzian & Eslami, Reference Norouzian and Eslami2016). Using a pre–post–control design (see Figure 1), Eslami et al. (Reference Eslami, Mirzaei and Dini2015) explored the effect of explicit and implicit pragmatic instruction, delivered using computer mediated communication (CMC), on EFL learner’s performance of requests. To that end, the researchers randomly assigned three upper-intermediate EFL intact classes (N = 74) to one of control (n = 27), explicit (n = 23), or implicit (n = 24) groups. During a 12-week period, 18 trained native and advanced nonnative English-speaking tutors were each assigned to teach the pragmatics of requesting to two to three EFL learners either in the explicit or the implicit group mainly using e-mail. The explicit group received (a) metapragmatic instruction based around concepts such as distance, power/social status, and imposition, (b) examples of various forms of requests, and (c) direct feedback on the appropriateness of their output. However, the implicit group members were implicitly directed to attend to the requests in the lessons using input enhancement (e.g., boldfacing), carrying out discourse completion tasks, and implicit feedback (recasts) given during the CMC-delivered instructions. Finally, “the control group completed traditional in-class activities, including the four skills, grammar, and vocabulary practice activities” (p. 103).
The result of the ANCOVA procedure on a discourse completion task (DCT) used before and after the treatment revealed that there are general differences among the groups after controlling for the preexisting pragmatic knowledge of EFL learners using pretesting (covariate). The effect size reported for these general differences was a partial eta-squared (ηp2) of .66. In other words, removing the preexisting pragmatic knowledge, membership to the study groups (i.e., the group factor) could explain 66% of the differences in the posttest performances of the three groups. This is the main effect in Eslami et al. (Reference Eslami, Mirzaei and Dini2015) study. However, pairwise comparisons specifically located statistically significant differences between (a) the explicit and the control groups (t(48) = 11.21, p < .05), (b) the implicit and the control groups (t(49) = 7.84, p < .05), and (c) the explicit and the implicit groups (t(45) = 3.39, p < .05).
To plan for a study such as the one described in the preceding text, a key decision must be made. Specifically, do we want to plan such that in our future study, designed after Eslami et al. (Reference Eslami, Mirzaei and Dini2015), we have a narrow CI for the effect size (i.e., ηp2) related to the main effect in the study detected by the group factor (macroplanning)? Or we want to plan to achieve narrow CIs for the effect sizes related to our specific research questions answered by pairwise comparisons (microplanning)? As is discussed next, the macroapproach seems to be both conceptually and practically feasible. However, despite its conceptual appeal, the microapproach may often seem to be logistically difficult to implement.
To apply the macroplanning approach, we could ideally consult an updated meta-analysis on instructed L2 pragmatics (Badjadi, Reference Badjadi, Tang and Logonnathan2016) to gain an insight about the average size of ηp2 meta-analyzed from a number of L2 pragmatics studies along with its CI width. However, meta-analyses traditionally do not employ effect sizes (e.g., ηp2, R2) that are based on the proportion of variance (POV) accounted for by a treatment. This is because these POV effect sizes “are inherently nondirectional, and can have the same value even though the research studies exhibit substantively different results” (Hedges & Olkin, Reference Hedges and Olkin1985, p. 103). Instead, to use the macroapproach, we can consult Figure 7 to specify the magnitude of ηp2 effect size and Figure 8 to specify the CI width. Based on these two resources, we know that the average of ηp2 estimates commonly observed in L2 research is ~.38. Additionally, for common multigroup designs in L2 research, the median CI width for ηp2 estimates is ~.3 (middle black circle in Figure 8). We can now incorporate these details into our new AESE planning function, plan.f.ci, to plan for a study modeled after Eslami et al. (Reference Eslami, Mirzaei and Dini2015):
where pov denotes any member of the POV effect sizes (e.g., ηp2, R2), n.level is the number of groups being compared, design is the total number of groups in the entire design (here the same as n.level), and n.covar represents the number of covariates (in this case 1; the pretest) used in the study. Also, we may aim to achieve 5% reduction (i.e., reduce.by = "5%") in the CI width relative to the median CI width of ~.3 for ηp2 in L2 research.
This setting turns out to require 92 participants for the entire study. Thus, if we intend to follow the macroapproach with 5% gain in accuracy, we should ideally divide 92 participants equally among three groups to achieve ~31 participants in each group, as opposed to the ~25 participants assigned to each group by Eslami et al. (Reference Eslami, Mirzaei and Dini2015).
The second approach is microplanning. The goal is to ensure that we obtain narrow CIs for the effect sizes (typically Cohen’s d) from pairwise comparisons between substantively important groups in a multigroup study. Commonly, this approach may be separately applied to all experimental conditions’ pairwise comparisons with the control/comparison group. When there are no meta-analytic results suitable for a specific pairwise comparison, then we should resort to Figure 4 to specify between-groups Cohen’s d based on its median magnitude in L2 research along with its CI width. In our case, we can start out with explicit L2 pragmatic instruction. To do so, we can consult the recent meta-analysis on instructed L2 pragmatics by Plonsky and Zhuang (Reference Plonsky, Zhuang and Taguchi2019) to retrieve the meta-analyzed effect of explicit pragmatic instruction contrasted with a control group along with its CI. In this case, Plonsky and Zhuang (Reference Plonsky, Zhuang and Taguchi2019) reported a Cohen’s d of 1.68 with a 95% CI of 1.64 and 1.73 (i.e., CI width = .09). As noted earlier, when the meta-analytic CI is extremely narrow (e.g., Cohen’s d CI width ≤ ~.15), we can use the common (i.e., median) CI width from L2 literature which in this case is 1.27 (see Figure 4), and then reduce this width to the degree that is desired. The R function plan.f.ci will also alert the user if the desired CI width is too narrow or too wide for the design and asks for a change in the specified width if necessary. In this case, we can aim for 5% accuracy:
Noting that d is the Cohen’s d retrieved from Plonsky and Zhuang (Reference Plonsky, Zhuang and Taguchi2019), this setting returns 90 participants for the two groups (i.e., 45 per group) in a pairwise comparison where explicit pragmatic instruction is involved to achieve 5% accuracy gain relative to the commonly observed accuracy for between-groups comparisons in L2 research (Figure 4).
Next, we can retrieve the same information for the implicit pragmatic instruction contrasted with a control group from Plonsky and Zhuang’s (Reference Plonsky, Zhuang and Taguchi2019) meta-analysis, which are a Cohen’s d of 1.27 along with a 95% CI of 1.21 and 1.34 (CI width = .13). Because again the meta-analytic CI is very narrow (CI width ≤ ~.15), we can use the common (i.e., median) CI width for Cohen’s d from L2 literature, which in this case is 1.27 (see Figure 4), and then reduce this width to the degree that is desired. Again, we can aim for CI width reduction:
This sample plan again requires 90 participants for two groups (i.e., 45 per group) in a pairwise comparison where implicit pragmatic instruction is involved to achieve narrow CIs relative to the commonly observed CI width for between-groups comparisons in L2 research (Figure 4).
Therefore, the group sample size of 45 participants represents the group sample size that ensures obtaining CIs for Cohen’s d that are adequately narrow relative to the commonly observed CI width for between-groups comparisons in L2 research in all substantively important pairwise comparisons in our future study. Although conceptually appealing, this means that we should plan to recruit 135 participants (i.e., 3 groups × 45 participants) for our entire intended study modeled after Eslami et al. (Reference Eslami, Mirzaei and Dini2015). For L2 researchers with limited resources, microplanning might sometimes be a logistically challenging approach to follow. Thus, in several research situations, macroplanning may be a more feasible approach to sample size planning.Footnote 5
AESE PLANNING FOR FACTORIAL DESIGNS
Second language researchers often explore a substantive variable’s effect in the presence of other research variables to understand their interaction effect on an L2 quality (see Vatz et al., Reference Vatz, Tare, Jackson, Doughty, Granena and Long2013). Essential to know is that interaction effects are sometimes referred to as moderation effects. Factorial designs are uniquely able to measure such interaction effects, and thus are of interest to L2 researchers. However, because factorial designs can include multiple factors, and each factor can contain multiple groups (i.e., levels), the AESE planning for such designs may be used to achieve various goals. The following is an actual example from a larger study by Bai (Reference Bai2018) to explore these goals.
Proficient writers are believed to spontaneously use various cognitive and metacognitive strategies (CMSs) to improve their writing (Graham et al., Reference Graham, Harris, Stangelo, Schunk and Greene2018). In a factorial study with young ESL (English as a Second Language) students, Bai (Reference Bai2018) set out to discover whether (a) the frequency of use of CMSs could depend on the writing competence of the ESL students, and (b) the grade level of the ESL students could moderate ESL students’ use of CMSs?
To answer these questions, 32 ESL students from two grade levels (i.e., lower vs. upper) and at two levels of writing competence (i.e., low vs. high) were asked to complete an untimed picture composition task. Each student had to correctly order four pictures, and write a coherent story based on the pictures’ content. During the production stage, researchers carefully elicited students’ use of CMSs through think-aloud protocols (see McKay, Reference McKay2006). The think-aloud protocols were then coded and transcribed to determine the type, and the frequency of use of CMSs for each participant (see Bai, Reference Bai2018). Finally, a 2 × 2 factorial analysis of variance (ANOVA) was utilized to answer the two research questions described in the preceding text for each type of CMS identified in the transcribed think-aloud data.
To use AESE planning for this 2 (competence level) × 2 (grade level) factorial ANOVA design, it is important to realize that three macroplanning scenarios could be possible. First, we may want to achieve a narrow CI for the main effect of belonging to a writing competence group on the CMS use (i.e., competence factor)? Second, we may want to achieve a narrow CI for the main effect of belonging to a grade-level group on the CMS use (i.e., grade factor)? Or third, we may want to achieve a narrow CI for the effect of belonging to a writing competence group on the use of CMSs by the lower and upper grade ESL writers (i.e., interaction factor)?
If there is any theoretical reason that one of these three study factors might have a population effect size that is different from the others, or if any of the factors involve different number of groups (i.e., levels), then macro-AESE planning should be separately conducted for each, and then the largest sample size obtained determines the total sample size for the entire study. Typically, the target effect size for such factors in any AN(C)OVA study is partial eta squared (ηp2). In this case, we do not have any theoretical reasons to believe that the population size of partial eta squared effects in Bai's (Reference Bai2018) study might be different. However, because we have an interaction effect that involves both other factors’ groups (i.e., 2 × 2 = 4 levels), macro-AESE planning should be separately done for the interaction factor, as well as either of the main factors (competence or grade factor). As before, we may base our planning for macro-AESE on the median magnitude of ηp2 in L2 research (i.e., ηp2 = .38) along with its CI width of ~.3 (the middle black circle in Figure 8). We can use the R function plan.f.ci to concurrently obtain the macro-AESE sample plans for both the interaction factor (4 levels), and one of the main factors (2 levels) with 5% gain in accuracy (i.e., reduce.by = "5%"):
The output returns 90 participants for the main factors and 94 participants for the interaction factor. Therefore, the macro–AESE sample plan for the entire study is the larger of the two (i.e., 94 participants), ~24 participants for each of the four groups in the entire study.
In factorial designs, it is also possible to conduct microplanning to achieve narrow CIs for pairwise comparisons in a future study designed after Bai (Reference Bai2018). Bai’s (Reference Bai2018) 2 × 2 study design consists of four groups (i.e., k = 4) of participants. Thus, we could theoretically have six pairwise comparisons (i.e., [k × k − 1] / 2). To plan for any specific pairwise comparison, we should define the population size of Cohen’s d and its CI width for that comparison either from a previous meta-analytic study focused on that comparison or using the median size of Cohen’s d commonly found in L2 research. Because in the case of spontaneous strategy use, as intended by Bai (Reference Bai2018), no recent meta-analysis is available, we can specify between-groups Cohen’s d (i.e., ~.62) and its median CI width (i.e., ~1.27) based on Figure 4 and then reduce this width to the degree desired. In this case, the R function alerts us that the minimum amount of reduction is 42% relative to the median width of the CIs for Cohen’s d in L2 research. This means that planning with certainty requires at least 42% reduction in the current CI width. Therefore, we can plan for our comparison as follows:
This micro–AESE planning results in 123 participants for each group in a pairwise comparison in this factorial research design. As mentioned earlier, although conceptually appealing, the microplanning in extended research designs (i.e., designs with more than two groups) can sometimes result in sample size plans that are logistically difficult to implement. Thus, in factorial designs, macro–AESE planning can perhaps be a more realistic choice.
AESE PLANNING FOR REGRESSION STUDIES
In regression studies, researchers often seek to empirically examine a relational model in which the relations among the study variables are theoretically justified (Norouzian & Plonsky, Reference Norouzian, Plonsky, Phakiti, De Costa, Plonsky and Starfield2018a). There are, however, a number of rules of thumb to determine how many participants a regression study requires to render a generalizable interpretation (see Green, Reference Green1991). With its emphasis on accuracy, AESE can provide a superior framework to plan the required sample size such that R2, as a measure of effect size in regression studies, has an adequately narrow CI around it. This is best demonstrated through an actual L2 study exploring the role of self-efficacy in foreign language achievement.
Bandura’s (Reference Bandura1997) social cognitive theory (SCT) recognizes a central role for one’s belief about their own efficacy for performing real-life tasks in predicting their success in those tasks. Driven by SCT, Mills et al. (Reference Mills, Pajares and Herron2007) examined the contribution of self-efficacy to achieve a given grade in French to predicting 270 French as a foreign language college students’ achievement (i.e., final grade) when controllingFootnote 6 for five other motivational predictors. The five motivational predictors consisted of French anxiety, French learning self-concept, self-efficacy for self-regulation, the perceived value of French language, and French culture (for more details see Mills et al., Reference Mills, Pajares and Herron2007). Mills et al. (Reference Mills, Pajares and Herron2007) ran two separate regression models. One model excluded the perceived value of French language, and culture (R2 = .09), and the other included all six predictors of French achievement in the model (R2 = .1). The authors concluded that the difference between the two models (∆R2 = .01) indicated a small and statistically nonsignificant contribution from self-efficacy.
To use AESE planning for a regression study designed after Mills et al. (Reference Mills, Pajares and Herron2007), we could consult a relevant and updated meta-analysis. However, in this case, the only meta-analysis available (i.e., Masgoret & Gardner, Reference Masgoret and Gardner2003) is (a) based on a different motivational model for L2 acquisition (socioeducational model; Gardner, Reference Gardner2000), and (b) nearly 16 years old. Thus, to determine the R2, and CI width for R2, we can use the median size of commonly found R2 (i.e., .32) in L2 regression studies and its CI width (i.e., ~.31; middle black circle in Figure 6). Using the R function plan.f.ci we can aim for different amounts of accuracy gains (e.g., 20% and 30%) all at once and inspect the number of required participants:
Note the use of the arguments pov for R2 effect size and n.pred to denote the number of predictors. This setting returns 129 participants for 20% gain in accuracy and 168 participants for 30% gain in accuracy relative to the median accuracy observed in L2 regression studies. As a general proposition, in large regression studies where multiple regression models are separately tested, the researcher must conduct the AESE planning for each model only if regression models are believed to produce different R2 effect sizes in their populations. Then, the largest sample size from the AESE procedures conducted determines that most conservative number of participants for all models tested in the study. In the case of Mills et al. (Reference Mills, Pajares and Herron2007), the only difference between the two models is the number of predictors. Generally, the larger the number of predictors, the higher the number of participants required. Thus, basing AESE planning on the larger six-predictor model, as shown in the preceding text, produces a sample size plan that ensures narrow CIs for both models and by design their difference (∆R2) in a future replication of Mills et al. (Reference Mills, Pajares and Herron2007).
PLANNING FOR MIXED REPEATED MEASURES DESIGNS
Historically, a common “criticism of L2 type-of-instruction research is that effects of instruction may only be short-lived at best” (Norris & Ortega, Reference Norris and Ortega2000, p. 488). To overcome this criticism, many instructed L2 acquisition (ISLA) researchers tend to extend posttesting their study groups beyond the immediate postexperimental observations. Naturally, such an extension of posttesting occasions for multiple study groups leads to a MRM design. In their simplest form, MRM designs allow for mixing a time factor (i.e., within factor), within which same study groups are tested multiple times, and a group factor (i.e., between factor) that distinguishes between the participants’ group memberships. This mixing also leads to an interaction factor (i.e., between-within factor) that measures the performance of study groups across the testing occasions. Mainly due to their structural complexity, determining the CI for partial eta squared (ηp2) effect size in MRM designs is not well established. Thus, at the time of this writing, macro–AESE planning to achieve narrow ηp2 CIs in MRM designs is not possible. However, we can conduct both macro- and microplanning through the traditional PAA approach to achieve statistically powerful tests (e.g., 80% power). This is best demonstrated by applying PAA planning to an actual ISLA study.
Shintani and Ellis (Reference Shintani and Ellis2013) investigated whether direct corrective feedback and metalinguistic explanation could help ESL learners acquire explicit or implicit knowledge (see DeKeyser, Reference DeKeyser, VanPatten and Williams2015) of the use of the English indefinite article system. For the purpose of this demonstration, here we only focus on the effect of the feedback type on the implicit knowledge development measured using three writing tasks completed at three different times. Shintani and Ellis (Reference Shintani and Ellis2013) divided their 43 intermediate-level ESL participants into three groups. In the direct feedback group (n = 15), students were asked to complete a picture composition task in 20 minutes (first writing). In two days, students received their essays with the correct form of all article errors marked in them by the researchers. Students were allowed to review their errors for 5 minutes and make the necessary revisions. Next, participants were asked complete a second picture composition task (second writing). Finally, two weeks later, participants did their last picture composition task in the same manner (third writing).
The same procedure described in the preceding text was followed with the metalinguistic feedback (MF) group (n = 13). However, in this group, MF “took the form of a handout providing an explanation of the target structure (articles), which was given to all the students when they had finished writing” (Shintani & Ellis, Reference Shintani and Ellis2013, p. 290). For the control group (n = 15), the three writing tasks were the same except that this group did not receive MF or direct corrective feedback.
To apply the macro–PAA planning for a future MRM study modeled after Shintani and Ellis (Reference Shintani and Ellis2013), we should base our planning on all the between, within, the between-within factors in the design. The largest sample size from these three factor types allows for powerfully (e.g., 80% power) distinguishing between all statistically significant and nonsignificant factor effects (i.e., ηp2) in our future MRM study. Note that due to the ability of MRM designs to detect small effect sizes, we recommend that the minimum size of common ηp2 effect sizes in L2 literature from Figure 7 (i.e., ~.1) be the basis of macro–PAA planning. Our R function, plan.mrm can obtain the PAA sample plan for all factor types at once:
where peta is the population size of ηp2 for a factor in the study, n.rep is number of repeated measurements (here three graded writing tasks), n.group is the number of study groups, and factor.type denotes the factor types used for macro–PAA planning. As usual, the conventional preset conditions are to achieve 80% power at 5% Type I error rate. Under these conditions, the largest sample size is 63 participants for the entire design obtained from the between factor which when divided by three groups leads to 21 participants for each group.
In addition to macro–PAA planning, micro–PAA planning can also be done to plan for statistically powerful pairwise comparisons in MRM designs. Two types of comparisons between and within the groups can be microplanned for an MRM design. As in macro–AESE planning, the largest sample size from these two types of comparisons will determine the group sample size required to achieve statistically powerful tests (i.e., 80% power) in the entire design. For instance, we might want to have power in detecting any possible improvement within the direct feedback group across any two time points (within-groups contrast). Alternatively, we may plan to have power in detecting any possible difference between the direct feedback and the control group at any single time point (between-groups contrast). To microplan for the former, we can consult the meta-analytic results of Kang and Han (Reference Kang and Han2015) that indicate that direct corrective feedback can produce a Cohen’s d of .598. The sample plan can be obtained using the R function plan.mrm as follows:
This plan suggests 29 participants for a powerful comparison of the direct feedback group across any two time points. However, to plan for a powerful comparison between the direct feedback and control groups at a single time point (i.e., n.rep = 1), we can use R function, plan.mrm noting that in the absence of a meta-analytic result for metalinguistic feedback, we may use the median size of Cohen’s d (i.e., .62) in between-groups comparisons (see Figure 4):
For this between-groups PAA planning, we will need 84 participants (42 per group). Thus, the PAA microgroup sample size is 42 participants, and because we have three groups, the entire MRM design modeled after Shintani and Ellis (Reference Shintani and Ellis2013) will require 126 participants. Similar to micro–AESE planning, micro–PAA planning will often result in sample size plans that can be logistically difficult to implement. Thus, in many cases, macro–PAA planning may provide a more feasible sample plan for an MRM design.
CONCLUSION
Second language research is entering a methodological reform era marked by embracement of replication research (Marsden et al., 2018a), registered studies (Marsden et al., 2018b), and novel research methods (e.g., Norouzian et al., Reference Norouzian, De Miranda and Plonsky2018). Implicit in this methodological reform movement is the desire to achieve generalizability with some degree of certainty. While uncertainty cannot be entirely eliminated from the generalization process, it can be managed and planned for a head of time. The practical methods of sample size planning discussed in this article cover a wide range of planning procedures to reduce the uncertainty in the generalizability power of various L2 research designs. It must be noted that, like any other statistical method, sample size planning methods may be most accurate when they are correctly applied to their appropriate contexts. For example, planning for a linear regression study, when the relationships targeted in reality are nonlinear will be of limited practical use. However, it is our hope that through appropriate use of the methods discussed in the present study, we all can improve our understanding of L2 theory and learning development.