INTRODUCTION
The marine molluscan parasites, Perkinsus spp. have been extensively studied because of their association with severe mortalities of commercially important host populations (Villalba et al. 2004). Molecular phylogenetic analyses have indicated a close affinity between Perkinsus spp. and the dinoflagellates (Reece et al. 1997; Siddall et al. 1997; Saldarriaga et al. 2003) and currently 5 species have been described. The most comprehensively studied Perkinsus species is Perkinsus marinus, the causative agent of Dermo disease. Perkinsus marinus has been associated with important mortalities of oyster, Crassostrea virginica, populations along the eastern and Gulf coasts of the United States (Burreson and Ragone Calvo, 1996). Descriptions of P. marinus transmission dynamics have been, for the most part, based on data concerning seasonal infection patterns in wild and naïve sentinel oysters. Prevailing hypotheses maintain that transmission of this parasite is direct from oyster to oyster via waterborne parasite cells that arise from both live and, more importantly, dead oyster hosts (Ray and Mackin, 1954; Bushek et al. 1994; Scanlon, 1997; Bushek, Ford and Chintala, 2002; Ragone Calvo et al. 2003). Controlled laboratory infection challenges have demonstrated infection of oysters to be dose dependent and effected by exposure to any of the 3 identified life-stages – trophozoite, prezoosporangia and zoospore (Mackin, 1962; Andrews, 1988; Perkins, 1988; Volety and Chu, 1994; Chintala, Bushek and Ford, 2002; Ford, Chintala and Bushek, 2002). However, the relative importance of each stage in natural transmission dynamics is unknown.
Not unlike other host-parasite models, environmental factors significantly influence the host-parasite dynamics between P. marinus and C. virginica. Water temperature and salinity are the main environmental factors affecting the transmission dynamics and pathogenicity of the parasite (Ray, 1954b; Mackin, 1956, 1962; Andrews, 1988; Burreson and Ragone Calvo, 1996; Ragone Calvo, Wetzel and Burreson, 2000; Ragone Calvo et al. 2003). Temperature is responsible for the large-scale geographical distribution and for the seasonal cycle of P. marinus while salinity influences P. marinus repartition within an estuary. Within the Chesapeake Bay, minimum prevalence and intensity of infection are observed in early spring, while maximum prevalence and intensity are observed in late summer (Andrews and Hewatt, 1957; Andrews, 1988; Burreson and Ragone Calvo, 1996). During the winter, the parasite typically over-winters in oysters at relatively low infection intensities. During summer and fall, for salinity consistently less than 9 ppt, generally light intensity infections and low mortality are observed. From 9 to 15 ppt, infections may progress to moderate and heavy with low oyster mortality, and above 15 ppt, numerous moderate and heavy infections and high oyster mortality may be observed (Andrews and Hewatt, 1957; Burreson and Ragone Calvo, 1996).
Parasite abundance in the water column and its relation to incidence in oysters was first investigated by Ragone Calvo et al. (2003). In that study, parasite water column abundance was measured using flow cytometric immunodetection methods at 2 moderate salinity sites (Roberson and Dungan, 1993). The major limitation associated with this method was the cross-reactivity of the polyclonal antibodies against dinoflagellates (Bushek, Dungan and Lewitus, 2002) and likely other Perkinsus species, which may have led to an overestimation of the parasite abundance. Nonetheless, results from Ragone Calvo et al. (2003), supported the prevailing model of P. marinus transmission dynamics by which maximum transmission rates are observed during periods of maximum P. marinus-associated host mortality (Andrews, 1988; Burreson and Ragone Calvo, 1996). Ragone Calvo et al. (2003) showed, however, that transmission also occurs in the absence of host mortality, suggesting the involvement of mortality-independent mechanisms such as fecal release (Bushek et al. 1994; Scanlon, 1997; Bushek et al. 2002).
Recent advances in molecular technologies have yielded a suite of extremely sensitive and specific detection tools, now enabling researchers to address topical questions that could be assessed only crudely a decade ago. The development of real-time PCR, a quantitative polymerase-chain-reaction methodology has significantly advanced medical research since its inception in the 1990s (Higuchi et al. 1993; Wittwer et al. 1997). In the field of parasitology, it is currently considered a powerful tool to count genome numbers and to quantify levels of gene expression in parasites (Bell and Ranford-Cartwright, 2002). Application of this technique to the quantification of parasites in the environment (Higgins et al. 2001; Guy et al. 2003) and in the field of ecological parasitology is, however, novel (Monis, Andrews and Saint, 2002). Recently, real-time PCR was developed and optimized for the specific and sensitive quantification of P. marinus in environmental waters (Audemard, Reece and Burreson, 2004). This work included the optimization of the DNA extraction method to minimize the effects of environmental PCR inhibitors (Wilson, 1997) and enhance DNA recovery to obtain more reliable target quantification. The assay was shown to specifically amplify the DNA of P. marinus, but did not amplify the DNA of P. chesapeaki, a conspecific of P. marinus in Chesapeake Bay, or that of several dinoflagellates, which previously cross-reacted with the polyclonal antibodies. Using this assay, less than a single P. marinus cell per reaction could be detected by targeting the ITS region of the rRNA gene complex that is present in multiple copies in the nuclear genome of each Perkinsus sp. cell (Dungan et al. 2002; Brown, Hudson and Reece, 2004; Pecher, Robledo and Vasta, 2004).
In the present study, P. marinus water column abundance was measured by real-time PCR at 2 lower Chesapeake Bay sites in 2002 and in 2003. Concurrently, water temperature and salinity, P. marinus prevalence and intensity in local wild oysters, oyster mortality, and infection acquisition in deployed naïve oysters were determined. The goal of the study was to examine P. marinus transmission dynamics along a salinity gradient in a lower Chesapeake Bay tributary that has historically served as a primary oyster resource habitat.
MATERIALS AND METHODS
Study sites
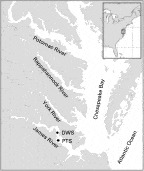
Two sampling sites in the James River estuary (Fig. 1) located in the lower Chesapeake Bay (Virginia, USA) were studied from early May to late October in 2002 and 2003. Both sites were located on natural oyster C. virginica beds, but differed in terms of salinity regime. Deep Water Shoal (DWS) was the uppermost oyster bed site in the James River with recorded average yearly salinity from 1994 to 2001 of 7·7 ppt. Point of Shoals (PTS) was located downstream compared to DWS and considered a moderate salinity site, with average annual salinity from 1994 to 2001 of 10·5 ppt. Typically, salinity at these sites fluctuates 5–10 ppt on either side of the mean during the year with minima occurring in the spring as a consequence of freshets and maxima occurring in the late summer and fall. During this study, salinity and temperature were measured at each site 50 cm above the bottom on a weekly basis.

Fig. 1. Location of the study sites Point of Shoals (PTS) and Deep Water Shoals (DWS) in the James River in the lower Chesapeake Bay (Virginia).
Wild oysters
At the beginning of the experiment on 1 May 2002 and 30 April 2003, wild C. virginica from the local oyster bed were collected by dredge at each site and redeployed on the bed in duplicate mesh oyster trays. In 2002, the average oyster size was 83±13 mm (standard deviation) at PTS and 85±11 mm (standard deviation) at DWS, and in 2003 it was 87±18 mm (standard deviation) at PTS and 98±18 mm (standard deviation) at DWS. Each tray contained 500 oysters in 2002, and approximately 400 oysters (349–424 oysters per tray) in 2003. Fifteen oysters were sampled from each replicate tray approximately every 3–6 weeks and mortality per interval was assessed on the same frequency. Mortality per interval was calculated by first dividing the number of oysters that died during the interval by the number of oysters that were alive at the beginning of the interval for each replicate. This value was multiplied by the proportion of survivors of the previous interval (1−cumulative mortality at last sample date) leading to an adjusted interval mortality. This calculation adjustment was used to demonstrate the proportion of the initial population dying during a particular interval and compensates for population loss through sampling and death. The adjusted interval mortality value was divided by the number of days in the interval and multiplied by 100, giving percentage mortality d−1, and multiplied by 30 to yield percentage mortality per 30 days (or per month).
Oysters were processed for parasite diagnosis using standard Ray's fluid thioglycollate medium (RFTM) assays (using pieces of mantle, gill and rectum tissues) for P. marinus prevalence and infection intensity (Ray, 1952) and paraffin histology for prevalence of the protistan parasite Haplosporidium nelsoni, a serious pathogen of C. virginica in the Chesapeake Bay (Haskin and Andrews, 1988; Ragone Calvo and Burreson, 2003). Intensity of P. marinus infection determined by RFTM was scored as 0, 1, 3 and 5 for negative, light, moderate and heavy infection intensity ranks, respectively. Infections containing only 1–2 hypnospores were recorded as rare intensity for descriptive purposes. Rare infections were categorized as light for the determination of weighted prevalence. Prevalence was calculated simply as the percentage of oysters with parasitic infections. Weighted prevalence was calculated by dividing the average intensity of infection by the total number of sampled oysters. Prevalence of H. nelsoni was determined for all sampling dates with the exception of 1 May 2002.
Naïve oysters
Specific pathogen-free oysters were produced at Harbor Branch Oceanographic Institute (Florida) at the end of 2001 and at the end of 2002. Standard techniques for American oyster production (Creswell, Vaughan and Sturmer, 1991) were followed with slight modifications for producing Dermo-free oyster larvae and juveniles. To prevent enzootic Perkinsus infection of larvae and juveniles, all seawater used in rearing the oysters originated from a salt-water well and was passed sequentially through a sand-filter, charcoal-filter, cartridge filters (1 μm particle retention), and then UV-irradiated prior to use (Hadley et al. 1996; Bushek and Howell, 2000; Ford, Xu and DeBrosse, 2001). Oysters were shipped in March to the Virginia Institute of Marine Science hatchery where they were kept in quarantine conditions (in similarly treated York River water) until their deployment in the field. The first deployment occurred on 6 June in 2002 and on 28 May in 2003. In both years of the study, a total of 5 groups of oysters were successively deployed at each site. The deployments occurred approximately every 4 weeks (3–6 weeks) concurrent with sampling of wild oysters; deployed oysters were left in place for the remainder of the study and sampled monthly. At each deployment, 4 groups of 125 oysters from the hatchery quarantine system were counted and placed in separate plastic meshed bags. Two of the groups were deployed in duplicate cages at PTS and the 2 others were deployed in the same manner at DWS. In 2002, average oyster size before deployment was 14±2 mm (standard deviation) for the first deployment in June and 15±3 mm (standard deviation) for the last deployment at the beginning of October. In 2003, average oyster size was 13±3 mm (standard deviation) for the first deployment and 17±5 mm (standard deviation) for the last deployment in October. The presence of P. marinus was assessed prior to each deployment using PCR. Although a positive result obtained by PCR might not be associated with an infection, this technique was chosen over RFTM for this initial screening because of its greater sensitivity (Robledo et al. 2000). DNA was extracted from a piece of gill and mantle from 30 of the naïve oysters using the DNeasy Tissue Kit from Qiagen™ following the manufacturer's protocol, and DNA concentration for each sample was adjusted to 50 ng/μl. PCR with the primer pair PmarITS specific for P. marinus was done following a previously published protocol (Audemard et al. 2004).
Fifteen oysters from each deployed duplicate group were sampled on the same dates as the wild oysters. Samples of deployed oysters were processed for P. marinus diagnosis as described above using both paraffin histology and RFTM assays (Ray, 1952). Prevalence and intensity of P. marinus infection were reported for each group over the study period. Incidence over each interval was measured from the first sample taken after deployment of each group. For example, incidence over the interval 1 July-29 July was based on the prevalence measured on 29 July in the group deployed on 1 July. The first interval was chosen because we wanted to measure infections that were associated with parasite water column abundance during this interval, rather than those that may have been acquired during earlier intervals, but not detectable by the RFTM technique. Likewise, incidence for the following interval was based on the prevalence observed in the first sample taken from the 29 July deployment. In order to compare incidence between intervals, the incidence over a 30-day period was calculated. The prevalence measured from the first sample after deployment was divided by the actual number of days in the interval and then multiplied by 30 to standardize the measurements and obtain a value for a month.
Environmental water
At each site, duplicate water samples (250–500 ml) and an additional 100 ml sample were collected all within 1–2 m of each other and within 1 m of the deployed oyster trays. The water was collected at 50 cm above the oyster beds as we were interested in parasite release into the water column. The three water samples were collected at each site within a 5 min period. In both years, collection was performed weekly during the day under variable tidal stages from late May to late October. Disposable sampling bottles were used to minimize sample-to-sample contamination. In 2002, the volume of water collected per duplicate sample was 250 ml. The volume collected was increased to 500 ml in 2003 due to the relatively low target values observed in 2002. An additional 100 ml of water was collected at each sampling time and site in order to test for the presence of inhibitors (described below) that have been shown to affect the DNA extraction and/or subsequent PCR amplification (Wilson, 1997; Audemard et al. 2004). After collection, the water samples were immediately placed on ice in a cooler and kept in the dark until further processing in the laboratory within 6–8 h.
In 2002, the effect of environmental inhibitors on P. marinus quantification by real-time PCR was estimated by comparing the quantification values obtained when a known number of P. marinus cells (counts performed as indicated in Audemard et al. 2004) were spiked into weekly PTS and DWS water samples prior to DNA extraction, to those values obtained when the same number of cells in their medium were directly filtered and extracted (baseline control samples). Assuming that the baseline values obtained when cells were directly filtered corresponded to 100% recovery, a relative percentage of recovery when cells were spiked into environmental waters was calculated. Fresh cultured P. marinus cells in their medium were maintained in culture at the Virginia Institute of Marine Science according to the method of La Peyre, Faisal and Burreson (1993). Each week after the water sampling, cultured cells were counted in a Hausser counting chamber and a known number of cells was spiked into PTS and DWS water samples independently to obtain a final concentration on the order of 10000 cells/ml and a final volume of 100 ml. The same number of cells in culture medium was directly deposited on a 3 μm filter. These samples, as well as the 250 ml duplicate samples collected at each site, were filtered onto a 47 mm diameter, 3 μm-pore size, Nucleopore filter using a new disposable filtration apparatus for each sample to prevent carry-over of Perkinsus cells between samples and sites. Filters were folded and immediately placed into microcentrifuge tubes containing 200 μl of Qiagen lysis buffer with proteinase K (Qiagen™, Santa Clarita, CA). DNA was extracted from the filters using the Qiagen DNeasy Tissue Kit (tissue kit) following the manufacturer's protocol, which included a final elution of the DNA from the column using 100 μl of the elution buffer (AE).
In 2003, several modifications were made to the protocols used in 2002 in order to better estimate the impact that environmental inhibitors had on the quantification and to improve DNA recovery from the environmental samples. First, the effect of environmental inhibitors on P. marinus quantification was estimated by comparing the quantification values obtained when a known number of parasite cells were spiked into weekly environmental seawater samples compared to those values determined when the same number of cultured cells were spiked into artificial seawater, where absence of inhibitors was assumed. In this case, 100% recovery was assumed when cells were spiked into artificial seawater, and a relative percentage of recovery was calculated for each of the environmental water samples. This method was more appropriate to specifically estimate the effect of inhibitors on the quantification compared to the method used in 2002, which might have lead to an overestimation of the inhibitors' effects. In 2002, we were measuring not only the effect of inhibitors on DNA recovery, but also the effect of the filtration process as P. marinus cells were directly placed on the filter and not spiked into artificial seawater as in 2003. Prior to the beginning of the sampling in 2003, P. marinus cultured cells were counted and diluted into artificial seawater to obtain a final concentration of 10000 cells per ml. This solution was divided into 5 ml aliquots and immediately placed at −20 °C. To prepare the standard DNA samples each week, 1 aliquot was thawed on ice and subsamples of 1 ml were spiked into 99 ml of PTS, DWS and artificial seawater. The final concentration of cells in the controls was 100 cells per ml of water which, unlike the number of cells used for testing environmental inhibitors in the 2002 protocol, represented a range of values more closely related to the environmental P. marinus abundance. Water samples were filtered as previously described and filters were placed in lysis buffer containing proteinase K. DNA was extracted using the Qiamp stool mini kit (Qiagen™), which was found to more efficiently remove environmental inhibitors than the tissue kit. In addition, total DNA recovery was increased by eluting DNA from the column with three buffer (AE) loadings of 100 μl each and mixing the 3 eluates prior to quantification (Audemard et al. 2004).
The presence or absence of P. marinus in environmental water samples was determined by standard PCR using the primer pair PmarITS specific for P. marinus and targeting the ITS region (Audemard et al. 2004). Reagent concentrations and cycling parameters were as described by Audemard et al. (2004). Products were electrophoresed on 2% agarose (in 1×TBE) gels, stained with ethidium bromide and then visualized using UV light.
The abundance of P. marinus in environmental waters was measured using PmarITS primers in real-time PCR performed on the LightCycler (Wittwer et al. 1997) from Roche Diagnostics, Mannheim, Germany. The comparable sensitivity between standard and real-time PCR using PmarITS primers demonstrated by Audemard et al. (2004), allowed us to run real-time PCR only on samples where the presence of the parasite was demonstrated by standard PCR. Quantification of the amplified product was measured on a cycle-by-cycle basis via the acquisition of a fluorescent signal generated by the binding of the fluorophore SybrGreen I to double stranded DNA. The cycle number Ct (threshold cycle), at which the fluorescence signal crosses a certain threshold (in correlation to the background fluorescence of the assay), was noted. This Ct value is proportional to the logarithm of the target DNA concentration in the assay. From a dilution series of a standard DNA amount corresponding to a known concentration of parasite cells, a standard curve was constructed (Ct versus logarithm of the starting concentration of DNA corresponding to a number of cells). Standard DNAs were obtained as follows. First, a known number of cultured P. marinus cells were spiked into artificial seawater to obtain a final volume of 100 ml, then the DNA was extracted from the cells either with the tissue kit (2002) or the stool kit (2003). The DNAs obtained were 10-fold serially diluted using the elution buffer (AE, Qiagen) and analysed by real-time PCR.
The standard samples for generating the curve, as well as the environmental samples analysed were run in triplicate on the LightCycler instrument and the means and standard deviations were calculated for each. Specificity of the amplified products was confirmed using the melting curve analysis in which the melting temperature (dependent on the fragment length and GC content) of each amplified fragment is determined. The cell concentrations measured from the duplicate un-spiked environmental water samples were corrected based on the percentage of differential recovery efficiency calculated as indicated above. For each weekly sampling, the average cell concentration (cells/l) of the duplicate water samples was calculated, as well as the associated standard deviations. Finally, in order to present P. marinus water column abundance on the same time-scale as the oyster parameters measured and to avoid the distortion of the data due to the more than 3 orders of magnitude variation in the raw data points, the interval averages of the transformed data (as described below) were back-transformed.
Statistical analysis
Prior to the analysis, percentage wild oyster mortality and incidence in deployed oysters were arcsine-transformed, weighted prevalence was log-transformed, and water column parasite cell abundance was square root-transformed. Paired t-tests were performed on the data to determine if there were significant differences (α=0·05) between sites for each year separately. For temperature, salinity and parasite water column abundance, the analysis was performed on the data collected weekly. Significant correlations between parameters measured during this study were investigated using regression analysis. Regression analysis of the mean interval values of temperature, salinity, P. marinus weighted prevalence in wild oysters, wild oyster mortality, incidence in monthly deployed oysters, and water column P. marinus cell abundance were performed. The interval average was calculated for temperature, salinity and abundance and the analysis was performed between these averages and the data measured at the end of the interval (i.e. mortality, prevalence, weighted prevalence). Using these weekly data, regression analyses also were performed with parasite water column as the dependent variable and temperature or salinity as the independent variables. The analysis was performed on 2002 data, but not on 2003 data due to the large number of null values observed in the 2003 data set. For the Y parameter, a lag time of 1 and 2 months was also tested, but results from the 2-month calculations are not presented here due to a consistent absence of significant linear regression. A lag time of 3 months, which was previously analysed in a study by Burreson and Ragone Calvo (1996), was not tested in this study due to insufficient data.
RESULTS
Environmental parameters
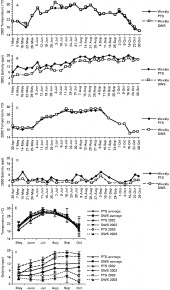
Weekly measurements and monthly mean temperatures and salinities (mean calculated using recorded weekly values) recorded at PTS and DWS in 2002 and 2003 are presented in Fig. 2. The average monthly temperatures and salinities recorded from 1994 to 2001 at those sites are also shown. During the study, the lowest temperature was 16 °C and was recorded in May and October (Fig. 2A and C). In both years, the warmest temperatures (ranging from 26 to 30 °C) were observed in July and August. Mean monthly temperatures (Fig. 2E) indicated that July was the warmest month in 2002 (monthly mean=28·6 °C at PTS and 29·5 °C at DWS), while it was August in 2003 (monthly mean=27·6 °C at PTS and 28·5 °C at DWS). In both years, slightly warmer temperatures were observed at DWS compared to PTS. Using a paired t-test, these differences were significant (P=0·0067 for 2002, P=0·0003 for 2003). The analysis of the monthly average temperatures calculated for each site revealed no significant differences between 2002 and 2003 (P=0·1015 for PTS, P=0·1193 for DWS).

Fig. 2. Environmental parameters. In 2002: (A) Weekly temperatures and (B) weekly salinities at PTS and DWS. In 2003: (C) Weekly temperatures and (D) weekly salinities. (E) Monthly mean temperatures recorded at DWS and PTS in 2002, 2003 and average values from 1994 to 2001. (F) Monthly average salinities at DWS and PTS in 2002, 2003 and average values from 1994 to 2001. Error bars correspond to standard deviations.
Averages salinities in 2002 were significantly higher than in 2003 (P=0·0006 for PTS, P=0·0034 for DWS). (Fig. 2F). Weekly salinities at PTS were significantly higher (P<0·0001) than at DWS in 2002 (Fig. 2B) and in 2003 (Fig. 2D). Compared to the average values recorded over the 1994–2001 period, 2002 salinities at both sites were at least 6 ppt higher in August, September and October (Fig. 2F). PTS salinity in 2002 ranged from 10 ppt in May to 19 ppt in September (Fig. 2B). At DWS, salinity ranged from 6 ppt in May to 17 ppt in September. The 2003 sampling period, on the other hand, was characterized by very low salinity; at least 7 ppt lower than average in October for both sites (Fig. 2D). At PTS, mean monthly salinities ranged from 5 ppt in June to 8 ppt in September (Fig. 2F). At DWS, they ranged from 1 ppt in October to 5 ppt in September. Observed standard deviations for monthly means were relatively high at both sites as a consequence of variable amounts of precipitation affecting the James River streamflow during the study period.
Perkinsus marinus parasite prevalence and weighted prevalence in wild oysters
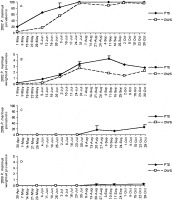
Wild oyster weighted prevalences (P=0·0082) and prevalences (P=0·0007) were significantly different between sites in 2002. Perkinsus marinus prevalence at PTS ranged from 20% in early May to 100% from the end of July through the end of October (Fig. 3A). Weighted prevalence progressed from less than 0·5 (rare infection intensity) in early May to over 4·0 (heavy) by the beginning of September, then decreased through the end of October to slightly less than 3·0 (Fig. 3B). At DWS, prevalence was 4% in early May and reached 90% from the end of July through October (Fig. 3A). Weighted prevalence at DWS, increased from less than 0·5 (rare) in May to almost 3·0 (moderate) at the end of July (Fig. 3B). Weighted prevalence decreased slightly in September but remained between 1·5 and 2·5 until the end of October.

Fig. 3. Perkinsus marinus prevalence and weighted prevalence in wild oysters. In 2002: (A) prevalence, and (B) weighted prevalence. In 2003: (C) prevalence and (D) weighted prevalence. Error bars correspond to standard deviations. Data presented are values prior to transformation. Errors bars are absent when oysters from the two replicate trays were pooled (1 May and 6 June 2002), and when one of the wild oyster replicate trays was lost in the field (after 9 September for DWS and after 1 October 2002 for PTS).
In 2003, all the wild oysters from DWS used in this experiment were dead by the 24 July sampling date. At this site, P. marinus was never detected from the earlier samples. At PTS, the parasite was detected from 21 August to the end of October; however, prevalence remained low with a maximum value of 26% in October (Fig. 3C) and weighted prevalence (Fig. 3D) remained below 0·5 (rare infection intensity).
Haplosporidium nelsoni parasite prevalence in wild oyster
Historically, MSX disease had never been detected at DWS, however, in October 2002, H. nelsoni was observed for the first time at this site with 6% of animals infected in October (Ragone Calvo and Burreson, 2003). During the same year, prevalence of H. nelsoni at PTS increased from 14% in early June to 40% at the end of July (Fig. 4). The 1 May 2002 PTS sample was not analysed for MSX. Prevalence decreased after July of that year, but remained higher than 20% until the end of October. In 2003, however, H. nelsoni was not detected at either site.

Fig. 4. Haplosporidium nelsoni prevalence in wild oysters in 2002. Means and standard deviations are given.
Wild oyster mortality
In 2002, wild oyster mortality was significantly higher at PTS than at DWS (P<0·0001). The mortality rate at PTS remained lower than 15% until the end of July, and reached its highest value (26%) over the interval between 29 July and 9 September (Fig. 5A). Wild oyster mortality rate at DWS was highest (16%) during the same interval. Unlike 2002, mortality at DWS in 2003 was higher than at PTS. In 2003 wild oysters at DWS experienced very high mortality and by 24 July all the wild oysters used in this experiment were dead, while PTS mortality rates never exceeded 10% (Fig. 5B). A paired t-test could not be applied to these data due to the limited data obtained at DWS.

Fig. 5. Monthly mortality rates of wild oysters. (A) Mean mortality rate in 2002. (B) Mean mortality rate in 2003. Error bars correspond to standard deviations. Data presented are values prior to transformation.
Naïve oyster P. marinus parasite incidence
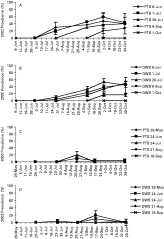
In 2002, P. marinus was detected by PCR 3–7% of the putatively naïve oysters prior to their deployment in the field on 1 July, 29 July and 1 October. No detection of the parasite prior to deployment was observed in 2003. In 2002 after deployment at both sites (earliest deployment on June 6), RFTM revealed that P. marinus infections were only acquired during the period between 1 July and 1 October (Fig. 6A and B). Overall, an increase in prevalence with similar slopes was observed in the different oyster groups after deployment until early October, while during October prevalence did not seem to follow any trend suggesting a shift in prevalence dynamics at this time. Oyster groups either showed an increasing, a decreasing or a stable prevalence in October compared to the previous month. Generally, infection intensities increased with the time exposed in the field, but remained mostly light to moderate. Incidence ranged between 21 and 22% for the intervals 1 July–29 July, 29 July–9 September and 9 September–1 October. During the same time-intervals, incidence increased from 2 to 14% at DWS, however, incidence at DWS was not significantly different than at PTS (P=0·1443).

Fig. 6. Perkinsus marinus infection acquisition in the deployed oysters groups. Mean prevalence at each sampling date in the oysters deployed (date of deployment indicated in the legend): (A) prevalence at PTS in 2002; (B) prevalence at DWS in 2002; (C) prevalence at PTS in 2003; (D) prevalence at DWS in 2003. Error bars correspond to standard deviations. Data presented are values prior to transformation.
In 2003, P. marinus infection (21%) was only acquired at PTS between 24 July and 21 August (Fig. 6C). At DWS infection was acquired during two exposure periods (Fig. 6D); 24 June–24 July (4%) and 21 August–15 September (10%). No significant differences (P=0·9460) were observed between sites. Infection intensities remained light with fewer than 2 cells detected per oyster as determined by RFTM. The dynamics of the prevalence of individual groups of oysters deployed in 2003 did not increase with time as observed in 2002. Prevalences remained low, with the highest values recorded on 21 August at PTS (21%) and on 15 September at DWS (10%).
Ambient P. marinus abundance in water samples
In 2002, the average differential percentage recovery efficiency over the whole sampling period was estimated at 42±31% (standard deviation) for PTS waters and 45±34% (standard deviation) for DWS waters. High standard deviations revealed the high variability in recovery from week to week and confirmed the necessity for correcting the parasite abundance measured by real-time PCR. Perkinsus marinus was detected by standard PCR at PTS and DWS from 29 May onwards. The abundance of the parasite could not, however, be quantified with confidence prior to 26 June for PTS samples and 10 July for DWS samples because non-specific amplification was observed, presumably due to low abundance of the targeted DNA (Fig. 7A). In these conditions, even if the target was detected by real-time PCR, abundance of the parasite was considered to be below the quantifiable detection limit of the technique, which was previously determined to be the DNA amount equivalent to 3·3×10−2 cells in a 10 μl reaction (Audemard et al. 2004). Weekly measurements of P. marinus water column abundance were highest (up to 1200 cells/l) in July, August and October (Fig. 7A). Weekly abundance of the parasite at PTS was generally higher than at DWS, but differences were not statistically significant (P=0·2278). High standard deviations observed on weekly measurements reflected variability in abundance measured from the duplicate water samples. Average abundance values per interval (between two oyster samplings) were the highest for both sites (743 cells/l at PTS and 525 cells/l at DWS) during the period between 29 July and 9 September (Fig. 7B).

Fig. 7. Perkinsus marinus abundance in the water column in 2002. (A) Weekly average parasite abundance. (B) Interval average parasite abundance. Error bars correspond to standard deviations. Averages correspond to back-transformations of the averaged transformed data.
In 2003, the optimization of the protocols and alterations to the DNA extraction method, improved recovery of P. marinus cell DNA from environmental waters. The average differential percentage recovery efficiency over the entire sampling period was estimated at 81±26% (standard deviation) with PTS waters and 85±21% (standard deviation) with DWS waters. As indicated by Audemard et al. (2004), DNA recovery and amplification from environmental samples was improved in 2003 compared to 2002 by using the stool kit, which is more efficient than the tissue kit at removing environmental inhibitors. The parasite was only detected on 16 July at PTS, and on 13 August at both sites by standard PCR. Abundance was determined by real-time PCR to be 900±180 cells/l on 16 July. Abundance on 13 August at both sites was below real-time PCR quantification limits.
Parameter relationship analysis
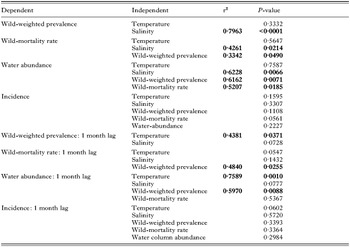
Due to the paucity of infections in 2003, regression analysis was performed only on the 2002 data (Table 1). The analysis of the monthly data demonstrated significant correlation between the following dependent and independent variables: weighted prevalence and salinity (r2=0·7963); mortality and salinity (r2=0·4261); mortality and weighted prevalence (r2=0·3342); water column abundance and salinity (r2=0·6228); water column abundance and weighted prevalence (r2=0·6162); and water column abundance and mortality rate (r2=0·5207). When dependent variable data were lagged by 1 month significant associations were also found between weighted prevalence and temperature (r2=0·4381), and between water column abundance and temperature (r2=0·7589); and the strength of the association between mortality and weighted prevalence increased from r2=0·3342 to r2=0·4840. Incidence was not significantly related to any of the measured parameters. Analysis of the weekly parasite water column abundance values as the dependent variable and weekly temperatures or salinities as the independent variables, indicated only weak associations (r2<0·20).
Table 1. Regression analysis of the data measured in 2002, regardless of site (Values used are monthly for all the parameters. Coefficient of determination (r2) shown only for significant linear regression results (P<0·05) in bold.)

DISCUSSION
Many studies have focused on the importance of environmental factors in maintaining host-parasite equilibria. Gaining an understanding of the complex interactions between host parasites and their environments is often a great challenge. In the present study, a novel molecular technique, real-time PCR, was successfully employed to quantify environmental abundances of the oyster parasite, P. marinus. The relationships between environmental parasite abundance, host-parasite dynamics including infection acquisition, infection progression, and associated host death and environmental factors (temperature and salinity) were systematically examined.
The study sites, DWS and PTS, are non-contiguous oyster beds located in the upper James River, VA. The James River is a major tributary of the lower Chesapeake Bay and may be characterized as a large, high flow river, which typically experiences high discharges in the winter and spring of the year. Annual climatic variation can significantly alter the salinity regime in the upper tributary. High precipitation can result in fresh water conditions persisting for periods of weeks, while extremely dry conditions can result in the domination of moderate salinities. During the 2 years of this study both conditions occurred. The year 2002 was dry with streamflows below average and relatively higher than average temperatures (Ragone Calvo and Burreson, 2003), while 2003 was extremely wet (wettest year of the last 114 years) and cool (Carnegie, Ragone Calvo and Burreson, 2004). In both years, however, salinities were higher at PTS (downstream site) compared to DWS (upstream site). The diverse conditions resulted in very different disease dynamics between study years with significantly higher P. marinus abundances and prevalences observed at both sites in 2002 than in 2003, demonstrating the important role of salinity and temperature in controlling the parasite. The higher streamflows in 2003 also may have favoured the dilution of parasite cells and affected the parasite infection as was postulated earlier (Ray, 1954b; Mackin, 1956; Andrews and Hewatt, 1957; Andrews, 1988).
In 2003, even in the absence of parasite detection in the wild oysters at DWS, extremely high mortality rates were observed in this group both in June and July. Based on previous observations (Andrews, Haven and Quayle, 1959), these high mortalities were likely the result of a combination of persistent low salinity conditions (between 1 and 5 ppt) and high temperature (between 28 and 31 °C); a combination of environmental conditions that are known to stress oysters. During the same year, salinity at PTS was generally at least 2 ppt higher than at DWS, which appeared to be high enough to allow the oysters to survive, but also for P. marinus to be present in wild oysters. Prevalence and intensity of infection at PTS remained nevertheless very low and, as a consequence, mortality rates also remained low. Surprisingly, a few parasite cells were detected in the naïve oysters, as well as in the water, at both sites in 2003. This indicated the presence of the parasite in the environment, but in vivo multiplication of the parasite may have been hindered by low salinity. Haplosporidium nelsoni is generally found in oysters where salinity is higher than 15 ppt, which probably explains why it was never detected in the oysters in 2003.
Although this study did not encompass the late winter/early spring months, the seasonality of Dermo disease was demonstrated in 2002 by the concomitant increases in parasite prevalence in oysters, in oyster mortality, in parasite abundance in the water column, and in infection acquisition, with increasing temperature. By early May 2002, temperatures were between 18 and 21 °C, which likely favoured the internal proliferation of overwintering P. marinus cells (Andrews, 1988; Ragone Calvo and Burreson, 1994). During this period, increase in salinity also may have promoted parasite proliferation. This resulted in higher parasite prevalence and weighted prevalence values with several infections becoming heavy enough to be detected by RFTM. These increases were very unlikely to be due to new infections since infection acquisition in naïve oysters was observed only after July. The regression analysis indicated a positive relation between wild oyster weighted prevalence and temperature, but the response in weighted prevalence lags 1 month behind temperature values. The absence of a direct relationship (without a time lag) between weighted prevalence and temperature has been previously observed (Andrews and Hewatt, 1957; Andrews, 1988; Soniat and Gauthier, 1989; Burreson and Ragone Calvo, 1996) and may reflect the time required for the parasite to multiply within the oyster in response to changing environmental conditions such as a temperature increase. In the autumn, decreasing temperatures could be responsible for the decrease in parasite prevalence in the groups of oysters deployed on both sites, and the decrease in weighted prevalence of the wild oysters. Prevalence of P. marinus in the wild oysters did not, however, decrease probably because their intensity of infection was much higher than in the deployed oysters. Consequently, a longer period of time under low temperature conditions might be necessary to observe an effect on the prevalence in wild oysters. Burreson and Ragone Calvo (1996) observed a significant correlation between prevalence and intensity and temperature when a lag of 2–4 months was tested. The differences with our study may be related to the seasons analysed; in our study we considered only the summer months whereas Burreson and Ragone Calvo (1996) considered the entire year. In addition, they analysed data from a total of 5 years, a much larger data set than in the present study.
As indicated above, the regression analysis of the 2002 data supported the central role played by salinity and temperature in controlling the dynamics of P. marinus in the wild oysters. The regression analysis also indicated that increasing parasite weighted prevalence in wild oysters was likely responsible for at least some of the observed mortality among the wild oysters with a more pronounced effect observed after a month lag period than without a lag. The increases in parasite weighted prevalence and mortality in wild oysters most likely induced an increased abundance of the parasite in the water column. The positive correlation between host mortality and parasite water column abundance was expected based on earlier studies that suggested that death of infected hosts was the main source of parasite release (Andrews and Hewatt, 1957; Mackin, 1962; Andrews, 1988; Ragone Calvo et al. 2003). The strength of this relationship was relatively high (r2=0·5207), but was lower than between parasite water column abundance and weighted prevalence (r2=0·6162). This seems to indicate that although mortality of infected oysters might be a major source of parasite release, other sources may also be involved in the absence of host mortality. Release of the parasite with the feces may be a major source of parasites since oysters with moderate to heavy infections have been shown to shed hundreds to thousands of viable P. marinus cells in their feces daily (Scanlon, 1997; Bushek et al. 1994, 2002).
Infection acquisition during this study was limited to a 3-month period (July, August and September) during which high wild oyster weighted prevalence, high mortality rates and peaks of parasite water column abundance were observed. Incidence, however, was not significantly correlated with any measured parameters using regression analysis. The absence of a significant correlation between incidence in naïve deployed oysters and other measured parameters has been observed previously. In the study of Ragone Calvo et al. (2003), incidence was related only to mortality and for only 1 of 2 years studied. Although in vitro studies showed that the rate of infection was proportional to the dose of P. marinus cells inoculated in the laboratory (Bushek et al. 1994; Chu and Volety, 1997), studies conducted in the natural environment failed to demonstrate a significant linear relationship between the parasite water column abundance and incidence (Ragone Calvo et al. 2003; this study). The present study design might have not been optimal to reveal such significant correlations. Differences in sensitivity of the methods used to quantify the parasite in the water (real-time PCR) and within the oysters (RFTM) might have hindered the detection of a significant correlation between the two parameters (see Robledo et al. (2000) for comparison of PCR and RFTM). In the case of parasite water column abundance, the point sampling might not be appropriate to reveal the actual abundance of P. marinus over a time interval. Alternatively, in nature the relationship between infection acquisition and parasite water abundance might not be linear. As postulated by Ragone Calvo et al. (2000), a single transmission event may be sufficient for P. marinus to become enzootic in moderate or high salinity areas. Infection acquisition could also be controlled by an even more complex set of parameters than those measured in this study, or by a combination of parameters. Parasite water column abundance could be a primary factor modulating infection acquisition. Absence of infection acquisition prior to 1 July coincided with parasite abundance under 10 cells/l for most of the samples. This observation seems to support the hypothesis that there is a threshold inoculum of infective cells necessary to infect oysters (Soniat and Gauthier, 1989; Chu and Volety, 1997). In October 2002, on the other hand, absence of infection acquisition was noticed while abundance of the parasite in the water was on average higher than 200 cells/l. In this case, the main limiting factor could have been temperature. Compared to the previous warmer months, temperatures values in October decreased to as low as 15 °C, potentially slowing parasite proliferation within the oyster (Andrews and Hewatt, 1957; Chu and La Peyre, 1993) and/or decreasing oyster susceptibility (Ford et al. 2002). Another possible explanation for the absence of infection in October is that the DNA detected by real-time PCR is from non-infective or non-viable parasite cells. It seems, however, that the environmental conditions in October (temperatures between 15 and 20 °C and salinity between 15 and 20 ppt) remained in the ranges where the parasite has been shown to survive and still be infective (Chu & La Peyre, 1993; Ragone Calvo & Burreson, 1993). The age or size of the naïve oysters deployed in the field also could have modulated the infection acquisition of P. marinus. Deployed oysters were about 1 year old, an age (size), which has been shown to have lower acquisition rates of P. marinus than older (larger) oysters (Ray, 1954a; Andrews and Hewatt, 1957; Burreson and Ragone Calvo, 1996). Andrews and Hewatt (1957) noted, however, that infection of small oysters is still possible (as it was observed in this study) when the parasite dose is high. In some cases, P. marinus DNA was detected by PCR in the pre-deployment sample. If these were actual infections and not surface-contaminating cells or DNA, then the outcome of the analysis may have been affected. The measured water column parasite abundance may have failed to reveal the actual parasite water column abundance dynamics due to potentially high temporal and spatial variability in parasite abundance. More studies will be needed to investigate the parasite water column abundance on a daily basis and during different tide stages. On a spatial scale, future investigations are needed to assess parasite water column abundance at different levels in the water column, within the sediment, and at increasing distances from oyster beds.
Perkinsus marinus was detected in the water column using real-time PCR from late May 2002 to the final sampling date in late October 2002 and its highest abundance was observed at PTS with 1200 cells/l on 28 August 2002. Using flow cytometry immunodetection, Ragone Calvo et al. (2003) observed peaks of P. marinus abundance 4–10 times higher (5000 up to 11900 cells/l) than in our study and detected the parasite throughout the year. These differences could be related to one or several the following: an overestimation of the parasite abundance due to cross-reactivity with other organisms of the polyclonal antibody tag used in flow cytometric detection as mentioned earlier; a lower sensitivity of the real-time PCR compared to flow cytometric immunodetection; or environmental site and/or temporal differences. The two methods currently available for quantifying P. marinus in the water column, real-time PCR assay and flow cytometric immunodetection, have not been compared side by side, but their sensitivities seem to be within an order of magnitude. Flow cytometric immunodetection allowed the detection of a minimum of 10 cells/l (Ragone Calvo et al. 2003), which is comparable to the detection limit of our assay (~90 cells/l or 3·3×10−2 cells/PCR) (Audemard et al. 2004). As observed during the present study, parasite abundance in the water column can vary with site (PTS versus DWS). The site studied by Ragone Calvo et al. (2003) was located in the lower York River, a lower tributary of Chesapeake Bay. Compared to the York River site, the upper James River sites present average lower salinities and higher water flows. As has been shown in previous field and laboratory studies, higher salinity can favour P. marinus infection (Ray, 1954b; Mackin, 1956; Andrews and Hewatt, 1957; Soniat and Gauthier, 1989; Chu and La Peyre, 1993; Ragone Calvo & Burreson, 1993; Burreson & Ragone Calvo, 1996), and therefore, could favour higher parasite water abundance. The higher water flow in the James River could favour the dilution of infective parasite cells, induce lower parasite counts and affect the parasite infection as has been postulated earlier (Ray, 1954b; Mackin, 1956; Andrews and Hewatt, 1957; Andrews, 1988).
Real-time PCR allows the detection of infective and non-infective cells, live and dead cells and consequently it might not give absolute viable parasite abundance values (Audemard et al. 2004). However, the results obtained in this study were in accordance with earlier hypotheses concerning P. marinus transmission dynamics, demonstrating the applicability of this technique for parasite transmission dynamics studies. For application of real-time PCR to environmental samples, we determined that reliable quantification depended on optimizing the DNA extraction method and on taking into account inhibition for accurate abundance calculations. In our case, this was achieved by choosing the stool kit (more than 80% DNA recovery demonstrated in this study) versus the tissue kit and by estimating the percentage of DNA recovery for each sample. Once assay parameters are optimized, real-time PCR is a powerful tool for investigating the abundance of free stages of protistan parasites in the environment.
We would like to thank John Scarpa from Harbor Branch Oceanographic Institute (Florida) for providing oysters, Rita Crockett for analysing histology samples, Susan Denny, Martin Wunderly, Paul Oliver, Bob Gammisch and his team and Tim Koles for their field assistance. This research was funded in part by the NOAA Sea Grant Oyster Disease Research Program grant number NA16RG2207. VIMS contribution number 2715.