Clays are among the most critical raw materials in the ceramic industry. They find many applications in textiles, dyes, food, paper, porcelain, cement, brick tiles, refractories, fillers, petroleum and advanced ceramics. Depending on their formation, type and mineralogical composition, clays can be used in various formulations within industry. With production levels increasing to meet global demand, the need for energy and raw materials has significantly risen. Additionally, recent pandemic conditions have disrupted global economic balances. Furthermore, the Russia–Ukraine war has created a growing global crisis, leading to substantial disruptions in the supply chain for energy and raw materials. Ukrainian clay is vital for the ceramic sector, and the resulting shortage has notably impacted the global ceramic industry. Some regions in Türkiye use local clays as alternatives to Ukrainian clays (Murray, Reference Murray1991, Reference Murray1999; Pereira et al., Reference Pereira, Bašić, Bogunovic and Barcelo2022).
The demand for alternative clay sources in other countries has prompted domestic producers to seek new raw material options. Issues such as exploring new clay reserves, evaluating existing clay sources and improving clay resources have become essential. Recently, adverse events such as global warming, the COVID-19 pandemic, climate change and the Russia–Ukraine war have significantly affected various countries’ economies. As the world’s population grows, the challenges of meeting the rising demand for all types of resources have become increasingly significant. As the availability of raw materials decreases due to increasing demand, companies need assistance with production. The raw material crisis affecting nearly every sector has prompted companies to focus on finding new and improved sources. Domestic producers in the ceramics industry face significant supply challenges due to the dwindling availability of essential materials. Consequently, companies in this sector have started prioritizing research and development studies and investments (Kacar, Reference Kacar2023; Castellano et al., Reference Castellano, Sanz, Cañas, Kayacı, Taşkıran, Ş.C and Sánchez2024; Fernández-Miguel et al., Reference Fernández-Miguel, Zucchella, Riccardi, Settembre-Blundo, García-Muiña, Fernández del Hoyo, Lagioia, Paiano, Amicarelli, Gallucci and Ingrao2024).
This study aims to determine whether celadonitic clays formed from basalt alteration near Yazlıca village in the Kütahya region of Türkiye can be used as raw ceramic materials. This will be accomplished through characterization based on geology, mineralogy and ceramic properties. Kütahya is one of the most important cities in Türkiye for the ceramics industry; therefore, substantial quantities of raw materials are essential for producing ceramic products.
Celadonite is a colourant occurring in rocks, soils and other minerals and is classified as a green earth pigment. Authigenic green clays exhibit a broad compositional spectrum, including potassic green clay with a mica-like structure (e.g. celadonite and glauconite), ferric illite, verdine facies ferrous green clay (e.g. odinite, berthierine and chamosite), greenalite and ferric potassic smectite (e.g. nontronite; Singh et al., Reference Singh, Banerjee, Choudhury, Bhattacharya and Pande2023).
Although several previous studies (Hendricks & Ross, Reference Hendricks and Ross1941; Kimbara & Shimoda, Reference Kimbara and Shimoda1973; Harder, Reference Harder1976; Bailey et al., Reference Bailey, Brindley, Kodama and Martin1979; Coey, Reference Coey1980; Heller-Kallai & Rozenson, Reference Heller-Kallai and Rozenson1981; Pemberton, Reference Pemberton1983; Odom, Reference Odom1984; Daynyak & Drits, Reference Daynyak and Drits1987; Varentsov et al., Reference Varentsov, Grasselly and Szabo1988; Reid et al., Reference Reid, Graham, Edinger, Bowen and Ervin1988) have been conducted to identify celadonitic clays, no publications exist regarding their use in the ceramic industry. This study is the first of its kind in this field. This study is exciting because celadonite is a green mineral from the silicate mica group. It typically forms in dull clay masses or as tiny, scaly crystals within a monoclinic crystal system. The alteration of iron-bearing minerals contributes to its formation. Ernst Friedrich Glocker first described celadonite in 1847. It was named after the French word céladon, meaning ‘sea green’. Dódony (1986) described a green clay mineral identified as hydromica with a 1M structure. This mineral is known to have both two-layered and three-layered polytypes. By using one-dimensional electron-density calculations to determine its chemical composition, Dódony provided the formula K0.725(Al1.275Mg0.725)(Si4O10)(OH)4 and named the mineral alumino-celadonite (Weiszburg et al., Reference Weiszburg, Nagy, Toth, Mızak, Varga, Lovas and Vaczi2004).
Geological setting
Türkiye is divided into four central tectonic units: Anatolides, Taurides, Pontides and the Arabian autochthon, each shaped by different plate movements (Şengör, Reference A.M.C1979, Reference A.M.C1980; Şengör & Yılmaz, Reference Şengör and Yılmaz1981). Western Anatolia, including the Yazlıca region of Kütahya, consists of various tectonic units and features a complex stratigraphy dating back to the Late Cenozoic era. The Alpine orogeny has significantly shaped Western Anatolia, both stratigraphically and metamorphically, and Western Anatolia is situated west of the Alpine–Himalayan mountain range. The convergence of different continental blocks due to compression has dramatically contributed to the formation of Western Anatolia. The basement rocks consist of schists that are conformable to the marble units. The ophiolitic rocks, including greenstones and blueschists, show evidence of various processes related to the closure of the northern portion of Neotethys, specifically the İzmir-Ankara Ocean. These rocks indicate tectonic sutures (Özburan, Reference Özburan2009).
In the study area, the Tavşanlı zone of Upper Cretaceous age is the basement rock characterized by an ophiolitic mélange, mainly serpentinites and peridotites (Kalafatçıoğlu, Reference Kalafatçıoğlu1962; Okay, Reference Okay1981; Özburan, Reference Özburan2009). The Kızılkaya volcanites of Lower Miocene age occur on top of the basement rocks and consist of heavily altered andesites, trachiandesites, basaltic andesites and basalts. The presence of hot springs in the Ilıca region indicates hydrothermal alteration. The Lower-Middle Miocene Tunçbilek Formation overlies the Kızılkaya volcanites and is described as a volcano-sedimentary stack containing sandstone, claystone, tuff and argillaceous limestone (Akdeniz & Konak, Reference Akdeniz and Konak1979).
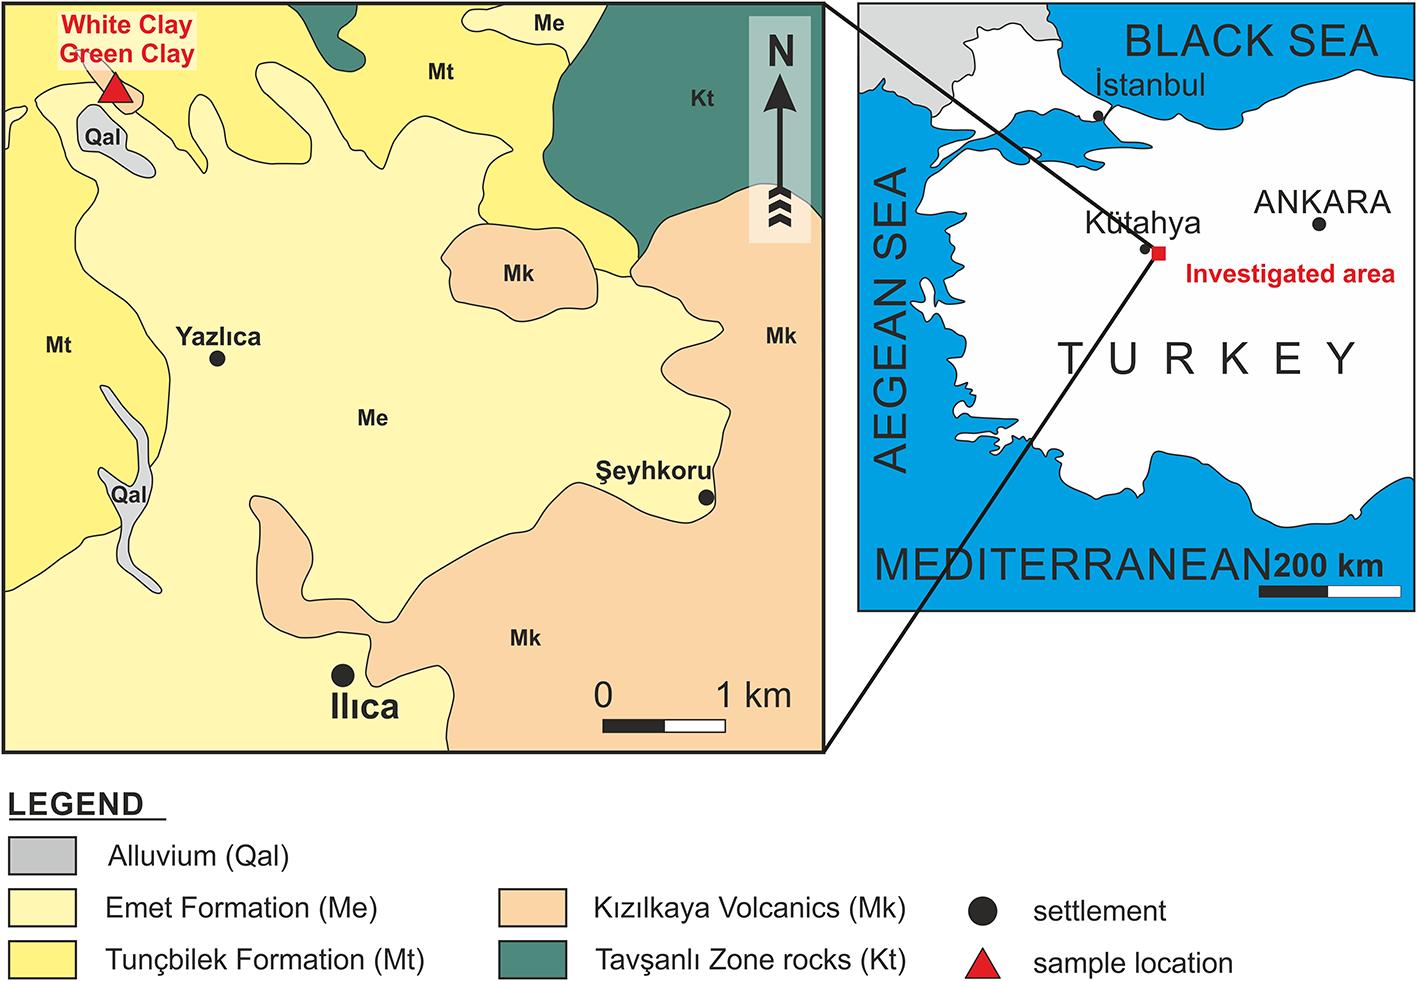
The Middle to Upper Miocene Emet Formation comprises clay, marl, silicified limestone and mudstone and is overlain by the Tunçbilek Formation. These formations are overlain by sediments of Quaternary age. In this area, clay formations resulting from the weathering of basaltic rocks belonging to the Kızılkaya Volcanics, located between the villages of Yazlıca, Hamidiye and Kızılcaören, were observed 2 km from Yazlıca village (Fig. 1; Kaçar, Reference Kacar2023).
Location and simplified geological map of the Yazlıca celadonitic clay deposit (modified from Kaçar, Reference Kacar2023).

Materials and methods
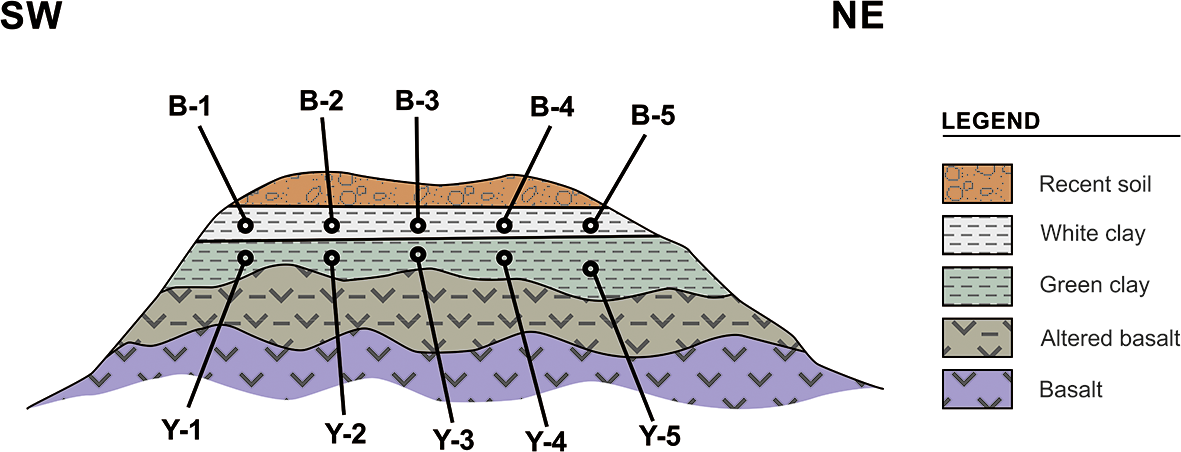
The celadonitic clays found in the Yazlıca (Kütahya) region, which are intended for use as ceramic raw materials, are located within the weathering zone of the Kızılkaya volcanic rocks. These clays, situated in the north-western part of the study area, have been classified into two groups based on their macroscopic characteristics observed in the open trench and field: white clays and green clays. To establish the geological properties of each colour level and to assess their ceramic properties, 10 clay samples were collected from five different points for each colour level. The clay samples were coded from horizontal and near-horizontal clay bands at 10 m intervals in the lateral direction. The white-coloured clay samples were labelled B-1 to B-5, and the green-coloured samples were labelled Y-1 to Y-5. These colour levels are organized in the field, with a white level on the top and a green level on the bottom. Sample locations are shown in Figures 1 & 2.
Schematic geological cross-section illustrating the locations of the clay samples collected from the study area (not to scale).

The study included petrographic and mineralogical analyses of clay samples collected from the investigated area. The analyses were carried out using optical microscopy (OM), X-ray diffraction (XRD), differential scanning calorimetry (DSC), Fourier-transform infrared (FTIR) spectrophotometry, chemical analysis and scanning electron microscopy (SEM).
The XRD analysis was conducted with a high-resolution X-ray diffractometer (Malvern-PANalytical/Empyrean instrument; İLTEM-Kütahya Dumlupınar University, Türkiye), using Cu-Kα radiation with a Ni-β filter, operated at 45 kV and 40 mA. The scanning range was set from 2° to 70°2θ with a step size of 0.026°, and the sample stage was of a reflection–transmission spinner type that operated in transmission mode.
Mineralogical studies were carried out on both the bulk samples and the clay fraction, and the precipitation method was used to obtain the clay fraction (<2 μm in size). The samples were sonically disaggregated in distilled water to separate the clay fraction with an Elma Sonifier for ∼15 s. Afterwards, the samples were cleaned and concentrated using a Hettich Universal 320 centrifuge at 5000–6000 RPM for 6 min. A small amount of sodium pyrophosphate was added to the clay/water solution as a dispersing agent (Moore & Reynolds, Reference Moore and Reynolds1997). The <2 µm size fraction was then siphoned off and concentrated by centrifugation for 1 h at 6000 RPM. X-ray powder diffraction (XRPD) was used for mineralogical analysis on air-dried (AD), ethylene glycolated (EG) and heat-treated (HT; 350°C and 550°C for 1 h) orientated slide samples.
Additionally, the white and green clay samples were examined by XRD after firing at 850°C, 900°C and 950°C to aid in DSC interpretations. The representative white and green clays mentioned here are mixtures of samples taken to fully represent the clay level. White clay (B) refers to the mixture of samples B-1 to B-5 according to the quartering method, whereas green clay (Y) refers to the mixture of sampled Y-1 to Y-5 using the same process.
Qualitative and quantitative mineralogical analyses (the Rietveld method) of the raw and fired clay samples were performed using HighScore Plus V.4.9 (Malvern-PANalytical) software (Degen et al., Reference Degen, Sadki, Bron, König and Nénert2014), with reference to the Inorganic Crystal Structure Database (ICSD) and the Crystallography Open Database (COD).
Chemical analyses were carried out at İLTEM-Kütahya Dumlupınar University. Bulk rock chemical analyses were performed using wavelength-dispersive X-ray fluorescence (WD-XRF) spectrometry with a Malvern-PANalytical/Axios instrument. Following sample preparation using a fusion technique with a PANalytical/Eagon 2 device, fusion was achieved by dissolving the sample with a fluxing agent in a Pt crucible at 1050°C.
Thin sections for petrographic studies were prepared from rock samples collected from Gevrekseydi volcanic rocks, where the clay formations were detected. Petrographic investigation of the rock samples was performed with a Nikon Eclipse LV100 Pol optical microscope at the Geological Engineering Department Optical Mineralogy Laboratory, Dumlupınar University, Kütahya. DSC and thermogravimetric (TG) analyses of the clay samples were performed by heating samples from ambient temperature up to 1000°C with a ramp of 10°C min–1 using a Setaram-labs Evo analyser (İLTEM-Kütahya Dumlupınar University). Some 40 mg of powdered clay samples were used for the analysis. Finally, FTIR spectroscopy analyses were conducted at İLTEM-Kütahya Dumlupınar University with a Bruker-Alpha FTIR spectrometer. The SEM study was performed using an FEI Nova Nano 650 scanning electron microscope with an energy-dispersive X-ray spectrometer (SEM-EDS) at İLTEM-Kütahya Dumlupınar University.
White (B-1 to B-5) and green (Y-1 to Y-5) clay samples were prepared as bar shapes to determine the ceramic properties. These bars were fired in a roller kiln at 1150°C for 120 min under standard operating conditions. The mechanical strength (EN 518), water absorption (ASTM C67), drying shrinkage and firing shrinkage (ASTM C326) were the main basic ceramic properties of the clay samples determined. Total shrinkage (100 × (L G – L T)/L G) was determined by considering L G and L T as the lengths of the green and fired bars, respectively. Additionally, 1%, 3%, 5% and 7% green clay samples were incorporated into the existing formulation of Keramika Ceramics Company, and the effects on the factory recipe were assessed. Simultaneously, to create artistic glaze effects, 5%, 10%, 15% and 20% green clays were added to the opaque, transparent and matte glaze recipes currently used in the factory, and the potential of these clays as glaze pigments was examined.
Results and discussion
Mineralogy–petrography and chemistry of the clay samples
The Kızılkaya volcanic rocks, the primary source of the clay formations identified in the study area, are widely distributed in and around Kızılkaya Hill. This unit consists of basaltic trachyandesite, basaltic andesite and trachyandesite, showing steep topography. Macroscopically, these rocks appear grey, black and pink, displaying brown, beige and greenish colours on weathered surfaces. The cleavage surfaces typically exhibit a cracked structure with lines moving towards the upper parts, filled with calcite. The weathered basement materials are reddish-brown and fine-grained. They are nearly non-plastic when wet, they harden as they dry and they crumble when moistened.
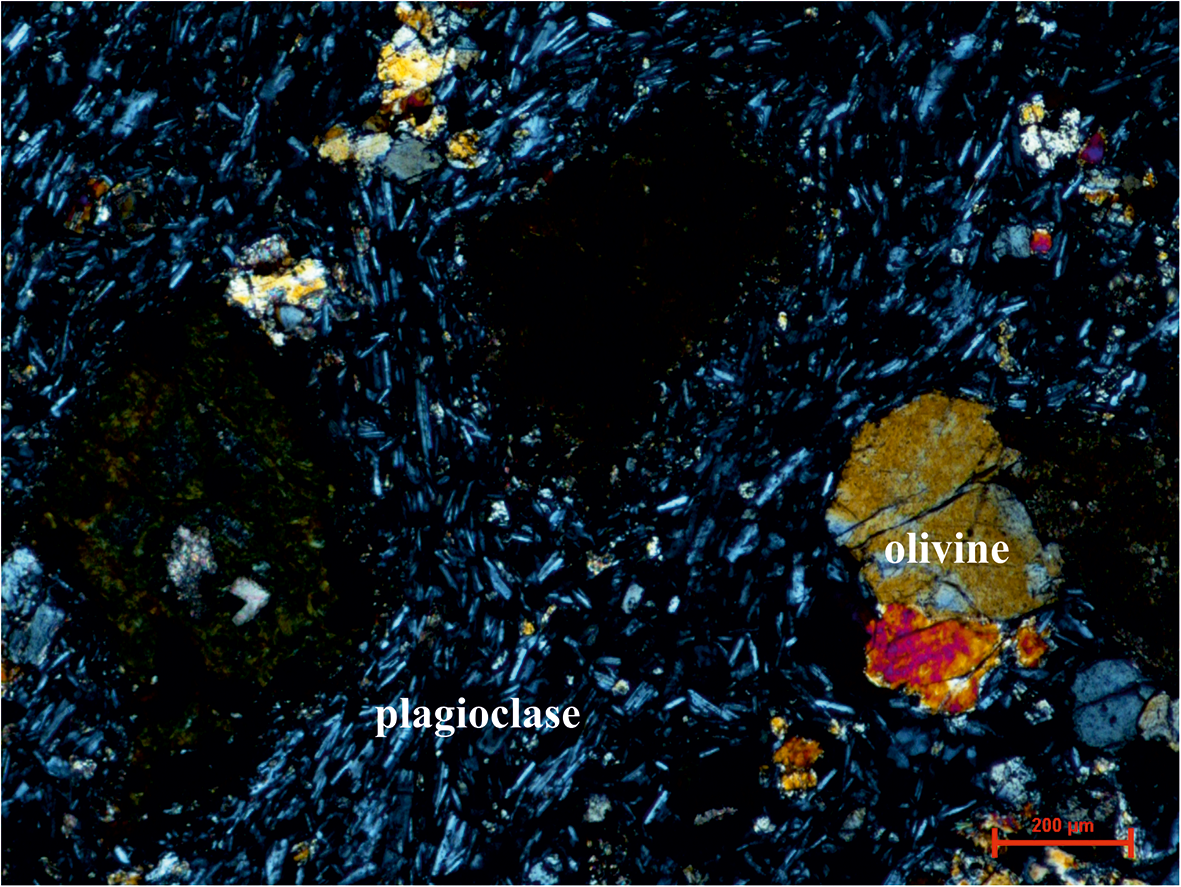
Microscopically, these rocks are characterized as augite basalt, basaltic andesite, basaltic trachyandesite and trachyandesite. They usually contain plagioclase, olivine (Fig. 3), augite and occasionally biotite. Calcite and chlorite are notable secondary minerals in certain regions.
Cross-polarized OM image of a thin basalt section from the Kızılkaya volcanites, showing chloritized olivine and plagioclase.

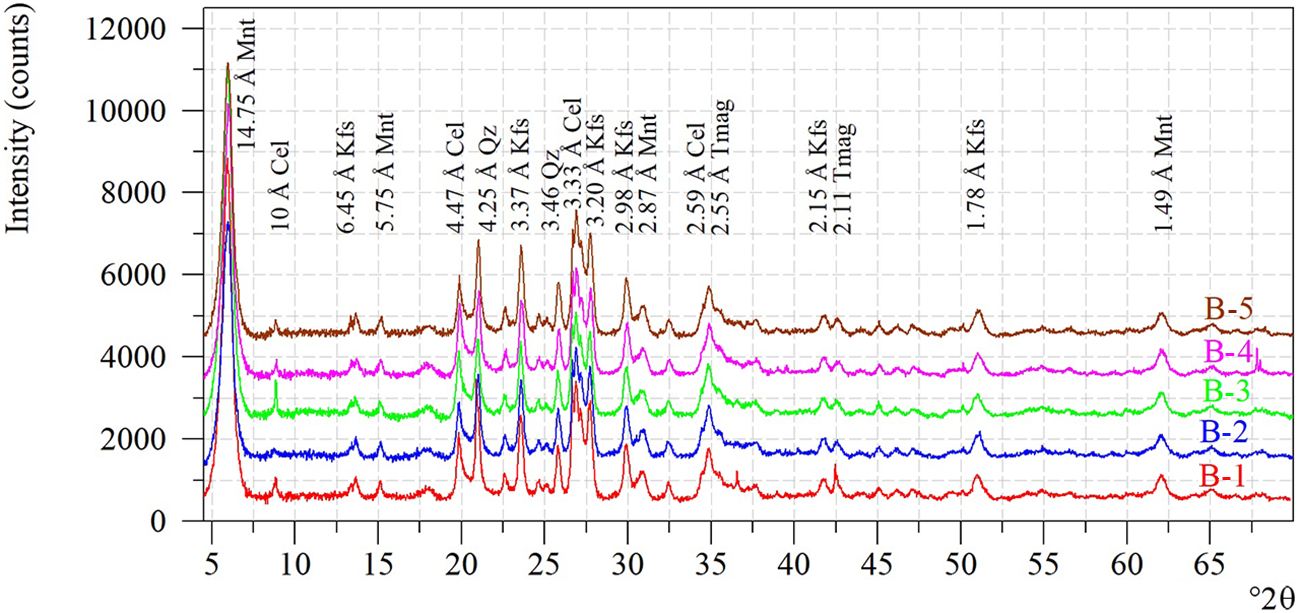
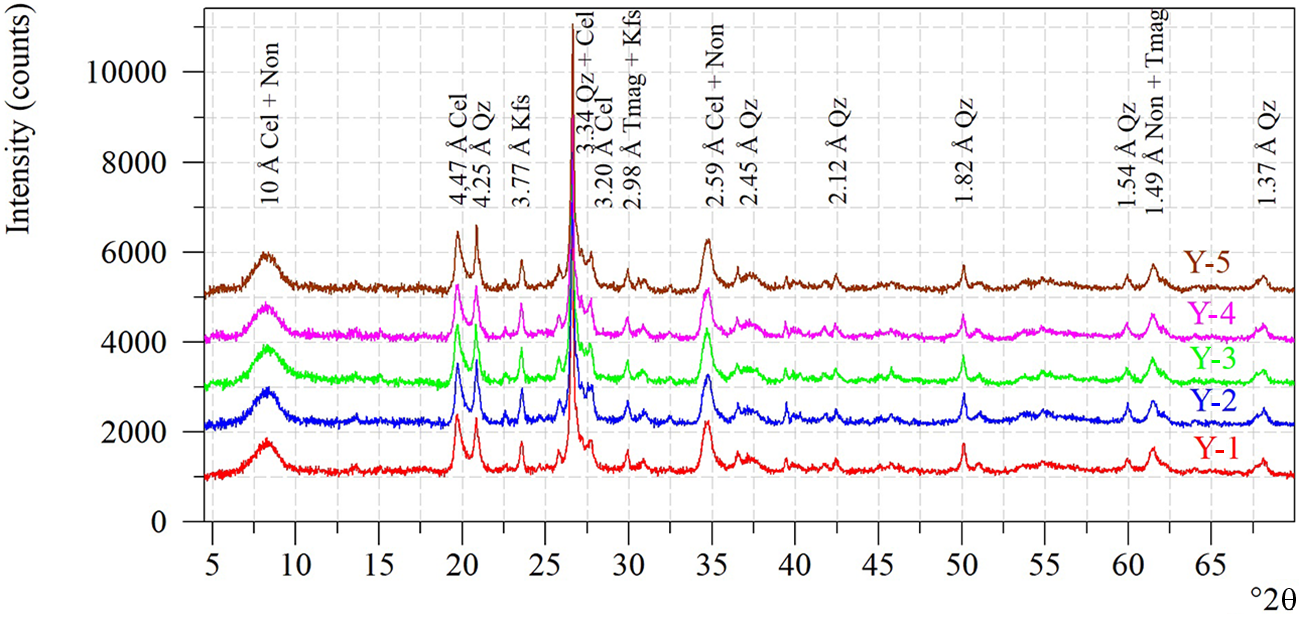
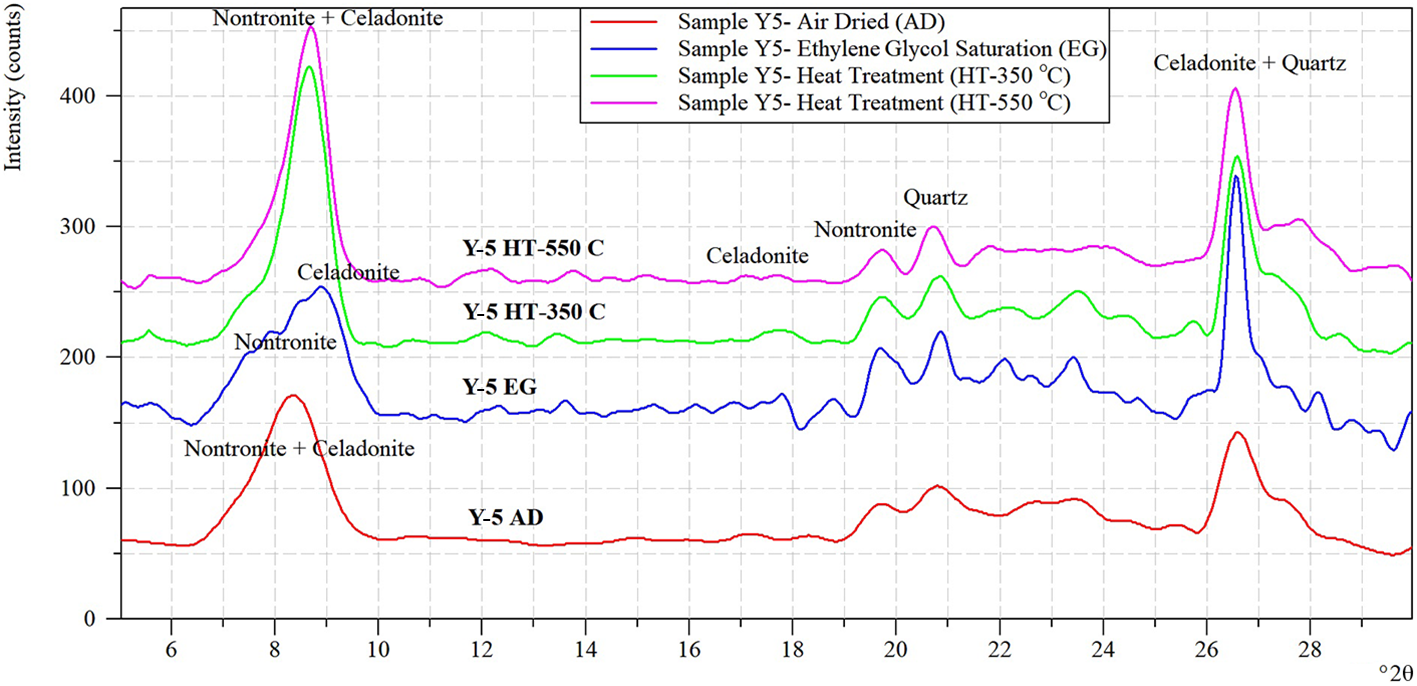
The XRD traces of the clay fractions from AD, EG and HT white samples at 350°C and 550°C showed the presence of smectite group minerals, specifically montmorillonite and nontronite, with a d 060 value of 1.49–1.50 Å, indicating their dioctahedral nature (Figs. 4 & 5). Minor celadonite is also present. Heat treatment or saturation with ethylene glycol did not affect the 001 reflection at ∼10 Å. This indicates that the specimen is not an interstratified mica mineral with expandable layers. The 060 reflection at ∼1.49 Å indicates a dioctahedral structure. The weak 002 reflection at 5.0 Å is due to the substantial amount of iron in the crystal structure. Fe-smectite (nontronite) and celadonite are identified as the only components of the green-coloured clay fraction in all clay horizons measuring less than 2 μm in size (Fig. 6).
XRD traces of white clays. Cel = celadonite; Kfs = K-feldspar; Mnt = montmorillonite; Qz = quartz; Tmag = Ti-magnetite (mineral name abbreviations after Warr, Reference Warr2021).

XRD traces of green clays. Cel = celadonite; Kfs = K-feldspar; Non = nontronite; Qz = quartz; Tmag = Ti-magnetite (mineral name abbreviations after Warr, Reference Warr2021).

XRD traces of the clay fraction of sample Y-5.

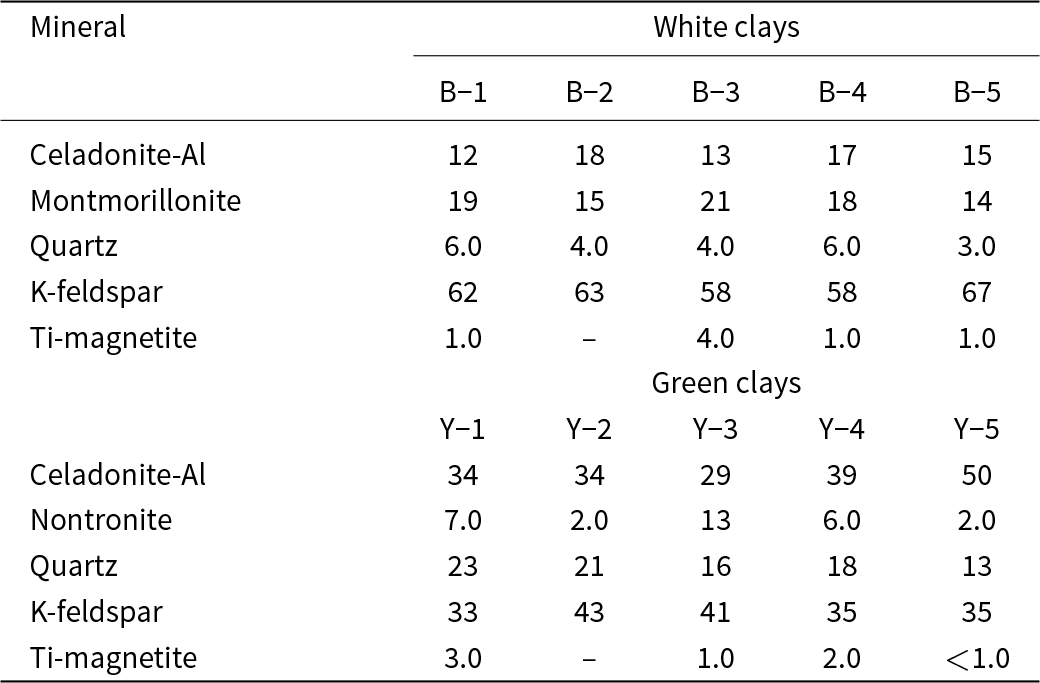
Montmorillonite (14–21 wt.%) and nontronite (2–13 wt.%) coexist with celadonite-Al (12–50 wt.%), quartz (3–23 wt.%), K-feldspar (33–67 wt.%) and Ti-magnetite (<1–3 wt.%; Table 1). The various minerals identified with the HighScore Plus program and the d values of the peaks with the highest intensity are as follows: montmorillonite: 15 Å, 7.70 Å, 5.75 Å, 4.49 Å, 2.45 Å, 2.18 Å, 1.49 Å; nontronite: 9.60 Å, 4.57 Å, 4.36 Å, 3.20 Å, 2.59 Å, 1.49 Å; celadonite-Al: 10.04–9.91 Å, 4.47 Å, 3.33 Å, 2.59 Å, 2.56 Å; quartz: 3.34 Å, 4.25 Å, 2.44 Å, 1.82 Å, 1.78 Å, 1.38 Å; Ti-magnetite: 2.55 Å, 1.49 Å, 2.99 Å, 1.72 Å; K-feldspar: 3.30 Å, 3.77 Å, 4.20 Å, 3.28 Å, 2.98 Å.
Quantitative mineral analysis of the Yazlıca clay samples (wt.%).

The minerals detected in the study area (Table 1) are associated with the alteration of basaltic rocks. Basalts in the study area are generally grey to black and have a brown or rust-red colour when oxidized to iron oxides and iron oxyhydroxides. Basalts are considered among the most easily altered igneous rocks, often decomposing into kaolinitic and even bauxitic clays in tropical or subtropical climatic zones.
Basalt weathering is relatively fast compared to that which occurs in other rock types. During basalt weathering, iron-rich minerals oxidize rapidly in water and air, staining the rock a slightly brownish to reddish hue. However, calcium released from basalt during chemical weathering combines with CO2 from the surrounding environment to form CaCO3 (Eggleton et al., Reference Eggleton, Foudoulis and Varkevisser1987). Celadonite has been reported to form from the alteration of basaltic rocks (Velde, Reference Velde1972, Reference Velde1985). Much of the early work on basalt weathering was summarized by Loughnan (Reference Loughnan1969). Volcanic glass transforms into palagonite. The almost equally susceptible olivine transforms into saponite or nontronite or, after the loss of MgO and oxidation of iron, to hematite, maghemite or goethite. Basalts from New South Wales show the mineral susceptibility sequence olivine > pyroxene > plagioclase > sanidine (Craig & Loughnan, Reference Craig and Loughnan1964). Ferromagnesian minerals form pseudomorphs of trioctahedral smectite, while plagioclase pseudomorphs form dioctahedral smectite. Alkali feldspar transforms into kaolinite or halloysite (Eggleton et al., Reference Eggleton, Foudoulis and Varkevisser1987).
The susceptibility of various minerals to alteration during weathering generally increases according to the order glass > olivine > pyroxene > amphibole > plagioclase > K-feldspar (Colman, Reference Colman1982). All of these minerals are transformed into a mixture of allophane, iron oxides/oxyhydroxides and clay minerals. During the weathering of basaltic rocks, the release of elements such as Ca, Mg, K, Na, Rb and Sr occurs alongside the transformation of volcanic glass into smectite, as well as the formation of iddingsite and the early weathering of plagioclase. In contrast, Si, Mn, P, Cu and Zn appear to be released more slowly and uniformly. At the same time, Ti, V, Cr, Fe, Ni, Zr and Nb remain relatively immobile, showing slight losses in the outer parts of aluminium-rich rocks. Rare earth elements and barium are released but later demonstrate condensation in the outer shell phase.
Celadonite forms during the alteration of basalts as a replacement for pyroxenes and ferromagnesian minerals. Celadonite can also be found in veins in basaltic rocks due to hydrothermal alteration. Unlike glauconite mica, which forms from mixed-layer ferric aluminous smectites, celadonite is not created through mineral transformations of smectites such as nontronite. Nontronite and celadonite can both be present in the same specimen, indicating that they have different formation processes. Celadonite is stable under a wide range of geological environments, from surface or submarine alteration to low-grade metamorphic rocks, which suggests that it is a relatively durable mineral (Sancoko, Reference Sancoko2017).
Celadonite has been identified in hydrothermally altered basalts due to its distinctive colour and occurrence, and this has been confirmed by XRD and Mössbauer spectroscopy (Pemberton, Reference Pemberton1983). Celadonite exhibits a d 001 value of 10.1 Å, but the d 002 peak is not present due to destructive interference, which is a characteristic feature observed in Fe-rich micas (Odom, Reference Odom1984).
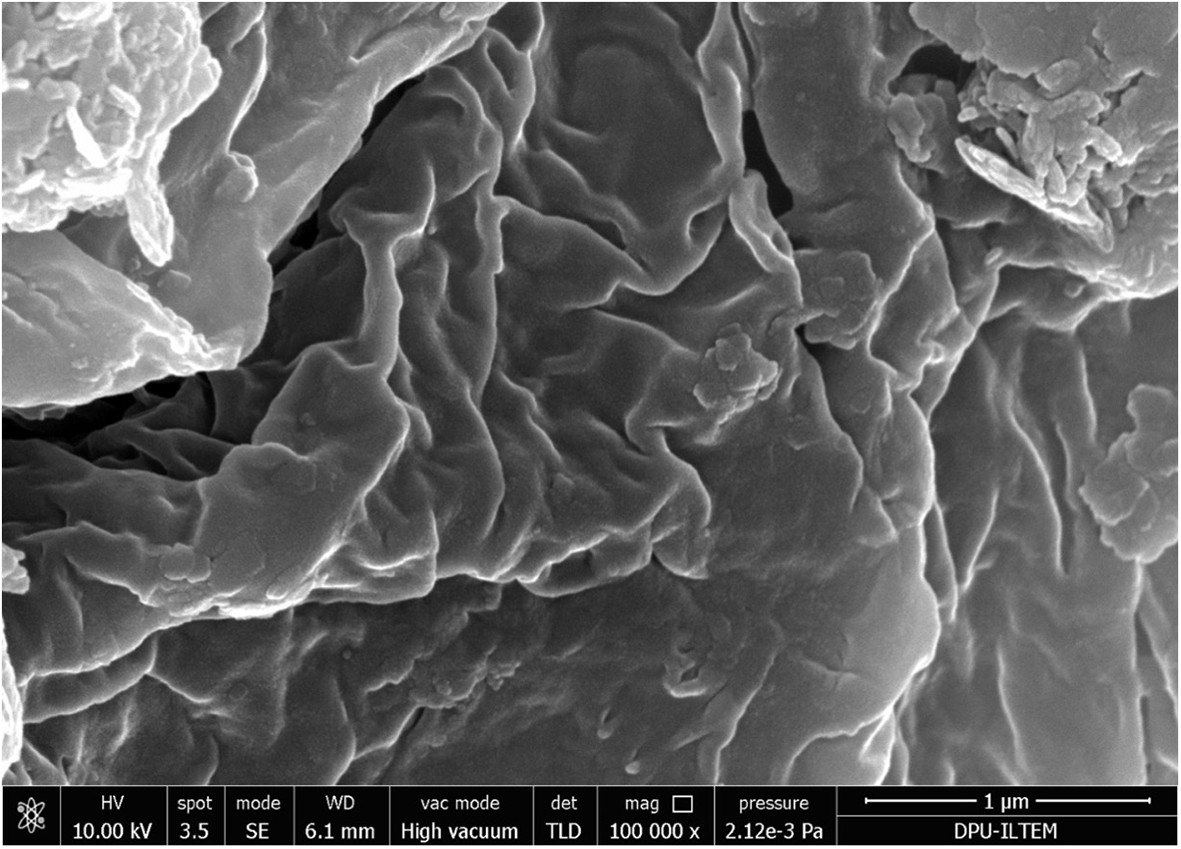
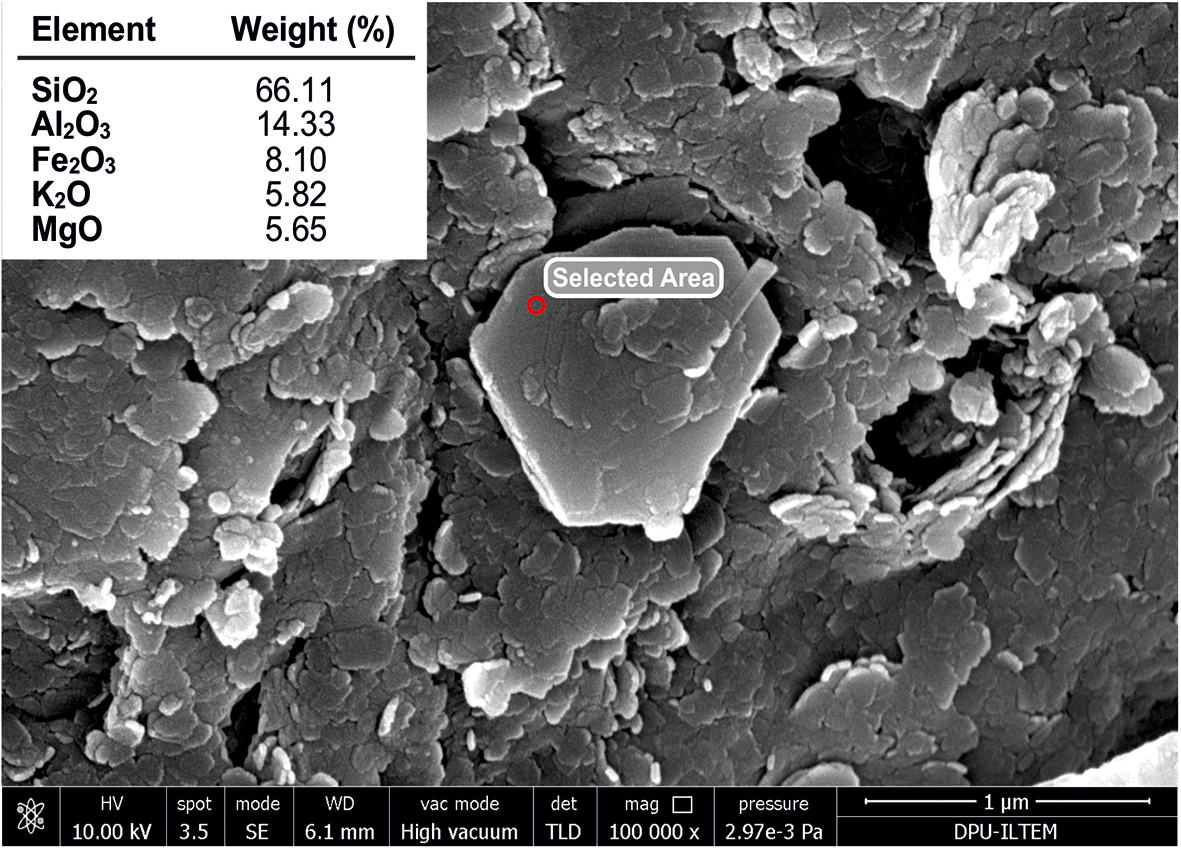
The main smectite is montmorillonite, based on XRD, SEM imaging and chemical analysis using EDS. In SEM, montmorillonite exhibits flaky or rose-like structures (Fig. 7). Additionally, celadonite crystals have a plate-like structure (Fig. 8) and a crystal size of 100 nm–1 µm.
SEM image of a montmorillonite from sample B-1 (100,000×).

SEM image of celadonite-Al crystals (100,000×) and EDS analysis of a celadonite crystal in sample Y-3.

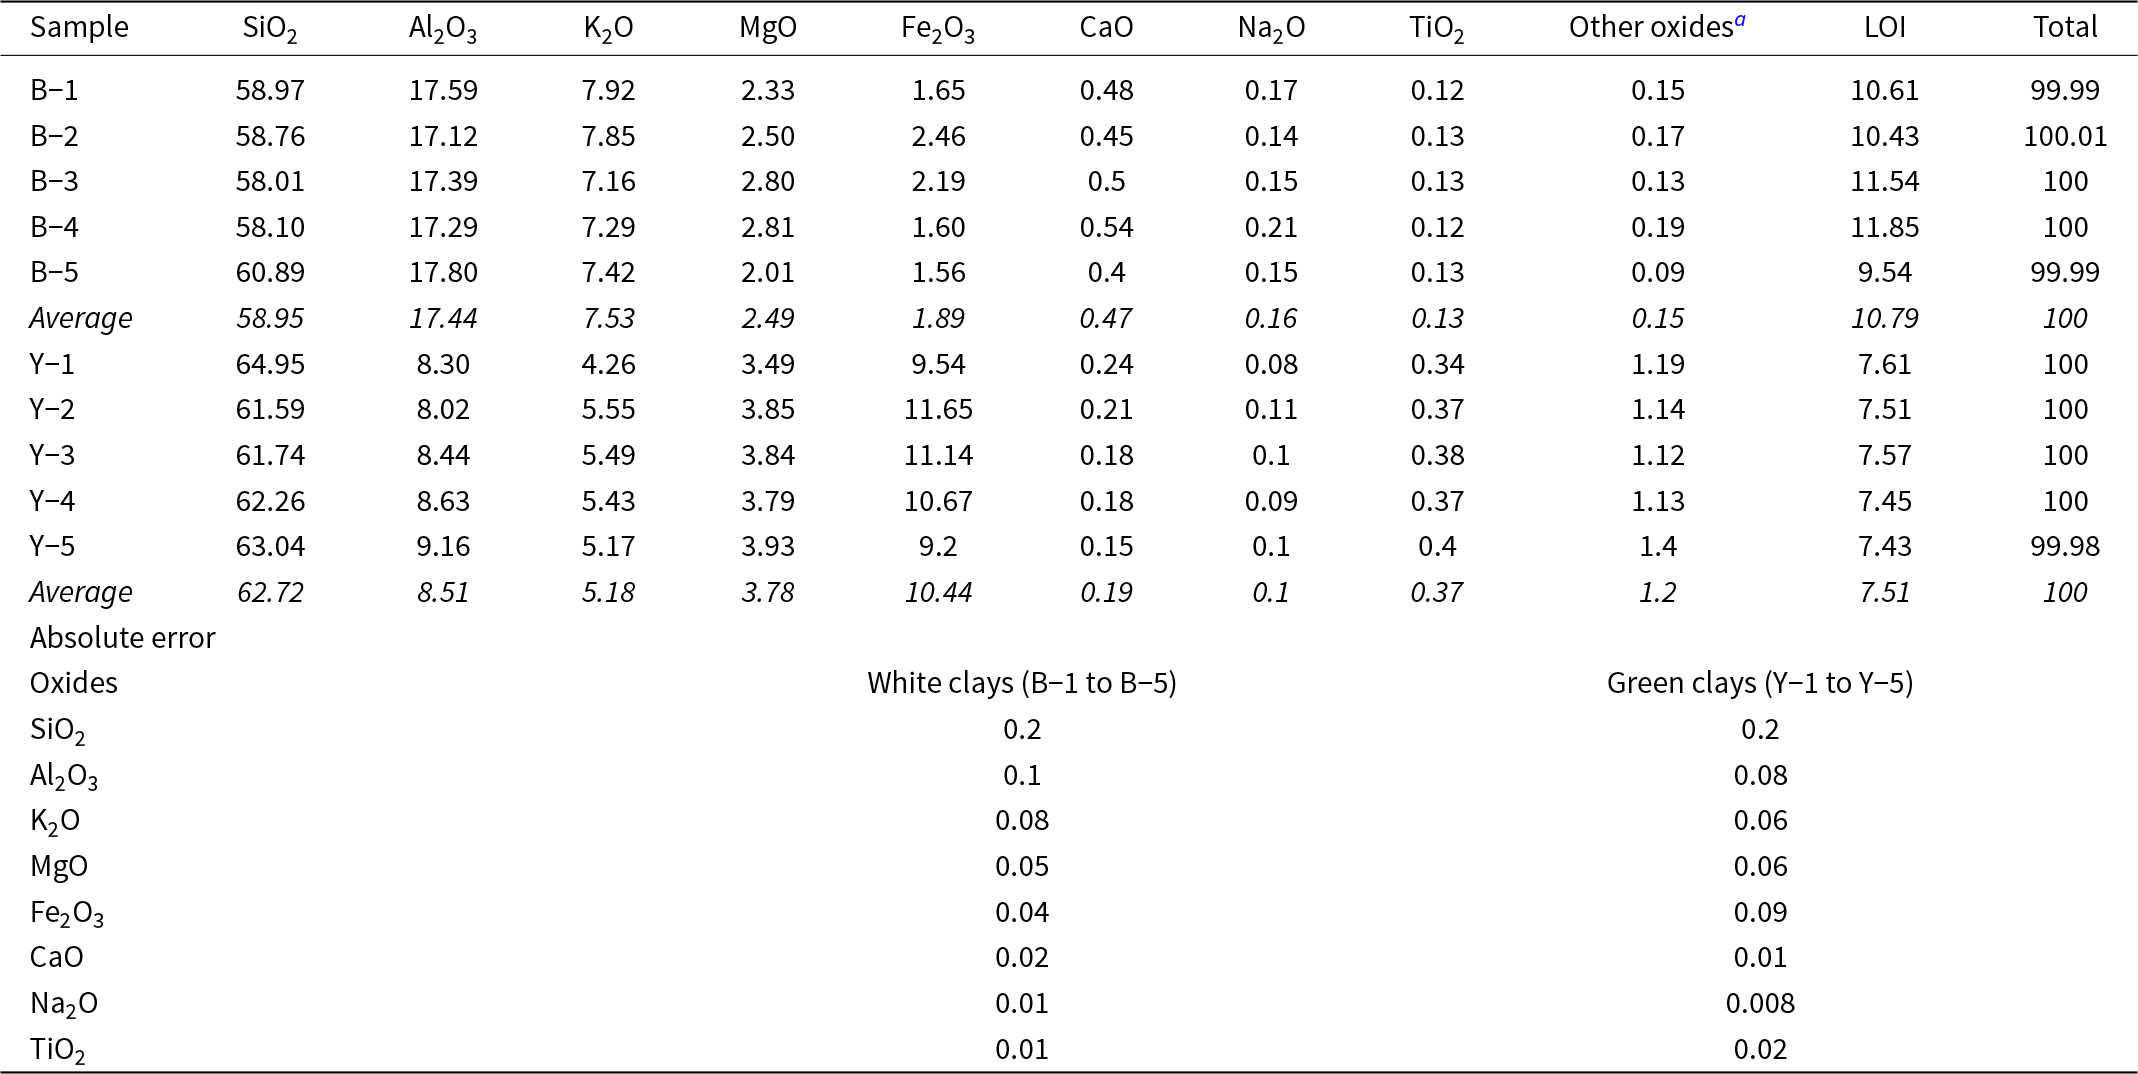
Table 2 lists the chemical composition of the clays. The main oxides include SiO2, Al2O3, K2O, MgO, Fe2O3, Na2O and TiO2. The loss on ignition (LOI) of the clay samples varies between 7.43 and 11.85 wt.%.
Chemical composition of the clay samples (wt.%).

a NiO + Cl + Cr2O3 + BaO + P2O5 + SrO + MnO + SO3 + ZrO2.
Chemical analysis provides information about rock alteration. The Chemical Index of Alteration (CIA) assesses the conversion rates of feldspars to clay minerals. A CIA value between 50 and 65 indicates cold, dry climatic conditions with limited chemical weathering in the source region, a CIA value between 65 and 85 suggests a hot, humid climate with a moderate level of chemical decomposition, and a CIA value between 85 and 100 corresponds to tropical or subtropical humid and warm climatic conditions. By contrast, a CIA value below 50 indicates lack of alteration, whereas CIA values from 50 to 60 signify slight alteration, from 60 to 70 denote less alteration, from 70 to 80 reflect moderate alteration, from 80 to 90 indicate severe alteration and from 90 to 100 represent high alteration (Nesbitt & Young, Reference Nesbitt and Young1982). The CIA values of fresh basalts range from 30 to 45. The CIA values of anorthite, albite and K-feldspar are below 50. Fresh granite and granodiorite CIA values range from 45 to 55. Smectite and illite mineral CIA values range from 75 to 85. Kaolinite and chlorite CIA values are close to 100, which is the highest value in the CIA (Nesbitt & Young, Reference Nesbitt and Young1982).
The CIA is calculated using Equation 1 (Nesbitt & Young, Reference Nesbitt and Young1982):
 \begin{equation}\text{CIA} = \left( \text{Al}_2\text{O}_3/\left( \text{Al}_2\text{O}_3 + \text{CaO}* + \text{K}_2\text{O} + \text{Na}_2\text{O} \right) \right) \times 100\end{equation}
with CaO* being present only in silicates.
The Chemical Index of Weathering (CIW; Harnois, Reference Harnois1988) is often used to describe the behaviour of elements during decomposition. The CIW increases with the degree of depletion of soil or sediment in Na and Ca relative to Al. The difference between the CIW values for bedrocks and soils or sediments reflects the amount of chemical weathering to which the decomposed material is subjected. The CIW is calculated using Equation 2 (Harnois, Reference Harnois1988):
 \begin{equation}\text{CIW} = \left( \text{Al}_2\text{O}_3/\left( \text{Al}_2\text{O}_3 + \text{CaO}* + \text{Na}_2\text{O} \right) \right) \times 100\end{equation}
with CaO* being present only in silicates.
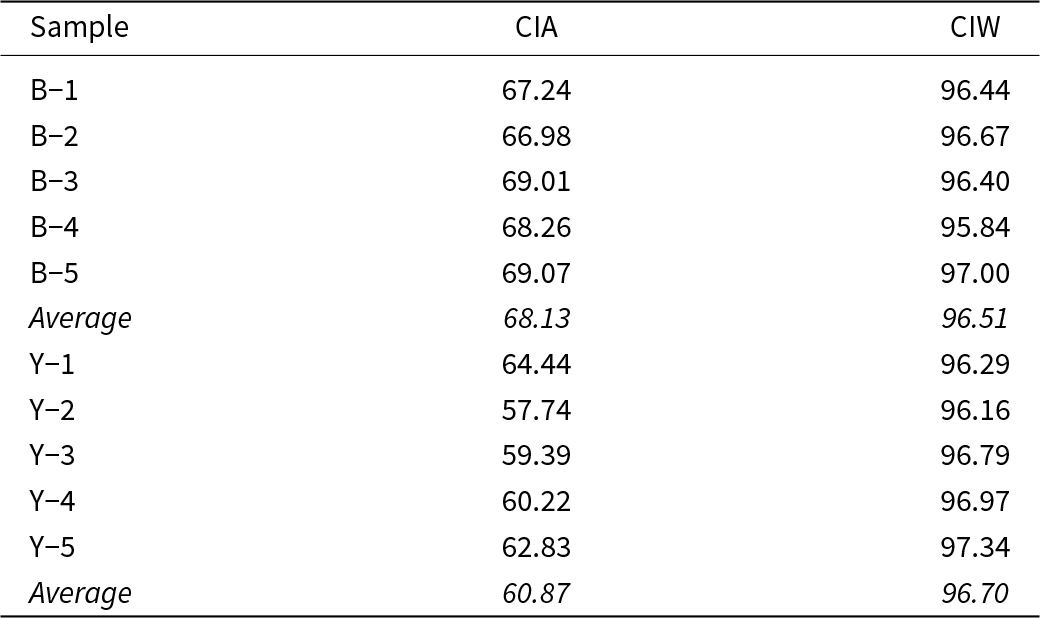
According to the CIA, the white clay sample from the Yazlıca (Ilıca/Kütahya) region is slightly altered, with CIA values ranging from 66.98 to 69.07 (Table 3). However, the green clay sample from the same area is in the less altered range, with CIA values of 57.74–64.44. According to the CIW, the white clay sample from the Yazlıca (Ilıca/Kütahya) region has undergone severe weathering (CIW 95.84–97.00). The CIW values of the green clay sample, which range from 96.16 to 97.34, also indicate severe weathering. The white and green clay samples were taken from the same site, and the CIA and CIW values show that this basalt alteration has experienced severe weathering.
CIA and CIW values of the clay samples.

The Al2O3 content increased at the upper white clay level (samples B-1 to B-5), whereas the Fe2O3 value markedly increased at the green clay level (samples Y-1 to Y-5). The remaining metal oxides do not exhibit significant variations. During weathering of basaltic rocks, water seeps inwards through fractures, initiating chemical reactions. Feldspars decompose, releasing silicon, aluminium and potassium, which are rearranged to form clay minerals such as montmorillonite in the upper clay layers.
Furthermore, the Fe released from the weathering of basaltic rocks accumulates at lower levels to form nontronite. Additionally, the increase in celadonite at this green clay level also increases the Fe content. These processes deposit minerals in different layers. The CIA values (Table 3) support this interpretation by showing a progressive increase in chemical alteration from the upper layers downwards. This trend suggests that weathering processes began affecting the uppermost horizons first, leading to a gradual differentiation of mineral assemblages as alteration advanced into the deeper levels.
Thermal behaviour and firing mineralogy of the clays
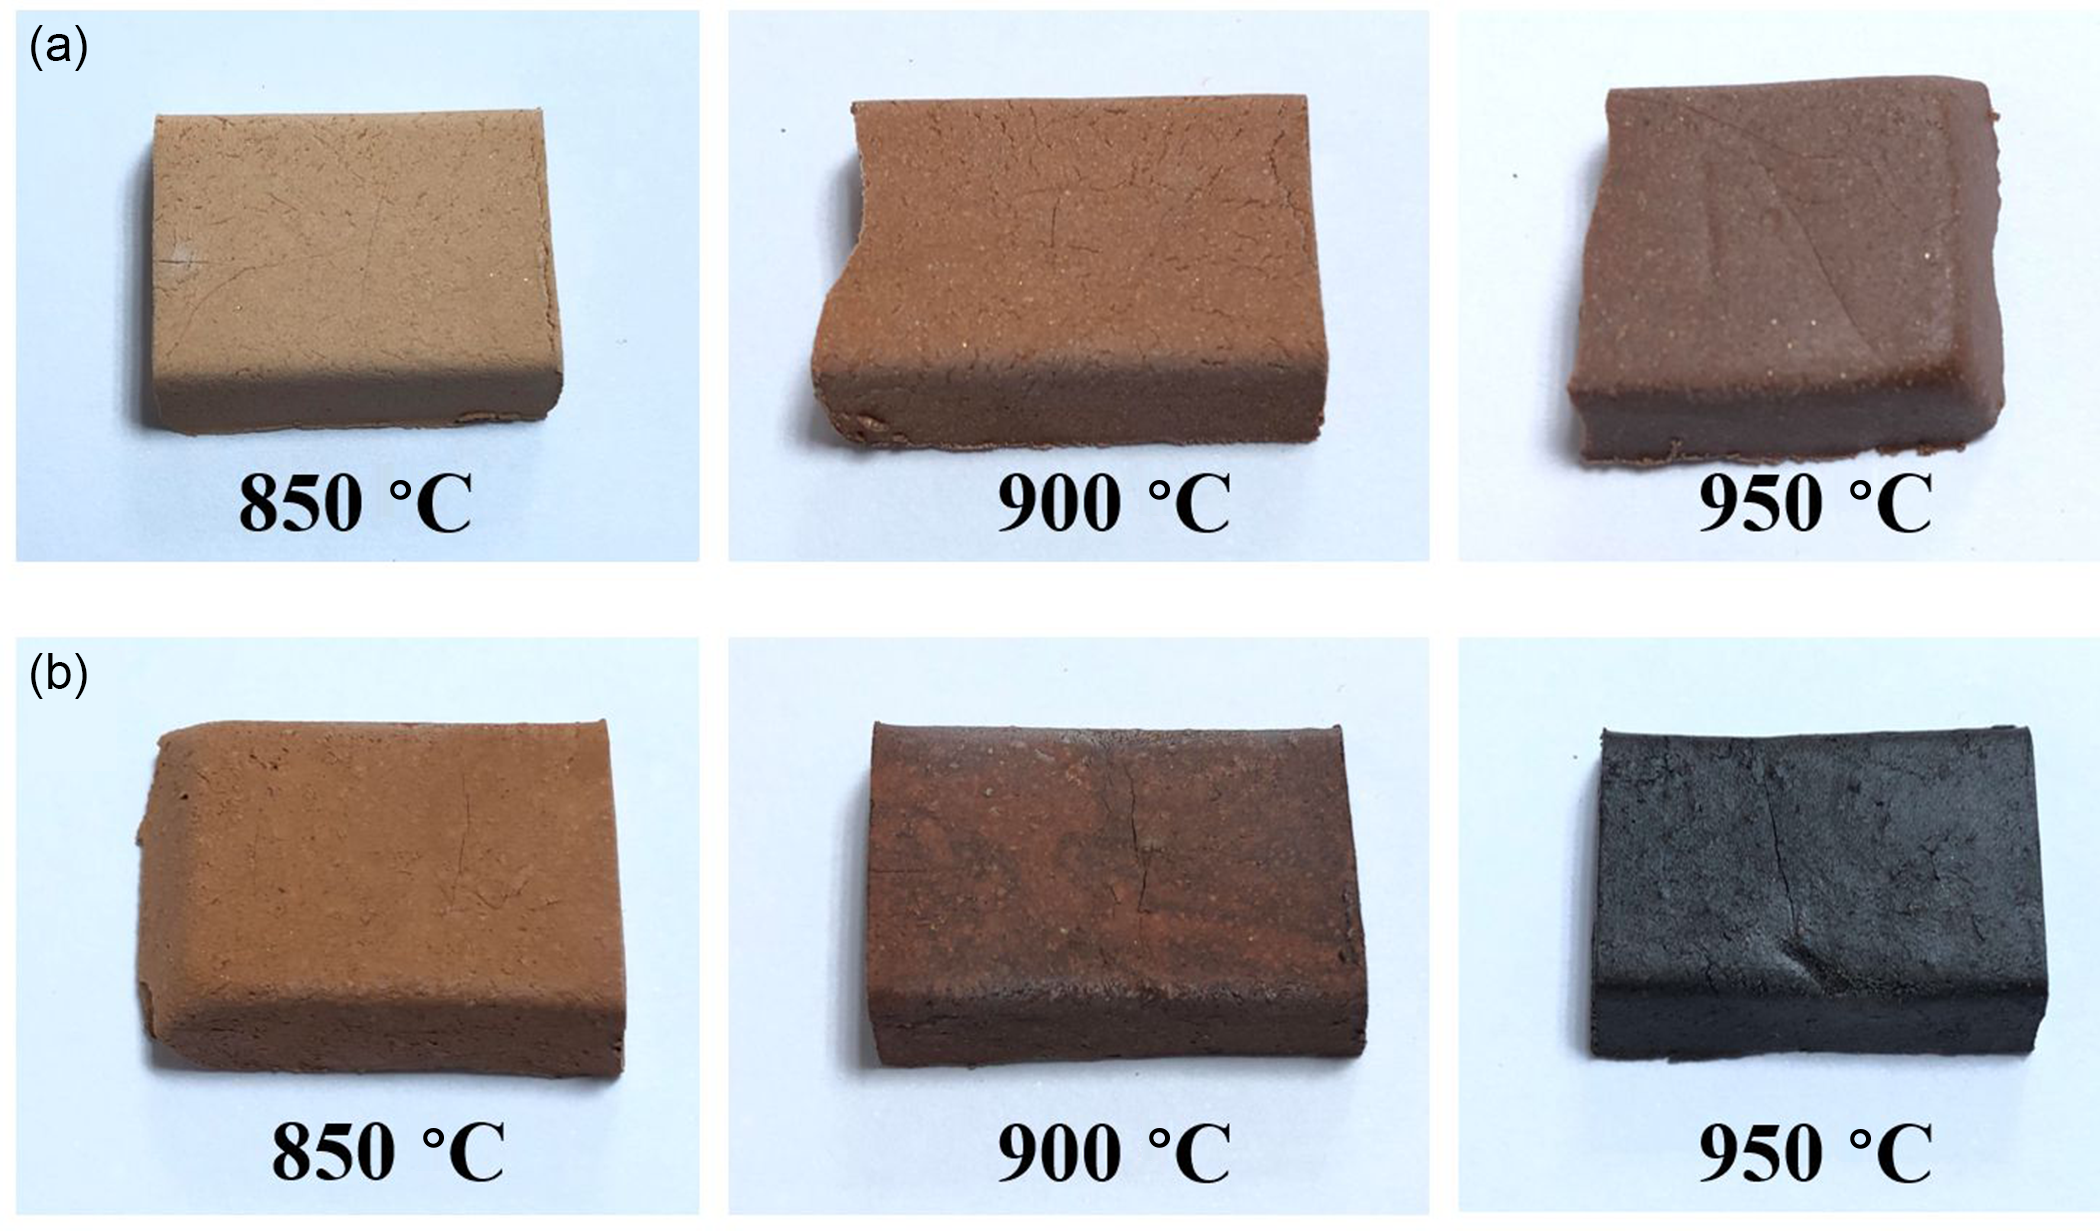
Determining the thermal behaviour of clays through DSC is essential for their characterization and the evaluation of their ceramic properties. In this study, XRD analysis was performed by heating representative samples of B and Y clays at 850°C, 900°C and 950°C, followed by interpretation of the DSC diagrams. After firing at 850°C, 900°C and 950°C, the firing colour of the representative B clay sample changed from light brown to dark red (Fig. 9a), whereas the representative Y clay sample displayed reddish firing colours at 850°C and 900°C and a black colour at 950°C (Fig. 9b).
Comparison of firing effects on representative (a) B clay samples and (b) Y clay samples at various temperatures (850°C, 900°C and 950°C).

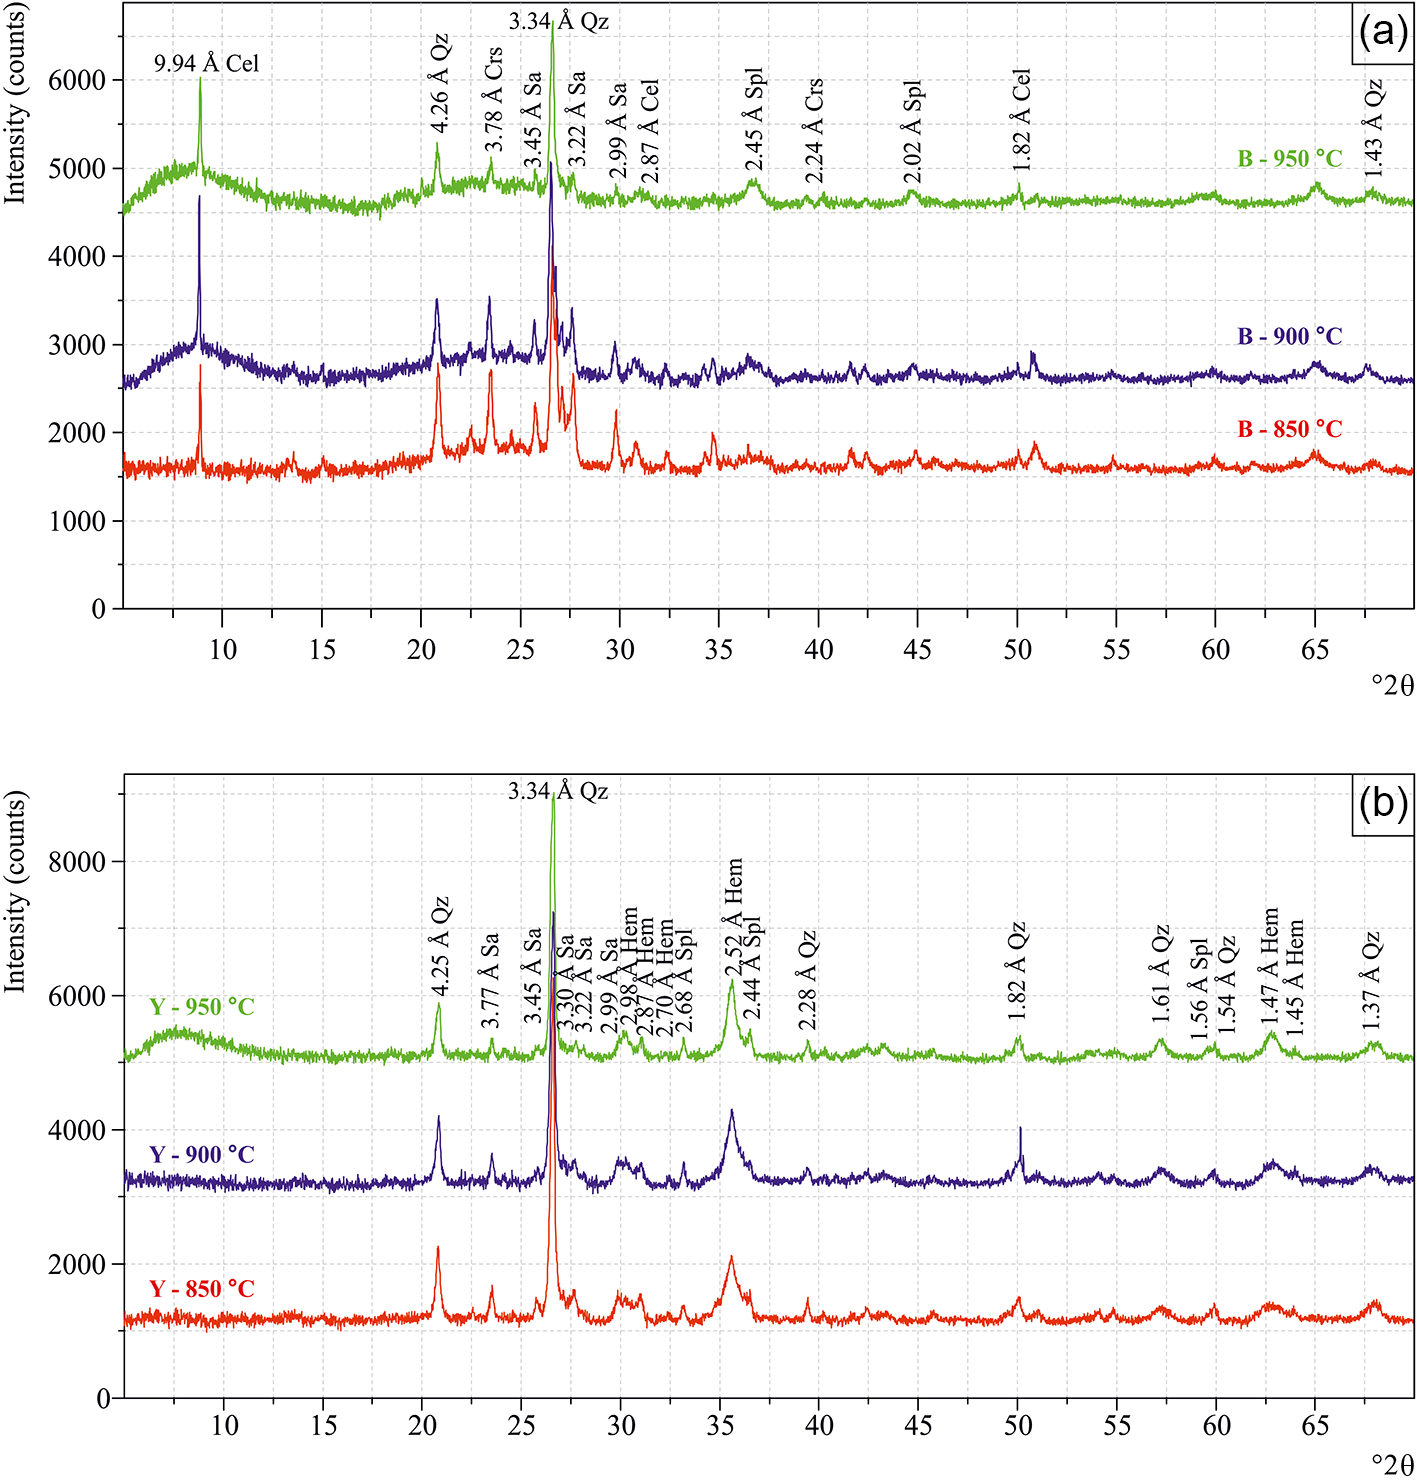
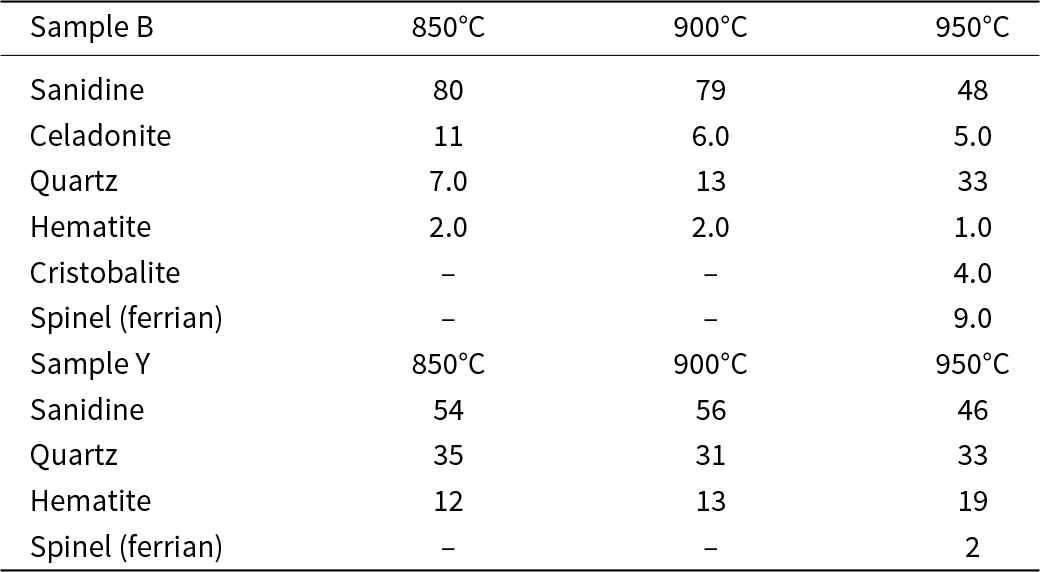
Table 4 shows the crystalline phases formed after firing of representative white and green clay samples at 850°C, 900°C and 950°C. After firing, the white sample consisted of celadonite, sanidine, quartz, hematite, cristobalite and ferrian spinel (Fig. 10a & Table 4). Decomposition of celadonite was not complete in the white clay. In general, mica minerals begin to decompose after 950°C. However, such a temperature is sufficient for decomposition of the other minerals. Montmorillonite undergoes structural decomposition at 850–1000°C, forming spinel, quartz and cristobalite. The green clay sample contained sanidine, spinel, quartz and hematite (Fig. 10b). These minerals formed from the decomposition of nontronite (Földvari, Reference Földvari2011). The K-feldspar in the B and Y clay samples was transformed into sanidine at 600–900°C.
XRD traces of fired representative samples of (a) B clay and (b) Y clay. Cel = celadonite; Crs = cristobalite; Hem = hematite; Qz = quartz; Sa = sanidine; Spl = spinel (mineral name abbreviations after Warr, Reference Warr2021).

Quantitative analysis of representative B and Y fired clay samples (wt.%).

The XRD traces of the selected green clay sample Y-3 (Fig. 10b) show a progressive disappearance of clay minerals (nontronite-like phases) and the emergence of amorphous matter and hematite, which is responsible for the red colour, in accordance with previous studies (Jordán et al., Reference Jordán, Martín-Martín, Sanfeliu, Gómez-Gras and de la Fuente2009; Tschegg et al., Reference Tschegg, Ntaflos and Hein2009; Marocchi et al., Reference Marocchi, Bargossi, Gasparotto and Dondi2010).
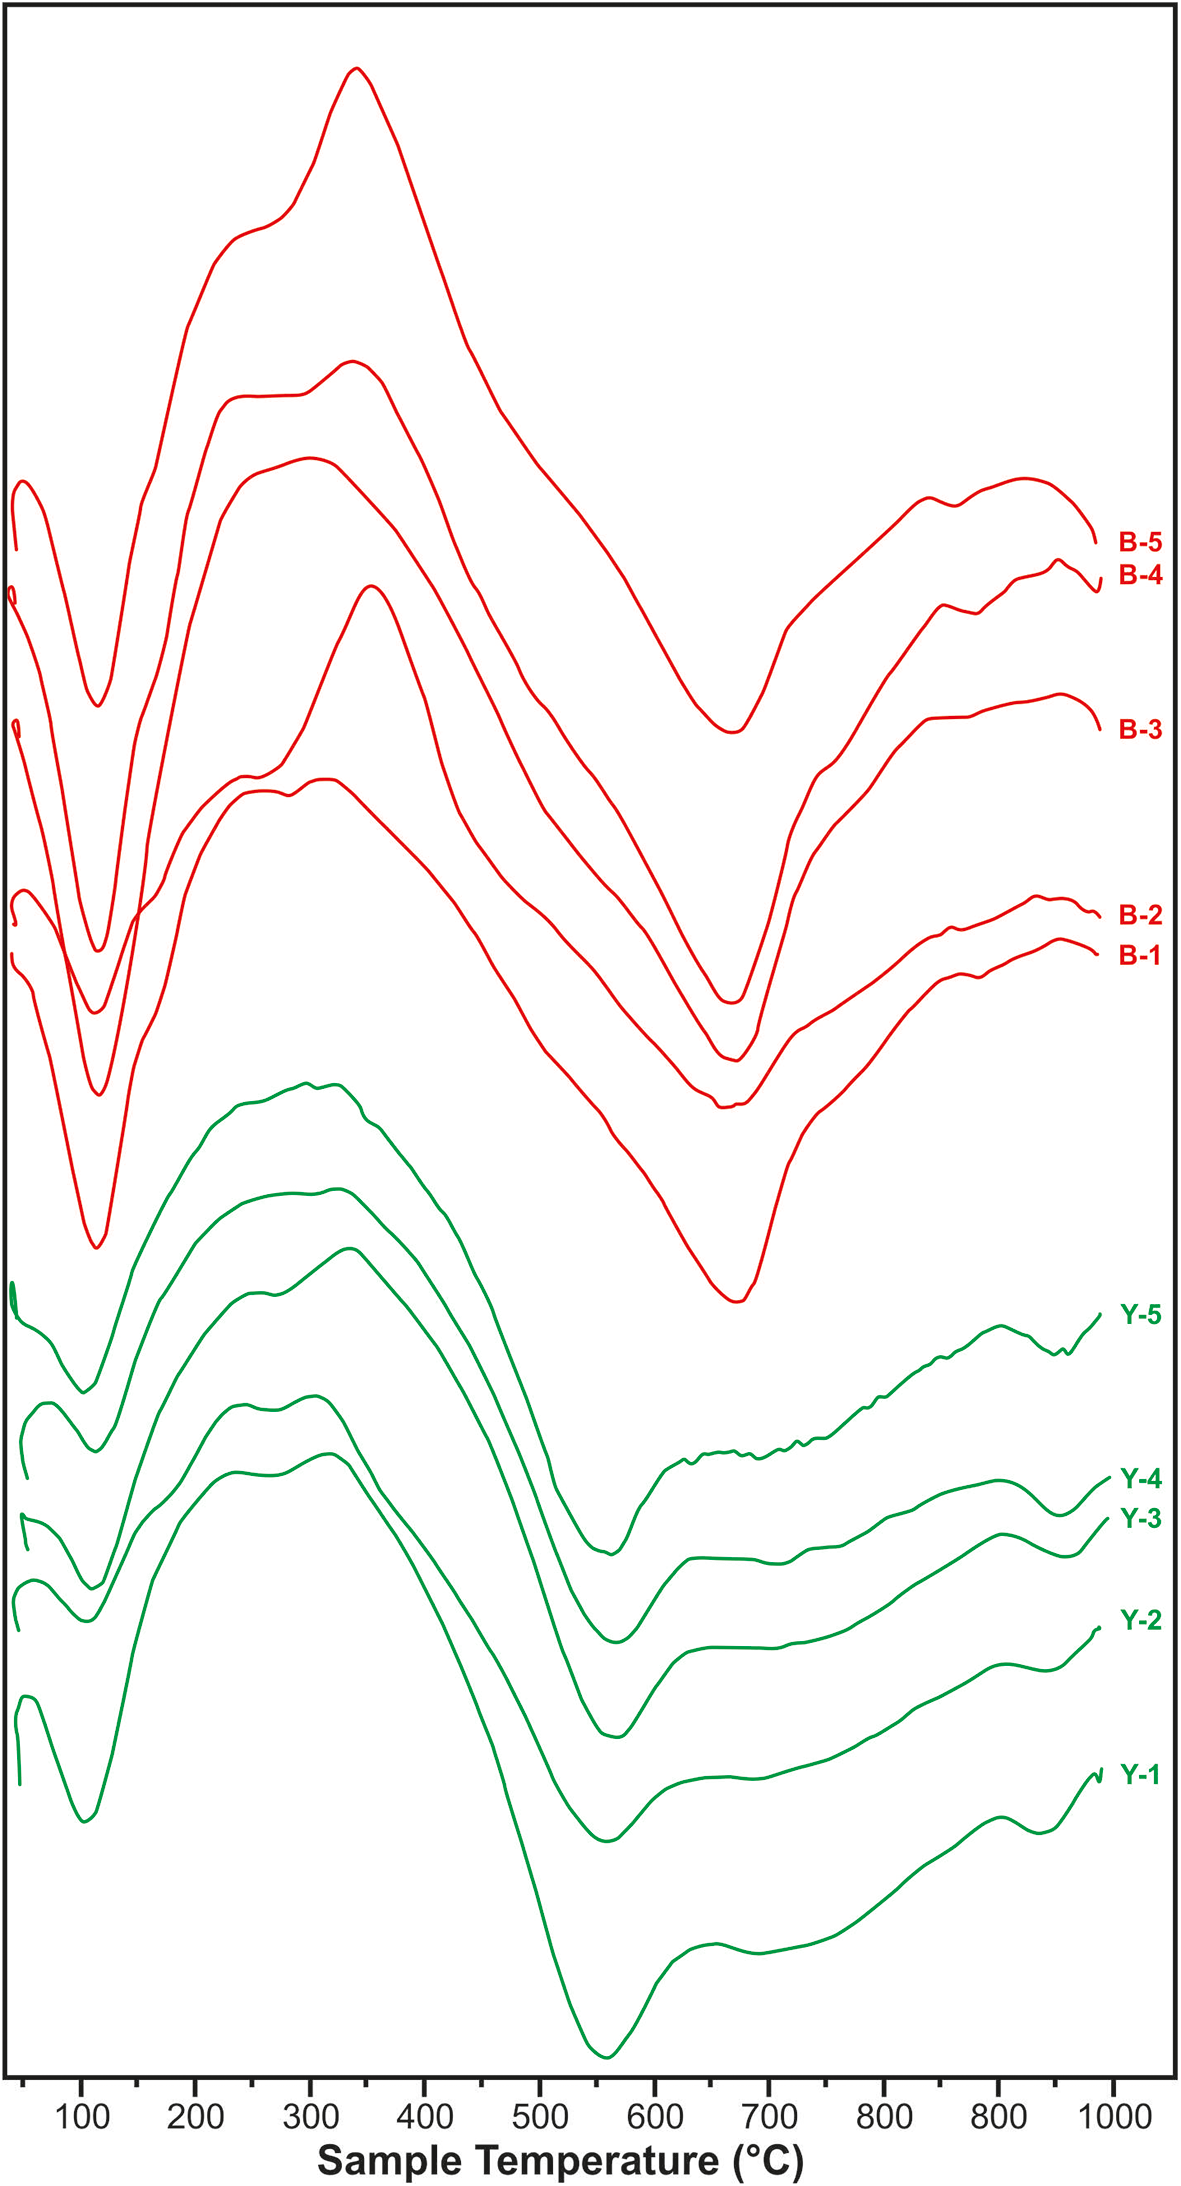
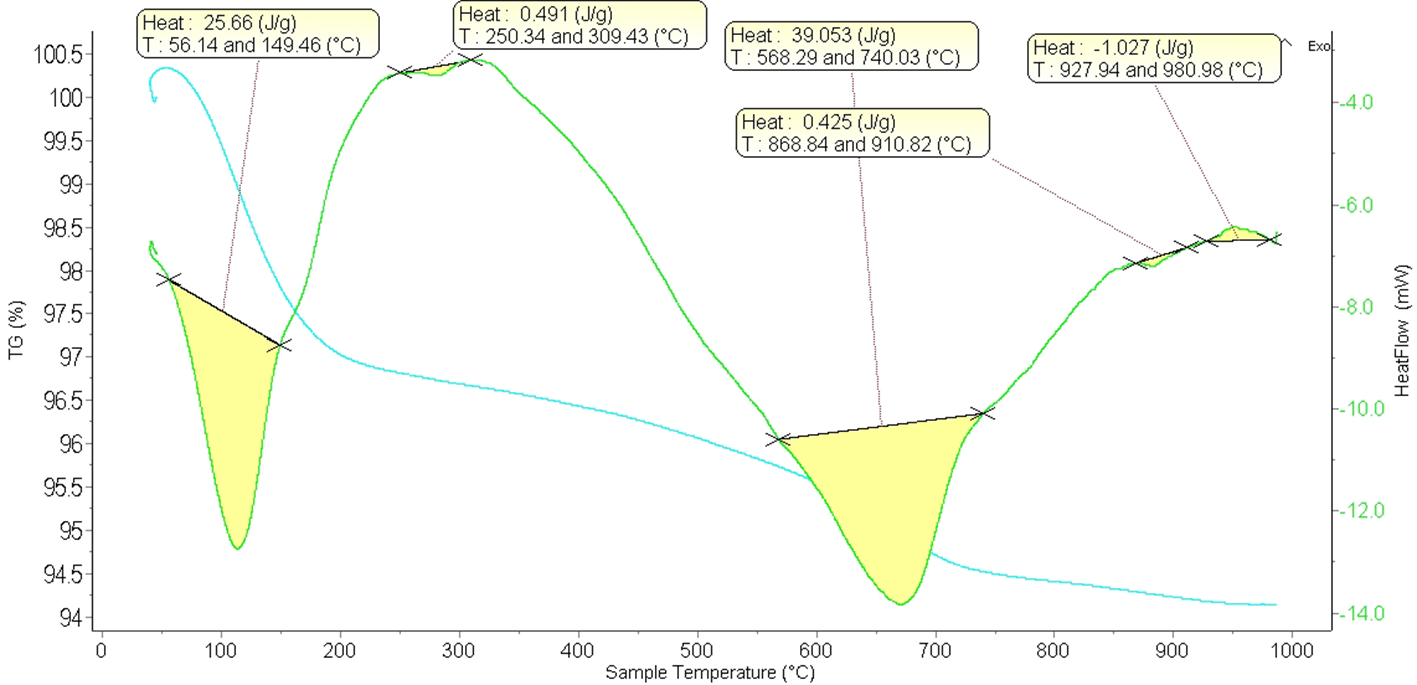
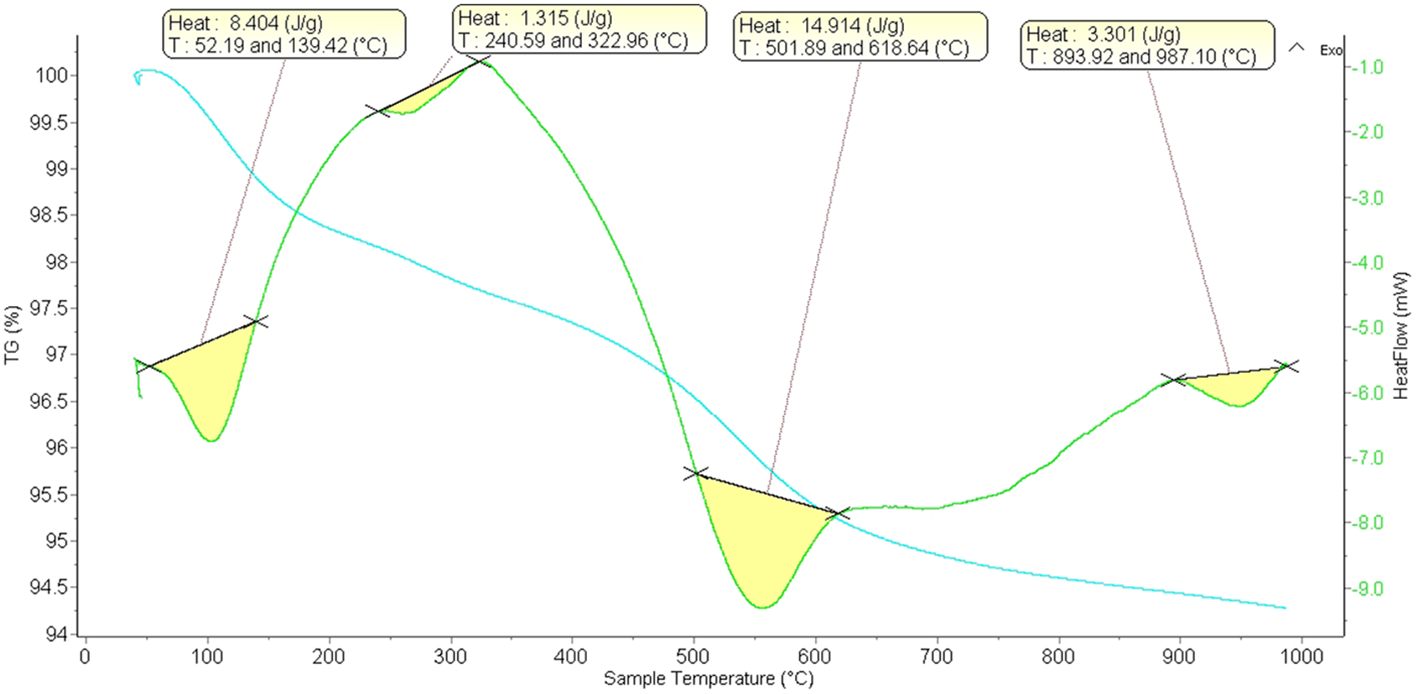
Figure 11 displays the DSC curves of the white and green clay samples. Figure 12 illustrates the DSC-TG diagram of sample B-1, and Figure 13 depicts the DSC-TG diagram of sample Y-3, chosen as a representatives of these groups.
DSC curves of the white and green clay samples.

DSC-TG curves of sample B-1 from the upper clay level.

DSC-TG curves of sample Y-3 from the lower clay level.

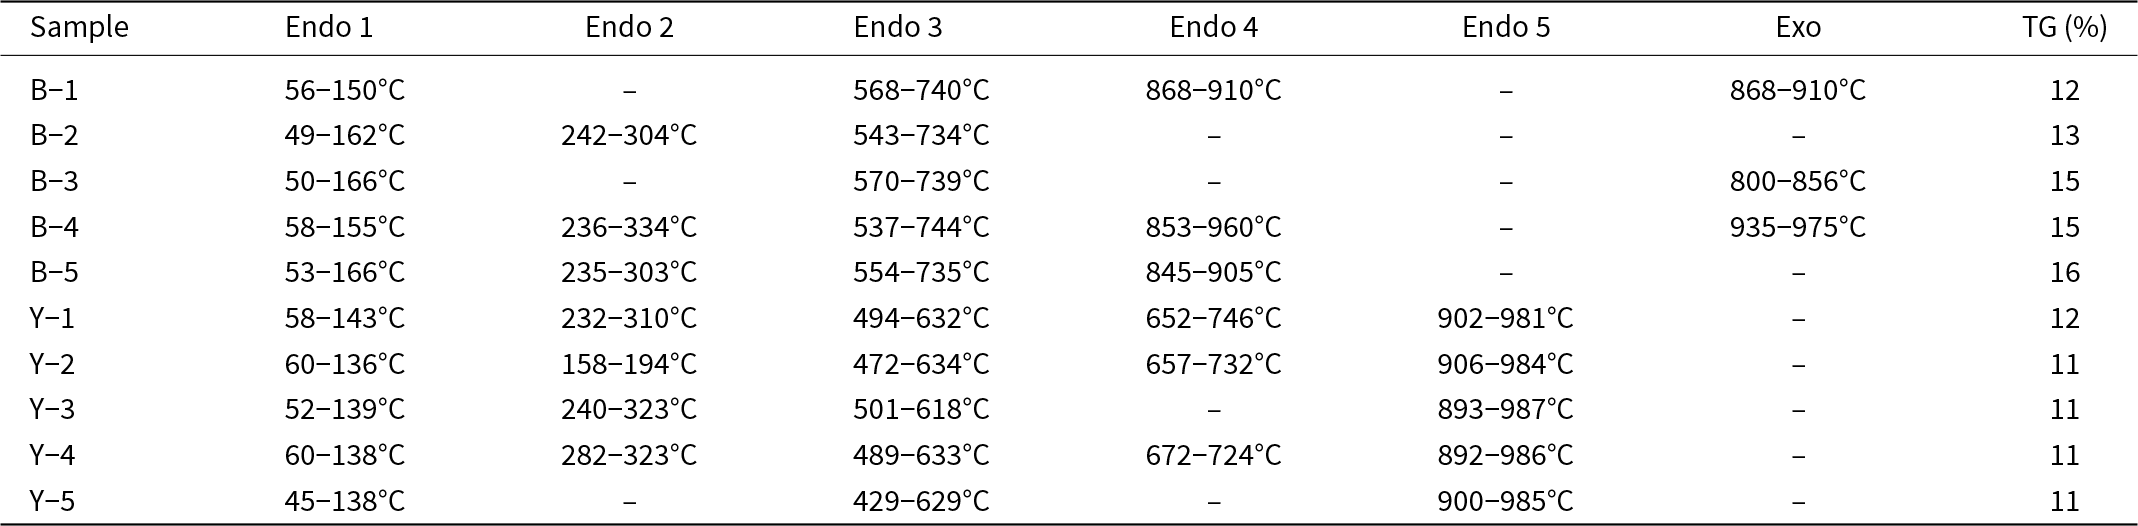
Table 5 summarizes the endothermic and exothermic reaction temperatures from the DSC analysis of the Yazlıca clays, as well as the mass loss percentage based on the TG analysis. Up to five mass loss events can be observed. The most significant mass loss, related to the elimination of adsorbed water (dehydration), occurs at 45–166°C (Figs. 11–13 & Table 5). According to Fontaine et al. (2020), this mass loss, which ranged from 11% to 15%, could be linked to a dual endothermic signal associated with the internal hydration shell of exchangeable cations and less tightly bound water (Greene-Kelly & Gallavan, Reference Greene-Kelly and Gallavan1957; Andrejkovičová et al., Reference Andrejkovičová, Janotka and Komadel2008; Górniak et al., Reference Górniak, Szydłak, Gaweł, Klimek, Tomczyk and Sulikowski2016), and it would indicate the presence of divalent cations (Ca2+ and Mg2+) in the interlayer space.
Endothermic (endo) and exothermic (exo) reaction temperatures obtained from DSC and mass losses determined according to TG analysis of Yazlıca clays.

The presence of montmorillonite, which was identified by XRD and SEM analyses in the white clay samples at the top levels (Fig. 7), was also confirmed by thermal analysis of samples B-1 to B-5 (Fig. 11). Wide endothermic peaks at 100–150°C observed in the DSC curves of sample B-1 and other clay samples in this group indicate that H2O had been removed. Subsequently, wide endotherms at 550–750°C indicate the release of crystalline water from montmorillonite. The third endothermic peak, due to structural disruption, occurred at ∼950–1000°C.
Nontronite, which is detected in the lower green clay levels, undergoes dehydration at low temperatures, similar to montmorillonite, typically between 100°C and 200°C. At high temperatures, it displays dehydroxylation in two stages: at 500–600°C and 600–700°C (Fig. 12 & Table 5). The thermal behaviour of celadonite is almost identical to that of glauconite, which exhibits endothermic peaks at 100–150°C, 550–650°C and ∼950°C. The endothermic event at 100–200°C indicates the release of water adsorbed on the celadonite surface. The endothermic peak at 550–650°C corresponds to water loss from the crystal lattice, and the third endothermic peak at 868–910°C is interpreted as the eventual destruction of the celadonite structure (Figs. 11 & 12) associated with a phase change.
Endothermic reactions between 700°C and 1100°C suggest that K-feldspar underwent phase changes. Some structural arrangements could be observed at high temperatures before melting. At temperatures close to its melting point, K-feldspar converted into a liquid phase, typically associated with an endothermic reaction. Beyond 700°C, the reactions developed in two steps in sample B-1 and in three steps in sample Y-3 (Figs. 11 & 12). The endothermic reaction at 573°C corresponds to the structural transition from trigonal (α) to hexagonal (β) quartz. As the inversion is reversible, it was possible to detect the quartz peak even when other minerals were present (Figs. 11 & 12 & Table 5).
The breakdown of clay minerals began at ∼1000°C, forming amorphous components and a mullite and/or viscous phase (Zanelli et al., Reference Zanelli, Raimondo, Guarini and Dondi2011). The exothermic reactions at 800–975°C (Table 5) indicated the presence of primary mullite or pseudo-mullite, specifically Si-Al spinel, with a mullite-like composition. A continuous decline at 800°C indicated liquid-phase formation (Yanık et al., Reference Yanık, Ceylantekin, Taşçı and Ü2012). The endothermic and exothermic peaks at 800–975°C were related to spinel, quartz and cristobalite crystallization. The exothermic peak was not always prominent and appeared at temperatures greater than 1000°C. Simultaneously, endothermic and exothermic reactions at high temperatures, specifically between 900°C and 1000°C, suggested phase transformations or reconfigurations of the crystal structures in K-feldspars (Figs. 11 & 12 & Table 5).
The formation of the vitreous phase from feldspar melting occurred rapidly, starting at ∼1050°C, and it was largely completed before the initiation of viscous flow that led to densification, which involved a gradual dissolution of quartz. It is to be expected that the kinetics of sintering would be influenced by the viscosity and surface tension of the liquid phase, which primarily depends on the Al2O3 content, thereby affecting mullite stability, and the Na/K and Na/Ca ratios. There was microstructural control over sintering as the rheological behaviour of the viscous phase (i.e. the matrix containing both the liquid phase and fine-grained crystals of quartz and mullite) differed significantly from that of the liquid phase alone (Zanelli et al., Reference Zanelli, Raimondo, Guarini and Dondi2011).
FTIR spectroscopy
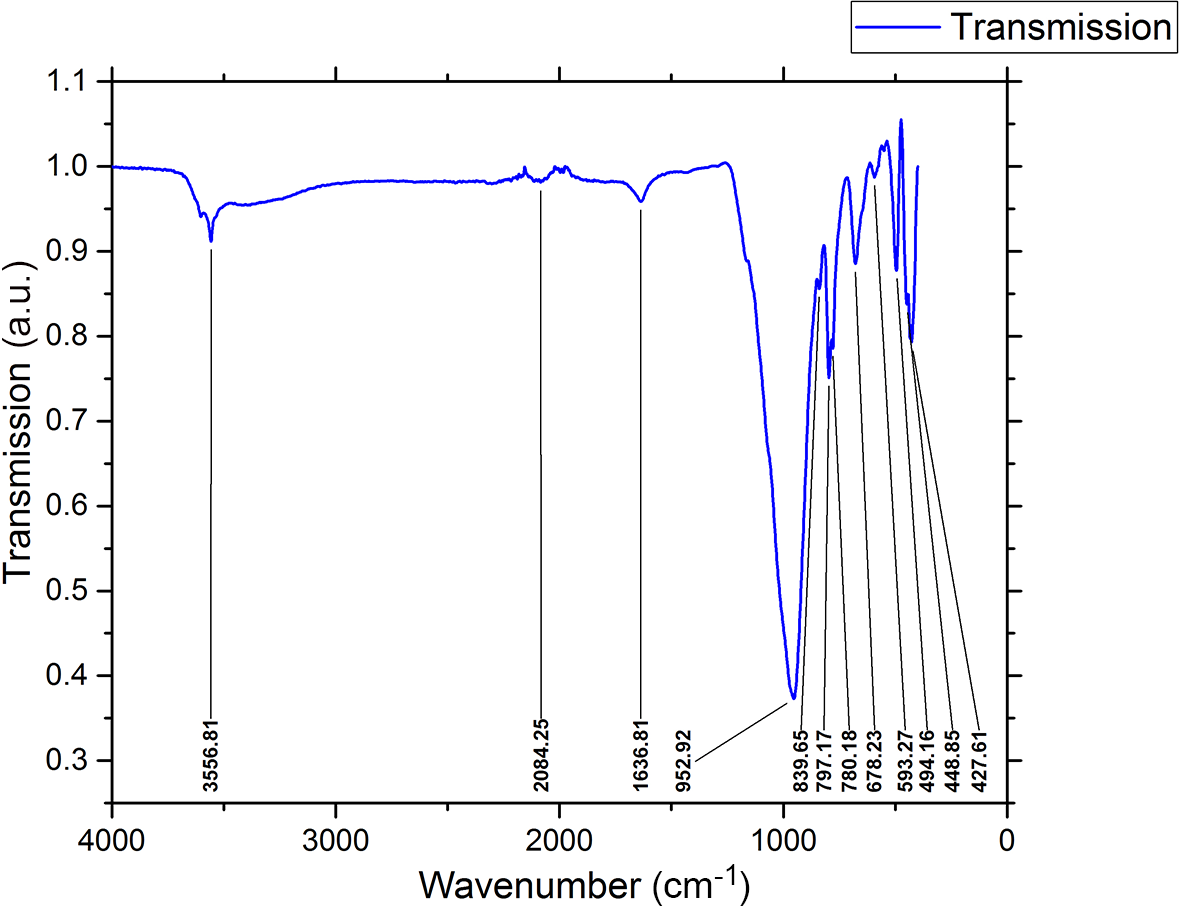
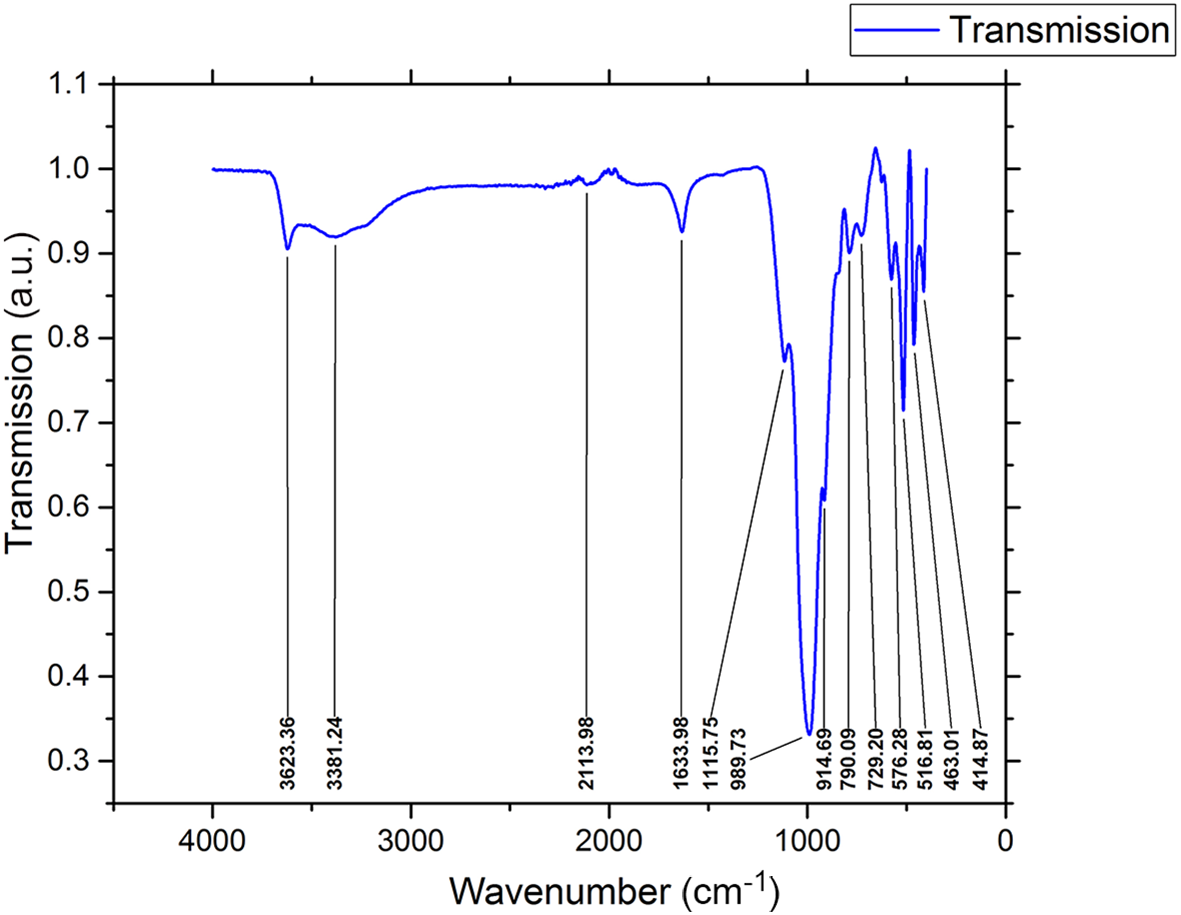
This FTIR spectra of representative samples B-1 and Y-3 are shown in Figures 14 & 15. The spectra show distinct bands in the 3400–3700 cm–1 range, indicating a well-ordered structure typical of celadonite (Bailey et al., Reference Bailey, Brindley, Kodama and Martin1979). The bands at 3623 cm–1 indicate Al-Mg-OH vibrations in the octahedral sheet of the celadonite Y-3 sample. The bands at ∼3557, 797 and 678 cm–1 are attributed to Fe–Mg–OH vibrations, whereas the band at 839 cm–1 is assigned to Al–Mg–OH vibrations in the octahedral sheet of celadonite. The bands at 1115, 952–494 and 427 cm–1 are due to T(Si–O) vibrations in the tetrahedral sheet (Weiszburg et al., Reference Weiszburg, Nagy, Toth, Mızak, Varga, Lovas and Vaczi2004).
FTIR spectrum of sample B-1.

FTIR spectrum of sample Y-3.

The OH-stretching bands of the smectites are observed at 3623 cm–1, those of H–O–H stretching vibrations are at 3500 cm–1, the Si–O vibrations occur at 1000–1100 cm–1 and the Al–OH stretching vibrations occur at 800–900 cm–1 (Fig. 14). The band near 3381 cm–1 indicates the presence of water molecules, and the Si–O vibrations occur at 1000–1100 cm–1. The bands at 800–900 cm–1 are OH– stretching modes associated with structural Al3+ or Fe3+ (Fig. 15; Farmer, Reference Farmer and Farmer1974; Madejová, Reference Madejová2003).
Ceramic properties
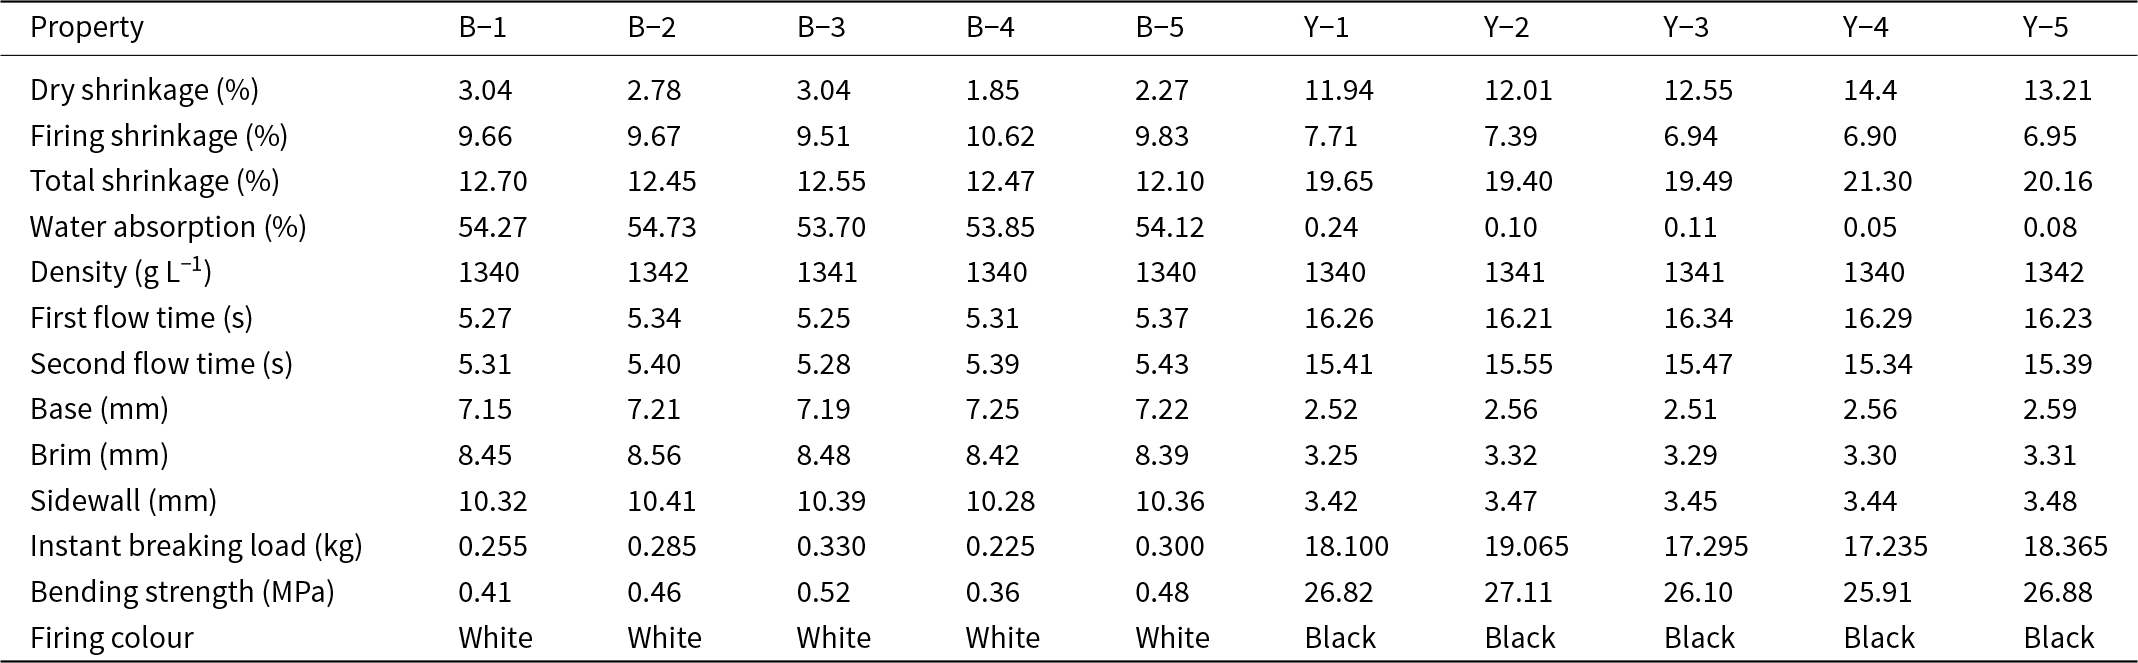
The ceramic properties of the white clays (samples B-1 to B-5) and green clays (samples Y-1 to Y-5) are summarized in Table 6. The white clay samples’ dry shrinkage, firing shrinkage and total shrinkage values ranged from 1.85% to 3.04%, from 9.51% to 10.62% and from 12.1% to 12.7%, respectively. In comparison, the green clay samples exhibited dry shrinkage, firing shrinkage and total shrinkage values between 11.94% and 14.40%, between 6.90% and 7.71% and between 19.40% and 21.13%, respectively (Table 6). Dry shrinkage values were ∼2% for white clay and ∼12% for green clay. The firing shrinkage was ∼9% in white clay and ∼6.5% in green clay. White clay lost more volume during firing, which could have led to its denser structure. The total shrinkage was ∼12% for white clay and ∼20% for green clay. This high total shrinkage in green clay could have negatively impacted its shape stability.
Basic ceramic properties of green and white clay samples determined at 1150°C.

The high water absorption rate of the white clay samples (53.85–54.73%) indicates that they have significant porosity. These pores considerably reduce the bending strength, leading to low mechanical strength (0.36–0.52 MPa). Excessive pores further increase defects in the internal structure, making it susceptible to breaking under load. By contrast, the low water absorption rate of the green clay samples (0.05–0.24%) demonstrates that they have a dense and compact structure. This tight structure significantly enhances their bending strength, allowing them to attain an exceptionally high bending strength value (26.10–27.11 MPa). The near-complete closure of the pores and the considerable development of the glassy phase are the primary reasons for this durability. The bending strength values of green clay samples are relatively high compared to traditional ceramics but lower than technical ceramics. This reflects the influence of the green clay mineral structure and the glassy phase formation. Compared to similar ceramic materials in the literature, this green clay is a suitable material for industrial and structural applications (Štubňa et al., Reference Štubňa, Šín, Trník and Vozár2014; Heyer et al., Reference Heyer, Bracq, Rossit, Moitrier, Gütter, Delorme and Lemonnier2023). The mineralogical and chemical compositions of the clays are compatible with the ceramic properties.
The densities of the white and green clay samples are comparable. However, there are differences when comparing the flow times of the slurries. The green clays’ first and second flow times were slower. The differences in the sludge flow times of the green clays may be due to their mineralogical and chemical compositions and intergranular interactions, although the two clays have comparable densities. Possible reasons for this situation are associated with the mineralogy of these clays: the montmorillonite and quartz of the white clay may induce a small and homogeneous particle size and may disperse more effectively in water and so reduce the viscosity, resulting in faster flow times. The celadonite and nontronite of the green clays can retain more water and exhibit larger or irregular particle structures. This results in a denser and more viscous mixture, which may also lead to longer flow times.
The smaller water-holding capacity of the white clay allows the sludge to achieve greater fluidity. In contrast, the high water-absorption capacity of the green clay causes the sludge to become thicker and more to flow with greater difficulty. Minerals such as celadonite and nontronite are particularly effective at binding water, which increases viscosity. The white clay may exhibit behaviours closer to Newtonian flow, characterized by low viscosity and high fluidity. Due to its more viscous structure, the green clay probably demonstrates plastic or thixotropic flow behaviours, increasing resistance during its flow and extending the flow time.
The thickness values (base, brim and sidewall) of the white clay indicate that it occupies a larger volume and may have a more porous structure. Minerals such as montmorillonite in the white clay can improve its water-holding capacity, resulting in the sludge maintaining a bulkier structure; however, its porous nature can negatively impact mechanical durability, leading to a reduced breaking load. The thickness values of the green clay are relatively low, suggesting that it has a denser and more compact structure. The presence of minerals with high iron contents, such as celadonite and nontronite, contributes to the sludge achieving a tighter and denser structure.
The low instant breaking load of the white clay can be attributed to the porosity of its structure and the weakness of its mechanical bonds. Although montmorillonite provides aesthetic and workability advantages, it offers limited improvement in terms of mechanical durability. The green clay’s relatively high instant breaking load may result from its greater iron content, which increases mechanical strength.
Red-firing clays are generally grouped together, indicating that there is substantial variation in their mineralogical composition, particle-size distribution and technological characteristics (Dondi et al., Reference Dondi, Raimondo and Zanelli2014). From a mineralogical standpoint, the dark-firing clay predominantly consists of phyllosilicates, which can range from 35 wt.% to over 90 wt.%, alongside quartz (up to 50 wt.%), carbonates (up to 50 wt.%), feldspars and rock fragments (up to 40 wt.%). Additionally, it contains iron oxyhydroxides (up to 15 wt.%) and various minor components, which depend on the origin of the clay deposits. These minor components may include organic matter, sulfides and sulfates, among others. When evaluating their mineralogical and chemical properties, thermal characteristics and firing colours at 850°C, 900°C and 950°C, Yazlıca clays emerge as alternatives to red-fired clay materials. The firing colours of the clays fired at 1150°C were white and black. In the 850–900°C range, hematite remains unreduced, creating a reddish colour in the ceramics. At low temperatures, these oxides affect colour because the formation of the vitreous phase is not dominant. At 1150°C, iron oxide may become too vitreous or combine with other components, resulting in a lighter colour, and the increase in the glassy phase at high temperatures can provide whiteness and opacity (Kingery et al., Reference Kingery, Bowen and Uhlmann1976).
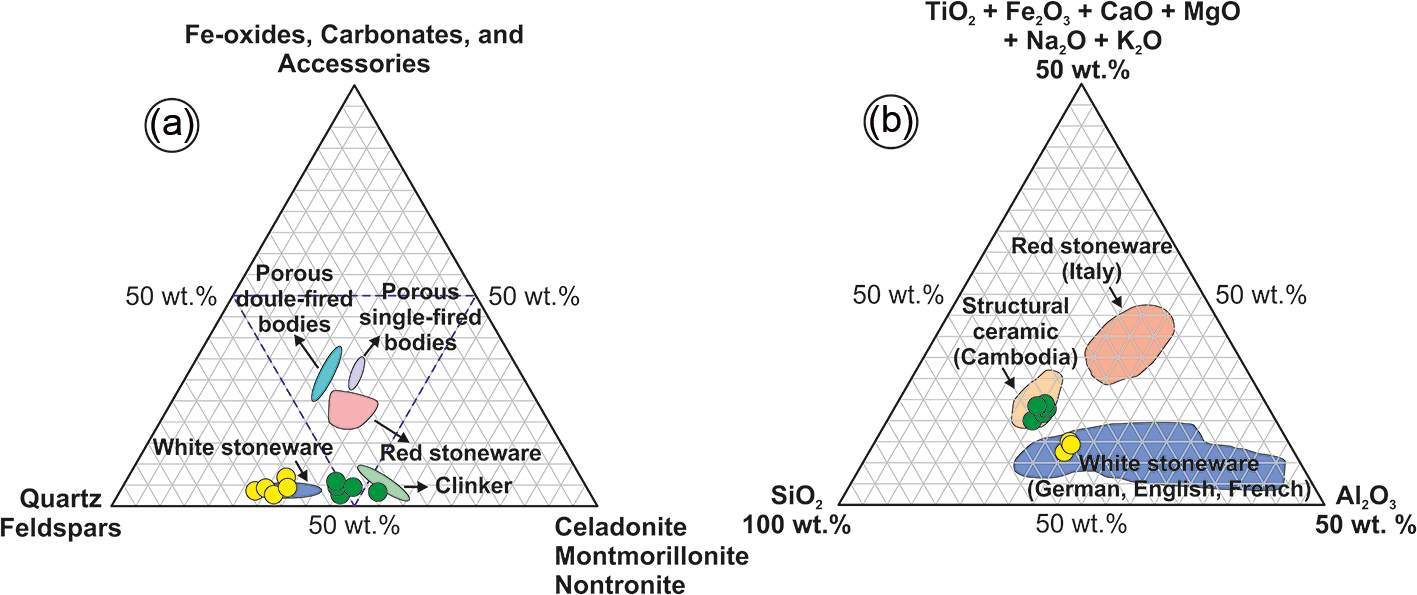
Ternary diagrams based on the mineralogical and chemical compositions of Yazlıca clays illustrate their industrial applicability (Fig. 16). These diagrams highlight the correlation between the ceramic properties of the white and green clays and their mineralogical and geochemical characteristics. Specifically, the white clay samples, characterized by high porosity and low mechanical strength, are suitable for low-load ceramic applications. In contrast, the green clay samples, noted for their compact structure and high durability, are ideal for technical and industrial ceramic uses.
Figure 16 presents a revised version of the mineralogical classification diagram originally proposed by Fiori et al. (Reference Fiori, Fabbri, Donati and Venturi1989). While the original diagram included a general clay minerals apex, it has been modified in this study to reflect the specific mineralogical composition of the Yazlıca clays: namely, celadonite, montmorillonite and nontronite. Although the internal classification fields (e.g. white stoneware, red stoneware and clinker) have been retained, their interpretation is now based on the mineralogical data derived from the studied samples. This modification allows for a more accurate assessment of the industrial ceramic potential of the clays.
(a) Ternary diagram modified from Fiori et al. (Reference Fiori, Fabbri, Donati and Venturi1989) classifying ceramic-based clay bodies according to their mineralogical content (yellow circles = white clays; green circles = green clays). (b) Triangular diagram of clay-rich materials based on chemical content modified from Fabbri & Fiori (Reference Fabbri and Fiori1985) (Cambodia data from Ngun et al., Reference Ngun, Mohamad, Sulaiman, Okada and Ahmad2011).

Figure 16 shows a ternary diagram based on bulk chemical compositions, adapted from the framework developed by Fabbri & Fiori (Reference Fabbri and Fiori1985) and supplemented with comparative data from international ceramic industries. In addition to structural ceramics from Cambodia (Ngun et al., Reference Ngun, Mohamad, Sulaiman, Okada and Ahmad2011), the diagram includes reference compositional fields for red stoneware from Italy and white stoneware produced in Germany, England and France. These zones allow for a broader interpretation of the Yazlıca clays within a global industrial context. The classification is based on the relative proportions of SiO2, Al2O3 and total fluxing oxides (Fe2O3 + CaO + MgO + Na2O + K2O), key parameters influencing ceramic behaviour during firing. The distribution of the Yazlıca clay samples across this ternary space reveals clear distinctions between highly siliceous, low-flux white clays and compact, flux-rich green clays. This compositional variation underlines their suitability for different ceramic technologies, ranging from traditional low-load applications to high-performance technical ceramics.
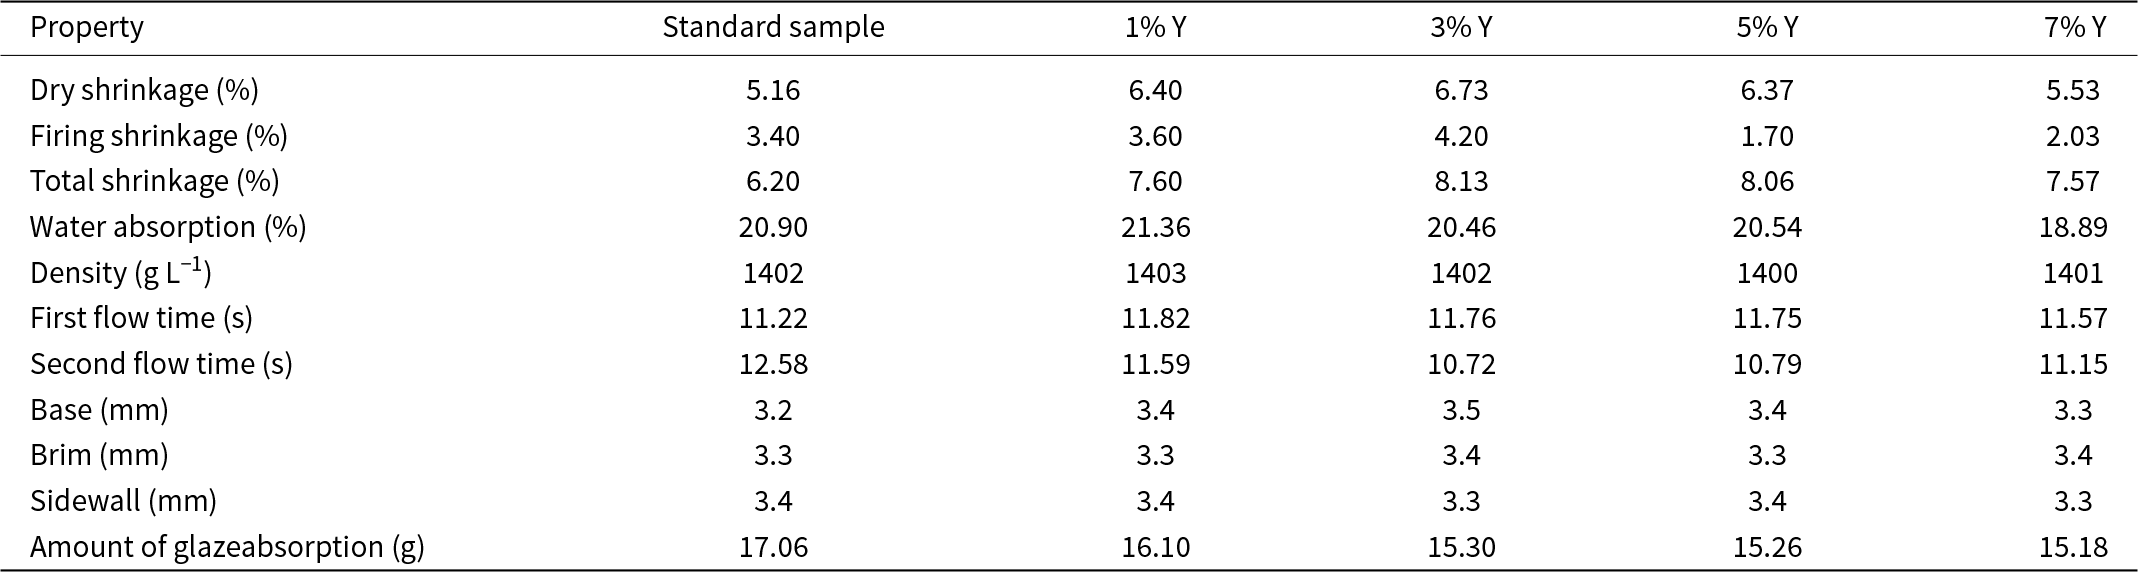
During the next step, the representative green clay (Y) was added as an extra additive to the recipe used for factory ceramic production and as a pigment in the glaze recipes due to the unfavourable properties of the white clay. The clay was added to the ceramic mass recipe at 1, 3, 5 and 7 wt.%, and the mixtures were fired in a roller kiln at 1150°C for 120 min. The basic ceramic properties determined after firing are listed in Table 7. The values for dry shrinkage, firing shrinkage and total shrinkage were 5.53–6.73%, 1.70–3.60% and 7.57–8.06%, respectively (Table 7). When considering the shrinkage and water absorption values based on the standard sample, recipes containing 7 wt.% green clay achieved the best results. Water absorption values were between 18.89% and 21.36%. The lowest water absorption value (18.89%) was observed for 7 wt.% green clay. Water absorption varied slightly with firing temperature. Above 1150°C, open porosities close, indicating reduced water absorption (Ece & Nakagawa, Reference Ece and Nakagawa2002; Yanık et al., Reference Yanık, Ceylantekin, Taşçı and Ü2012).
Ceramic properties of representative green clay (Y) sample added to existing masses.

The density values were comparable to the standard sample value. The casting slurry should have a density similar to the control slurry during the casting process. Similarities are evident when comparing the flow times of the slurries. The clay samples were compared to the standard sample’s recipe in the thickness measurement experiment. The primary purpose of this experiment was to identify any errors that may occur in the product shapes. Differences, such as accumulations at the base and thickenings at the mouth or cheeks, are considered errors during shaping. The comparison in Table 7 shows that the similar measurements of the base, mouth and cheek parts indicate homogeneous casting characteristics in terms of the shape of the mould.
After casting the samples, the glaze uptake during the glazing process was determined using a transparent glaze with a density of 1470 g L–1 during a mass firing at 1150°C for 120 min. Keramika Ceramics Company considers glaze uptake amounts of 15–20 g as suitable. At low glaze uptakes, the mass becomes visible on the final product surface, which is undesirable. Conversely, depressions on the glaze surface can be observed if the glaze uptake is high.
Previous work has studied the use of celadonitic clays as glaze pigments (Frizot, Reference Frizot1982; Delamare, Reference Delamare1987; Delamare et al., Reference Delamare, Delamare, Guineau and Odin1990; Béarat, Reference Béarat1996; Wallert & Elston, Reference Wallert, Elston, Béarat, Fuchs, Maggetti and Paunier1996; Moretto et al., Reference Moretto, Orsega and Mazzocchin2011). The green pigments used throughout the Roman Empire differed substantially. For instance, in Crete, the green colour was achieved by combining blue and yellow pigments. In Egypt, green pigments were copper based, whereas in the Roman region the most common green pigments appeared to be green soils primarily composed of celadonite and glauconite.
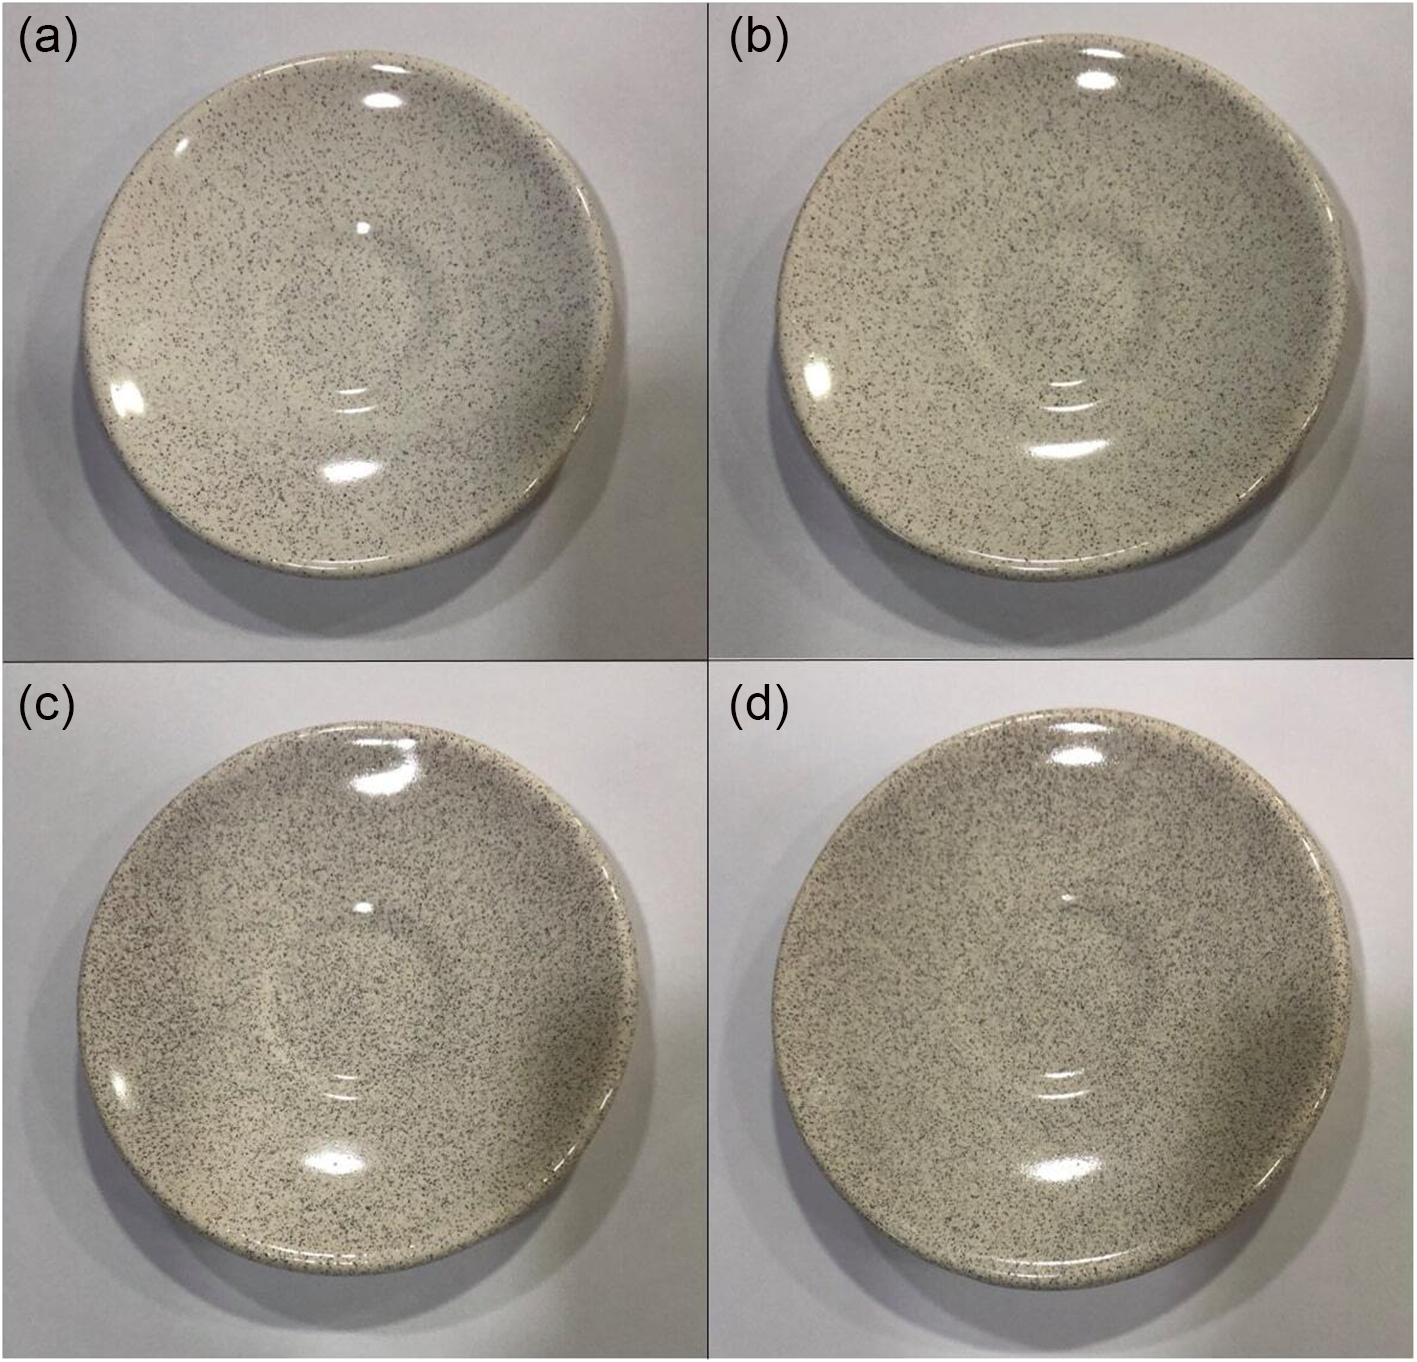
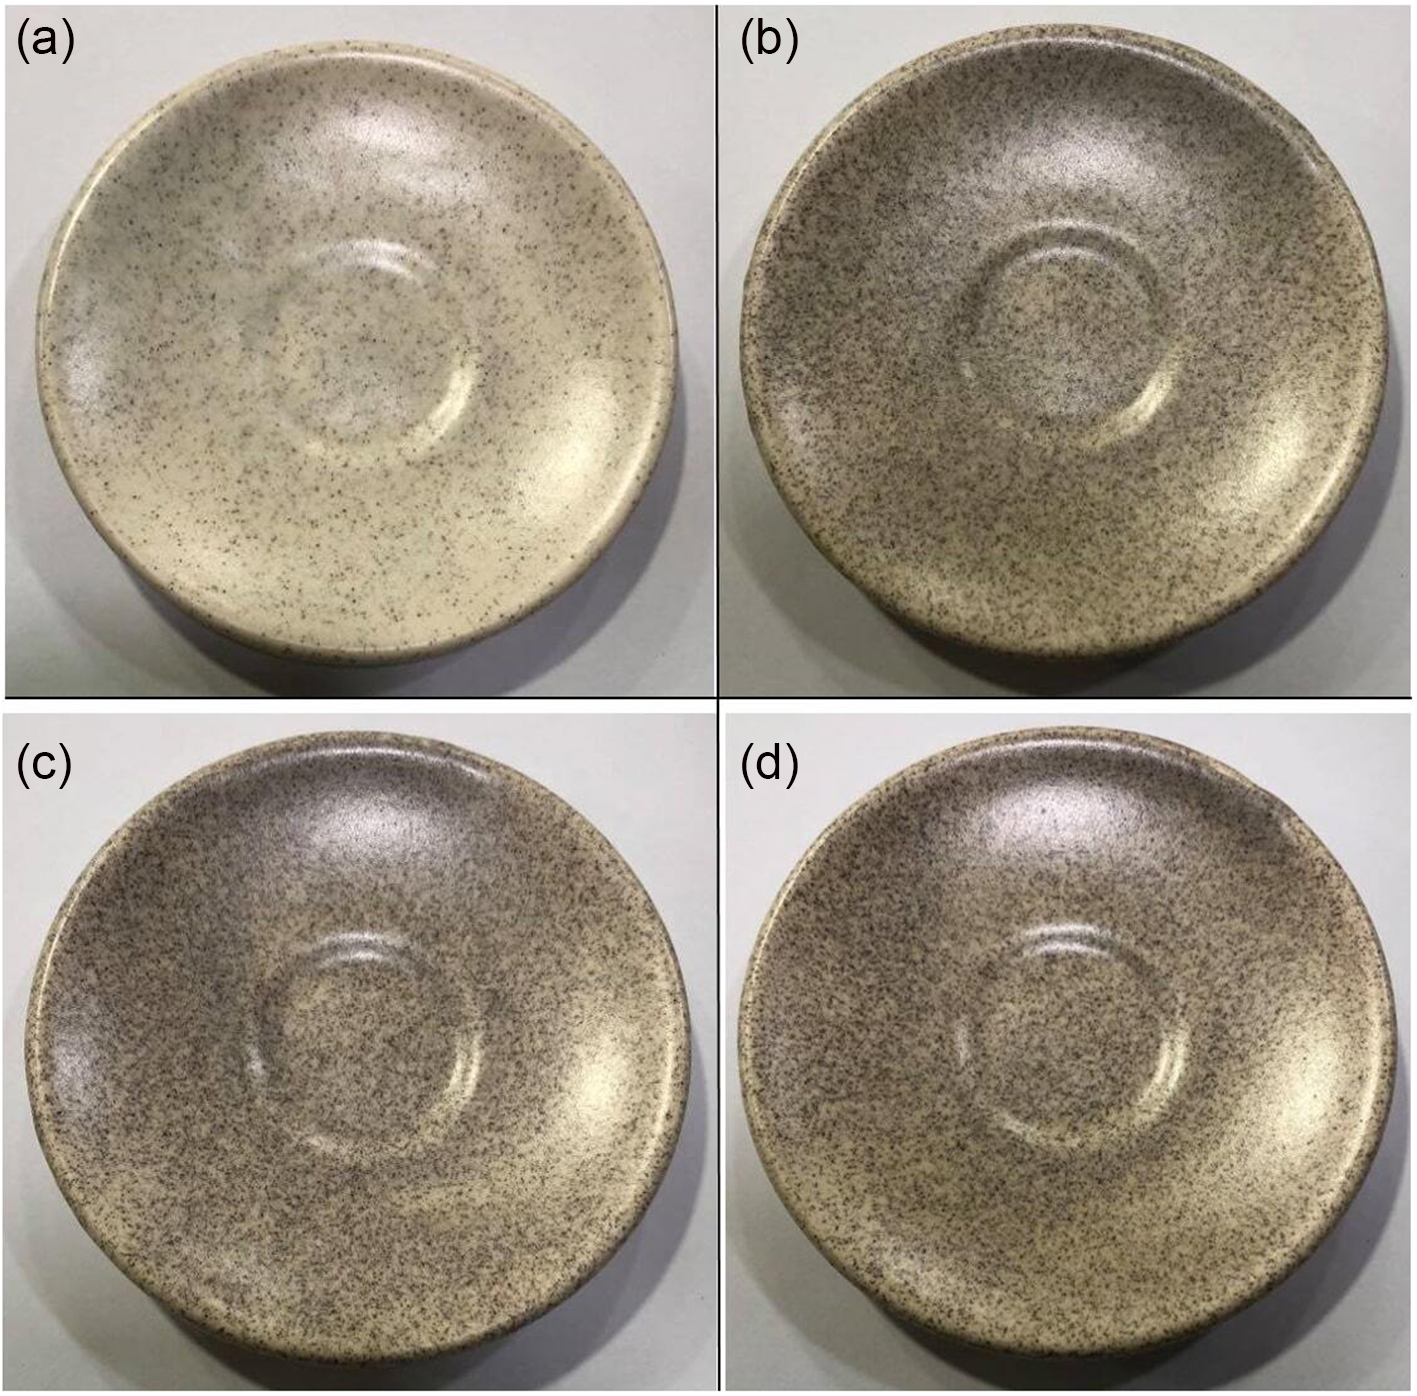
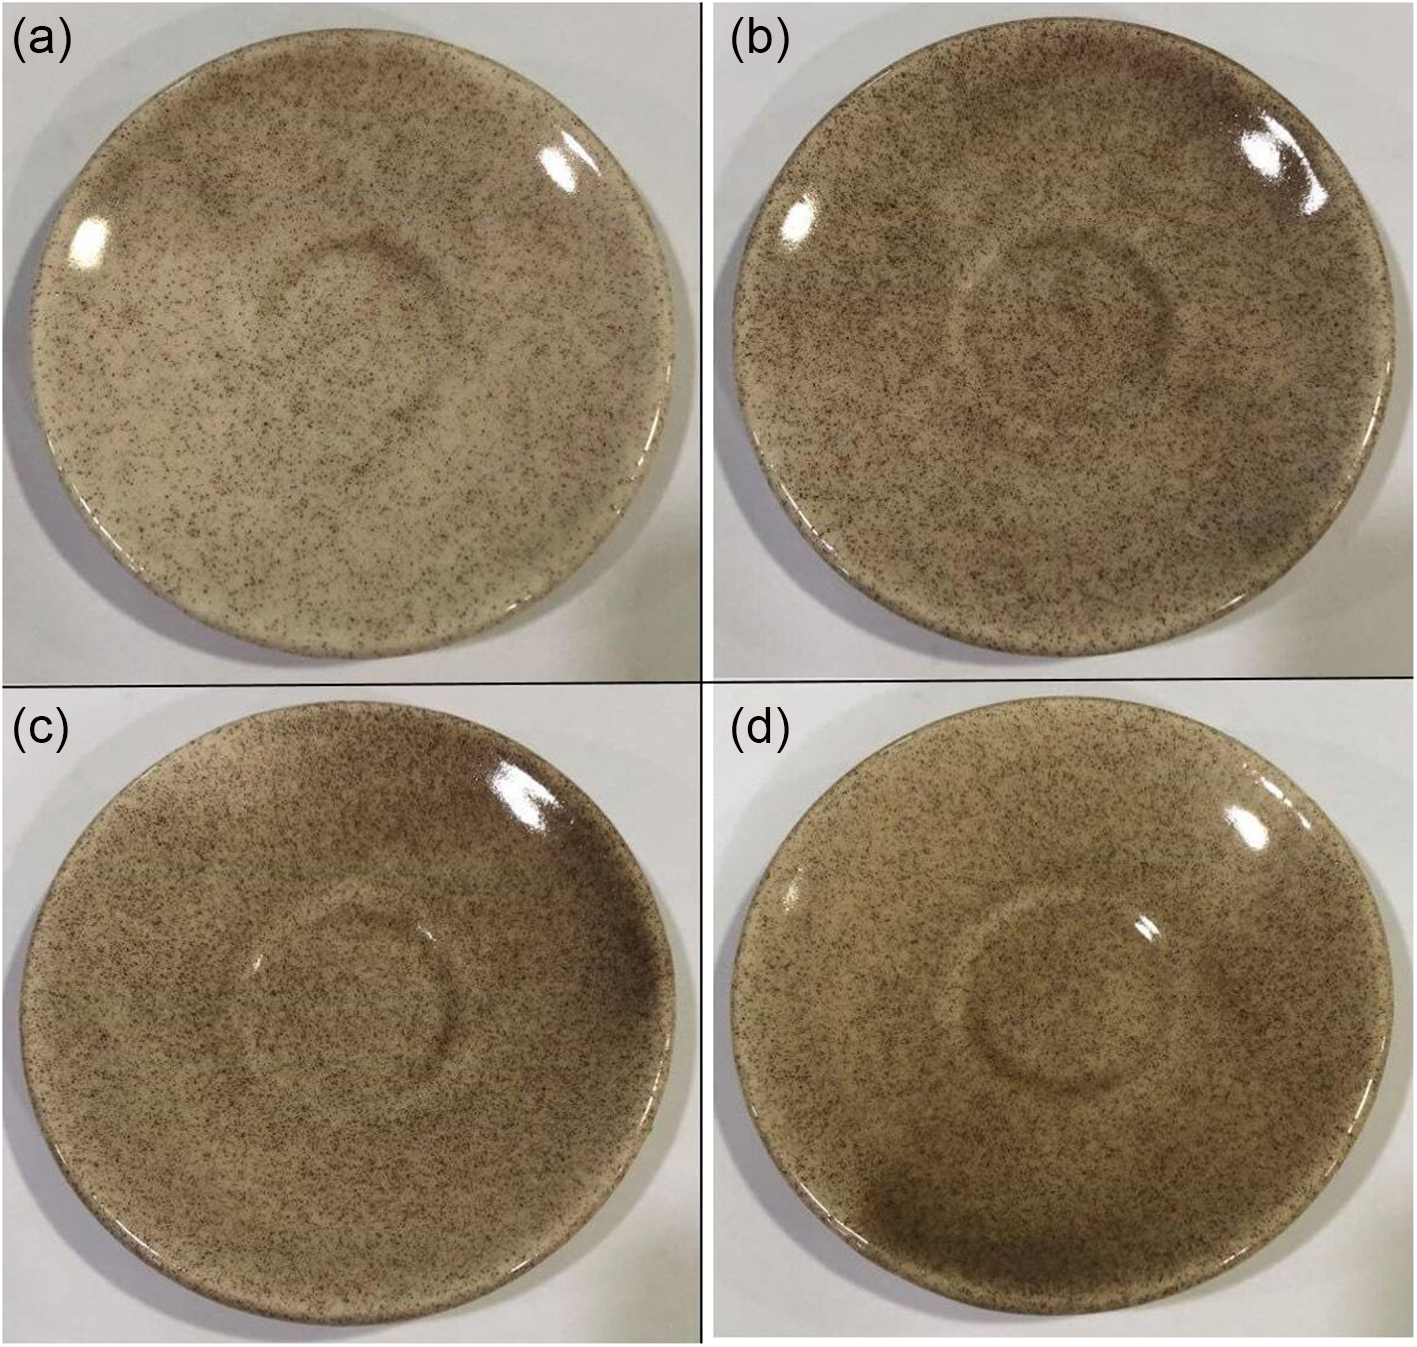
Laboratory trials showed that white clays did not yield positive results in this regard and failed to demonstrate any effect. However, the green clay created a visual impact by producing a granite-like appearance. The clay was incorporated into opaque, transparent and matte glazes at concentrations of 5, 10, 15 and 20 wt.% to investigate the usability of the green clay as a pigment. Table 8 displays the chemical compositions of the glazes used. The bases of the glazes consist of SiO2, Al2O3, BaO, CaO, Na2O and K2O. Transparent glazes give the ceramic surface a clear appearance, effectively showcasing the patterns or colours beneath the glaze. Among the basic components, the high concentration of CaO is particularly noteworthy. Opaque glazes cause the ceramic surface to reflect minimal light. The glaze formulation includes opacifying agents such as TiO2, ZrO2 and ZrSiO4. Matte glazes produce a non-reflective appearance by limiting light reflection on the ceramic surface. The matte glaze recipe includes ZnO, CaO, BaO and quartz to achieve the desired matte appearance (Table 8). Adding the green clay sample as a pigment produced a glaze with artistic surface effects, especially characterized by improved depth of colour and slight textural variations, which intensified with greater green clay content. The green clay having been added to the opaque glaze, to the matte glaze and to the transparent glaze is shown in Figs. 17, 18 & 19, respectively.
The pigment effects of green clays (samples Y-1 to Y-5) added to the in-factory opaque glaze recipes (green clay additions of (a) 5 wt.%, (b) 10 wt.%, (c) 15 wt.% and (d) 20 wt.%).

The pigment effects of green clays (samples Y-1 to Y-5) added to the in-factory matte glaze recipes (green clay additions of (a) 5 wt.%, (b) 10 wt.%, (c) 15 wt.% and (d) 20 wt.%).

The pigment effects of green clays (samples Y-1 to Y-5) added to the in-factory transparent glaze recipes (green clay additions of (a) 5 wt.%, (b) 10 wt.%, (c) 15 wt.% and (d) 20 wt.%).

Chemical analysis of the glazes used determining the pigment properties of the representative green clay.

To evaluate the resistance of the glazes prepared with green clay additives against cracking, glaze resistance assessments regarding the rapid cooling of the glaze on the ceramic body were conducted using the Harkort test. The Harkort test is crucial for assessing the quality of glazed articles (Plešingerová et al., Reference Plešingerová, Klapáč and Kovalčíková2002). The ceramic tableware was heated in a laboratory oven at 150°C, 160°C, 180°C and 200°C, maintaining each temperature for 1 h. Subsequently, the products were immersed in water at room temperature (20°C) and then inspected for any cracks in the glaze surface. Products that pass the 150°C test without cracking can remain crack-free for ∼3–4 months; those that pass the 160°C test can last ∼15 months without cracks; products that pass the 180°C test can remain crack-free for 2–3 years; and products that withstand 200°C without cracking can remain crack-free for longer periods (Yalçın & Sevinç, Reference Yalçin and Sevinç2000; Özdemir & Yılmaz, Reference Özdemir and Yılmaz2007; Haner & Haner, Reference Haner and Haner2014; Yıldızay & Kadıoğlu, Reference Yıldızay and Kadıoğlu2018). Table 9 lists the results for green clay samples mixed with opaque, matte and transparent glazes. Keramika Ceramics Company tested the addition of 5, 10, 15 and 20 wt.% green clay and did not observe adverse effects. Therefore, the samples are considered suitable as ceramic pigments.
Harkort test results of the final products obtained by adding 5, 10, 15 and 20 wt.% green clay samples to opaque, matte and transparent glazes for ceramic pigments.

Note: The value ‘+200°C’ indicates that the sample resisted thermal shock without visible surface cracks at 200°C.
Conclusion
The white and green clays from the Yazlıca (Ilıca-Kütahya) region were formed by weathering of basaltic rocks. The clays consist of montmorillonite, nontronite, celadonite, quartz, feldspar and Ti-magnetite. The mineralogy of the clay samples fired at 850°C, 900°C and 950°C consists of celadonite, sanidine, cristobalite, hematite, quartz and spinel.
Although the mineralogical composition of the white clay samples is comparable to that of the green clay samples, their high-water holding capacity can generate problems in ceramic products. Low durability and high porosity render the white clay ideal for ornaments, decorative ceramics and ceramic products with low load requirements. Its porous structure could also be useful for special applications such as insulation. The white clay could also be applied in industries requiring high swelling, such as drilling muds and animal litters. In addition, white clays can be used as additives in specific proportions to control the plasticity of clays with low plasticity, which are used in producing bricks and tiles.
The combination of high mechanical strength and low water permeability makes green clay-based flooring ideal for industrial ceramics exposed to heavy loads or used as waterproof coatings. Due to its high mechanical strength, the green clay could also be used in engineering ceramics or in the construction industry. According to ceramic test results, the green clay could be used as a 7 wt.% additive in red-firing ceramic masses. Additionally, adding the green clay to in-factory glaze recipes yielded visually appealing results. Incorporating the green clay into glaze recipes at 5, 10, 15 and 20 wt.% significantly improved this aesthetic effect. The clay samples turned red after firing at 850°C due to their high iron content.
In conclusion, the Yazlıca clays could be suitable for producing dark-firing floor and wall tiles, pottery and bricks. Therefore, they could be effectively utilized in the ceramic industry.
Financial support
The authors thank the Scientific Research Projects Coordinators (DPÜ-BAP) at Kütahya Dumlupınar University, who supported this study through project number 2022-58. We also thank the Scientific and Technical Research Council of Türkiye (TÜBİTAK) for their support through the TÜBİTAK 2210-D Domestic Graduate Scholarship Program for Industry through project number 121Y531. The researchers greatly appreciate the invaluable contributions of both institutions in facilitating this research.
Competing interests
The authors declare none.