1. Introduction: State capacity and growth
Does state capacity cause economic growth? The ability of the state to implement its aims is viewed by a large literature as exerting a positive effect on economic performance. This literature assumes that the state has a beneficial role to play in the economy, and focuses on the state’s ability to perform that role. It takes the historical association between state capacity and economic growth in rich economies over the past half-millennium to imply that state capacity had a causal effect on that growth, though disagreements remain about the precise mechanisms. Modern poor economies are advised to expand their state capacity in order to follow the historical path marked out by rich economies.
This article uses economic history to probe the relationship between state capacity and economic growth between 1500 and 1850, the period of the ‘Great Divergence’ when European economies pulled ahead of other continents and the ‘Little Divergence’ when the north Atlantic economies outpaced the rest of Europe.
It begins by scrutinising fiscal capacity, the main measure of state capacity. It asks whether fiscal capacity is a good measure of state capacity, how closely it was associated with economic growth, and whether we can be sure that any association was causal.
Yet state fiscal capacity is a cost to the economy. Any economic benefits come from state expenditures. What does the historical development of state expenditures tell us about how state capacity might have benefitted the economy? States, it turns out, devoted the lion’s share of expenditures to waging war and servicing military debts, allocating only a tiny portion to civilian purposes.
The article continues by investigating five crucial state activities with the potential to affect the economy: waging war; providing law and administration; building infrastructure; pursuing industrial policy; and fostering a national culture. Did these state activities promote economic growth?
The article concludes by considering what economic history tells us about state capacity and economic performance. Does having a lot of capacity imply that the state uses it to improve economic performance? What other characteristics does a state need in order to play a positive role in economic growth?
2. Measuring state capacity
To assess the effects of state capacity, we need to measure it. Almost invariably, state capacity is measured in terms of fiscal capacity, which has left the best historical records. Fiscal capacity is defined as the money revenues collected by the central state. These central state revenues are typically expressed in terms of per capita day wages, grams of precious metal, the share of GDP, or total revenue deflated by nominal GDP, but all display three salient features between 1500 and 1850. First, both rich and poor economies saw a rise in fiscal capacity. Second, fiscal capacity grew earlier on average in rich than poor economies. And third, fiscal capacity was higher on average in rich than poor economies. Taken together, these three features are held to show that fiscal capacity caused economic growth.
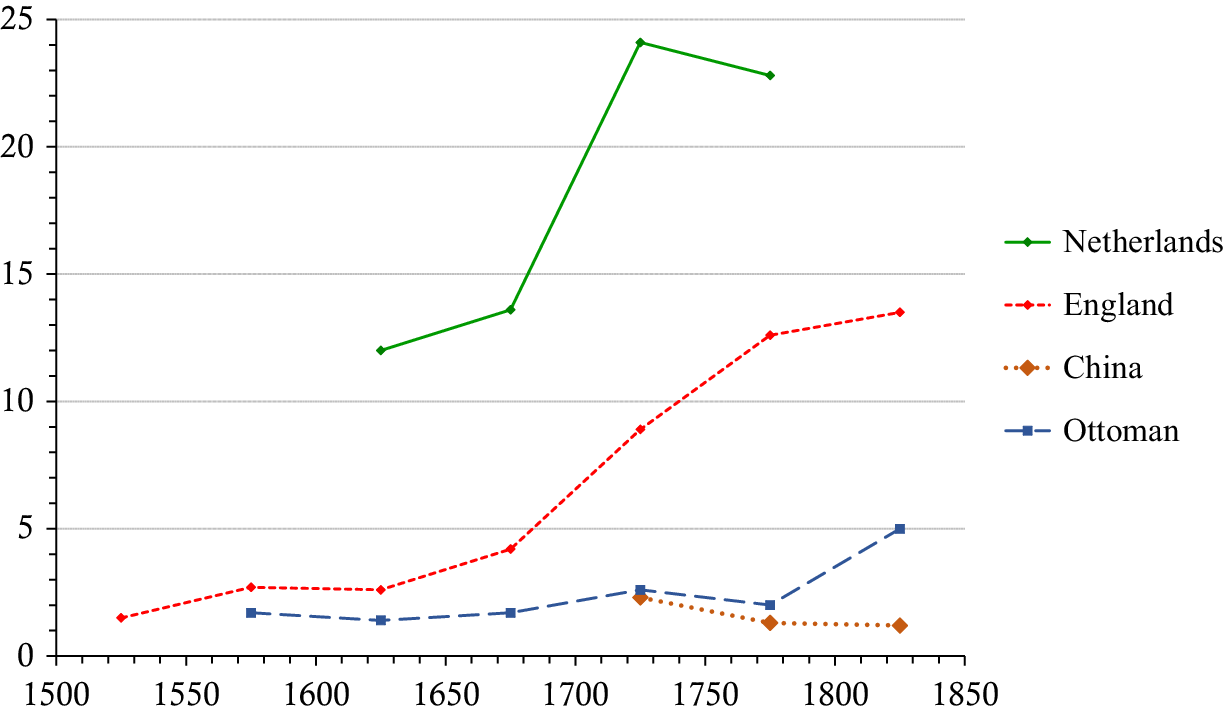
The stylized empirical association that underlies this conclusion can be seen in figure 1, which shows the historical development of per capita tax revenues expressed as days’ wages for urban unskilled workers in northwest Europe, China and the Ottoman Empire. In the sixteenth and seventeenth centuries, England and the Ottoman Empire were not too far apart, with per capita fiscal capacity of 2–3 days’ wages, though the Netherlands was much higher at around 12 days. But after 1650, fiscal capacity in northwest Europe increased, while it flat lined in the Ottoman Empire. After 1700, fiscal capacity in China came into view at the same low level as the Ottoman lands, while northwest Europe continued its rapid rise. After 1800, fiscal capacity in the Ottoman lands ticked upwards but remained far below northwest Europe, while in China it actually declined.
Central state revenues per capita in days’ wages for urban unskilled workers, Western Europe, China and the Ottoman Empire, 1500–1850.
Source: Henriques et al. (Reference Henriques, Freire Costa and Palma2022, table 1).

Fiscal capacity thus increased centuries earlier and reached much higher levels in rich Europe than in poor China or the Ottoman lands. Superficially this might seem to imply a positive association between fiscal capacity and economic growth. But did fiscal capacity and development move in lockstep? Did the most developed economies always have the highest fiscal capacity?
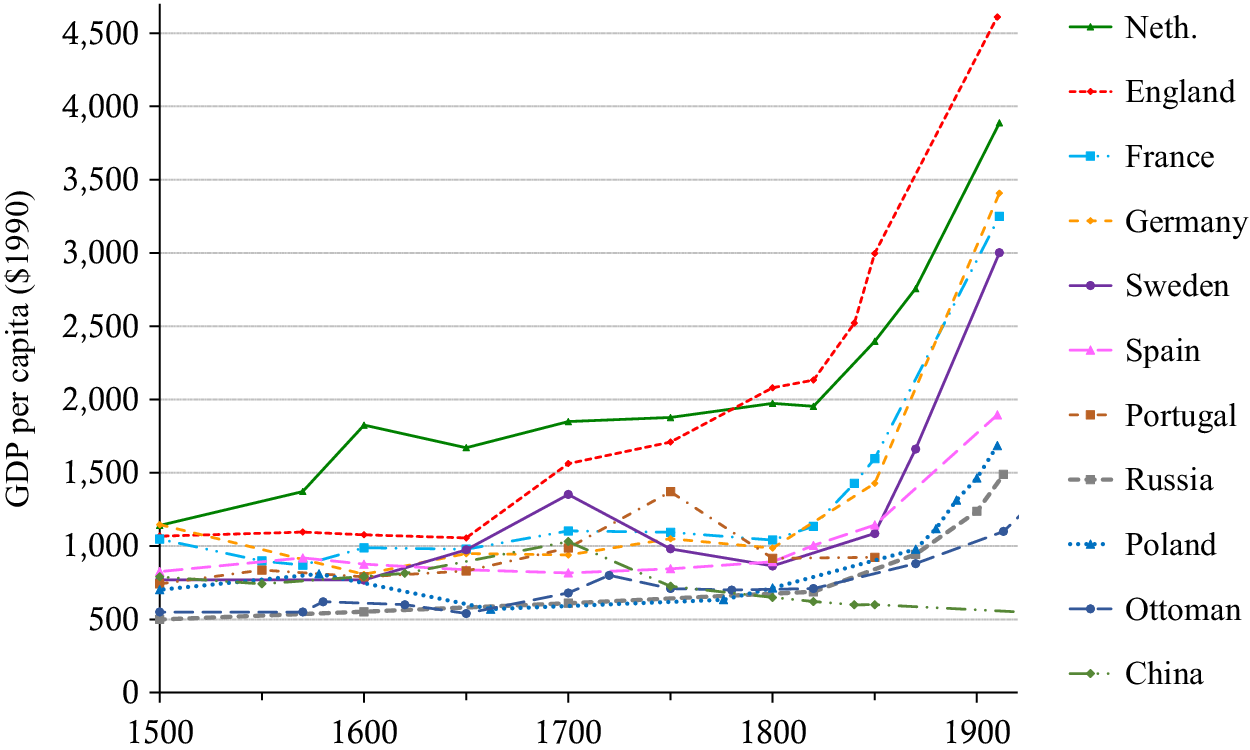
Looking at a wider range of countries helps answer this question. Figure 2 shows the historical development of per capita GDP in a much wider array of states.
GDP per capita ($1990) in Europe, China and the Ottoman Empire, 1500–1914.
Source: Netherlands, England and Spain: Broadberry, Guan and Li (Reference Broadberry, Guan and Li2018); France: Ridolfi and Nuvolari (Reference Ridolfi and Nuvolari2021); Germany and Sweden: Broadberry (Reference Broadberry2016); Portugal: Palma and Reis (Reference Palma and Reis2019) (Broadberry, Reference Broadberry2016 for 1500); Russia: Maddison vertical file (Former USSR); Poland: Malinowski and van Zanden (Reference Malinowski and van Zanden2017) (pre-1870), Koryś and Tymiński (Reference Koryś and Tymiński2021) (1870 onwards); Ottoman: Pamuk (Reference Pamuk2006, Reference Pamuk2017) and Pamuk and Shatzmiller (Reference Pamuk and Shatzmiller2014); China: Broadberry, Guan and Li (2021) and Pamuk (2019).

GDP per capita varied hugely in this period, with northwest Europe (basically just England and the Netherlands) rich and fast-growing, but central and southern Europe poorer and quite stagnant, and Eastern Europe very poor and sometimes declining further. Even different parts of northwest Europe followed quite different growth paths. England saw uninterrupted growth in per capita GDP from 1650 onwards and after 1760 the first-ever Industrial Revolution. The Netherlands grew rapidly in the Dutch Golden Age between 1500 and 1670 and became the ‘miracle economy’ of Europe. But after 1670 it stagnated at a high level, only resumed growth after 1820, and industrialised late by European standards. The rest of Europe also varied greatly. France, Germany and Spain experienced little net economic improvement between 1500 and 1800 and only began to grow in earnest after 1800. Sweden and Portugal followed the same pattern except for brief peaks in 1700 and 1750, respectively. Russia and Poland were the poorest economies in Europe, stagnated or even declined between 1500 and 1800, and achieved only slow growth up to 1914. China and the Ottoman lands resembled Russia and Poland in experiencing centuries of stagnation or decline, except for China’s brief efflorescence around 1700.
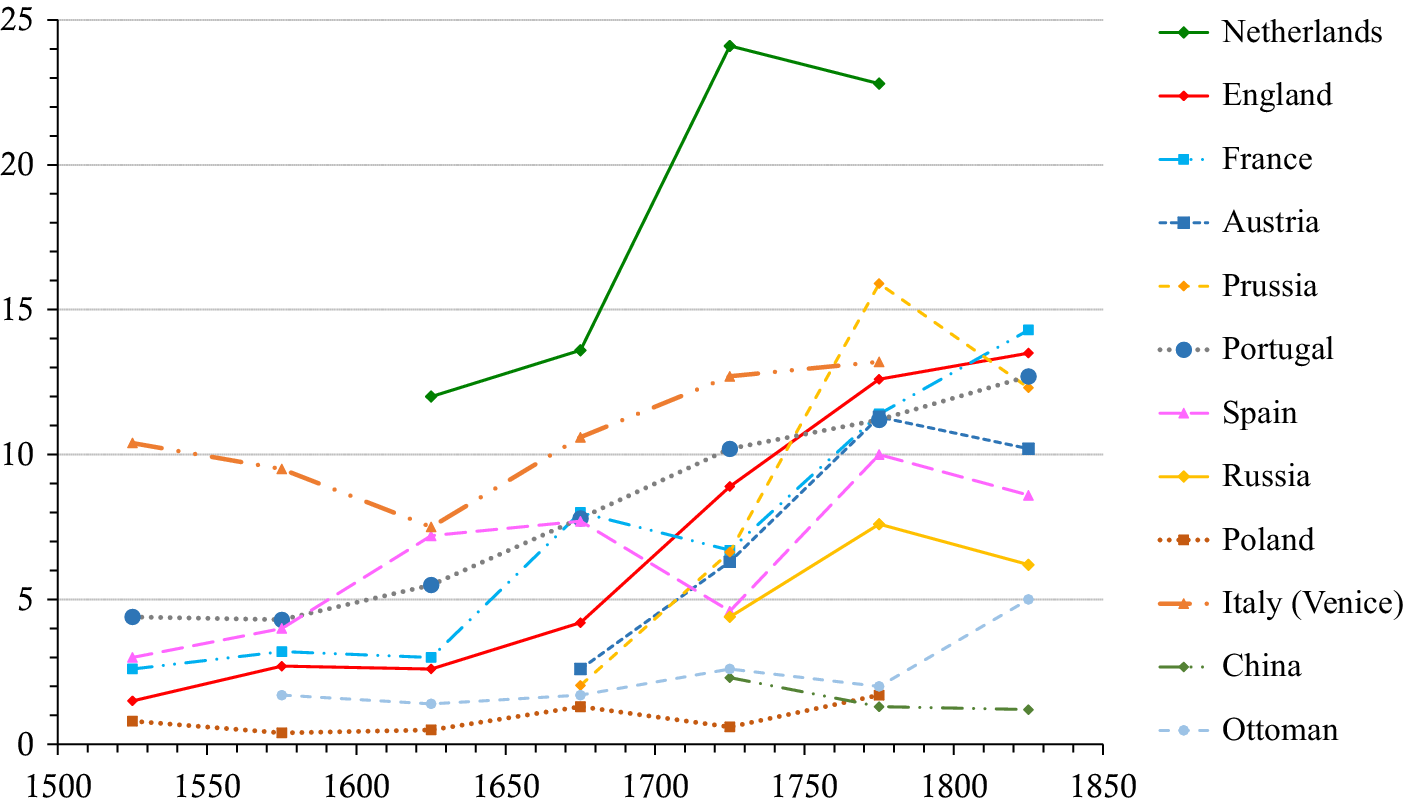
How does fiscal capacity map onto these divergent growth patterns? Figure 3 shows tax revenues per capita as days’ wages for an unskilled urban worker in a similar pool of European countries, plus China and the Ottoman lands.
Central state revenues per capita in days’ wages for urban unskilled workers, Europe, China and the Ottoman Empire, 1500–1850.
Source: Henriques et al. (Reference Henriques, Freire Costa and Palma2022, table 1) (all countries except Prussia); Karaman and Pamuk (Reference Karaman and Pamuk2010, 615) (online data file) (Prussia).

Comparing figures 2 and 3 does suggest a rough association between fiscal capacity and per capita GDP. But it only holds at the extremes. The Netherlands had the highest fiscal capacity in figure 3 and also the highest per capita GDP in figure 2, though it stagnated after 1670. Conversely, Poland, Russia, China and the Ottoman Empire had the lowest fiscal capacity in figure 3 and also the lowest per capita GDP in figure 2.
But away from the extremes, there is no clear association between fiscal capacity and economic growth. England had high and growing per capita GDP from 1650 onwards. But for 150 years its fiscal capacity resembled that of slow-growing France, Prussia, Spain and Portugal. England did not develop high fiscal capacity until nearly 1800, after 150 years of rapid economic growth and 40 years of industrialisation. Even then, fast-growing and early-industrialising England had much lower fiscal capacity than the slow-growing and late-industrialising Netherlands. By 1750, Prussia had nearly the highest fiscal capacity in Europe after the Netherlands, but its economy remained poor and stagnant and it industrialised late. Stagnant France and Portugal had very similar fiscal capacity to England in the first half of the nineteenth century.
Similar patterns emerge from other measures of fiscal capacity such as the absolute value of state revenues in silver or gold, state revenues as a share of GDP, and state revenues deflated by nominal GDP (Henriques et al., Reference Henriques, Freire Costa and Palma2022; Karaman and Pamuk, Reference Karaman and Pamuk2010, Reference Karaman and Pamuk2013; Pamuk, Reference Pamuk2021). Fiscal capacity and per capita GDP were roughly associated. On average, fiscal capacity was high in very rich economies and low in very poor ones. But poor and stagnant economies such as seventeenth-century France, eighteenth- and nineteenth-century Germany, and nineteenth-century Portugal and Russia had high fiscal capacity which did not appear to generate much economic growth. The Netherlands had by far the highest fiscal capacity, but experienced economic stagnation after 1670 and late industrialisation. Only England had both economic growth (after c. 1650) and high fiscal capacity (by the later eighteenth century).
Moreover, as we know, association does not imply causation. Fiscal capacity might cause economic growth. But economic growth might cause fiscal capacity. Rich societies are more likely to have big governments because they can afford them. Besides, fiscal capacity and economic growth are both influenced by underlying factors.
One study addresses these problems by analysing the relationship between fiscal capacity and per capita GDP across 11 European states between 1650 and 1913, controlling for other variables. It finds that higher per capita state revenues and fiscal centralization were associated with higher per capita GDP, from which it concludes that ‘state capacity is an important determinant of long-run economic growth’ (Dincecco and Katz, Reference Dincecco and Katz2016, 189).
But this analysis suffers from serious flaws. For one thing, its dating of fiscal centralization in England to 1066 and in all other states to post-1790 greatly exaggerates inter-state differences in establishing uniform national tax systems (see the very different dating for medieval England in Ormrod, Reference Ormrod and Bonney1999). More seriously, the study only has per capita GDP measures for 1600, 1700, and 1820–1913, assigning values to the missing years using linear interpolation. There is no reason to believe that linear interpolation will provide accurate annual values, and other literature finds that annual per capita GDP 1270–1870 shows ‘a clear alternation of periods of positive and negative growth over periods of a decade or more’ (Broadberry and Wallis, Reference Broadberry and Wallis2016, 8–9). Furthermore, the lack of actual GDP data for all but 2 years before 1820 vitiates the causal claim advanced in the study, which is based on per capita GDP rising in the decades after fiscal capacity changed. Of course, even if linear interpolations across periods of a century or more could reveal decadal responses, the fact that A happened before B does not show that A caused B. Indeed, the study itself admits that its estimates ‘are not causal in nature’ but merely highlight ‘novel data patterns’ (Dincecco and Katz, Reference Dincecco and Katz2016, 200). There is thus no evidence that fiscal capacity exercised a causal influence on economic growth.
3. A flawed measure
But are we even measuring fiscal capacity properly? Economists focus on fiscal capacity to measure the resources a state can spend on activities that might benefit the economy. This means we need to include all resources the state has at its disposal. But fiscal capacity focuses solely on money revenues raised by the central state. This measure leaves out key components such as money taxes levied by lower levels of government and non-monetary levies such as coerced labour and tributes in kind. It also ignores the composition of state revenues, especially the balance between tax and non-tax revenues.
Even in centralised states, let alone in composite or federal ones, the state levied taxes not just at the centre but also at the level of province, district or locality. It might be argued that if we define state capacity as involving state centralization, the only revenues that matter are those of the centre. But there are several objections to this idea. First, when the state delegates taxation to lower levels of government, the entity engaged in those activities is still the state, and thus the revenues collected must be included in state resources. Second, if we are interested in state activities that affect economic performance, lower levels of the state may be more important because they are better informed, better scrutinised, or more responsive to citizens. Third, pre-modern central states often mandated that provincial or local governments carry out particular activities and raise the money to do so. Finally, can we be sure that centralised states have greater capacity than federal or devolved ones? Surely this is a hypothesis to test rather than an axiom to accept unquestioningly.
Non-central state revenues comprised a share of the total that varied greatly across states and time-periods but was never negligible. Ignoring it distorts our understanding of which states had high fiscal capacity at which dates. A recent analysis of Portuguese taxation between 1412 and 1844, for instance, found that municipalities raised revenues that averaged about 10 per cent of central state revenues but varied greatly across cities and time-periods, from a low of 3.6 per cent to a high of 13.6 per cent (Henriques et al., Reference Henriques, Freire Costa and Palma2022, 15–9). In Britain, local taxes amounted to c. 10 per cent of the level of central taxes in 1750, 15.4 per cent in the 1770s, 14.5 per cent in 1830 and 30 per cent in 1870–1900 (Mathias, Reference Mathias2011, 117). In the USA, local and state-level taxes comprised 58 per cent of the total in 1840, rising to 64 per cent by 1900 (Wallis, Reference Wallis2000, 64). In 1880, local government accounted for an estimated 25–27 per cent of state expenditures even in highly centralised Britain and France, 30 per cent in Japan, 51 per cent in the USA and 72 per cent in Germany (Mann, Reference Mann1986, II: 363–4; Tanimoto, Reference Tanimoto, Masayuki and Wong2019, 30). Ignoring revenues collected by lower levels of the state ignores an important component of state resources. Moreover, since the share of state revenues collected away from the centre varied across time and space, central revenues are not a good proxy for total fiscal capacity.
Some taxes were levied by the central state and are thus included in measures of fiscal capacity, but were collected by local elites. This typically meant that the central state recorded them inaccurately or controlled them incompletely. In early modern China, for instance, many taxes were collected at the local level, but local administrators falsified fiscal reports to the centre, creating large and unobservable errors in central fiscal capacity (Lewis, Reference Lewis, Monson and Scheidel2015, 293–4). In France in 1609, only 20 per cent of direct taxes collected by the central state were transported to Paris; the other 80 per cent were controlled by local elites (Hoffman, Reference Hoffman, Hoffman and Norberg1994, 230–1). In Languedoc in 1677, 33 per cent of central taxes passed directly to local notables and another 19 per cent were allocated under their direction. Even inside France in 1609, provinces differed greatly, with Normandy delivering a high share of its tax revenues to Paris while Riom delivered just 0.7 per cent. French fiscal capacity was high and rising in the seventeenth century, as figure 3 shows, but a low and variable share of this capacity was actually controlled by the centre.
Fiscal capacity also excludes resources extracted in kind. Many European states did not pay money wages to soldiers or military auxiliaries, but instead extracted labour coercively through conscription and corvée (Kiser and Levi, Reference Kiser, Levi, Monson and Scheidel2015, 559; Scott, Reference Scott and Storrs2009, 47–8). In early modern Russia, the central state had low fiscal capacity in monetary terms but fielded large armies of conscripts supported by the forced labour of serf auxiliaries to provide transport, repair roads, build camps, dig trenches, and position siege guns; in one case, coerced serf auxiliaries numbered 13,000 for an army of 35,000 soldiers (Davies, Reference Davies and Lenman2013, 202; Scott, Reference Scott and Storrs2009, 47–8). In eighteenth-century France, an estimated one-third of the army in time of war consisted of conscripted militias rather than paid soldiers (Kroener, Reference Kroener and Contamine2000, 209). In eighteenth-century Prussia, Frederick William I expanded the army to encompass 4 per cent of the population, not by using fiscal capacity to pay them market wages but by coercively conscripting civilians and paying them much less than their civilian earnings (Kroener, Reference Kroener and Contamine2000, 212–3). In the mid-eighteenth century, the English Secretary at War contrasted the paid soldiers of the British Army with the ‘compulsive methods’ used by continental European armies, where a large proportion of soldiers were conscripts who received lower than market wages or no pay at all (Conway, Reference Conway, Linch and McCormack2014, 25; Scott, Reference Scott and Storrs2009, 47–8).
States also levied coerced labour for public works. In France in 1789, corvée levied for roadbuilding was not included in fiscal capacity, but its estimated value was 20 million livres, 4 per cent of official fiscal capacity (Roche, 1998, 49; Sargent and Velde, Reference Sargent and Velde1995, 481). In eighteenth- and nineteenth-century Poland, the state levied 10 days of corvée labour annually from each hearth-owning resident for public works; though reduced to 8 days after 1819, commutation of labour to money payments was inconsistent and poorly recorded into the 1840s and cannot have been included in official fiscal capacity (Rutkowski, Reference Rutkowski2017, 164–6). Coerced labour thus expanded the resources available to the state in France, Prussia, Poland, and Russia beyond what was measured by their fiscal capacity alone, especially compared to states such as England which paid soldiers and labourers on public projects a market wage.
States levied taxes in kind as well as money (Scott, Reference Scott and Storrs2009, 47–8). In eleventh-century China, 20 per cent of taxes were levied in grain and 2 per cent in textiles (Liu, Reference Liu2015, 52). In sixteenth- and seventeenth-century Switzerland, the state levied many taxes in kind because it had rising numbers of officials paid in kind rather than money (Körner, Reference Körner and Bonney1999, 333, 344). In sixteenth- and seventeenth-century Savoy, the state levied 30,000 sacks of corn annually in peacetime and doubled the quota in wartime (Capra, Reference Capra and Bonney1999, 429). In nineteenth-century Sri Lanka, most taxes were levied as the output of specific fields combined with villagers’ coerced labour to cultivate them (Roberts, Reference Roberts1968). As these examples illustrate, any measure of state revenues that includes only money taxes will underestimate fiscal capacity in states where taxes are paid in kind (Hoffman, Reference Hoffman2015, 307–8; Kiser and Levi, Reference Kiser, Levi, Monson and Scheidel2015, 559; Scott, Reference Scott and Storrs2009, 47–8). A state in a less monetized economy will misleadingly appear to dispose of fewer resources than one in a more monetized one.
Fiscal capacity also ignores the composition of state revenues, even though the balance between direct taxes, indirect taxes, and non-tax revenues affects both economic growth and state capacity. Reliance on non-tax revenues, for instance, typically reduces fiscal legibility, limits parliamentary consultation, impedes bureaucratic capacity, and imposes deadweight losses on the economy (Besley and Persson, Reference Besley, Persson, Auerbach, Chetty, Feldstein and Saez2013, 95–8; Bonney, Reference Bonney1999, 10; Queralt, Reference Queralt2019). This might not matter if the share of non-tax revenues was small or invariant across time and space. But it was not.
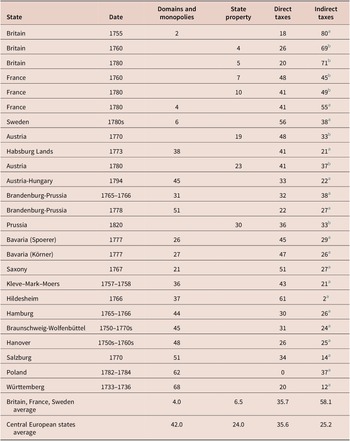
Even in the later eighteenth century, as table 1 shows, the share of non-tax revenues was low in some states but high in others. Taking the most comprehensive estimates, ‘domains and monopolies’ averaged just 4 per cent of state revenues in northwest Europe but 42 per cent in central Europe. Within central Europe, the share ranged from 21 per cent in economically advanced Saxony to over 60 per cent in backward Württemberg and Poland. The share also varied over time in the same state, as in Brandenburg-Prussia where domains and monopolies provided over 75 per cent of state revenues in 1653, 20 per cent in 1680, 50 per cent in 1780, 20 per cent in 1860 and 70 per cent in 1895 (Spoerer, Reference Spoerer and Cavaciocchi2008, 788–9).
Percentage of state revenues derived from state domains and monopolies, direct taxes, and indirect taxes, various European states, second half of eighteenth century

a Spoerer (Reference Spoerer and Cavaciocchi2008, 790, table 1). Domains and monopolies = net revenues derived from princely and public economic activities beyond mere tax- or fee-collecting, typically involving revenues from domains and forests and regalian revenues from mines, saltworks and other monopolies.
b Mann (Reference Mann1986, vol. II, p. 382, table 11.6). State property = percentage of state revenue derived either from royal or from nationalised property or from selling government privileges and monopolies. State revenue excludes loans. Austria, Britain and France for central government only; Prussia combines central and regional government.
Reliance on non-tax revenues affected both economic growth and state capacity itself. Many states derived revenues from operating state enterprises, granting monopolies to special-interest groups, or selling mercenary services to other states, all of which had repercussions for economic growth (Ogilvie, Reference Ogilvie2019, 46–69; Wilson, Reference Wilson1995). Many extracted non-tax revenues from overseas colonies, discouraging the development of state capacity at home (Henriques et al., Reference Henriques, Freire Costa and Palma2022, 2–5). Many deliberately fostered non-tax revenues to avoid consulting or compromising with parliament over taxation (Spoerer, Reference Spoerer and Cavaciocchi2008, 789).
These flaws in measuring fiscal capacity matter. The same aggregate fiscal capacity affects economic growth and state capacity differently where it is based on state domains and monopolies rather than taxation. Neglecting non-central taxes, corvée, conscription, and in-kind tributes underestimates state resources more in some societies than others. At any given time, fiscal capacity will appear lower in poor economies not necessarily because the state has fewer resources but because it relies on non-central or non-monetary extraction. Conversely, fiscal capacity will appear to rise with economic growth simply because a society becomes more monetized, moves away from labour coercion, or both. An apparent gap in fiscal capacity between rich and poor economies may thus not reflect true differences in the resources the state has at its disposal but rather approaches to measurement, specifically measuring fiscal capacity through the lens of advanced rich economies.
4. State spending is what creates benefits
Even if fiscal capacity is flawlessly measured, it does not measure state capacity. This is because fiscal capacity does not tell us what the state actually does with its revenues. Does having a lot of revenue imply that a state uses it to promote economic growth? What if the state spends its fiscal capacity on waging war or building palaces?
State expenditures are much less comprehensively researched than revenues. But we have good data for Britain, the fastest-growing economy in Europe after c. 1650 and the earliest in the world to industrialise.
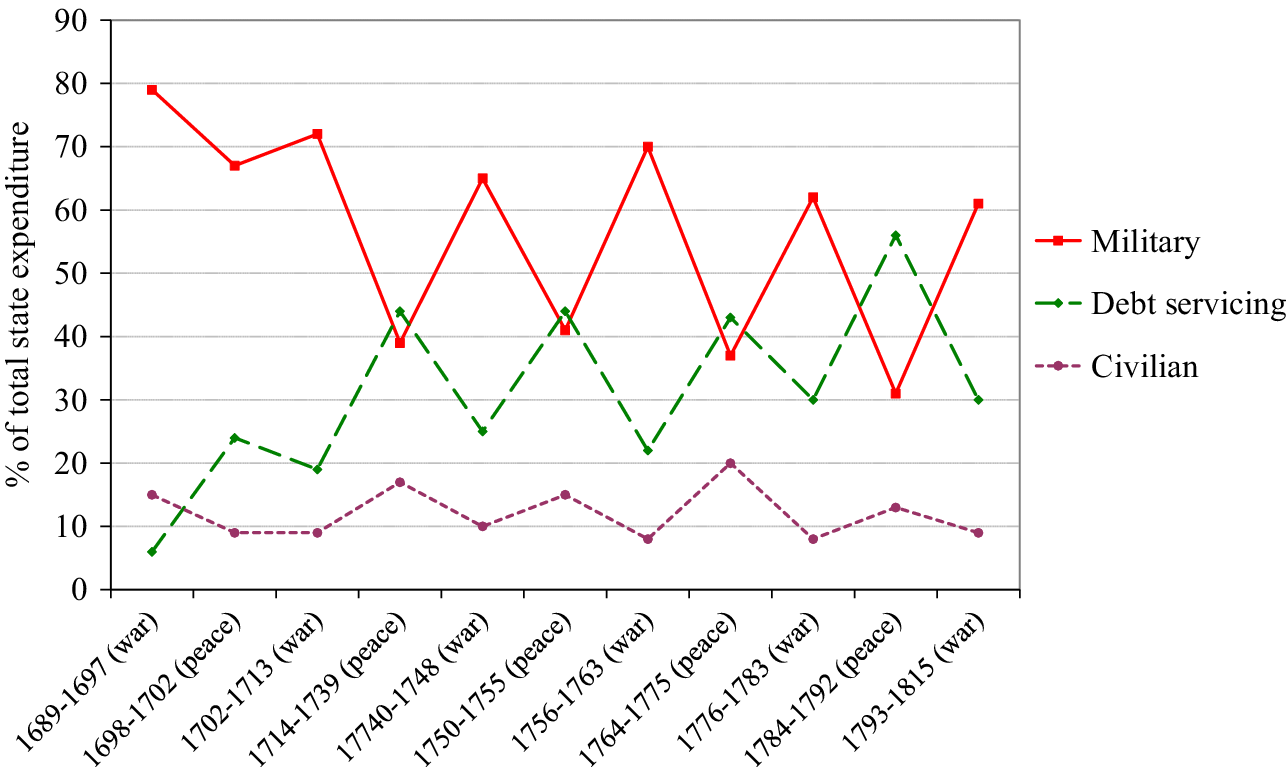
As figure 4 shows, most British state expenditures between 1688 and 1815 were military. In wartime, direct military expenditures dominated. In peacetime, they were almost equalled by expenditures to service the military debts of preceding wars. In both wartime and peacetime, the state allocated a trivial share of its expenditures—just 12 per cent—to civilian purposes.
Allocation of British state expenditures between civilian, military, and debt-servicing purposes, 1688–1815
Source: O’Brien (Reference O’Brien1988, table 1).

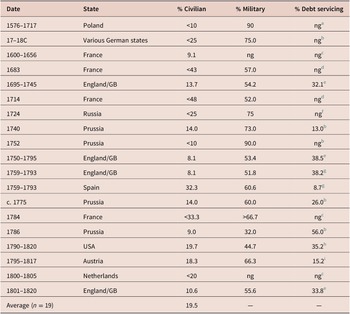
Britain was not unique. Table 2 shows available data for a wider range of states between c. 1600 and c. 1820. Across all these states during this key period, a majority of state spending—perhaps 60 per cent of the total—was devoted to military purposes. A large tranche of the remainder was used to service or repay public debts, most of them incurred for military purposes (Hoffman, Reference Hoffman2015, 315; O’Brien, Reference O’Brien1988, table 1). Very little—less than one-fifth—was allocated to all civilian purposes taken together.
Percentage of state expenditures devoted to civilian, military, and debt-servicing purposes, various European states, seventeenth to nineteenth century

Abbreviation: ng = not given in source.
a Filipczak-Kocur (Reference Filipczak-Kocur and Bonney1999, 448).
b Mann (Reference Mann1986, I: 489–90).
c Mann (Reference Mann1986, I: 489).
d Eloranta (Reference Eloranta and Whaples2005).
e Mann (Reference Mann1986, I: 485).
f Mann (Reference Mann1986, I: 490).
g Torres Sánchez (Reference Torres Sánchez and Torres Sánchez2007, 440).
h Mann (Reference Mann1986, I: 488).
i Mann (Reference Mann1986, I: 487).
But perhaps state spending on civilian purposes was positively associated with economic growth? Detailed data on state expenditures are scarce, but an unusually well-researched comparison between two eighteenth-century European states, Britain and Spain, helps address this question (Torres Sánchez, Reference Torres Sánchez and Torres Sánchez2007, 443).
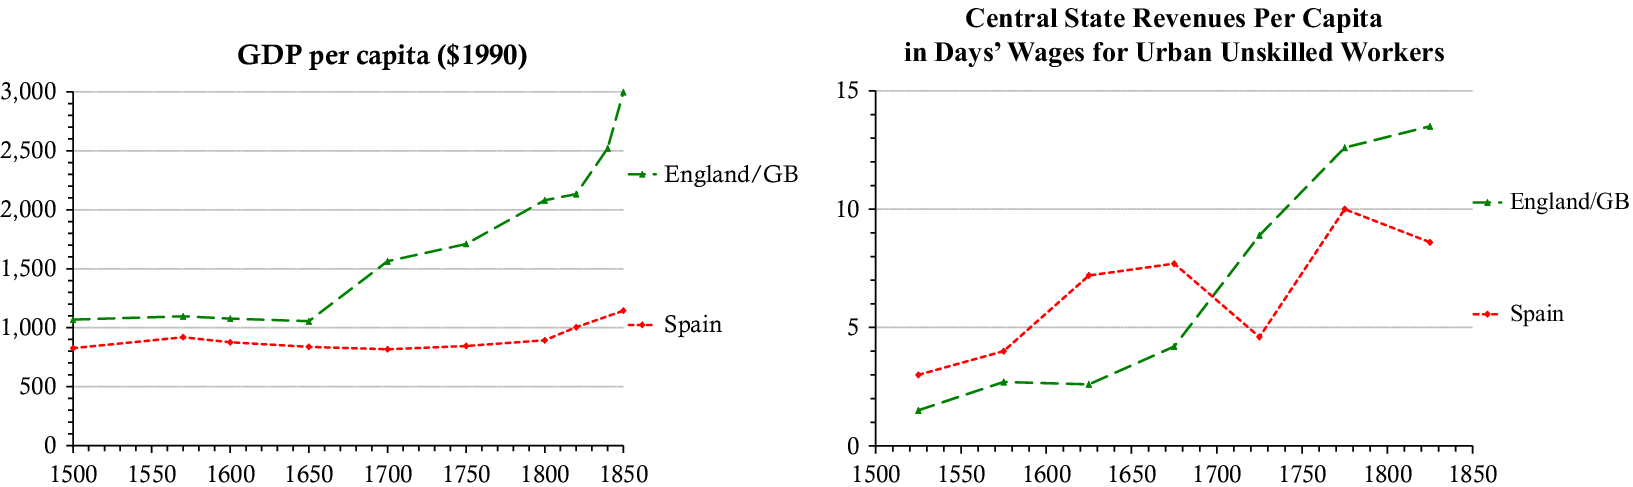
These two states had a similar population size in 1700 (about 8.6 m inhabitants), though Britain’s population was rising fast and reached 21 m by 1820 while Spain’s grew only to 12 m (Maddison, Reference Maddison2010). As figure 5 shows, Britain already had higher per capita GDP than Spain in 1500 and from about 1650 onwards its economy grew much faster, rising continuously while Spain’s stagnated. Yet Britain had much lower fiscal capacity than Spain from 1500 to 1700. Only in the first half of the eighteenth century did British fiscal capacity pull ahead.
Economic growth and fiscal capacity in Britain and Spain, 1500–1850.
Source: GDP per capita: Broadberry, Guan and Li (Reference Broadberry, Guan and Li2018). State revenues per capita: Henriques et al. (Reference Henriques, Freire Costa and Palma2022, table 1).

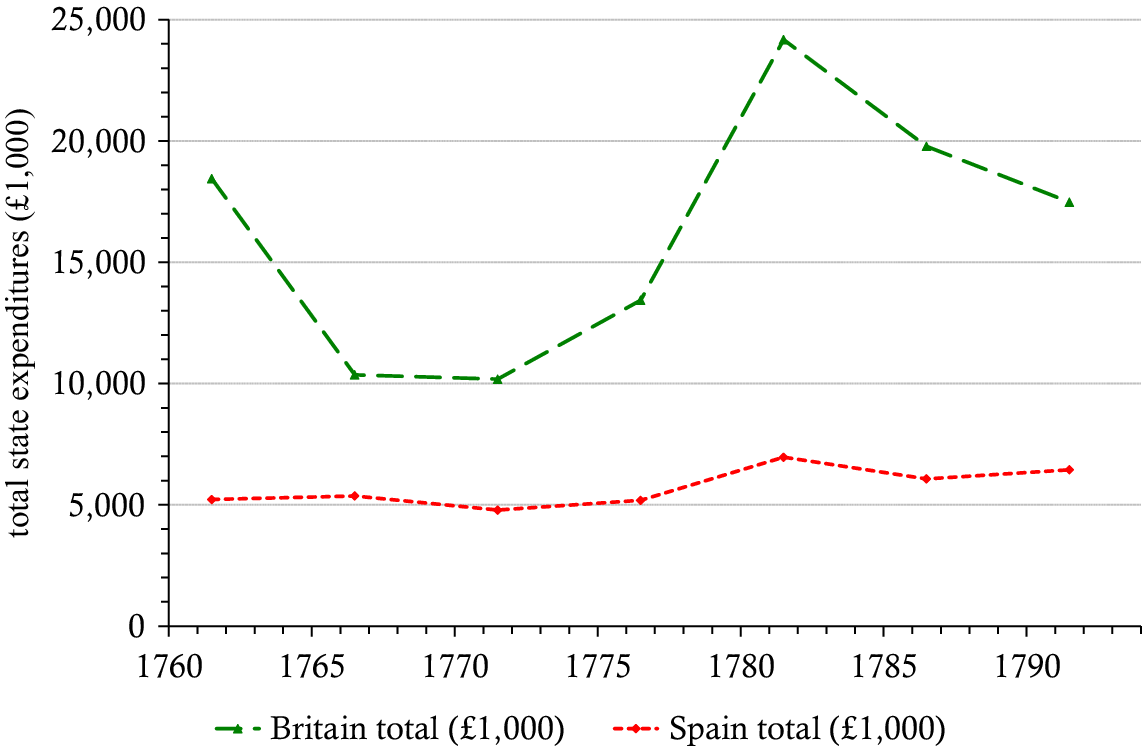
But the real revelation comes when we look at state spending. As figure 6 shows, in the second half of the eighteenth century, the British state spent more than the Spanish in absolute terms. On the face of it, this might seem to support the idea that higher state spending and faster economic growth went hand in hand, since during these four decades per capita GDP in Britain was high and rising and the economy was industrialising, while Spain’s economy remained poor, stagnant and preindustrial.
State spending in absolute terms, Britain and Spain, 1759–1793.
Source: Torres Sánchez (Reference Torres Sánchez and Torres Sánchez2007, 443).

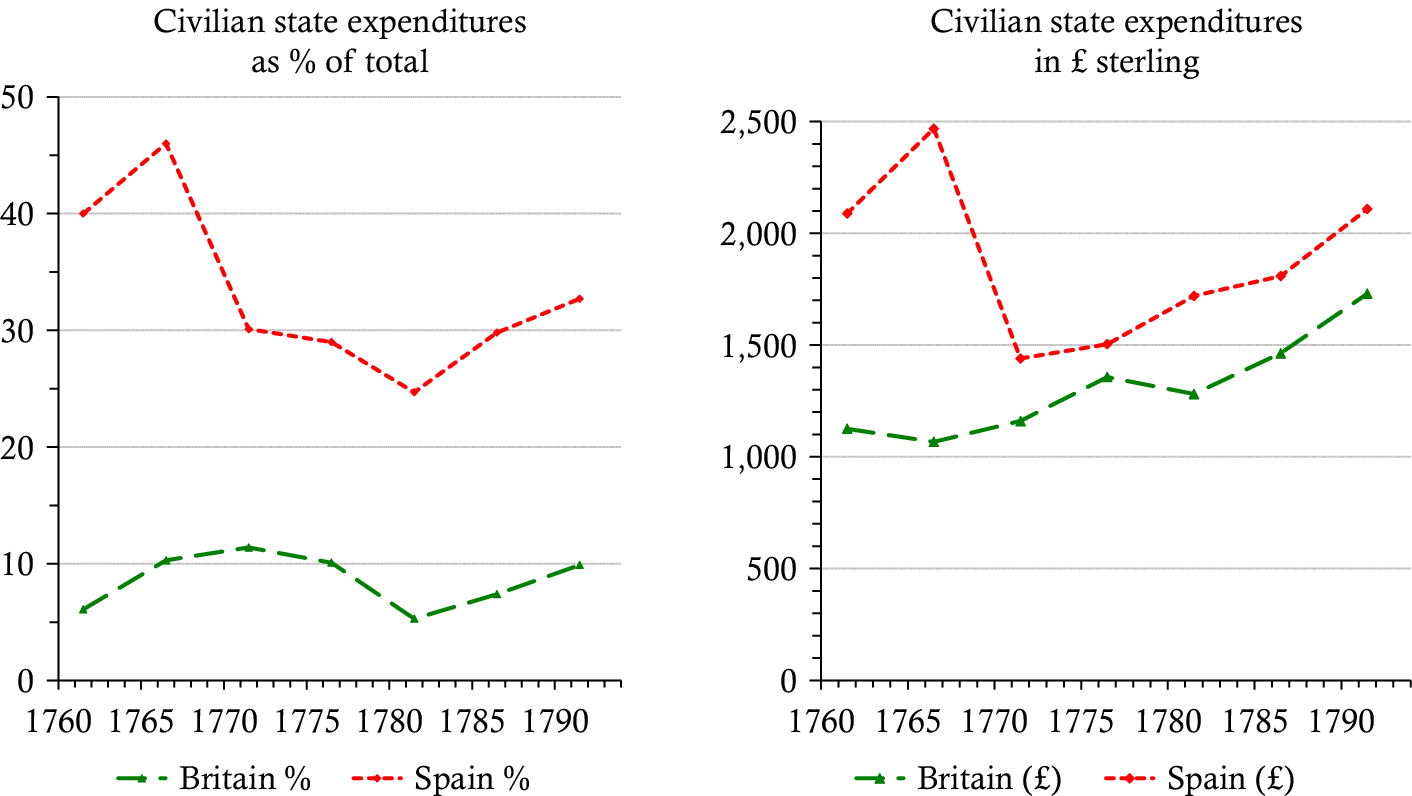
But figure 7 shows that the state in Spain was actually spending more on civilian purposes than the state in Britain. As the left-hand graph shows, in rich, fast-growing Britain less than 10 per cent of state expenditures were devoted to civilian purposes, compared to 33 per cent in poor and stagnant Spain. The absolute value of state expenditures on civilian purposes, as the right-hand graph in figure 7 shows, was also higher in Spain than in Britain, even though the Spanish economy was much poorer. Spain’s per capita spending on civilian purposes was also higher than Britain’s during this period (Torres Sánchez, Reference Torres Sánchez and Torres Sánchez2007, 443).
State expenditures on civilian purposes, Britain and Spain, 1759–1793.
Source: Torres Sánchez (Reference Torres Sánchez and Torres Sánchez2007, 443).

Sadly, Spain’s higher spending on civilian purposes appears not to have improved its economic performance. The Spanish economy remained poor and stagnant until well past 1800 and it only saw the tentative beginnings of an Industrial Revolution after 1832. As late as 1900, as figure 2 shows, per capita GDP in Spain was closer to that of Russia, Poland, China or the Ottoman lands than to that of Britain. State expenditures on civilian purposes were not related to wealth or growth.
5. Was war good?
Given that the state spent most of its fiscal capacity on war during the Great and Little Divergences, can we somehow argue that war helped economic growth? Some scholars have argued just this. In theory, state military spending might create economic benefits because the defence is a public good that benefits the economy by protecting it from predation. Counterfactual arguments might establish that if the state had not waged war, good economic outcomes such as human capital investment, technological innovation, market power, urbanisation, territorial consolidation, or institutional reform would not have taken place.
A favoured empirical approach is to focus on eighteenth-century England. Indubitably, England was almost constantly at war, allocated an even higher percentage of its state expenditures to military purposes than most other eighteenth-century states, yet continued to grow faster than other economies and launched the first-ever Industrial Revolution after c. 1760. Some argue that England’s extraordinary investment in warfare was actually an extraordinary investment in economic growth, ‘fostering accumulation of human, social and physical capital; the diffusion of technologies; the enhancement of competitive advantages for commerce overseas; and, above all, for the formation of more efficient systems for central governance for the consolidation of institutions promoting Britain’s precocious transition to modern economic growth’ (O’Brien, Reference O’Brien and O’Brien2022, 26).
But this idea raises many objections. Even for victorious Britain, the European wars between 1760 and 1815 killed and maimed thousands, disrupted trade, increased prices, and crowded out private investment. Britain was able partly to offset these costs by waging its wars more profitably than other states, fighting most of them on foreign soil, and ultimately winning most of them. The putative benefits of war to the British economy rely mainly on counterfactual arguments that the financial sector would not have developed without military borrowing and maritime trade would not have grown without military and naval success (Harris, Reference Harris, Floud and Johnson2004, 217–9; O’Brien, Reference O’Brien and O’Brien2022). But finance and international trade were small relative to the size of the British economy. The costs of war were high even in Britain, and the offsetting spillover benefits were by no means guaranteed.
This emerges from the experience of other eighteenth-century European economies, where war inflicted greater damage and yielded fewer benefits. Across Europe as a whole, the wars between 1793 and 1815 killed an estimated five million people (Vries, Reference Vries2015, 4). In France, these wars caused about 1 million casualties, hindered market integration, impeded urbanisation, diverted resources from infrastructure improvements, damaged agricultural productivity, blocked access to overseas markets, reduced trade as a share of GDP, slowed industrial growth, and were almost certainly damaging to ‘France’s overall macroeconomic dynamism’ (Charles et al., Reference Charles, Daudin, Marzagalli and O’Brien2022, 52; Hoffman, Reference Hoffman1996, 194–8). The Netherlands suffered even more, with French annexation and British warfare accelerating de-urbanisation, destroying maritime trade, disrupting public finances, and delaying industrialisation (’t Hart and Joor, Reference ‘t Hart, Joor and O’Brien2022). In Spain, these wars damaged population growth, agricultural performance, capital formation, trade, manufacturing, government revenues, and per capita GDP; the only potentially positive effects rely on the counterfactual argument that the wars hastened the abolition of restrictive institutions (Prados de la Escosura and Santiago-Caballero, Reference Prados de la Escosura, Santiago-Caballero and O’Brien2022). In Italy, these wars harmed the economy through conscription, mortality, taxation, and trade destruction, while the Napoleonic institutional reforms benefitted long-run development ‘only after several decades and the establishment of further institutional reforms’ (Dincecco and Federico, Reference Dincecco, Federico and O’Brien2022, 142). In Germany, the immediate effect of the wars was profoundly negative; again, the only potentially positive effects rely on counterfactual arguments that the wars caused territorial consolidation which facilitated market integration or triggered institutional reforms, though these began independently of warfare and in any case had only gradual effects (Pfister, Reference Pfister and O’Brien2022). Nor was the damage limited to Europe: the European wars during this period measurably harmed market integration across the globe (O’Rourke, Reference O’Rourke2006).
A different ‘bellicist’ theory argues that medieval and early modern warfare benefitted European economic growth by encouraging urbanisation. According to one argument, Europe grew faster than China because constant European warfare created insecurity, causing people to move into cities, where economic growth was faster (Rosenthal and Wong, Reference Rosenthal and Wong2011, 99–128). A more recent variant of this argument analyses the relationship between 847 land-based military conflicts in Europe and the population size of 676 cities from 800 to 1799 and concludes that conflict exposure caused urban demographic growth. Warfare, the study contends, drove rural people to shelter behind city walls, expanding urban populations and fostering urban privileges, self-government, property rights, technological innovation, human capital, and agglomeration economies (Dincecco and Onorato, Reference Dincecco and Onorato2016, 260).
But this theory has many flaws. The dataset of European conflicts fails to specify criteria for inclusion as a major military conflict and under-represents warfare in low-growth zones such as medieval Iberia and early modern eastern Europe, casting doubt on the claimed empirical relationship between warfare and growth (Milhaud, Reference Milhaud2019, 419). Early modern European industries did not remain concentrated in cities but spread beyond town walls into suburbs and rural regions where they grew faster than urban manufacturing (De Vries, Reference De Vries2012, 166). Warfare apparently either did not favour towns at all, or did not favour them enough to overcome the disadvantages of their guild monopolies and staple privileges—the dark side of urban location (Ogilvie, Reference Ogilvie2019, 536–54). Agriculture remained by far the largest sector in most European economies, its performance was crucial for the growth of industry and trade, and it was systematically harmed by military conflict (Hoffman, Reference Hoffman1996, 194–8; Pfister, Reference Pfister and O’Brien2022, 88–91).
In a wider perspective, although some wars defended economies against predation from the ‘capacity’ of other states, even defensive wars inflicted direct economic damage and in many cases indirectly enabled the state to use its expanded military capacity to engage in internal predation, divert resources to special interests, or increase state power at the expense of civil society. Moreover, many wars were offensive. In order to entrench state power or to satisfy special interests, rulers, states, political elites, and even parliaments had incentives to produce more military activity than actually benefitted ordinary citizens (Hoffman, Reference Hoffman2012, 604). Deterring state predation is a rather negative role for state capacity, moreover, reminiscent of a protection racket: state capacity itself generated the predation against which state capacity was required.
The idea that war benefitted economic growth thus rests on shaky foundations. There is little evidence that the two were consistently associated, let alone that any association was causal. Even the association between war and economic growth is hard to trace outside eighteenth-century England. Indeed, for Europe or Africa after 1800, empirical studies find no evidence that military activities benefitted the state or economy, either directly or indirectly (Dincecco et al., Reference Dincecco, Fenske and Onorato2019; Goenaga et al., Reference Goenaga, Sabaté and Teorell2018; Osafo-Kwaako and Robinson, 2013). By contrast, there is considerable direct evidence that warfare destroyed labour and capital, crowded out private investment, damaged agriculture, and increased prices by blocking trade. The fact that most fiscal capacity was devoted to war suggests that the net effect of the major activity states historically undertook was to harm, not help, economic growth.
6. Legal capacity
What about state activities devoted to civilian purposes? Even though states devoted few resources to civilian activities, and even though states that spent more on civilian purposes (like Spain) did not necessarily enjoy faster economic growth than states that spent less (like Britain), nonetheless this minor civilian component of state activity might still have affected economic performance.
‘Legal capacity’ is a measure of state capacity that seeks to encapsulate this argument. This is defined as the capacity of the state to enforce its rules across the territory it controls and is widely held to benefit the economy (Besley and Persson, Reference Besley and Persson2009, 1218–20; Johnson and Koyama, Reference Johnson and Koyama2017, 4–6; Koyama, Reference Koyama, Jenkins and Rubin2022). Legal capacity is not well measured by fiscal capacity, since legal provision consumed only a tiny share of state expenditures, and was mainly financed by litigant fees (Hoffman et al., Reference Hoffman, Monson and Scheidel2017, 1559). If anything, royal justice was a profitable enterprise and brought in net revenues for pre-modern states (Ormrod, Reference Ormrod and Bonney1999, 24–5). In return, however, the state supported legal capacity by providing legitimacy and enforcement.
There are certainly ways in which legal capacity benefits growth. Markets are needed for the economy to grow, but property rights and contract enforcement are needed for markets to function (Ogilvie and Carus, Reference Ogilvie, Carus, Durlauf and Aghion2014, 407–18.). Both are quasi-public goods since they are partly non-excludable and non-rival. Legal guarantees of property rights and contracts can in principle exclude some users, such as women, serfs and slaves, but to benefit the economy they should not do so. Likewise, guaranteeing property and contracts can in principle be rival, in the sense that adding users can cause congestion; but the basic infrastructure of law codes, law courts, and the state’s monopoly of legal coercion has a large fixed component that is not diminished by adding users. These public good characteristics mean that legal guarantees of property and contracts can in principle be provided more efficiently by the state than the market.
During the medieval period, long before they increased fiscal capacity, most European states provided basic legal guarantees of property and contracts (Ogilvie and Carus, Reference Ogilvie, Carus, Durlauf and Aghion2014). What mattered for economic growth, however, was whether legal capacity was supplied on a ‘generalised’ basis by impartial and open-access legal systems that guaranteed the property and contracts not only of privileged groups such as nobles and burghers, but also of peasants, women, labourers, servants, migrants and foreigners (Ogilvie, Reference Ogilvie2005; Ogilvie and Carus, Reference Ogilvie, Carus, Durlauf and Aghion2014). Generalised provision of legal capacity even supported trade between members of different states in some advanced polities, such as thirteenth-century Champagne, fourteenth- and fifteenth-century Northern Italy and Flanders, the sixteenth- and seventeenth-century Netherlands, seventeenth- and eighteenth-century England and in France and parts of Germany after the French Revolution (Ogilvie, Reference Ogilvie and Blanning2000, Reference Ogilvie2011).
But the legal capacity of the state had a dark side, which did not promote economic growth. State legal capacity was often ‘particularised’, enforcing legal privileges for special-interest groups, which not only imposed costs on others but slowed growth by inflicting deadweight losses on the whole economy. A feudal landlord, for instance, enjoyed legal property rights over his serfs entitling him to extract coerced labour or proto-industrial ‘loom dues’—this continued to be the case in central and eastern-central Europe long past 1800, supported by growing state capacity (Ogilvie and Carus, Reference Ogilvie, Carus, Durlauf and Aghion2014, 469–86). A guild of craftsmen or proto-industrial producers enjoyed a legal ‘privilege’ giving it a local monopoly over production and trade which entitled it to exclude female and Jewish producers and suppress innovative processes and products, reducing productivity and output; these legal privileges were supported and intensified by growing state capacity well into the nineteenth century, with the last guilds in Europe abolished only in 1883 (Ogilvie, Reference Ogilvie2019). Associations and ‘companies’ of merchants secured legal privileges from states all over Europe enabling them to extract rents from long-distance trade and proto-industrial commerce at the expense of other traders and the wider economy; these privileges, too, were supported by growing state capacity well into the nineteenth century (Ogilvie, Reference Ogilvie2011). Even during industrialisation, many European states used their legal capacity to sell ‘concessions’ giving individual manufacturers the exclusive entitlement to set up a factory in a particular place, use particular machines, exclude competitors, and even compel consumers in a particular zone to purchase exclusively from that factory (Horn, Reference Horn2015; Kisch, Reference Kisch1959; Ogilvie, Reference Ogilvie and Blanning2000). States would not have been able to enforce these particularised legal privileges had they not developed greater legal capacity. Indeed, states used legal capacity in this way to increase their revenues and avoid parliamentary scrutiny, as we saw above with states’ non-tax revenues.
The general lesson is that legal capacity, enabling a state to enforce the rule of law over the entirety of the territory over which it claims sovereignty, only benefits economic growth if the content of the law is growth-friendly, in the sense of being impartial, open-access, and generalised. If the law consists instead of particularised legal privileges for special-interest groups, legal capacity can harm economic growth while still increasing state capacity. This lesson from economic history sadly still applies to many modern developing economies (Auriol and Warlters, Reference Auriol and Warlters2005).
7. Bureaucratic capacity
Bureaucratic capacity is another measure that focuses partly on state activities devoted to civilian purposes. It is defined as the state’s capacity to deploy an administrative apparatus to implement its policies. A professional and effective implementation of state policy is held to create a framework in which economic agents can rely on the systematic collection of taxes, provision of state services, and delivery of public goods (Johnson and Koyama, Reference Johnson and Koyama2017, 5–8, 10–11; Mann, Reference Mann1986, 113).
But this raises two problems. First, bureaucratic capacity is typically measured in terms of inputs: number of civil servants, level of professional training, and proliferation of state bureaux. This tells us little about outputs: large numbers of highly trained civil servants working in elaborate state bureaux can still suffer from lack of information, deficient coordination, poor motivation, and rampant corruption. Second, even if bureaucracies are perfectly informed, carefully coordinated, highly motivated, and squeaky clean, they may simply be super-efficient at implementing policies that are bad for the economy. The effects of bureaucratic capacity depend on what bureaucrats actually do.
History provides many examples of states with highly developed, professional and meritocratic bureaucracies which did not achieve high per capita GDP or rapid economic growth. China, for instance, had high bureaucratic capacity from the Song dynasty (960–1279) into the nineteenth century, with merit-based civil service examinations, elaborate administrative structures, and highly professionalised administration (Rosenthal and Wong, Reference Rosenthal and Wong2011, 173; Wong, Reference Wong1997, 134, 157, 282; Woodside, Reference Woodside2009, 56). European states, by contrast, had low bureaucratic capacity, in which many public posts were occupied by hereditary nobles, rich men who purchased public offices venally and recouped their investment through corruption, or amateur volunteers who did public work out of civic duty without qualifications or salary (Vries, Reference Vries2015, 26–7). But despite its highly developed bureaucratic capacity, China had low per capita GDP, got poorer from 1690 to 1840, and stagnated from 1840 to 1912. Most parts of Europe were richer and faster growing.
Within Europe, Sweden and the German territories were the earliest to develop professionalised bureaucracies. But these states, as we saw in figure 3, had low per capita GDP, grew slowly, and industrialised late. Conversely, rich, fast-growing and early-industrialising England had a tiny bureaucracy, which mostly just ran the army, navy and customs service; internally, the government relied on amateur, untrained, unpaid local Justices of the Peace recruited from the hereditary nobility and gentry until long past 1800 (Brewer, Reference Brewer1989). High bureaucratic capacity thus was neither necessary nor sufficient for rapid economic growth.
This is not surprising. Bureaucratic capacity often just involved civil servants implementing harmful policies very well. Bureaucracies in China, Sweden and Germany efficiently, systematically and professionally enforced privileges for rent-seeking groups such as feudal landlords, merchant associations, craft guilds and concession-holding factory owners, stifling economic growth. Recent analysis of a sample of countries between 1789 and 1999 found that the size and quality of the bureaucracy had economically and statistically insignificant effects on economic growth until 1945, after which date economic growth improved bureaucracy, not vice versa (Cornell et al., Reference Cornell, Knutsen and Teorell2020). History provides no evidence that bureaucratic capacity, even when deployed for civilian purposes, systematically enhanced economic performance.
8. Transportation infrastructure
Fiscal, legal and bureaucratic capacities are inputs. What about the outputs of state capacity? One way states may benefit growth is by providing infrastructure. Roads, bridges, canals, harbours and railways are not public goods since they are excludable (users can be kept out) and to some extent rival (beyond a point, adding users causes congestion). But many have natural monopoly features and charging user fees may be inefficient, meaning that there is a case for state provision. Did states use their growing capacity to build infrastructure?
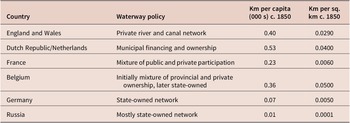
The empirical record suggests not. Canals and river improvements were provided poorly by all states in early modern Europe (Bogart et al., Reference Bogart, Drelichman, Gelderblom, Rosenthal, Broadberry and O’Rourke2010, 90–2). As table 3 shows, in fast-growing and early-industrialising Britain, water transport infrastructure was built almost exclusively by the private sector, through for-profit, joint-stock companies. In slow-growing, industrially under-developed France, by contrast, canals and river improvements were built by the state with some private participation, and in much lower quantities. By 1815, waterway density in Britain, where such infrastructure was provided by the private sector, was three times that in France where it was provided mainly by the state (Bogart, Reference Bogart, Floud, Humphries and Johnson2014, 376). By 1850, Britain was far ahead of France, Spain and Germany in its kilometres of navigable waterways both per capita and per square kilometre; only the Netherlands and Belgium had more.
Waterway provision in Europe, 1700–1870

Note: Figures for the Netherlands are for 1830.
Source: Bogart et al. (Reference Bogart, Drelichman, Gelderblom, Rosenthal, Broadberry and O’Rourke2010, 91).
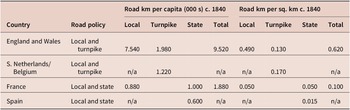
Roads were likewise provided poorly by all early modern states. Fiscal capacity grew hugely, but almost none was spent on road building. In Britain, as table 4 shows, roads were mainly provided by local communities and turnpike trusts, privately financed organisations that charged tolls to users. Between 1690 and 1815, turnpike trusts added an estimated 1.65 per cent to British national income (Bogart, Reference Bogart2009, 128–9). In France, by contrast, roads were built and maintained by local communities and the state, mainly by extracting corvée labour. The outcome was poor in terms of both quality and density. In 1760, road travel speed in France was just 50 per cent that in Britain (Szostak, Reference Szostak1991, 70). By 1840, road density both per capita and per square kilometre was much higher in Britain than in France or Spain, as table 4 shows. Belgium also built roads through communities and turnpike trusts, achieving comparable highway density to Britain. Successful road provision in Britain did depend on the state, not because the government directly built the roads but because it provided a legal and regulatory framework in which local communities and turnpike trusts could operate (Rosevear et al., Reference Rosevear, Bogart and Shaw-Taylor2022, 4).
Road provision in Europe, 1840

Note: Southern Netherlands had 3000–5000 km of roads in 1840, described as ‘mostly turnpike roads’.
Source: Bogart et al. (Reference Bogart, Drelichman, Gelderblom, Rosenthal, Broadberry and O’Rourke2010, 89).
Britain was also precocious in having railways, but not because the state initiated, financed or constructed them. Instead, the market provided the entrepreneurship, the finance and the technology, while the state provided property rights and regulation (Bogart, Reference Bogart, Floud, Humphries and Johnson2014, 376–87; Bogart et al., Reference Bogart, Drelichman, Gelderblom, Rosenthal, Broadberry and O’Rourke2010, 92–4). Uniquely in Europe, railways in Britain were from the beginning in private ownership with no state subsidies, while other countries pursued private ownership with state subsidies (France, Spain, Portugal, Austria-Hungary), mixed private-state ownership with state subsidies (Russia, Italy), initial private ownership shifting later to state ownership (the Netherlands, Denmark, Norway) or a mixture of state and private ownership from the start (Germany, Sweden, Belgium). Many European states only increased their involvement in railways for military and political reasons, and then quite gradually (Bogart et al., Reference Bogart, Drelichman, Gelderblom, Rosenthal, Broadberry and O’Rourke2010, 93–4).
European states did little to provide transportation infrastructure before 1850. In England, Belgium and the Netherlands, the state at least provided property rights and a regulatory framework. But it was local community institutions, turnpike trusts, and private joint-stock companies that built the infrastructure and bore the risks. Good transportation infrastructure in these northwest European economies almost certainly promoted their early victory over famine, their well-functioning supply chains, and their growing per capita GDP. But the role of state capacity was to provide public goods—property rights, contract enforcement and regulation—which enabled the private sector to build the actual infrastructure.
9. Industrial policy
A further state activity sometimes held to fuel economic growth is industrial policy—a deliberate effort by the government to shift the economy to what it sees as more desirable activities, typically industrial ones. Many states, historical and modern, have deployed their capacity to set up state-owned enterprises, subsidise private firms in favoured sectors, and protect national producers from foreign competition. Some argue that Britain was one such state. These claims rely almost entirely on three specific episodes of state intervention.
The first is Edward III’s 1337 order banning wool exports, blocking cloth imports, and inviting Flemish weavers to England to transmit their techniques. This is portrayed as an early state industrial policy to promote the English cloth industry (Chang, Reference Chang2002, 20-1, 60-1; Sainsbury, Reference Sainsbury2020a, 1051, Reference Sainsbury2020b, Reference Cornell, Knutsen and Teorell21). However, these measures were directed not at enhancing economic performance but rather at achieving the ruler’s political ends (Oldland, Reference Oldland2019). Edward III undertook them to put diplomatic pressure on Flanders and to raise money for war by selling an export monopoly to a group of rich English merchants. The policy was opposed by English taxpayers, wool growers, and small-scale merchants because it profited a rich merchant cartel at the expense of less politically connected producers and the wider society. Nor did the policy benefit the economy, since it culminated in a diplomatic alliance giving Flemish cloth manufacturers control over English wool supplies. Even the protection offered to Flemish weavers was not devised to diffuse new techniques but rather to offset guild privileges and secure a counter-offer from English weavers. All English monarchs banned wool exports and cloth imports when conflict arose with Flanders and then abandoned the bans when diplomatic relationships recovered. Indeed, most European rulers imposed similar policies in times of conflict, as between 1303 and 1360 when France banned exports of wool, unfinished cloths, and dyeing materials to support its war with Flanders, not to promote French textile manufacturing, which remained backward and uncompetitive.
A second episode of putative English industrial policy occurred between 1493 and 1496 when Henry VII imposed customs duties on wool exports to increase the costs of foreign clothmakers, granted English clothmakers tax exemptions and monopolies, and invited foreign craftsmen to England to transmit their skills. This is portrayed as a deliberate policy to encourage innovation, scale economies and growth in English textile manufacturing (Chang, Reference Chang2002, 20-1, 60; Sainsbury, Reference Sainsbury2020a, 1051, Reference Sainsbury2020b, Reference Cornell, Knutsen and Teorell21–Reference Alesina, Giuliano and Reich2). Again, however, these measures were primarily political and diplomatic, not economic (Oldland, Reference Oldland2019). They were discontinued after just 3 years, not long enough to exert a significant economic impact. English cloth had been selling well overseas since c. 1400 and statistical series show no exceptional growth between 1493 and 1496 (Britnell, Reference Britnell and Watts1998, 90). In the 1450–1540 period, increases in exports of woollen cloth, tin and lead created full-time employment for less than 1.3 per cent of the English labour force and made a miniscule contribution to economic growth (Britnell, Reference Britnell and Watts1998, 93–4). Most European rulers imposed very similar policies, either to serve diplomatic purposes or to secure domestic support from well-connected interest groups. The distinctive characteristic of English state intervention in this period was the exact opposite of industrial policy: it gradually withdrew protection from urban guild masters against competition from dynamic rural proto-industries and foreign producers. Medieval English governments influenced the economy ‘through decisions concerning war and peace, which had direct implications for levels of taxation and freedom to trade’—but not through deliberate industrial policy (Britnell, Reference Britnell and Watts1998, 101).
The most eye-catching example adduced to support the idea that state industrial policy fuelled English economic growth is the 1721 Calico Act. This legislation, it is argued, was directed at excluding Indian calicos, protecting the English cotton industry from which the Industrial Revolution would germinate four decades later (Chang, Reference Chang2002, 21-5, 51-2; Sainsbury, Reference Sainsbury2020a, 1052, Reference Sainsbury2020b, 22-3, 108–12). But this interpretation is at odds with the facts. The Calico Act was directed not at encouraging English cotton textiles, but rather at protecting England’s older, and much larger, woollen and silk textile industries. It did so by prohibiting the production and trade of pure cotton cloths (including British manufactures) and taxing the production and trade of mixed cotton-linen textiles (which were mainly British). The net effect was to discourage the British cotton industry. The standard rationale for import-substituting industrialisation does not apply in the case of the Calico Act since the eighteenth-century British cotton industry was tiny, with low capital costs and no minimum efficient scale, so there were no scale economies to exploit by protecting it from competition. It also had low barriers to entry, enjoyed no first-mover advantage, and generated little technical learning for future cotton factories. Indeed, only 10–17 per cent of English cotton manufacturing in 1721 actually competed against foreign cotton. Most of the cotton-related mechanisation advances during the British Industrial Revolution were spillovers from non-cotton textile sectors. British cotton manufacturing in the 1720s was tiny: it contributed 2.6 per cent of value added in industry, less even than silk (5 per cent) or linen (8 per cent), let alone wool textiles (at 31 per cent, nearly 12 times as much as cotton). The home market could have stimulated cotton inventions just as well. Indeed, the only reason overseas markets were so important for the British cotton industry in the eighteenth century was that the Calico Act denied British cotton firms a home market by banning the production and trade of pure cotton cloths, including British ones. It is therefore plausible that the Calico Act functioned as an anti-competitive, anti-innovation policy that delayed textile mechanisation in Britain. The 1721 Calico Act played no role in the later success of English cotton manufacturing during the Industrial Revolution.Footnote 1
State industrial policies seldom succeeded. All European states pursued ‘industrial policies’ from the medieval period until well past 1800, protecting favoured industries which mostly failed to develop. The Spanish state spent huge sums to support royal manufactures of cloth, china, playing cards, glass, paper, pottery, saltpetre, stockings, swords, tapestry, and tissue (Townsend, Reference Townsend1791, II:231–2). These manufactures sucked up huge subsidies, failed to reduce costs or transmit techniques, seldom broke even, and ultimately went bankrupt (Echávarri Otero et al., Reference Echávarri Otero, de la Guerra Ochoa, Chacón Tanarro, Muñoz Sanz, Bautista Paz, Álvarez Redondo, Díaz Lantada, Munoz-Guijosa, Koetsier and Ceccarelli2012, 67)—one reason the Spanish state got no growth dividend out of outspending the British state on civilian purposes. Portugal used its state capacity to establish and subsidise over 300 ‘royal factories’ during the eighteenth century. These suffered from excessive scale, high production costs, and uncompetitive prices, ultimately going bankrupt and hindering the move to mechanisation (Costa et al., Reference Costa, Lains and Miranda2016). The Russian Czars erected numerous mercantilist manufactories worked by coerced serf labour, but even the most successful, a military metallurgical complex in the Urals, suffered from technological stagnation and flourished only briefly (Echávarri Otero et al., Reference Echávarri Otero, de la Guerra Ochoa, Chacón Tanarro, Muñoz Sanz, Bautista Paz, Álvarez Redondo, Díaz Lantada, Munoz-Guijosa, Koetsier and Ceccarelli2012, 56). The Austrian Habsburg Emperors fostered state cloth manufactures in Linz, glass and mirror manufactures in Neuhaus and porcelain manufactures in Vienna, but these were inefficiently operated, remained technologically backward, and went bankrupt after swallowing massive subsidies (Echávarri Otero et al., Reference Echávarri Otero, de la Guerra Ochoa, Chacón Tanarro, Muñoz Sanz, Bautista Paz, Álvarez Redondo, Díaz Lantada, Munoz-Guijosa, Koetsier and Ceccarelli2012, 56). Prussia set up numerous royal manufactories, producing iron, steel, cloth, silk, porcelain, and weapons, but they suffered from high costs, low demand, and the perpetual threat of bankruptcy. So notorious was their failure that in 1788 the Comte de Mirabeau wrote of the unprotected, private and highly successful textile industry in the Rhineland city of Krefeld (which was part of Prussia), ‘Unhappy those manufactures, if ever a Prussian king should love them!’ (Mirabeau, Reference Mirabeau1788, III: 239–40).
In Britain, as in Krefeld, the state seldom granted subsidies, monopolies or even trade protection to industry. By the standards of eighteenth-century states, Britain practised very little ‘industrial policy’. Its economic success and early industrialisation owed nothing even to the most prominent examples of such policy emphasised in the literature. The British state had high capacity, but seldom used it to support industry, and never successfully. The British Industrial Revolution was not caused by state industrial policy.
10. State capacity and culture
A final way state capacity is supposed to stimulate economic growth is by promoting good cultural norms. State capacity is thought to create a ‘common-interest society’ in which homogeneous norms of social harmony, faith in the state, and willingness to pay for public goods encourage economic growth (Besley and Persson, Reference Besley and Persson2011, ch. 2). Twentieth-century less-developed countries with heterogeneous ethnicity and culture, it is argued, have lower public good provision, more frequent civil war, and lower per capita GDP. This is held to imply that states that promote homogeneous national cultures through national education, public patriotism, and state religion will benefit economic growth (Alesina et al., Reference Alesina, Baqir and Easterly1999, Reference Alesina, Giuliano and Reich2021; Easterly and Levine, Reference Easterly and Levine1997). Historical nation-states with homogeneous cultures such as England and France were economically successful, it is argued, while multi-ethnic states such as the Habsburg Empire, the Ottoman lands, and Czarist Russia were unsuccessful because their peoples were too culturally diverse to cooperate in supporting growth-friendly state policies (Johnson and Koyama, Reference Johnson and Koyama2017, 12).
But these arguments raise questions. For one thing, the historical evidence is very mixed. Culturally homogeneous countries such as Sweden and the territorial states of central and western Germany achieved only slow economic growth and failed to industrialise until well into the nineteenth century. Culturally heterogeneous states such as the Southern Netherlands, Switzerland and Bohemia, by contrast, industrialised soon after Britain and achieved rapid growth thereafter.
A second problem is an endogeneity. Observing an association between homogeneous national culture and successful economic growth does not imply that cultural homogeneity causes growth. Fast growth could be ironing out cultural heterogeneity, for instance through urbanisation and interregional trade. Or underlying variables could be causing both homogeneity and growth. National units involve such substantial aggregation that it is virtually impossible to control for all confounding variables and identify a definite causal effect of cultural homogeneity.
Besides, homogeneous national culture is a two-edged sword. The Tanzanian Ujamaa policy of 1970–1981, for instance, aimed to create a national identity and consolidate state authority by mandating diverse populations to live in planned villages where children received a political education. Recent empirical analysis shows that it did increase support for a strong central state. But it did not enhance generalised trust within or between ethnic groups and it stifled domestic pressure for democratic accountability (Carlitz et al., Reference Carlitz, Morjaria and Mueller2022).
Convincing citizens of the cultural legitimacy of the state only creates economic benefits if the state uses legitimacy in growth-friendly ways. What if homogeneous national norms block women’s access to training, labour markets, and business ownership? What if the state religion censors science and innovation? What if political cohesion against minorities and migrants blocks entrepreneurship? What if cultural homogeneity stifles productive diversity? What if national culture is used to silence domestic dissent or mobilise support for offensive wars against other cultures? Women’s status, religious toleration, openness to migrants, liberalism towards minorities, value for diversity, democratic accountability, and abjuring offensive wars are typically associated with good economic outcomes. Across the long span of history, state-imposed cultural homogeneity displays few benefits for economic growth or—its main justification—human well-being.
11. Conclusion
The main lesson from history is that state capacity is a muddled concept. Anything good that a state does is called ‘state capacity’, even if it involves imposing constitutional limits on the state, as in early modern England and the Netherlands. Conversely, anything bad that a state does is called ‘low state capacity’, even if it achieves the aims of that state and increases state power in that society, as in preindustrial Prussia, Russia or China.
State capacity is also hard to measure, and history shows why. Fiscal capacity, the dominant measure, is flawed since it focuses narrowly on money resources collected by the central state. This excludes many state resources since taxes are often collected at lower levels of government and states often extract resources in the form of coerced labour, grain or other commodities. These measurement flaws underestimate the resources of all states, but disproportionately underestimate those available to states with low monetization and high levels of labour coercion, features typical of poor and under-developed economies. The state capacity gap between rich and poor economies is partly an artefact of excluding the resources states typically extract in poor economies.
Fiscal capacity, moreover, is a cost. To measure state benefits, we need to look at expenditures. Before the modern era, state expenditures were seldom used in ways that benefitted the economy. The vast majority of state spending was devoted to military activities, whose economic effects were at best ambiguous. State expenditures on civilian purposes were trivial and show no association with economic growth.
Legal and bureaucratic capacity are even harder to measure but beyond basic guarantees of property and contracts show even less historical association with economic growth. Slow-growing economies such as China, Germany and Scandinavia had efficient legal systems and professionalised domestic bureaucracies, while fast-growing economies such as Britain relied on amateur volunteers such as Justices of the Peace and outward-facing customs officers and military administrators. Besides, like fiscal capacity, the rule of law and a professional bureaucracy only benefit economic growth if they implement growth-friendly laws and policies. Legal capacity was sometimes used for economically beneficial purposes such as guaranteeing property rights and contracts, but sometimes for economically harmful ones such as enforcing the legal privileges of rent-seeking special interests. Bureaucratic capacity was sometimes used to provide state services efficiently, but sometimes to enforce administrative measures that hindered innovative businesses. Since fiscal, legal and bureaucratic capacity were historically used in ways that harmed the economy, it is reasonable to be cautious about advocating more of them without specifying what they do.
This is not to say that the state plays no role in economic growth. Markets are needed for the economy to grow, but public-order institutions are needed for markets to function (Ogilvie and Carus, Reference Ogilvie, Carus, Durlauf and Aghion2014, 404, 407–18). Yet as we have seen, not all activities of public-order institutions benefit the economy. Historical studies can help distinguish growth-friendly from growth-hostile state capacity. State capacity supported growth when it provided public goods and helped solve market failures. But it stifled growth when it was used for offensive wars, elite extraction, and granting monopolies and privileges. The British Industrial Revolution was not caused by state industrial policy, or indeed by any deliberate state action. On the domestic front, almost all the British state did was to provide the public goods of property rights, contract enforcement, and a framework of market regulation. On the international front, it mainly used its capacity to wage war. The underlying wealth and dynamism of the economy enabled the British state to win most of these wars. But the economy suffered. The Industrial Revolution took place despite, not because of, Britain’s wars and most of its state capacity. In the same era, other societies waged wars—often the same wars as England—and did not benefit economically. Other European societies had high fiscal capacity, strong legal and bureaucratic capacity, and active industrial policy, but slow growth and late industrialisation. What mattered for growth was refraining from harmful uses of state capacity for domestic purposes, particularly granting and enforcing privileges for special interests.
History suggests that the challenge is not to build a capacious state—many states in the past half-millennium have built capacity. Rather, the challenge is to build a growth-friendly state. History provides a few hints. How an economy gets a state that encourages growth is by fostering constitutional scrutiny, correcting market failures, curbing rent-seeking, and letting markets and civil society provide services in which they have advantages. It is not to give the state capacity to extract a lot of resources which it can then waste on war, subsidising flagship enterprises, and enforcing elite extraction. The state can support economic growth—but also harm it. History suggests that we need to be attentive to the bright side of state capacity, but also to its dark side.
Acknowledgements
I am very grateful to Mattia Bertazzini, Jeremy Edwards, Tim Guinnane, Paul Klemperer, Meg Meyer, Patrick O’Brien, and audiences at the Prais Lecture 2021 and the Souq Economics Lecture 2022 for stimulating comments and suggestions.