Introduction
Tropical herbivorous insects, their host plants, and their natural enemies form communities of intense, long-standing antagonistic interactions that have generated the majority of Earth´s macroscopic terrestrial biodiversity (Strong et al.. Reference Strong, Lawton and Southwood1984; Price Reference Price2002; Barlow et. al. Reference Barlow2018; Stork Reference Stork2018). Insect natural enemies (predators and parasitoids) play a central role in controlling herbivorous insect populations in both natural and agricultural communities (Hawkins et al. Reference Hawkins, Cornell and Hochberg1997; Loiselle & Farji-Brener Reference Loiselle and Farji-Brener2002; Roslin et al. Reference Roslin, Hardwick and Novotny2017; Vidal & Murphy Reference Vidal and Murphy2018). However, because of their narrower thermal optima (Janzen Reference Janzen1967; Bale et al. Reference Bale2002; Deutsch et al. Reference Deutsch2008), tropical insects may be especially susceptible to the 0.26 ± 0.05 °C per decade temperature increase predicted for the tropics (Malhi & Wright Reference Malhi and Wright2004), which may push both herbivorous insects, their natural enemies, and their interactions, beyond the limits of their adaptive responses (Parmesan Reference Parmesan2006; Sunday et al. Reference Sunday, Bates and Dulvy2011; Huey et al. Reference Huey, Kearney, Krockenberger, Holtum, Jess and Williams2012). Moreover, the loss of a prey–enemy interaction may occur well before the disappearance of its constituent species. Modelling by Valiente-Benuet et al. (Reference Valiente-Banuet2015) indicates that species loss and interaction loss are decoupled such that ecological interactions are lost at higher rates. Thus, because they precede species loss, interaction extinctions affect the functionality of trophic networks faster than the extinction of individual species do. Several studies have demonstrated that interactions are particularly sensitive to anthropogenic drivers that disrupt the sympatry of interacting species, synchrony of interaction species (e.g., parasitoid–prey phenologies), or the intensity of interactions by reducing the abundance of keystone species, all of which result in the functional degradation of trophic networks (Stireman et al. Reference Stireman2005; Tylianakis et al. 2008, Reference Tylianakis, Laliberté, Nielsen and Bascompte2010; Rosenblatt & Schmitz Reference Rosenblatt and Schmitz2016). Despite the ongoing accumulation of evidence indicating that tropical herbivorous insect–enemy communities are currently suffering rapid declines in complexity and stability as a result of increasing temperatures (Bale et al. Reference Bale2002; Stireman et al. Reference Stireman2005; García-Robledo et al. Reference García-Robledo, Kuprewicz, Staines, Erwin and Kress2016; Stoks et al. Reference Stoks, Verheyen, Van Dievel and Tüzün2017; Wetherington et al. Reference Wetherington, Jennings, Shrewsbury and Duan2017; Pincebourde & Suppo Reference Pincebourde and Suppo2016; Lister & Garcia Reference Lister and Garcia2018; Salcido et al. Reference Salcido, Forister, Lopez and Dyer2020), few studies have investigated how large-scale climatic oscillations affect the capacity of parasitoids and predators to attack herbivore prey and for prey to defend themselves in tropical communities (e.g., Bannerman et al. Reference Bannerman, Gillespie and Roitberg2011; Sheldon Reference Sheldon2019; Harvey et al. Reference Harvey, Heinen, Gols and Thakur2020). Thus, prey–predator interactions, and the adaptive traits that mediate them, are a major but neglected component of biodiversity loss that must be considered in order to assess the ‘health’ of ecosystems and to define critical indicators providing early diagnosis of environmental threats to community trophic functions (Tylianakis et al. Reference Tylianakis, Laliberté, Nielsen and Bascompte2010).
Local climates throughout the tropics are thought to be driven by a regional, inter-annual cycle, the El Niño-Southern Oscillation (hereafter, ENSO), which temporarily alters patterns of precipitation and temperature throughout the tropics (Collins Reference Collins2005; Cai et al. Reference Cai, Wang, Santoso, Lin and Wu2017; Wang et al. Reference Wang, Cai, Gan and Wu2017). Disruptions in global climate are projected to increase the variation and frequency of ENSO oscillations. Yet, surprisingly little is known about the effects of ENSO on tropical insect herbivore–enemy interactions (Sheldon Reference Sheldon2019). With a periodicity of two to seven years, ENSO is comprised of reversals between anomalously warm (El Niño) and cool (La Niña) surface temperatures in the equatorial Pacific Ocean that cause shifts in precipitation and air temperatures over vast regions of the Earth. In wet tropical forests of Panamá, El Niño events are typically associated with prolonged and severe drought (Lyon Reference Lyon2004), while La Niña events are cooler, more cloudy, and wetter. ENSO-driven extremes in climatic fluctuations are known to be associated with herbivorous insect migrations (Srygley et al. Reference Srygley, Dudley, Oliveira, Aizprua, Pelaez and Riveros2010, Reference Srygley, Dudley, Oliveira and Riveros2014), shifts in plant resource allocation from growth to reproduction (Wright et al. Reference Wright, Carrasco, Calderon and Paton1999; Detto et al. Reference Detto, Wright, Calderón and Muller-Landau2018), asynchronies in herbivore–enemy phenologies (Hance et al. Reference Hance, van Baaren, Vernon and Boivin2007; DeLucia et al. Reference DeLucia, Nabity, Zavala and Berenbaum2012), and generally with decreased top-down regulation of insect outbreaks in tropical forests (Lima et al. Reference Lima, Marquet and Jaksic1999; Preisser & Strong Reference Preisser and Strong2004; Itioka & Yamauti Reference Itioka and Yamauti2004). Most research so far has documented extreme ENSO events eliciting herbivore outbreaks spanning less than a year (Van Bael et al. Reference Van Bael, Aiello, Valderrama, Medianero, Samaniego and Wright2004; Holmgren et al. Reference Holmgren, Scheffer and Ezcurra2001, Reference Holmgren, López, Gutiérrez and Squeo2006), or predator behavioural changes in response to extremes in microclimates (Hahn & Wheeler Reference Hahn and Wheeler2002; Kaspari et al. Reference Kaspari, Clay, Lucas, Yanoviak and Kay2015). The potential of the ENSO cycle to influence local climate and to impact communities by disrupting the performance of traits that functionally mediate herbivore prey–enemy interactions remains unexplored. Thus, there is a critical gap in our understanding of the interplay between abiotic and biotic factors in promoting stability in tropical communities (Tylianakis et al. Reference Tylianakis, Didham, Bascompte and Wardle2008; Stoks et al. Reference Stoks, Verheyen, Van Dievel and Tüzün2017).
The objective of our study was to test the hypothesis that sea surface temperature (SST) anomalies in the equatorial Pacific teleconnect with local climate to alter the performance of defensive traits that mediate prey–enemy interactions in a distant tropical insect community. We compiled data from a five-year field study, which encompassed the El Niño and La Niña events from 2007 to 2011. We quantified the mortality caused by five predator and parasitoid guilds on the diet-specialised tortoise beetle, Acromis sparsa, which feeds solely on the morning glory vine, Camonea umbellata. Together with its host plant and natural enemies, A. sparsa is part of a widespread and expanding wet lowland tropical rainforest edge community.
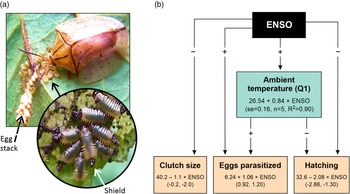
Acromis sparsa has evolved a suite of defensive adaptations that functionally mediate its interactions with its enemies. Females are noteworthy for continuously guarding their progeny, from egg to adult emergence, by using their broadly expanded elytra as barriers to fend off attackers. Larvae possess a remarkable telescoping anus that deposits digestive wastes fortified with host-derived metabolites on a highly mobile appendage to form a chemically deterrent defensive shield (Fig. 1a; Vencl et al. Reference Vencl, Morton, Mumma and Schultz1999). Previous research demonstrated that each defence was targeted (i.e., most effective against a particular enemy, or functional guild with the same attack mode). Furthermore, each defence was less effective against other enemies (i.e., low cross-resistance). For example, although it narrowly targeted social wasps, maternal guarding lacked substantial cross-resistance against other enemies (Vencl & Srygley Reference Vencl and Srygley2013). Whereas shields deterred ants, they were much less effective at thwarting wasp or bug attacks (Vencl et al. Reference Vencl, Nogueira-de-Sa, Allen, Windsor and Futuyma2005). Here, we evaluated the performance of the guard and shield defences by experimentally removing them without otherwise harming the larvae (Vencl et al. Reference Vencl, Morton, Mumma and Schultz1999). This allowed us to compare the relative background mortality due to a given enemy with the mortality resulting from the presence or absence of a particular defence. Thus, the Acromis system afforded us the opportunity to assess whether extreme temperature deviations in equatorial Pacific SSTs teleconnect to alter local climate parameters to: (1) favour some enemies over others and (2) alter the efficacy of anti-enemy defence adaptations that increase beetle vulnerability. We present findings implicating extreme ENSO events with two types of herbivore anti-enemy defence breakdowns that significantly increase beetle mortality: (1) decoupling occurs when the effectiveness of a narrowly targeted defensive adaptation that is most effective against a specific enemy, or enemy guild with a shared attack mode, is reduced to increase beetle mortality, and (2) mismatching occurs when a narrowly targeted defence adapted for a particular enemy becomes even less effective against other non-targeted enemies to increase beetle mortality. Ultimately, by measuring the potential of the ENSO cycle to shift enemy background pressure to alter the herbivore’s susceptibility to attack, our results shed new light on the interplay between biotic and abiotic drivers of instability in a simple neotropical trophic network.
The Acromis sparsa study system: (a) a guarding female, egg stack (dashed arrow), and first instar larvae with shields (solid arrow), and; (b) the effects of ENSO on A. sparsa fecundity and egg survival. Clutch size declined with ENSO (− sign). Mortality due to egg parasitoids was directly proportional (+ sign) to ENSO. Consequently, larval hatching was inversely proportional to ENSO (− sign) and significantly declining in El Niño years. The reduction in clutch size, the number of eggs lost to parasitism, and the number of eggs hatching with each degree increase in the sea surface temperature were modelled for an average clutch (95% confidence interval or se and sample sizes are given in the boxes). Mean ambient temperature of the first quarter was directly proportional to ENSO (+ sign) and it was also the local weather parameter that best explained variation in egg parasitism and hatching.

Materials and methods
Study organisms and field site
Adults and larvae of Acromis sparsa (Boheman) (Chrysomelidae: Cassidinae) feed solely on the morning glory vine, Camonea umbellata (L.) Simoões & Staples (Convolvulaceae), which is a common colonist of forest edges, gaps, and roadsides throughout the Neotropics (Croat Reference Croat1978; Holm et al. Reference Holm, Pancho, Herberger and Plucknett1979). In Panamá, the appearance of A. sparsa coincides with new vine flushing at the onset of the wet season rains in early to mid-May. The peak of mating and oviposition begins in mid-June and runs through July. Reproduction ceases during the dry season from late December to April of most years (Windsor Reference Windsor1987). We investigated the A. sparsa-natural enemy community in a large field at the edge of late second growth wet lowland rainforest located along Pipeline Road, Soberania National Park, Republic of Panamá (9° 07.6’ N, 79° 42.5’ W; 2148 mm mean annual rainfall; 51 m AMSL). The 750 m2 field, dominated by small secondary growth perennials, invasive grasses, and vines, had a 300-m network of trails built to access C. umbellata vines and associated insects. Due to increased rates of forest conversion, the Acromis-Camonea network is expanding.
Enemies of Acromis sparsa
The specialist eulophid wasp egg parasitoid, Emersonella pubipennis Hanson (Chalcidoidea: Eulophidae), is the chief source of A. sparsa egg mortality with guarding females present (Cuignet et al. Reference Cuignet, Windsor, Reardon, Hance, Jolivet, Santiago-Blay and Schmitt2008). The small myrmicine ant, Crematogaster carinata Mayr, is an extremely common nocturnal egg predator at the study site and in secondary forest across the Isthmus of Panamá. The diurnal ant, Camponotus senex Smith (Formicidae: Formicinae), and the nocturnal/diurnal ants Azteca chatifex Forel and A. pilosula (lacrymosa) Forel (Formicidae: Dolichoderinae) were the chief walking predators of eggs and larvae during the study. The social wasp, Polybia rejecta Fabricius (Hymenoptera: Vespidae) is the most successful aerial hymenopteran enemy in the study site, accounting for all observed larval mortality. The piercing/sucking (haustellate) heteropterans, Stiretrus anchorago (F.), (Pentatomidae: Asopinae), Apiomerus pictipes Herrich-Schaeffer (Reduviidae: Apiomerinae), and Montina nigripes Stål (Reduviidae: Harpactorinae) are frequent attackers of larval beetles. Parasitoid tachinid flies (Tachinidae: Eucelatoria spp.) lay eggs in larvae and emerge from pupae.
Larval defence manipulations
Over five years (2007–2011) during April–July, A. sparsa females guarding egg masses were located and the host plants flagged. Following hatching, the number of eggs with small round exit holes made by parasitoids, the number of eggs with holes made by hatching beetle larvae, which are easily distinguishable from the parasitoids, and the number of eggs that otherwise failed to hatch were counted. Summed together, these counts constitute the total number of eggs in a given clutch.
Defences were manipulated when larvae were three or four days old. For some broods, the adult female was removed to eliminate the guarding defence, and for others, the female was brushed gently aside and the larval shields removed with soft forceps (see Vencl & Srygley Reference Vencl and Srygley2013). For controls, the female was brushed aside and the larvae gently stroked with soft forceps daily. These manipulations continued until the larvae pupated. Broods were monitored three to four times daily between 0700 and 1600 h. Predation events were monitored until their completion. The category of the predator (ant, social wasp, and true bug) and the number of larvae missing were recorded. Monitoring continued until two to three days after pupation (20–22 days post-hatch), when pupae were collected, counted, and transferred to the laboratory to monitor each brood for adult eclosion and the emergence of larval parasitoids. Sample sizes, predation, and parasitoid observations are provided in Supplemental Table S1. Eclosed beetles were released on the study site.
Global and local climate
As an indicator of the ENSO, the SST anomaly measured from Niño region 3.4, located between latitudes 5°N and 5°S and longitudes 120–170°W was used. The Climate Prediction Center (http://www.cpc.ncep.noaa.gov/data/indices) characterises SST in this region as critical to defining warm (>0.5°C) El Niño and cold (<0.5°C) La Niña episodes. Anomalous SST that is greater than 1.5°C above or below the average SST is considered an extreme event (Trenberth Reference Trenberth1997). Although there were no extreme El Niño events during the study, there were two extreme La Niñas. El Niño events typically begin in October and extend through March. Thus, we used the SST in the latter quarter of that period (January to March), which coincides with the dry season in Panamá. From monthly data, we calculated the mean SST anomaly for the first calendar quarter of each year of the experiment (2007–2011).
We summarised local climatic parameters in the first calendar quarter of each year when the parental beetles and the predators might be subject to the greatest impact of ENSO. The body temperature of the beetles and their invertebrate predators is dependent on ambient temperature and sunlight. The host plant quality may also be dependent on these parameters and on rainfall. Because these environmental parameters could also directly affect maternal guarding, larval shields, and consequently vulnerability to enemy attacks, we also summarised local climatic parameters in the second calendar quarter of each year.
Ambient temperature, incident sunlight, and precipitation were measured every 15 min at the outdoor climate change laboratory of the Smithsonian Tropical Research Institute in Gamboa 1 km from the study site (9° 6' 59.4'' N, 79° 41' 33.4'' W). Ambient temperature was summarised as an average for the first calendar quarter and one for the second quarter of each year. Incident sunlight was summarised as the total photosynthetically active radiation (PAR) for each of the first and second quarters of each year. Total precipitation for the first quarter and the second quarter were calculated. Dry season typically extends from mid-December to the end of April in Panamá.
Statistical analyses
The number of eggs in a clutch was not significantly different from a normal distribution, and so we used a generalised linear model (GLM, identity linked and normally distributed) to model the effect of ENSO on the number of eggs. The number of eggs that were parasitised and the number of eggs that hatched were each modelled with GLM (logit-linked, binomial distribution) to analyse the effects of ENSO.
We analysed whether the effect of maternal guarding on the proportions of larvae that were killed by ants varied with ENSO. Larval mortality by ants (i.e., number killed by ants divided by the total number of larvae in the brood) was modelled with ENSO as the covariate, maternal guard (two levels) as the independent factor, and their interaction using GLM (logit-linked, binomial distribution). If the interaction was not significant (alpha equal to 0.05), it was pooled with error. Subsequently if the independent factor or covariate was not significant, it too was pooled with error to test the effect of ENSO on the proportion of larvae killed by ants. This analysis was repeated for mortality due to wasps and that due to true bugs (hereafter, bugs).
Finally, ENSO-associated variance in the effect of maternal guarding on the proportion of larvae that were killed by larval parasitoids was modelled with GLM (logit linked, binomial distribution). This was done in the same way as for the other larval predators except for the way that the mortality proportions were generated. Larvae killed by ants, bugs, and wasps may have been parasitised, but a parasitoid could not emerge and would be missed in our count. To adjust for this error, we used the number of larvae that remained after predation events in generating mortality proportions for the GLM. Whether the efficacy of shields on the proportion of larvae killed by ants, wasps, bugs, or larval parasitoids varied with ENSO was performed in the same way as outlined above for maternal guarding.
In order to relate the effects of the global climate cycle on predation to local changes in the environment, we analysed each dependent variable, that is, egg number, egg parasitism, larval hatching, or larval mortality due to each predator, with GLM as above but substituting ENSO with each of the six environmental parameters as the covariate. We then selected the environmental parameter for which the model of mortality by the predator generated the lowest Akaike Information Criterion (AIC), and any other environmental parameters for which the model was within two units of the lowest AIC. Finally, we used these parameters to compare the model with ENSO as the covariate.
Results
Egg laying, parasitism, and egg hatching
During 2007 to 2011, ENSO fluctuated between La Niña events of 2008 (so-called although an event initiated in the latter half of the previous year), 2009, and 2011 and the El Niño event of 2010. Clutch sizes decreased by an average of 1.1 eggs for each degree increase in SST (Table 1, Fig. 1b; Table S2). None of the local environmental parameters improved the model. The proportion of parasitised eggs increased with ENSO, and accordingly, beetle hatching declined. The increase in egg parasitism and decline in hatching were both best explained by increasing ambient temperature in the first calendar quarter. Hence, there was no evidence that females compensated for increased egg parasitism in warmer El Niño years by laying larger clutches. On the contrary, females laid smaller clutches in El Niño years.
Effects of ENSO and the environmental factor that best explained the number of eggs laid, the proportion parasitised, and the proportion of eggs hatching

Regressor abbreviations: ENSO = El Niño Southern Ocean Oscillation; Ta = ambient temperature; Q1 = first quarter (January–March); Q2=second quarter (April–June).
Maternal guarding
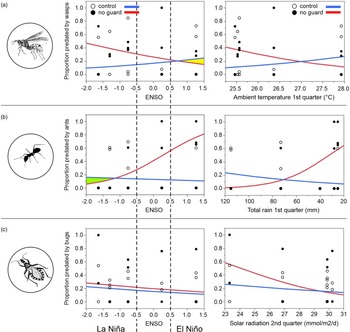
With experimental removal of maternal guards, predation of beetle larvae by wasps was significantly affected by an interaction between the maternal guard and the ENSO covariate (Table 2; Table S3). The efficacy of maternal guarding was greatest against wasps following La Niña events when the proportion of deaths of unguarded beetle larvae was highest (Fig. 2a). Wasp predation on unguarded larvae decreased with increasing temperature in the first quarter.
Effects of ENSO, environmental parameters, maternal guards, and their interaction on larval mortality caused by predators in the maternal guard removal experiment

**P < 0.001; ***P < 0.0001.
Covariate abbreviations: ENSO = El Niño Southern Ocean Oscillation; Ta = ambient temperature; Q1 = first quarter (January–March); Q2 = second quarter (April–June).
Proportion of Acromis sparsa larvae with (open circles) and without (solid circles) maternal guarding captured by wasps (a), ants (b), and bugs (c) relative to the correlated ENSO weather parameters of temperature, rain, and radiation, right panels, respectively. Modelled regression lines are for larvae without maternal guards (red line) and control larvae with intact defences (blue line). Oscillations between El Niño and La Niña phases of ENSO (vertical dashed lines) are defined as a sea surface temperature anomaly of plus or minus 0.5°C, respectively. The proportion of larvae captured for each predator guild is regressed on the weather parameter that best explained the variance in the corresponding panel on the right. Defence–enemy decoupling (2a) or mismatching (2b) are represented by yellow and green shaded areas, respectively. Wasp, bug, and ant icons represent the predator guilds.

On the other hand, the effectiveness of guarding was greatest against ants following El Niño because the proportion of deaths of unguarded prey increased with ENSO (Table 3, Fig. 2b). The local environmental parameter that best explained larval mortality due to ants was rainfall in the first calendar quarter. With decreasing rainfall, ant-induced mortality of larvae without maternal guards increased disproportionately, making maternal guarding extremely important for defending against ant attacks following drier El Niño events. In sum, the drier dry seasons generally associated with El Niño events were favourable for ants, while the cooler dry seasons generally associated with La Niña events were favourable for wasps.
The effects of ENSO, shields, their interactions with mortality, and the environmental covariate that best explained larval mortality by different predatory agents in the shield removal experiment

# Environmental covariate yielding a model within 2 AIC of model with lowest AIC.
*P < 0.01; **P < 0.001 ***P < 0.0001.
Covariate abbreviations: ENSO = El Niño Southern Ocean Oscillation; Ta = ambient temperature; Q2 = second quarter (April–June).
Maternal guarding significantly reduced larval mortality due to bugs. Bug-induced mortality declined with ENSO, such that it was more prevalent following La Niña events (Table 2, Fig. 2c). Larval mortality due to bugs was best explained by sunlight in the second quarter.
Larval shields
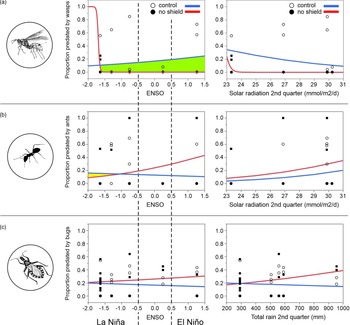
With the experimental removal of shields, predation by wasps on beetle larvae was significantly affected by the interaction between shields and the ENSO covariate (Table 3). The efficacy of shields against wasps increased following La Niña events when the proportion of deaths of unshielded beetle larvae was highest (Fig. 3a; Table S4). Sunshine was a significant predictor of larval mortality due to wasps. As with guarding, the efficacy of shields against ants was greatest following El Niño events because the proportion of deaths of unshielded beetles increased with ENSO (Fig. 3b). Again, sunshine was a significant predictor of mortality from ants. For bugs, shields were ineffective, reducing mortality with ENSO by less than 10% (Fig. 3c). In this instance, rainfall was associated with mortality from bugs, but sunshine in the second quarter yielded a model that was within 2 AIC, and thus, either covariate could be considered the best to model mortality from bugs (Table 3; Table S3).
Proportion of Acromis sparsa larvae with (open circles) and without (solid circles) shields captured by wasps (a), ants (b), and bugs (c) relative to the correlated ENSO weather parameters of radiation (a, b right panels) and rainfall (c right panel). Larval mortality is regressed on the weather parameter that best explained the variance in predation from each predator guild. Modelled regression lines are for larvae with the shield removed (red line) and controls (blue line). El Niño and La Niña anomalies (vertical dashed lines) are defined as in Fig. 2. Defence–enemy decoupling (a) or mismatching (b) are represented by yellow and green shaded areas, respectively. Predator icons as in Fig. 2.

Larval parasitoids
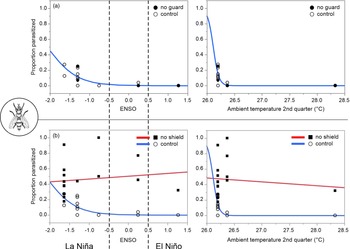
Although maternal guarding did not have a significant effect on larval parasitism, the proportion of parasitised larvae declined with ENSO and associated increasing temperatures (Fig. 4a; Table 2). Shield effectiveness against larval parasitoids increased with ENSO, due in part to a slight increase in parasite pressure evident on shieldless larvae (Fig. 4b, Table 3). Mortality due to larval parasitoids declined slightly with increasing temperature in the second quarter and shields were highly effective, reducing parasitism to near zero in all but the coolest years.
Proportion of Acromis sparsa larvae parasitised by tachinid flies: (a) with (open circles) and without (filled circles) maternal guards, and; (b) with (open circles) and without (filled squares) shields during El Niño or La Niña in relation to ambient temperature (right panels). El Niño and La Niña ENSO anomalies (vertical dashed lines) are defined as in Fig. 2. Modelled regression lines in (a) are for all larvae because removal of the guard did not affect parasitism rates. Modelled regression lines in (b) are for larvae with shields removed (red line) and controls (blue line). A fly icon represents the larval parasitoid guild.

Discussion
This study’s findings support the idea that oscillations in the geographically remote ENSO cycle had a pronounced influence on local climate that significantly impacted the Acromis-natural enemy community in Panamá. For example, as SSTs increased and local ambient temperatures rose, egg parasitism rates increased and commensurate hatching rates declined. Consequently, the larval resource available to predators and parasitoids diminished in El Niño years, a reduction that likely intensified competition among larval enemies. Our findings also demonstrate that specific environmental features (e.g., temperature and rainfall) associated with ENSO favour some predators (e.g., wasps and ants) over others, but only temporarily, until the local climatic state shifts in response to ENSO. Furthermore, the comparison of the defence manipulations with controls exposed background mortality from shifting enemy threats. At the same time, larvae were assayed for the added predation pressure caused by the experimental defence removal. For example, whereas the background predation from parasitoids was highest in La Niña, at nearly 45%, predation pressure from wasps, ants, or bugs was at or below 20% during El Niño episodes.
The defence manipulation experiments revealed two types of ENSO-related defence–enemy breakdowns: (1) defence–enemy decouplings occurred when mortality due to a specialised enemy actually increased for prey with a narrowly targeted defence against that enemy during the ENSO cycle, and (2) defence–enemy mismatches occurred when the already low cross-resistance of a narrow defence against non-target enemies was reduced still further to increase beetle mortality. Maternal guarding provides an example of a defence decoupling whereby a narrow defence exacerbates mortality from the enemy it is supposed to specifically protect against. Guarding was previously shown to be a narrowly targeted defence that is most effective against social wasps and that displays little cross-effectiveness against other enemies (Vencl et al. Reference Vencl, Nogueira-de-Sa, Allen, Windsor and Futuyma2005; Vencl & Srygley Reference Vencl and Srygley2013). However, as temperatures increased during El Niño events, mortality from social wasps for guarded larvae was actually higher than it was for unguarded larvae, despite that fact that guarding is a wasp-targeted defence (Fig. 2a; yellow shaded area). This reversal of effectiveness was induced by the rising temperatures and decreasing rainfall associated with the El Niño phase of ENSO. Social wasps appear to be highly sensitive to climatic variations associated with ENSO (Estay & Lima Reference Estay and Lima2010). In our study, wasp predation rates on guarded larvae were lower in the 2008, 2009, and 2011 La Niña years. Although wasp nest abundances were found to be reduced in wetter, cloudier conditions associated with La Niña years (Dejean et al. Reference Dejean2011), we observed that wasps in fact do better following the ensuing, relatively milder La Niña dry seasons as compared to those of El Niño. We suspect that more prey became available in these less severe La Niña dry seasons to support continued nest activity compared to the much drier El Niño dry seasons.
Guarding also afforded an example of defence–enemy mismatching whereby its already low effectiveness against non-target enemies became even lower. Previous studies of A. sparsa´s defence arsenal showed that guarding was not very effective against ants (Vencl et al. Reference Vencl, Nogueira-de-Sa, Allen, Windsor and Futuyma2005; Vencl & Srygley Reference Vencl and Srygley2013). Here, we observed that the presence of a guarding female during La Niña significantly increased larval mortality due to ants compared to their unguarded counterparts. This increased hazard of defence–enemy mismatching occurred when local rainfall was higher during La Niña phase of ENSO (Fig. 2b; green shaded area). Whereas female removal drastically increased larval mortality against social wasps during La Niña, it was disastrous against ants in El Niño.
Larval shields provided a second example of defence–enemy mismatching. Shields were unequivocally detrimental to larval survival across all ENSO states when wasps were the major attackers (Fig. 3a; green shaded area). We also found that shields are least detrimental to larval survival at higher levels of solar radiation such as during El Nino events with mortality approaching that of beetles with shields removed. We suspect that the evolution of guarding came at the expense of a reduction in shield size to facilitate the ability of females to cover and to traverse the brood without becoming encumbered by shield faecal material. Consequently, A. sparsa larval shields are 1/5 smaller than their related counterparts lacking the guarding defence (Vencl et al. Reference Vencl, Nogueira-de-Sa, Allen, Windsor and Futuyma2005). Whereas smaller shields may be an adaptation that permits the guarding female to traverse the larval rosette more freely, it comes at the expense of weaker chemical protection. Given the inclemency of the edge habitat, where downpours can alternate with periods of high insolation and extreme heat in El Niño, shields could function in other capacities. As parasols, smaller shields may provide less physical protection from the lethal effects of solar radiation associated with increasing ENSO (Olmstead & Denno Reference Olmstead and Denno1993; Eisner & Eisner Reference Eisner and Eisner2000).
Shields are particularly effective at deterring generalist predatory ants, such as Azteca pilosula and A. chartifex. Deshielded larvae suffer the highest mortality rate (80%) from attacking ants compared to the other predatory threats. Shields contain large amounts of host sequestered octadecanoic acid which elicits necrophoresis in ants – anything emitting this fatty acid is ignored or discarded on the nest trash heap, an outcome that constitutes an effective means of escape for a larva concealed beneath a shield (Morton & Vencl Reference Morton and Vencl1998; Vencl et al. Reference Vencl, Morton, Mumma and Schultz1999; Vencl & Srygley Reference Vencl and Srygley2013). Nevertheless, shields provide another instance of defence–enemy decoupling due to the remote influence of ENSO. Whereas shields afforded their greatest benefit deterring ants during El Niño, when ant predation was highest, they became lethal handicaps that actually increased mortality from ants during the periods of higher rainfall associated with La Niña compared to their deshielded counterparts (Fig. 3b, yellow shaded area). These findings are consistent with the possibility that the heavy rainfall associated with La Niña may dissolve the more soluble defensive metabolites to weaken the shield chemical defence (Müller & Hilker Reference Müller and Hilker1999).
In addition to the disruption of larval defence function, the long-distance influence of ENSO affected relative enemy abundances. For example, consistent with the effect of El Niño on social wasps, El Niño worked against wasp and fly parasitoids. Losses to tachinid flies declined with the reduced rainfall and increased temperatures associated with the weakening La Niña anomalies in 2008 and 2010. Consistent with this observation was the fact that the populations of many wasp and fly parasitoids are generally highest during wetter La Niña events and lowest during drier El Niño episodes (Harrison Reference Harrison2000; Shapiro & Pickering Reference Shapiro and Pickering2000). Although we found egg parasitoids were more prevalent in El Niño compared to La Niña years, droughts associated with extreme El Niño events may reduce these populations as they do for parasitoids attacking Lepidoptera (Janzen Reference Janzen1967; Van Bael et al. Reference Van Bael, Aiello, Valderrama, Medianero, Samaniego and Wright2004).
Mortality due to bugs declined for both guarded and unguarded larvae with the increasing temperatures associated with El Niño. Unguarded larvae suffered higher bug mortality when there was less sunlight in La Niña. The mortality due to bugs decreased as sunlight increased in the second quarter. In sum, mortality of unguarded larvae was greatest in years with less sunlight, while the efficacy of the guarding defence was greatest those same years. Shields were previously shown not to be very effective against bugs (Vencl et al. Reference Vencl, Nogueira-de-Sa, Allen, Windsor and Futuyma2005). Here, bug predation of shielded larvae increased somewhat as temperatures increased through the ENSO cycle, a finding consistent with an increase in bug abundance measured in a survey on nearby Barro Colorado Island during El Niño (Lucas et al. Reference Lucas, Forero and Basset2016). However, as rainfall increased, the lack of a shield became a handicap that increased larval mortality even as bug predation pressure decreased during El Niño.
Larval losses to wasp and fly parasitoids were lower as the sea surface temperature cooled into the La Niñas of 2008 and 2010. Consistent with these observations is the fact that many parasitoids populations are highest during La Niña´s wetter, cooler episodes (Harrison Reference Harrison2000; Shapiro & Pickering Reference Shapiro and Pickering2000; Romo & Tylianakis Reference Romo and Tylianakis2013; Salcido et al. Reference Salcido, Forister, Lopez and Dyer2020). Our findings support the idea that the synchronised phenologies linking parasitoid to their host are highly susceptible to the climatic variations associated with the ENSO cycle. Because they directly affect host emergence time and development rate, increasing temperatures, and associated droughts, have the potential to desynchronise both host and parasitoid phenologies and thus heighten the risk of an herbivore outbreak (Visser & Both Reference Visser and Both2005; Stireman et al. Reference Stireman2005; Hance et al. Reference Hance, van Baaren, Vernon and Boivin2007; Parmesan Reference Parmesan2006; Dyer et al. Reference Dyer, Richards, Short and Dodson2013).
Forest edge communities, like the Acromis-Camonea system, are highly vulnerable to climatic perturbations for several reasons. First, edges have more ecologically specialised interactions compared to other habitats (Wirth et al. Reference Wirth, Meyer, Leal, Tabarelli and Lüttge2008). They also have higher parasitoid/host ratios, rates of parasitism, and diversities of diet-specialised parasitoids with less ability to attack alternative hosts (Tylianakis et al. Reference Tylianakis, Didham, Bascompte and Wardle2008). Moreover, Salcido et al. (Reference Salcido, Forister, Lopez and Dyer2020) found that parasitism rates of caterpillars decreased with increasing variability in inter-annual temperature and precipitation imposed by the ENSO cycle. Our findings support the idea that interactions among edge species are highly susceptible to climate change. The experimental manipulations revealed that when ENSO oscillates rapidly, some beetle enemies react favourably to El Niño while others react favourably to La Niña. Although such offsetting enemy threats might temporarily dampen fluctuations to stabilise the community, ENSO-driven oscillations will likely increase the amplitude and frequency of variation in local climate stressors (rainfall, temperature, and insolation) to seriously disrupt interactions among ecologically specialised species. The dietary specialisation of both A. sparsa and its egg parasitoid may make them, as well as their interaction, prone to extinction (Tylianakis et al. Reference Tylianakis, Laliberté, Nielsen and Bascompte2010; Forister et al. Reference Forister2015; França et al. Reference França2020).
The foreseeable consequences of more extreme and frequent ENSO events will include an increase in functional defence–enemy decouplings and mismatches that will serve to heighten herbivore vulnerability. Although we were fortunate to have three La Niñas and one El Niño during the study´s five years, experimental studies of predation over a longer term should be done to confirm the role of ENSO on herbivore survivorship and defence efficacy. Ultimately, this study highlights the potential of manipulative experiments to not only increase our understanding of the potential of ENSO-driven local climatic factors to foster breakdowns in defence performance, but also to improve our knowledge of how defences mediate the prey–enemy interactions essential to the structure of tropical communities.
Supplementary material
The supplementary material for this article can be found at https://doi.org/10.1017/S0266467423000226
Acknowledgements
We thank M. Garcia and K. Winter for access to Gamboa climate data. We are grateful to R. Urriola for instrument loans and use of STRI facilities. We are very gratefully to R. Tropek and an anonymous referee for thoughtfully evaluating the manuscript. We wish to thank L. Ginsberg and J. Gurevitch for valuable comments to early versions of the manuscript. Experiments and specimen collection were done under permits issued by the Authoridad Nacional del Ambiente de Panamá (DAPVS-01-2008, SE/A-32-09-11).
Financial support
The participation of RBS was supported by funds to USDA appropriated by the US Congress.
Competing interests
The authors have no conflicts or competing interests.