I. INTRODUCTION
Nanoscale characterization of materials is required to understand the onset of physical phenomena such as diffusion across a boundary. Atom probe tomography (APT) has advantages to transmission electron microscopy (TEM) in combined chemical and spatial resolution. However, for ceramic materials, unlike some metals, Reference Gault, Moody, de Geuser, Tsafnat, La Fontaine, Stephenson, Haley and Ringer1 information about the specimen crystallography cannot be obtained easily in the atom probe. Furthermore, analysis of ceramic materials in the atom probe requires the use of laser pulsing to induce field emission of ions. It is generally accepted that the mechanism of field emission for oxides is due to thermal pulsing Reference Kelly and Miller2,Reference Kelly, Vella, Bunton, Houard, Silaeva, Bogdanowicz and Vandervorst3 ; hence, temperature increases are induced in the specimen for a short period of time. Due to the small thermal mass of atom probe specimens, temperature changes from ∼20 to >300 K in nominally 10–200 ps are possible. Reference Kelly, Vella, Bunton, Houard, Silaeva, Bogdanowicz and Vandervorst3–Reference Vella, Houard, Vurpillot and Deconihout5 The thermal cycling depends on laser fluence, laser absorption, and material properties such as thermal conductivity, specimen geometry, and thermal mass. Reference Diercks, Gorman, Kirchhofer, Sanford, Bertness and Brubaker6–Reference Vella, Mazumder, Da Costa and Deconihout8 In this paper, the performance of a dynamic experiment, a time-dependent phenomenon that can be observed in the atom probe, is explored.
A system consisting of a transparent conductive oxide thin film with nominal composition Zn0.70Mg0.29Ga0.01O deposited on c-oriented sapphire (α-Al2O3) was chosen. Ga is added to the ZnO thin film to improve carrier concentration while Mg additions are used to tune the band gap energy (E
g).
Reference Ohtomo, Kawasaki, Ohkubo, Koinuma, Yasuda and Segawa9,Reference Maejima, Shibata, Tampo, Matsubara and Niki10
The presence of Mg changes the lattice spacing of ZnO by <1%,
Reference Ke, Berry, Parilla, Zakutayev, O’Hayre and Ginley11,Reference Park, Yi and Jang12
therefore, the film can still grow epitaxially on the substrate. It is known that the maximum solubility of Mg in ZnO is 33 at.%
Reference Ohtomo, Kawasaki, Ohkubo, Koinuma, Yasuda and Segawa9,Reference Sharma, Narayan, Muth, Teng, Jin, Kvit, Kolbas and Holland13
and the films with the Mg content below 15 at.% do not show segregation even after annealing at 1273 K.
Reference Ohtomo, Kawasaki, Koida, Masubuchi, Koinuma, Sakurai, Yoshida and Yasuda14
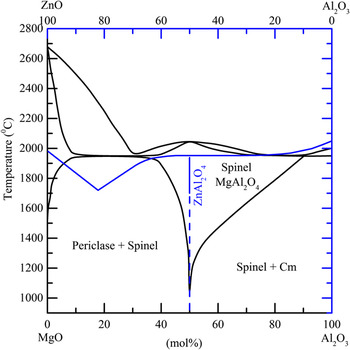
The equilibrium phase diagram in Fig. 1 for (Mg,Zn)O and Al2O3 shows that at 50 mol%, spinel (a cubic phase with space group
 $Fd\bar 3m$
) is formed and will have a composition (Zn,Mg)Al2O4.
Reference Bunting15,Reference Barry, Dinsdale, Gisby, Hallstedt, Hillert, Jonsson, Sundman and Taylor16
Information about the different phases in the study is presented in Table I. This system is adequate for studying the possible phase transformations since each phase has a distinct chemistry and crystallography.
Equilibrium phase diagram for MgO + Al2O3 (black) and ZnO + Al2O3 (blue) showing the formation of spinel at 50 mol% Al2O3.

Lattice parameters and crystallographic information for α-alumina, the ZnMgO:Ga film, and spinel. Reference Kelly, Vella, Bunton, Houard, Silaeva, Bogdanowicz and Vandervorst3,Reference Maejima, Shibata, Tampo, Matsubara and Niki10,Reference Sampath, Kanhere and Pandey17–Reference Ball, Pirzada, Grimes, Zacate, Price and Uberuaga19

II. EXPERIMENTAL METHODS
ZnMgO:Ga films of about 50 nm were grown on polished α-Al2O3 single crystals via pulsed laser deposition. The depositions were performed at 973 K and 10−7 mbar in an oxygen atmosphere. Further details on the growth process can be found in Ref. Reference Ke, Berry, Parilla, Zakutayev, O’Hayre and Ginley11. Samples were prepared for laser irradiation and subsequent atom probe analysis using a dual-beam focused ion beam (FIB)/scanning electron microscope by the standard method developed by Thompson et al. (2007). Reference Thompson, Lawrence, Larson, Olson, Kelly and Gorman20 The samples were mounted in such a way that the film/substrate interface was perpendicular to the direction of analysis. Following final milling and low energy FIB cleanup, all specimens had an initial ZnMgO:Ga thin film thickness of approximately 50 nm. The typical tip radii ranged between 20 and 75 nm with a shank angle of less than 15°.
Laser irradiation was performed in the atom probe using 100 or 1000 pJ/pulse for 8.64 × 10¹⁰ pulses. The pulse frequency was 1 MHz and the laser pulse duration is nominally under 10 ps with a spot size of ≤1 μm at full width half-maximum. A constant voltage of 500 V was applied to the specimens during irradiation. The voltage is the minimum that can be applied using the user interface of the local electrode atom probe (LEAP) instrument. Due to field enhancement at the tip radius, the applied field varied between 2.0 and 7.5 V nm−1. These fields are not sufficient to cause ionization of the atoms at the surface of the tip since typically an applied field of 10–40 V nm−1, depending on the material, is required. Reference Miller and Forbes21 The mass spectrum during the run was monitored to determine if any field induced evaporation of atoms at the surface occurred. Only a constant background was observed with no peaks corresponding to any species.
Laser-assisted APT analysis was performed in a Cameca LEAP 4000XSi system (Cameca Instruments, Madison, WI) with a flight path set to 90 mm to maximize the field-of-view. Laser pulsing was performed in the APT analyses using a 355 nm wave length at 100 pJ/pulse. The specimen base temperature was between 20 and 50 K, acquisition rate was set at 0.5%, and the laser pulse frequency was 625 kHz. The analysis conditions were optimized for specimen yield and did not yield accurate cation/oxygen stoichiometries.
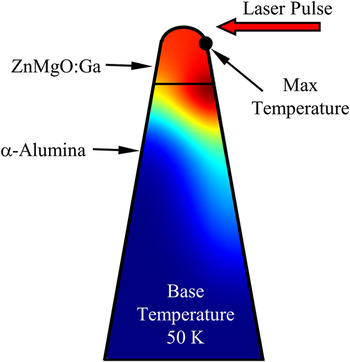
Thermal modeling to estimate the specimen temperature during laser pulsing was performed using a COMSOL™ Multiphysics package. The two-dimensional (2D) model simulates a 10 ps laser pulse at an initial temperature (25–300 K used in the simulations) and determines the transient temperature across the specimen. It is also possible to simulate a specimen that consists of different films of material, such as the ZnMgO:Ga/α-Al2O3 (Fig. 2). An assumption is made that complete laser absorption takes place regardless of the band gap of the material; however, this parameter can be changed in the model if the actual laser absorption (αphoton) is known. Also assumed is the laser pulse impinges on the specimen at the apex and that the laser pulse is Gaussian in spatial and temporal distribution.
Representation of an atom probe specimen modeled using COMSOL™ Multiphysics package showing the overall temperature distribution, geometry of the films, and the direction of the laser pulse.

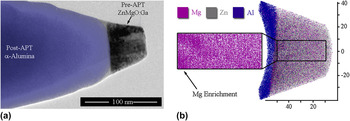
Characterization of the specimens was performed ex-situ using a Philips CM 200 transmission electron microscope (TEM) operated at 200 keV accelerating voltage and equipped with a TEM/APT compatible holder (Hummingbird Scientific, Lacey, WA) that allows for cross-correlative analysis of the APT specimens. Reference Gorman, Diercks, Salmon, Stach, Amador and Hartfield22 Pre- and post-APT images of the specimens were collected to determine the initial and final tip radius, the sphere-to-cone ratio (r s/r c), and total analyzed volume. An example of an APT specimen before and after APT analysis is shown in Fig. 3(a). All the aforementioned information on specimen geometries before and after APT analysis was used to create accurate data reconstructions [Fig. 3(b)].
(a) TEM micrograph of a representative atom probe specimen showing the pre- and post-APT (blue) images overlaid, and (b) the corresponding reconstruction showing a fraction of the ions collected and the lattice spacing in the film. The α-alumina substrate is indicated in blue. Small areas of Mg enrichment are apparent at the interface with the ZnMgO:Ga film.

Analysis of the atom probe data was performed using IVAS™ v.3.6.6. In the reconstruction, the ion volumes were adjusted for the species. For example, from Table I, it is found that the ZnMgO:Ga film has a hexagonal structure (P63 mc) with a unit cell volume of 0.04757 nm3 and 10 atoms per unit cell. The calculated volume is 0.004757 nm3 per atom. In the case of molecular clusters, the ionic volume was multiplied by the number of atoms in the cluster. Care was taken to reconstruct volumes accurately since the ZnMgO:Ga/α-Al2O3 interface was of interest. The detector efficiency (β), image compression factor, and r s/r c were adjusted until the correct analyzed volume and lattice spacing of the ZnMgO:Ga film was obtained. As shown in Fig. 3(b), proper data reconstruction using correlative TEM with APT can achieve lattice spacing in the z-direction of the data reconstruction; this has not been previously observed in APT analyses of oxides.
III. RESULTS
Pre- and post-laser irradiation examination of the ZnMgO:Ga layer on α-Al2O3 is presented. The composition of the ZnMgO:Ga layer was determined for atom probe acquisition conditions that yielded a composition near nominal. Special care was taken to produce reconstructions that were accurate to characterize the interface of the ZnMgO:Ga and α-Al2O3. Finally, the results of finite element modeling using COMSOL™ were used to estimate the temperature reached by a representative specimen during laser pulsing.
A. Characterization prior to laser irradiation
As noted previously, specimens were characterized using TEM to evaluate the microstructure and crystallography of each sample. Figure 3 shows a bright-field TEM micrograph of an atom probe specimen where the entire thickness of the ZnMgO:Ga film is shown. The film showed a high density of dislocations near the interface with α-Al2O3; it is known that threading dislocations are the main defect formed during deposition of (Zn,Mg)O. Reference Sharma, Narayan, Muth, Teng, Jin, Kvit, Kolbas and Holland13 Despite the high level of the Mg content in the film, evidence of phase separation between MgO and ZnO was not observed, which is consistent with previous findings for thin films with this composition. Reference Sharma, Narayan, Muth, Teng, Jin, Kvit, Kolbas and Holland13 However, a small amount of Mg enrichment was observed at the interface with the sapphire substrate.
A high-resolution TEM micrograph and representative selected area diffraction patterns (SADP) acquired at the interface of the α-alumina substrate and ZnMgO:Ga film are shown in Fig. 4(a). The hexagonal ZnMgO:Ga film (space group P63
mc) and substrate
 $\left( {R\bar 3c} \right)$
have good lattice matching with no indication of phase separation between MgO and ZnO. It was found that
 ${\left[ {2\bar 1\bar 10} \right]_{\alpha {\rm{ - A}}{{\rm{l}}_2}{{\rm{O}}_3}}}\left\| {{{\left[ {0\bar 1\bar 10} \right]}_{{\rm{ZnMgO}}}}} \right.$
and
 ${\left[ {0001} \right]_{\alpha {\rm{ - A}}{{\rm{l}}_2}{{\rm{O}}_3}}}\left\| {{{\left[ {0001} \right]}_{{\rm{ZnMgO}}}}} \right.$
.
(a) High-resolution TEM micrograph of the interface between the ZnMgO:Ga film and the α-Al2O3 substrate with the corresponding diffraction patterns. The reflections corresponding to the substrate (α-Al2O3) for B =
 $\left[ {2\bar 1\bar 10} \right]$
are shown. A diffraction pattern of both substrate and film revealed that
 ${\left[ {2\bar 1\bar 10} \right]_{\alpha {\rm{ - A}}{{\rm{l}}_2}{{\rm{O}}_3}}}\left\| {{{\left[ {0\bar 1\bar 10} \right]}_{{\rm{ZnMgO}}}}} \right.$
. Epitaxial growth of the films was confirmed. (b) Atom probe detector event histogram displaying the location where ions hit the detector during analysis. The formation of a crystallographic pole was apparent and corresponds to the 0001 pole of the ZnMgO:Ga film.

Atom probe analysis through the ZnMgO:Ga film and into the α-Al2O3 substrate was performed both on the as-received material and laser-irradiated material. Pre- and post-APT TEM analysis was performed on all specimens, unless a specimen failure occurred and post-analysis examination was not possible. The detector event histogram in Fig. 4(b), which is a map of the ion hit density in the x-y plane during the atom probe experiment, shows clearly the formation of a 6-fold symmetry pole that corresponds to the [0001] direction for the ZnMgO:Ga film and substrate.
The composition of the specimens was determined after optimizing the APT experimental conditions that yielded the best success for analysis of both phases, i.e., a run that acquired across the interface (refer to Table II for quantitative results). Under these conditions, the oxygen content for both phases is underestimated from correct stoichiometry, which should be 50 and 60 at.% for the ZnMgO:Ga and α-Al2O3 phases, respectively. Therefore, anion/cation fractions are not representative of the correct stoichiometry of the material. For example, the cation/anion fraction for O in the substrate should be 0.4/0.6 while the ratio determined from the atom probe data is 0.41/0.58 and the remainder is 69Ga from the FIB milling process for specimen preparation. Despite the discrepancy in the measured composition, spatial changes in relative cation composition can be accurately determined at the nanometer scale. Analysis of the film also showed a deficiency of Zn as compared to the nominal composition (Zn = 35 at.%) and as a result a relative increase in the Mg content. Preferential evaporation of ionic species due to uncorrelated events, multiple detector hits, or loss of detection due to formation of neutral species is well documented for atom probe acquisitions. Reference Diercks, Kirchhofer, Brubaker, Bertness, Sanford and Gorman4,Reference Müller, Smith, Gault, Grovenor and Mu23–Reference Kirchhofer, Teague and Gorman25 Zn deficiency may be due to preferential evaporation during the acquisition and not an indication of loss of stoichiometry of the phase.
Composition measurements for the ZnMgO:Ga film and α-Al2O3 substrate. The nominal composition of each phase is given in parentheses.

a The values reported for Ga content also include 69Ga from FIB-induced damage, therefore, the content may be overestimated.
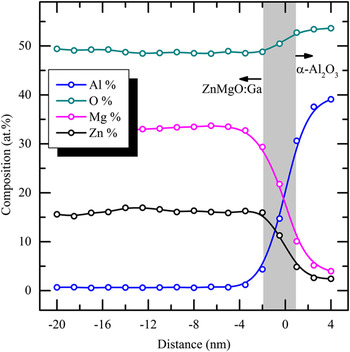
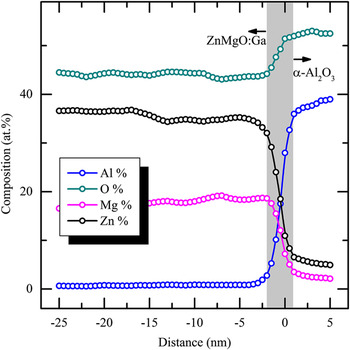
Figure 5 shows a 1-D composition profile of a region encompassing the film and the substrate for a representative unirradiated specimen. The composition of the phase is presented as a function of distance from the interface (gray-boxed area in the plot) and the direction of analysis is the growth direction of the ZnMgO:Ga film and the c-axis. The relative changes in composition across the phases can be quantified at the nanometer scale. The ZnMgO:Ga/α-Al2O3 interface was approximately 3 nm in width. Interface thickness was estimated by measuring the width of the Al composition profile from across the steep composition gradient (minimum Al content ∼2 at.% to the maximum content Al ∼36 at.%). Small changes in the Mg and the Zn content are evident and may be attributed to the regions of enrichment that were observed in the 3D reconstructions [Fig. 3(b)]. Increase in the O content was observed in the substrate that corresponds to the increase in the anion/cation ratio expected for α-Al2O3 (anion/cation = 0.6/0.4) whereas the Zn and Mg contents dropped to near zero values.
Composition profile of an unirradiated ZnMgO:Ga film across the interface and α-Al2O3 substrate as a function of the distance from the interface. The interface thickness was approximately 3 nm before laser irradiation as indicated by the gray-boxed area. The spatial resolution in the analysis direction was set at 1 nm for the analysis.

B. Laser irradiation results
Initial estimation of the temperatures reached by the specimen during laser irradiation was achieved using a COMSOL™ Multiphysics thermal model. In brief, the model assumes a Gaussian laser pulse width with duration of 10 ps and also a Gaussian spatial distribution of the pulse energy. A pulse frequency (laser pulse repetition rate) of 1 MHz is also simulated. A specimen tip radius (r
s) of 20 nm, shank angle of 10°, and T
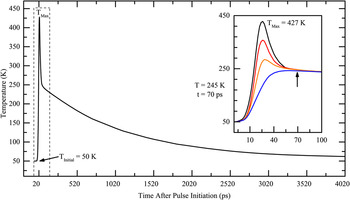
initial = 50 K were assumed for the model but can be changed based on input from the TEM images. Temperature-dependent thermal diffusivity for each material is input based upon literature data. It is also assumed that all incident photons are absorbed in the specimen (αphoton = 1) while under the influence of the applied field. As shown in Fig. 6, the thermal model estimated a temperature increase from 50 to 427 K (T
max), which was possible for a 100 pJ pulse. However, complete laser absorption may not occur since the E
g of the material is higher than the photon energy (E
photon = 3.4 eV and E
g,ZnMgO ≈ 4 eV,
 ${E_{{\rm{g}},\alpha - {\rm{A}}{{\rm{l}}_2}{{\rm{O}}_3}}} \approx 9\,{\rm{eV}}$
). With the assumed pulse frequency, the time between pulses is 1 μs and the specimen temperature decays to 50 K in approximately 10 ns, or 0.99 ms before the next laser pulse arrives to the sample. Also of note is that 90% of the thermal energy is distributed throughout the specimen in less than 2 ns.
Specimen temperature (in K) as a function of time (in ps) after the laser pulse initiation. The maximum temperature predicted is displayed by the black curve. The inset shows the temperature at different locations along the surface of the specimen until an equilibrium temperature is achieved. Thermal equilibrium is reached within 70 ps and the temperature decays to 50 K within 1 μs of the pulse initiation.

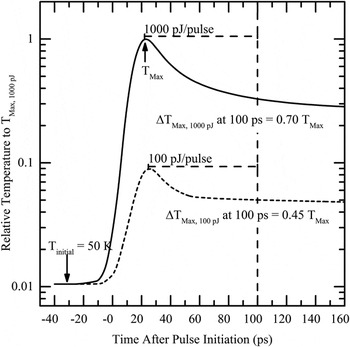
Initial laser irradiation experiments were carried out using the conditions assumed in the thermal model. The laser irradiation was performed on specimens using ultra-high vacuum conditions (10-11 mbar) for 8.64 × 10¹⁰ pulses with a constant applied voltage of 500 V and using a laser pulse energy of 100 or 1000 pJ. Using higher laser pulse energies would increase the specimen temperature as illustrated by the maximum temperature plot in Fig. 7. Based on the model, specimens subjected to laser pulse energies of 1000 pJ show a relative increase in maximum temperature that is ten times the maximum temperature of a specimen irradiated with 100 pJ. The change in temperature (ΔT Max) for the 100 pJ/pulse curve after 100 ps is 0.45 T Max compared to 0.70 T Max for the 1000 pJ/pulse. The implication of the relative change in temperatures is that a much higher T Max is reached within 100 ps of the pulse initiation when higher laser pulse energies are used. Furthermore, the specimen remains at elevated temperatures for an extended period of time which would aid the reaction of ZnMgO:Ga and α-Al2O3 to form spinel. Hence, it is possible to tune the temperature reached by the specimen by adjusting the laser pulse energy.
Relative temperature as a function of time after laser pulse initiation using a 100 pJ (dashed line) or 1000 pJ (solid line) for the pulse energy. The thermal model predicts relative increase in temperature ten times higher for a specimen subjected to a 1000 pJ laser pulse compared to a 100 pJ pulse. The change in T Max at 100 ps for the 1000 pJ/pulse is higher than for the 100 pJ/pulse.

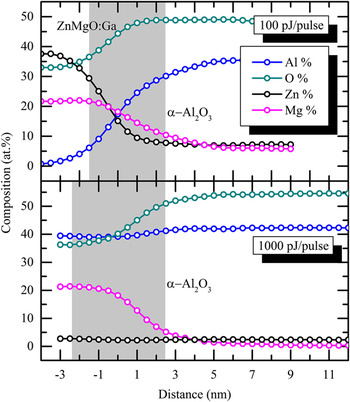
Post-irradiation examination by diffraction and subsequent atom probe analysis of the specimens subjected to laser pulse energy of 100 pJ found no changes in the crystallography or boundary morphology (Fig. 8). Ultimately, this laser energy did not induce a high enough temperature change during pulsing to cause measurable cation diffusion. Since this same laser energy was utilized in the laser-assisted APT field evaporation analyses (compare Figs. 5 and 8), extended irradiations at this energy illustrate that spatial resolution is maintained.
Composition profile of the ZnMgO:Ga film across the interface and α-Al2O3 substrate as a function of the distance from the interface. The interface thickness was approximately 3 nm after laser irradiation at 100 pJ/pulse for 8.64 × 10¹⁰ pulses. The spatial resolution in the analysis direction was set at 1 nm.

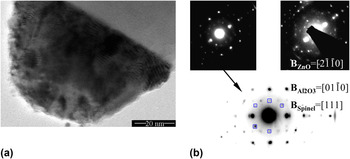
Figure 9(a) shows a bright-field TEM micrograph of a representative atom probe specimen post-irradiation at 1000 pJ/pulse. Roughening of the specimen surface is apparent although other changes in the microstructure were not evident. However, the SADPs for the ZnMgO:Ga layer showed alterations from the pre-irradiation conditions that are evidence of changes in the microstructure due to recrystallization or possible formation of a different phase. The SADPs for two different specimens after laser irradiation are shown in Fig. 9(b). The diffraction patterns show reflections (marked by blue squares) that could not be attributed to either the substrate or the ZnMgO:Ga film (see Fig. 4 for pre-irradiation DPs). The additional diffraction spots could correspond to {440}-type reflections for spinel. The spinel can also have epitaxial growth with the α-alumina substrate so that (111)Spinel //
 ${\left( {01\bar 10} \right)_{\alpha {\rm{ - A}}{{\rm{l}}_{\rm{2}}}{{\rm{O}}_{\rm{3}}}}}$
due to excellent lattice matching. Therefore, the zone axis that is observed in the diffraction pattern could be a <111>-type axis; this is confirmed by the reflections observed in the pattern that correspond to a
B
= [111]Spinel.
(a) TEM micrograph of an atom probe specimen post-irradiation showing slight damage due to laser pulsing at 1000 pJ. (b) SADPs of the ZnMgO:Ga film (and α-alumina substrate) for two representative specimens after laser irradiation. The reflections due to the substrate and thin film were indexed in Fig. 4. Additional reflections (squares) due to spinel formation are also shown for B = [111]Spinel.

Atom probe analysis of specimens that had been exposed to different laser energies was performed using a base temperature of 50 K. The relative composition of the specimens as a function of the distance from the ZnMgO:Ga/α-Al2O3 interface, indicated by the gray box, is shown for two specimens in Fig. 10. One was irradiated using 100 pJ/pulse (top) and the other using 1000 pJ/pulse (bottom). APT analysis using 1000 pJ/pulse caused diffusion of Al into the ZnMgO:Ga film for a distance of about 4 nm at the interface (gray box), whereas Mg and Zn were detected in the substrate at concentrations greater than 5 at.% for a distance of 2 nm until the end of the atom probe acquisition. The specimen irradiated at 1000 pJ/pulse showed Zn depletion across the film, which was only about 5 nm thick following irradiation (film thickness was approximately 50 nm pre-irradiation).
Composition profiles for two specimens analyzed in the atom probe using a laser pulse energy of 100 pJ (top) and 1000 pJ (bottom). The specimen base temperature was 50 K and T Max > 300 K. The specimens showed different cation ratios within the film. The Al:Mg ratio in the bottom is ∼2:1 that is indicative of the formation of Mg-spinel.

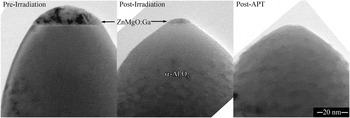
After laser irradiation at a base temperature of 300 K for 8.64 × 10¹⁰ pulses, it was observed that the film thickness had decreased further, the before and after laser irradiation TEM micrographs are shown in Fig. 11. The Al:Mg cation ratio was found to be approximately 2:1 which corresponds to the ratio of a spinel phase (MgAl2O4). For this specimen, the interface thickness was determined from the composition gradient of Mg and O and was determined to be approximately 4.5 nm—indicated by the gray box in the image. The O and Al contents in the substrate were constant.
TEM micrographs of the specimen after FIB milling and before laser irradiation (left), after laser irradiation for 8.64 × 10¹⁰ pulses (middle), and post-APT analysis (right).

IV. DISCUSSION
Determination of composition and effects of analysis conditions on field evaporation and/or sublimation of species are discussed. In addition, evidence of the formation of spinel (composition MgAl2O4) was found using electron diffraction. Laser-pulsed APT analyses were used to determine the diffusion coefficient of Al and Mg using Fick's second law following billions of laser-induced thermal cycles.
A. Composition measurements
Composition measurements performed in the atom probe are subject to uncertainties due to the field evaporation behavior of different atoms. Unless the experimental conditions can be optimized to obtain the correct anion/cation ratio, preferential loss of some ionic species can occur. Reference Diercks, Kirchhofer, Brubaker, Bertness, Sanford and Gorman4,Reference Müller, Smith, Gault, Grovenor and Mu23,Reference Kirchhofer, Teague and Gorman25 In the analysis of the ZnMgO:Ga film, loss of Zn (31.7 at.%) and O (45.9 at.%) was observed while the Mg content (20.9 at.%) was overestimated. Additional uncertainties are introduced due to peak overlaps in the TOF mass spectrum. For example, Zn2+ at 32 m/q overlaps with O2 + peak. Reference Kirchhofer, Teague and Gorman25 Owing to peak overlaps, it is possible that the Zn and the Mg content appear to remain high in the α-Al2O3 substrate (Fig. 10). Despite the discrepancies of the measured composition with the nominal composition of the film, the relative changes in the atomic concentration are consistent for a given acquisition condition. Therefore, it is possible to determine the ratio of different cations to assess the composition changes of the film.
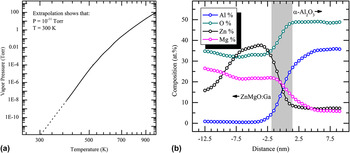
Depletion of Zn may be due to sublimation at the low pressures in the analysis chamber, as shown in the vapor pressure graph for Zn in Fig. 12(a). The extrapolation of the graph to a pressure of 10−11 mbar shows that Zn could sublimate at around 300 K. Laser pulsing could cause the specimen to reach temperatures much higher than 300 K as shown by the thermal model in Fig. 7. A composition profile along the analysis direction (c-axis) of the specimen subjected to 100 pJ laser pulse energy is shown in Fig. 12(b). The initial 8 nm of the ZnMgO:Ga film also shows a deficit in the Zn content, which increases to near the nominal content near the ZnMgO:Ga/α-Al2O3 interface. A comparison with the composition profile of the specimen irradiated with 1000 pJ/pulse (Fig. 10) reveals that the film was only about 5 nm and Zn was not detected in the specimen. Therefore, Zn may be sublimating from the surface for a depth of 8 nm and the Mg-spinel observed in the specimen may be due to the loss of Zn and the diffusion of Al from the substrate to fill the vacancies. Formation of Zn vacancies due to laser irradiation for 10,000 pulses and a fluence of 100 mJ/cm2 (laser wave length, λ = 193 nm) in UHV conditions has been reported for a depth of 2 μm into bulk ZnO. Reference Khan, Weber and McCluskey26 Diffusion of the Zn interstitials to the surface would promote the preferential loss of Zn. Alternately, Zn may be field evaporated from the tip as uncorrelated events, between laser pulses, and contributing to the background counts in the mass spectrum. Given the low applied field and the low sublimation temperature of Zn at this pressure, the sublimation of neutral Zn seems more likely.
(a) Vapor pressure of Zn extrapolated to the pressure used for atom probe analysis showing that for p Zn ≈ 10−11 mbar the temperature for sublimation is ∼300 K. (b) Composition profile of a specimen analyzed using 100 pJ/pulse and 50 K as the specimen base temperature showing Zn depletion for approximately 8 nm from the surface.

Based on this, the likely sublimation of the Zn ions at the surface of the specimen indicates the possible temperatures reached by the specimen during laser pulsing. The deficit in Zn was observed for specimens that were laser pulsed at 100 and 1000 pJ per pulse so it can be deduced that both specimens reached a temperature of at least 300 K to allow for Zn sublimation.
B. Indication of formation of spinel (Mg,Zn)Al2O4
Electron diffraction was performed in the TEM on the atom probe specimens using a custom holder capable of allowing the transfer of the specimens between the TEM and the APT. The TEM/APT holder is capable of tilting in only one direction; thus, reaching a zone axis is difficult and patterns may appear slightly off the exact zone and the relative intensity of the reflections may not correspond to the known intensities for the zone axis. Pattern indexing was performed by measuring the reflections of the α-Al2O3 substrate and comparing to simulated patterns [Fig. 9(b)]. Reflections that corresponded to the ZnMgO:Ga film were indexed and the reflections were confirmed by calculating the d-spacing for each plane compared to the α-Al2O3 substrate. Finally, for specimens that had been laser pulsed at 1000 pJ, some reflections remained and did not appear to correspond to either of the known phases present; this is indicative of formation of Zn–Mg-spinel at the interface. The remaining reflections were assumed to be spinel and the d-spacing was calculated and matched to {440} planes for a zone axis corresponding to
B
= [111]. In this alignment condition, the (404) and (404) reflections for spinel overlap with the
 $\left( {\bar 2110} \right)$
and
 $\left( {2\bar 1\bar 10} \right)$
reflections of the α-Al2O3 substrate, which is expected for the d-spacing of the planes in the Mg-spinel and ZnMgO:Ga film that produce the diffracted spots.
The composition measurement performed from the atom probe data in Fig. 10 shows that changes in the chemical composition of the material can be affected both by Zn sublimation from the ZnMgO:Ga thin film and diffusion of Al from the substrate. The Al:Mg ratio of the specimen irradiated at 1000 pJ corresponds to the expected ratio for Mg-spinel (2:1). Moreover, the oxygen content increases into the α-Al2O3 substrate.
C. Determination of the diffusion coefficients from composition profiles obtained in the atom probe
The ZnMgO:Ga/α-Al2O3 interface can be viewed as a diffusion couple that has been subjected to a range of temperatures during laser irradiation at different fluences. Nanoscale composition changes at the interface were measured using APT and diffusion coefficients of atomic species can be estimated using the solution to Fick's second law for a plane source. A relationship for the composition gradient C(y,t) is derived in Eq. (1) (Ref. Reference Wilkinson27), where y is the distance from the interface, t is the time, C s is the initial concentration, and D is the diffusion coefficient for the atomic species. The analysis can be applied to determine the D values for Mg and Zn in c-oriented α-Al2O3 under the experimental conditions. Furthermore, the Al diffusion coefficient in ZnMgO:Ga could be estimated by reversing the composition gradient and applying the same analysis.
 $$C\left( {y,t} \right) = {{{C_{\rm{s}}}\delta } \over {\sqrt {\pi Dt} }}\exp \left( { - {{{y^2}} \over {4Dt}}} \right)\quad .$$
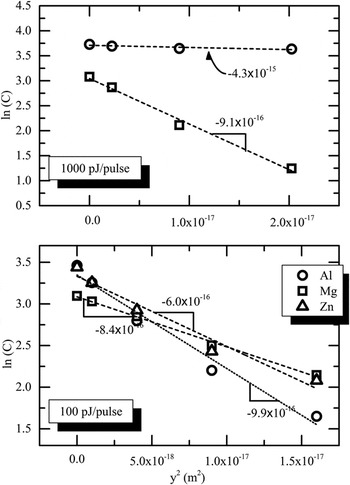
The diffusion coefficient is obtained from a ln(C) versus y 2 plot (Fig. 13) that relates the slope of the fitted line to D and t, where:
 $${\rm{slope}} = - {1 \over {4Dt}}\quad ,$$
 $$t = {\tau _{{\rm{Temp}}}}{N_{{\rm{pulse}}}} \approx {10}s\quad .$$
Al, Mg, and Zn concentrations at the boundary between the ZnMgO:Ga film and the α-Al2O3 substrate shown as ln(C) versus y 2 plot. The slope of the fitted line is indicated for each element for the specimens irradiated at 1000 and 100 pJ/pulse. Note that the concentration gradient of Zn in the top graph could not be measured due to Zn sublimation from the film.

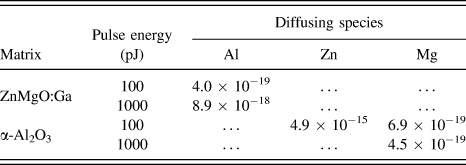
And t is the time taken for the diffusion gradient to develop. Under the experimental conditions for the laser irradiation, t is given by the number of laser pulses (N pulse = 8.64 × 10¹⁰ pulses) and the time the specimen was subjected to a temperature high enough for diffusion to occur (τTemp). The τTemp values ranged between 70 and 100 ps depending on the laser pulse energy (as well as intrinsic material properties and specimen geometric factors). Diffusion coefficient results are tabulated in Table III for the specimen subjected to 100 and 1000 pJ/pulse energies. In comparison, diffusion coefficient values are 8.4 × 10⁻¹⁵ m2 s −1 for Al3+ and 7.2 × 10⁻¹⁴ m2 s−1 for Mg2+ in MgO at 1873 K. Reference Zhang, Debroy and Seetharaman28 Discrepancies in the diffusion coefficients are most likely due to differences in the temperature ranges. Much lower diffusion coefficients are expected near room temperature, which is the estimated temperature reached by the specimen during laser irradiation at 100 pJ/pulse.
Calculated diffusion coefficients from composition profiles.

The analysis can be extended further to calculate the pre-exponential coefficient (D 0) of the diffusion coefficient (D). Diffusion coefficients are dependent on temperature (T) and activation energy (Q D) per Eq. (4). The Arrhenius form of the equation allows determination of D 0 by plotting ln(C) versus 1/T. The pre-exponential term, D 0, is given by the line intercept. To calculate the diffusivity, the temperature reached by the specimen needs to be unambiguously determined. Conversely, by measuring the diffusion coefficient under different laser irradiation conditions (for different diffusional distances) it is possible to calculate the specimen temperature and D 0 value for an atomic species.
 $$D\left( T \right) = {D_0}\exp \left( { - {{{Q_D}} \over {kT}}} \right)\quad .$$
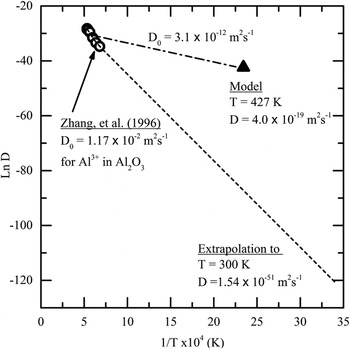
Zn sublimation from the specimen apex demonstrated that a temperature of at least 300 K was achieved for specimens under irradiation at 100 pJ/pulse. Figure 14 shows a comparison of diffusion coefficients for Al3+ in Al2O3 for a temperature range between 1423 and 1873 K Reference Zhang, Debroy and Seetharaman28 with the data point generated from measuring the diffusion coefficient of Al in ZnMgO:Ga at a temperature of ∼427 K (Table III) as predicted by the thermal model. A large discrepancy between the extrapolated value (dashed line) of D at 300 K and the value determined from the model is observed. Similarly, the data collected by Zhang et al. estimated that D 0 = 1.17 × 10⁻² m2 s−1, while the D 0 value estimated from a linear fit (dash-dot line) using the data point is 3.1 × 10⁻¹² m2 s−1. Although the diffusion coefficient of Al is expected to be much lower at room temperature than at 1423 K, the composition profiles measured from atom probe analysis showed that some diffusion takes place at the interface. Therefore, it should be possible to determine the D 0 value for all atomic species by analyzing the nanoscale changes in composition.
Diffusion coefficients for Al in Al2O3 (circles) and ZnMgO:Ga (triangle) shown as ln(D) versus 1/T (×104 K). The D 0 value estimated from data obtained between 1423 and 1873 K was 1.17 × 10⁻² m2 s−1while a linear fit with the data obtained from measuring D using atom probe data showed that D 0 was 3.1 × 10⁻¹² m2 s−1.

V. CONCLUSIONS
It was demonstrated that a dynamic atom probe experiment could be carried out and the onset of crystallization and phase transformations can be observed using cross-correlative APT and TEM. The thermal modeling of a prototypical atom probe specimen subjected to laser pulses with 100 pJ of energy showed that temperatures around 427 K can be achieved. The Zn sublimation at the surface of the specimens is indicative that a temperature of at least 300 K was reached during laser irradiation. However, changes in crystallography were not observed in the specimens until laser pulse energies of 1000 pJ were used for 8.64 × 10¹⁰ pulses. TEM SADPs acquired for specimens irradiated at 1000 pJ/pulse showed reflections that correspond to the {440} planes in a Mg-spinel structure and can confirm the formation of spinel due to thermal pulsing in the atom probe.
Furthermore, it was demonstrated that it is possible to measure the diffusion coefficient of atomic species. The composition gradient at the ZnMgO:Ga and α-Al2O3 interface was used to calculate the diffusion coefficients for Zn, Mg, and Al at two different temperatures that corresponded to pulse energies of 100 and 1000 pJ. It was concluded that it is possible to take the analysis further and determine the pre-exponential coefficient (D 0) once unambiguous temperature measurements, from thermal modeling or direct measurements, can be obtained. The work elucidates one of the many applications that remain unexplored since correlative techniques are seldom used with APT analysis.
While the majority of the electron microscopy and diffraction work was completed ex-situ on a standard TEM, a combined APT/scanning TEM instrument has been constructed at the authors' home institution, also utilizing support from the National Science Foundation. This instrument is capable of completing combined scanning transmission electron microscopy imaging and transmission electron diffraction experiments in situ, i.e., without moving the specimen from the APT analysis position. Future work will illustrate the capabilities of this instrument and demonstrate the feasibility of completing atomic scale diffusion experiments in situ.
ACKNOWLEDGMENTS
This project is funded by the National Science Foundation through Grant No. DMR-1040456. Special thanks to Dr. Yi Ke for providing the material for analysis.