Introduction
Obstructive sleep apnoea syndrome (OSAS) is characterised by recurrent nocturnal upper airway obstruction. It is a widespread sleep disorder, which causes disturbed sleep, intermittent hypoxia and daytime sleepiness, with a prevalence of 3–4 per cent in adult males and 2 per cent in adult females.Reference Garvey, Taylor and McNicholas1 Advanced age, anatomical variations, alcohol use, gender and obesity are cited as important factors that may lead to the development of OSAS.Reference Andrews and Oei2
Polysomnographic evaluation is required for the diagnosis of OSAS. Polysomnography is also used to decide whether continuous positive airway pressure therapy (CPAP) is required, and for planning the CPAP treatment protocol.Reference Kushida, Littner, Morgenthaler, Alessi, Bailey and Coleman3 Obstructive sleep apnoea syndrome is a significant cause of morbidity and mortality, and the most important complication of OSAS is cardiovascular disorders.Reference Marin, Carrizo, Vicente and Agusti4
Peripheral lymphopenia, thrombocytosis and neutrophilia have been reported to reflect the overall inflammatory status of the body.Reference Kusumanto, Dam, Hospers, Meijer and Mulder5 As lymphopenia and neutrophilia both affect the neutrophil-to-lymphocyte ratio, this ratio is now widely accepted as a marker of systemic inflammation.Reference Guthrie, Charles, Roxburgh, Horgan, McMillan and Clarke6 The neutrophil-to-lymphocyte ratio is an inexpensive, readily available and reproducible test, and has emerged as a marker of systemic inflammatory response. An increase in the neutrophil-to-lymphocyte ratio has been reported as associated with poor clinical outcomes in cardiac disease.Reference Tamhane, Aneja, Montgomery, Rogers, Eagle and Gurm7
This study aimed to investigate whether there was a correlation between disease severity and neutrophil-to-lymphocyte ratio values in OSAS patients.
Materials and methods
This prospective study was approved by the local clinical research ethics committee. Written informed consent was obtained from all patients.
The study, conducted between June and December 2013, comprised 178 patients (82 females (46.1 per cent) and 96 males (53.9 per cent)) who complained of either 1 or more of the following symptoms, as witnessed by patients' family members: daytime sleepiness, snoring and sleep apnoea. Polysomnographic and biochemical evaluations were conducted on all patients.
Patients with respiratory problems unrelated to OSAS, those with heart failure, coronary heart disease, systemic inflammatory diseases, severe anaemia or other haematological diseases, chronic liver or kidney diseases, malignancies, and patients who were taking anticoagulant or anti-inflammatory drugs or systemic corticosteroids, were not included in the study. The pre-test complete blood count data were available for all patients in their files. Those patients that were lost to follow up, or for whom post-operative complete blood count data were lacking, were not included in the study.
Patients were selected according to symptoms of daytime sleepiness, snoring and sleep apnoea, as witnessed by the patients' family members. All patients completed a questionnaire in which they were asked about their demographics and their sleep apnoea related symptoms, and which also involved completion of the Epworth Sleepiness Scale. The heights and weights of all patients were measured, and their body mass index (BMI) values were calculated.
The patients were monitored throughout the night using an 18-channel polysomnography system (Sleep Screen; Viasys Healthcare, Hoechberg, Germany). Polysomnography entailed the following recordings: electroencephalogram, electro-oculogram, submental and leg electromyograms, electrocardiogram, airflow (measured by oronasal thermistor), thoracic and abdominal respiratory movements, oxygen saturation (measured by fingertip pulse oximeter), snoring (using a tracheal microphone placed on the neck), and body position during sleep.
Sleep stages were scored in accordance with the standard Rechtschaffen and Kales criteria.Reference Rechtschaffen and Kales8 Apnoea was defined as a complete pause of oronasal airflow for 10 seconds or more. Hypopnea was defined as a 3 per cent reduction of oxygen saturation for 10 seconds or more, or a 50 per cent or more reduction of oronasal airflow, with accompanying arousal. Apnoea–hypopnea index was determined based on the number of apnoeas and hypopneas per hour.Reference Gould, Whyte, Rhind, Airlie, Catterall and Shapiro9
The patients were divided into two groups according to their apnoea–hypopnea index values. Those with an apnoea–hypopnea index of less than 5 were named as the control group (group 1) and those with an apnoea–hypopnea index of more than 5 constituted the OSAS group. The OSAS group was then divided into four groups according to disease severity: group 2 consisted of patients with mild OSAS with an apnoea–hypopnea index value of 5–14.9; group 3 consisted of moderate OSAS patients with an apnoea–hypopnea index of 15–29.9; and group 4 consisted of severe OSAS patients with an apnoea–hypopnea index of 30 or more. Patients who had been treated with CPAP for at least three months because of severe OSAS comprised group 5 (the neutrophil-to-lymphocyte ratio values were measured three months after CPAP therapy had started).
In all cases, white blood cell (WBC), neutrophil, lymphocyte and neutrophil-to-lymphocyte ratio values were calculated from pre-test complete blood count differentials. The WBC, neutrophil, lymphocyte and neutrophil-to-lymphocyte ratio values were compared in each group and between groups.
Ratio calculation
Blood samples were obtained from all patients for complete blood count analyses. The complete blood count differentials were measured automatically using the Sysmex XT 2000i haematology analyser (Kobe, Japan), and showed the total WBC, neutrophil and lymphocyte counts per microliter. Neutrophil-to-lymphocyte ratio was calculated for each patient, twice. Specifically, the number of neutrophils was divided by the number of lymphocytes: neutrophil-to-lymphocyte ratio = neutrophils (103 mcl)/lymphocytes (103 mcl).
Statistical analysis
The Number Cruncher Statistical System (2007) and Power Analysis and Sample Size (2008) statistical software program (NCSS, Kaysville, Utah, USA) was employed for evaluating the data acquired. In addition to descriptive statistics (mean and standard deviation) for evaluating the data, a one-way analysis of variance was used to compare the quantitative data and the normally distributed parameters between groups. The apnoea–hypopnea indices, neutrophil-to-lymphocyte ratio and minimum oxygen saturation scores were evaluated using the Pearson correlation analysis. The significance levels were set at p < 0.001 and p < 0.05.
Results
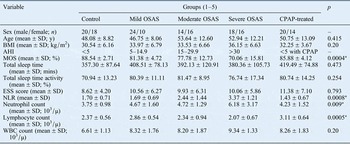
The study comprised 178 patients (82 females (46.1 per cent) and 96 males (53.9 per cent)). The patients were evaluated in terms of five groups (Table I).
Demographics and laboratory data of the groups

*p < 0.01 (one-way analysis of variance). OSAS = obstructive sleep apnoea syndrome; CPAP = continuous positive airway pressure; SD = standard deviation; y = years; BMI = body mass index; AHI = apnoea–hypopnea index; MOS = minimum oxygen saturation; mins = minutes; ESS = Epworth Sleepiness Scale; NLR = neutrophil-to-lymphocyte ratio; WBC = white blood cell
There was no statistically significant difference between the mean ages of the groups (p = 0.415). Tukey's honestly significant difference test results, comparing the mean ages of all groups, did not reveal any statistically significant difference (p > 0.05). There was no statistically significant difference between the groups in terms of BMI or Epworth Sleepiness Scale scores (p = 0.20 and p = 0.793). In addition, the WBC levels, total sleep time and total sleep time activity of all groups did not reveal any significant differences (p = 0.20, p = 0.473 and p = 0.254) (Table I).
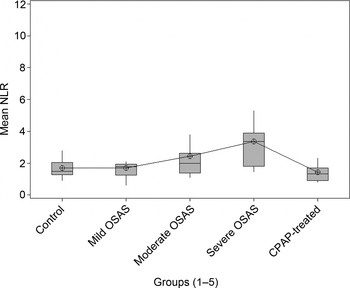
The comparison of neutrophil-to-lymphocyte ratio values revealed statistically significant differences between group 4 (severe OSAS group) and groups 1 (control group), 2 (mild OSAS group) and 5 (CPAP-treated group) (p = 0.008, p = 0.008 and p = 0.003). The neutrophil-to-lymphocyte ratio values of group 3 (moderate OSAS group) were also higher than those of groups 1, 2 and 5, but the differences were not statistically significant (p = 0.093, p = 0.084 and p = 0.023). A positive correlation was found between the apnoea–hypopnea index and neutrophil-to-lymphocyte ratio values of severe OSAS patients (r = 0.758, p = 0.034) (Table I and Figure 1).
Mean neutrophil-to-lymphocyte ratio (NLR) values of the groups. OSAS = obstructive sleep apnoea syndrome; CPAP = continuous positive airway pressure therapy

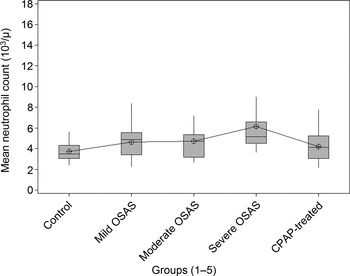
The neutrophil counts of group 4 (severe OSAS group) were higher than those of groups 1 (control group) and 5 (CPAP-treated group), with statistically significant differences (p = 0.007 and p = 0.031). The neutrophil counts of groups 2 (mild OSAS group) and 3 (moderate OSAS group) were higher than those of group 1, but the differences were not statistically significant (p = 0.061 and p = 0.031) (Table I and Figure 2).
Mean neutrophil values of the groups. OSAS = obstructive sleep apnoea syndrome; CPAP = continuous positive airway pressure therapy

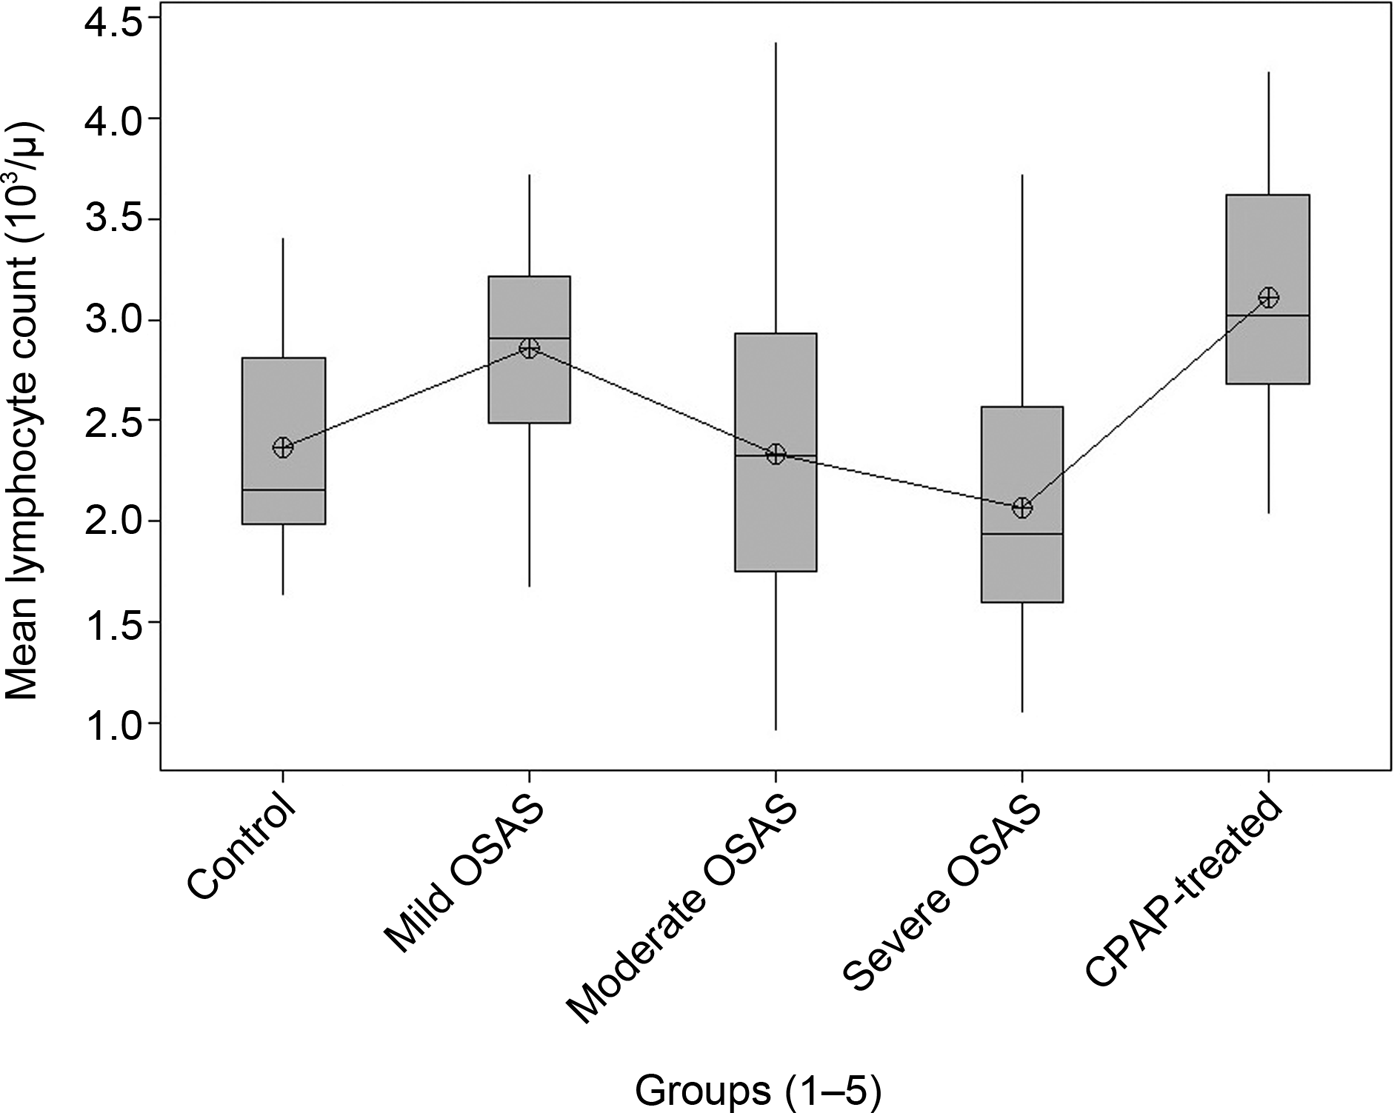
The lymphocyte counts of group 4 (severe OSAS group) were the lowest among all groups; these values were lower than the lymphocyte counts of groups 2 (mild OSAS group) and 5 (CPAP-treated group), with statistically significant differences (p = 0.001 and p = 0.0005). The lymphocyte counts of group 4 were also lower than those of groups 1 (control group) and 3 (moderate OSAS group), but the differences were not statistically significant (p = 0.194 and p = 0.373) (Table I and Figure 3).
Mean lymphocyte values of the groups. OSAS = obstructive sleep apnoea syndrome; CPAP = continuous positive airway pressure therapy

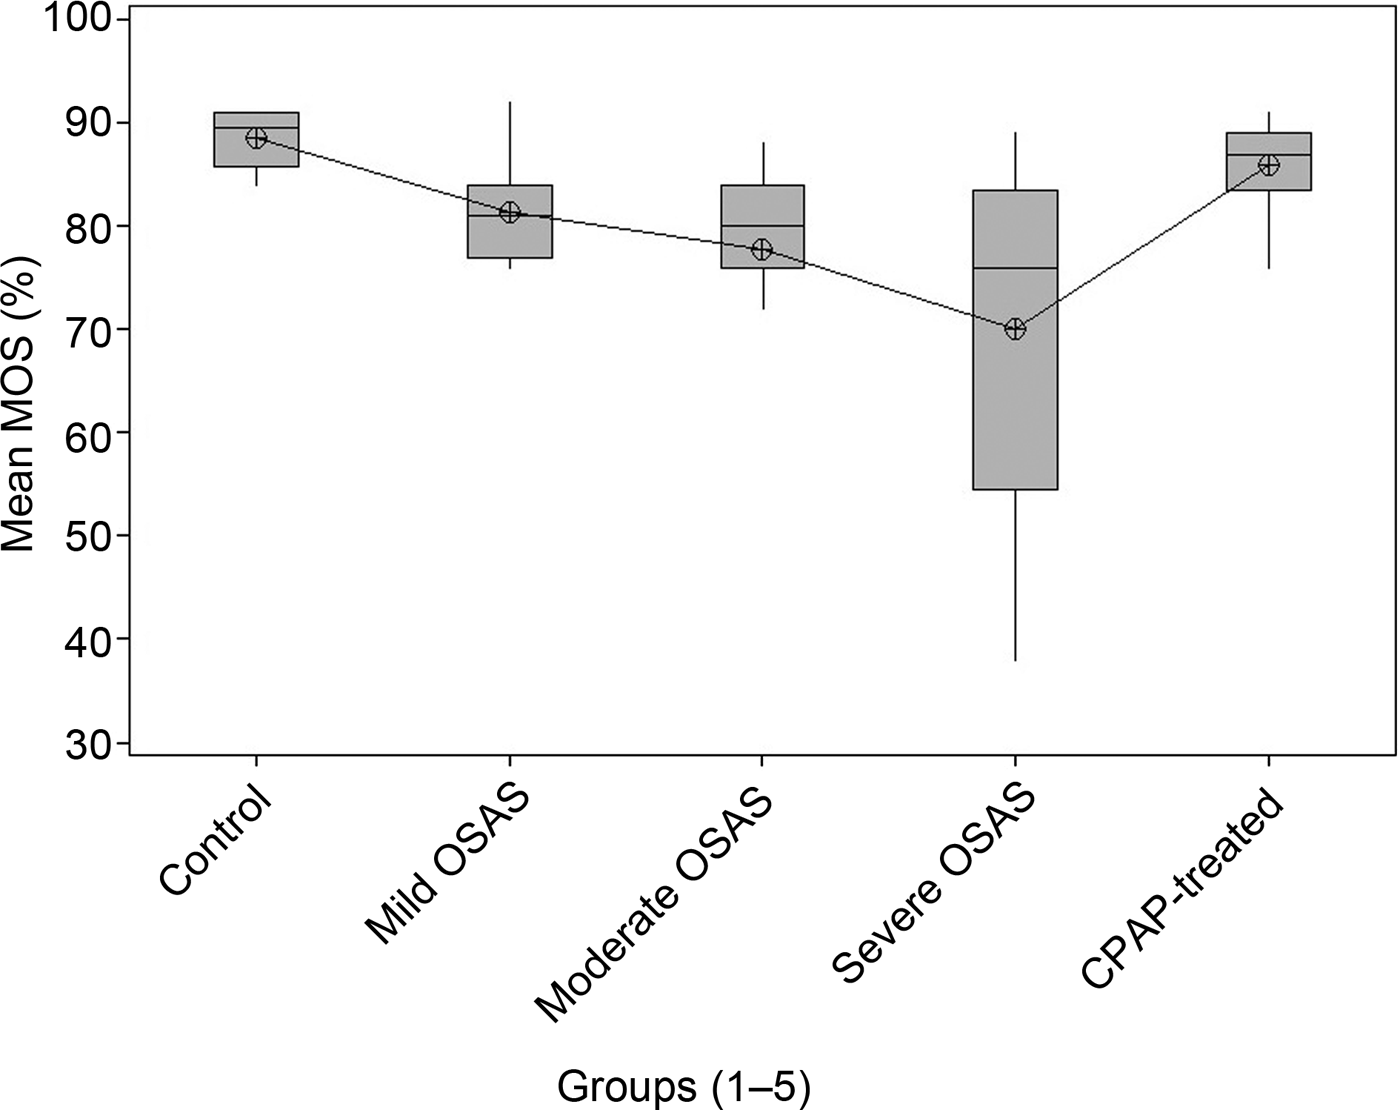
The minimum oxygen saturation levels of group 4 (severe OSAS group) were significantly lower than those of groups 1 (control group), 2 (mild OSAS group) and 5 (CPAP-treated group) (p = 0.0005, p = 0.011 and p = 0.001). In addition, the minimum oxygen saturation levels of group 3 (moderate OSAS group) were significantly lower than those of group 1 (p = 0.006). The minimum oxygen saturation levels of group 3 were also lower than those of groups 2 and 5, but the differences were not statistically significant (p = 0.316 and p = 0.032).
A negative correlation was found between the apnoea–hypopnea index and minimum oxygen saturation levels of severe OSAS patients (r = −0.179, p = 0.012) (Table I and Figure 4).
Mean minimum oxygen saturation (MOS) values of the groups. OSAS = obstructive sleep apnoea syndrome; CPAP = continuous positive airway pressure therapy

Discussion
The neutrophil-to-lymphocyte ratio values of severe OSAS patients were significantly higher when compared to those of the control patients, mild OSAS patients and CPAP-treated OSAS patients (p = 0.008, p = 0.008 and p = 0.003). The neutrophil-to-lymphocyte ratio values were also higher in the moderate OSAS patients as compared to the control patients, mild OSAS patients and CPAP-treated OSAS patients, but the differences were not statistically significant (p = 0.093, p = 0.084 and p = 0.023). Our study revealed that in moderate and especially severe OSAS patients, increased apnoea–hypopnea index was associated with increased neutrophil-to-lymphocyte ratio (a positive correlation; r = 0.758, p = 0.034 for severe OSAS patients). The severe OSAS patients treated with CPAP for at least three months had lower neutrophil-to-lymphocyte ratio values, comparable to those of the control group.
Between-group comparisons of minimum oxygen saturation levels revealed that these levels were significantly lower in the severe OSAS patients than in the control patients, mild OSAS patients and CPAP-treated OSAS patients (p = 0.0005, p = 0.011 and p = 0.001). The study also demonstrated that decreased minimum oxygen saturation levels were associated with an increased apnoea–hypopnea index, in moderate and especially severe OSAS patients (a negative correlation; r = −0.179, p = 0.012 for severe OSAS patients). The minimum oxygen saturation levels of the severe OSAS patients treated with CPAP for at least three months were higher, comparable to those of the control group.
Various studies have demonstrated increases in polymorphonuclear leukocytes, and in local inflammatory cytokines such as interleukin (IL)-6, IL-8, bradykinin and vasoactive intestinal peptide, and also in oxidative stress markers like nitrous oxide, due to local inflammation of the upper respiratory tract induced by the mechanical trauma caused by recurrent apnoea and snoring in OSAS patients.Reference Mehra and Redline10, Reference Nadeem, Molnar, Madbouly, Nida, Aggarwal and Sajid11 Besides local inflammation, systemic inflammation markers such as C-reactive protein (CRP) and tumour necrosis factor alpha (TNF-α) have also been found to be increased in the serum of OSAS patients.Reference Guven, Turkkani, Ciftci, Ciftci and Erdogan12
Obstructive sleep apnoea syndrome is widespread throughout the world, and its prevalence is rising. The disease is characterised by recurrent hypoxia episodes. Intermittent hypoxia and an increase in inflammatory activity are among the factors that increase the risk for cardiovascular disorders.Reference Garvey, Taylor and McNicholas1 Obstructive sleep apnoea syndrome is associated with inflammation. Furthermore, inflammatory markers have been shown to be increased in OSAS patients; the increase was related to disease severity and hypoxia duration.Reference Williams and Scharf13
Reoxygenation after a brief period of hypoxia, as experienced repetitively and systemically by OSAS patients, may predispose to cell stress, possibly because of mitochondrial dysfunction.Reference Poyton, Ball and Castello14 This could be due to the activation of a proinflammatory response as mediated through the transcription factor nuclear factor kappa B (NFκB), a master regulator of inflammatory gene expression.Reference Dai, Phillips and Ahmed15 The intermittent reoxygenation that distinguishes intermittent hypoxia from sustained hypoxia resembles reperfusion injury, and may result in the activation of inflammatory pathways such as those mediated by NFκB.Reference Dai, Phillips and Ahmed15 A number of previous reports have selectively examined the expression of either adaptive or inflammatory factors in OSAS patients before and after CPAP therapy. Downstream products of NFκB activation, including TNF-α, IL-6, IL-8 and intercellular adhesion molecule-1, have been reported to be elevated in OSAS patients and to decrease with CPAP therapy.Reference Dyugovskaya, Lavie and Lavie16, Reference Yokoe, Minoguchi, Matsuo, Oda, Minoguchi and Yoshino17
Recent research on patients with acute heart failure has shown that neutrophilia and relative lymphocytopenia are independent predictors of mortality.Reference Arruda-Olson, Reeder, Bell, Weston and Roger18, Reference Rudiger, Burckhardt, Harpes, Muller and Follath19 In addition, the neutrophil-to-lymphocyte ratio has been shown to be a potential marker for detecting inflammation in cardiac and non-cardiac diseases.Reference Tamhane, Aneja, Montgomery, Rogers, Eagle and Gurm7, Reference Akpek, Kaya, Lam, Sahin, Elcik and Celik20, Reference Li, Liu, Zhang, Zhang, Wang and Zhu21 The neutrophil-to-lymphocyte ratio was highlighted as a long-term indicator of mortality in patients who underwent percutaneous coronary interventions.Reference Duffy, Gurm, Rajagopal, Gupta, Ellis and Bhatt22 In addition, higher neutrophil-to-lymphocyte ratio values were found to be associated with poor survival in patients who underwent coronary artery bypass surgery.Reference Gibson, Croal, Cuthbertson, Small, Ifezulike and Gibson23
When compared with inflammatory cytokines, including IL-6, IL-1 alpha and TNF-α, the neutrophil-to-lymphocyte ratio has the advantage of no extra costs. It can easily be measured from the complete blood count of peripheral blood.Reference Turkmen, Guney, Yerlikaya and Tonbul24 The neutrophil count reflects the inflammatory status, while the lymphocyte count is related to the general stress and nutritional status of the body. Neutrophil-to-lymphocyte ratio has been reported to be a valuable marker for predicting adverse clinical outcomes, and a reliable marker for cardiac disorders characterised by inflammation, such as acute coronary syndromes, heart failure and coronary revascularisation procedures.Reference Tamhane, Aneja, Montgomery, Rogers, Eagle and Gurm7, Reference Akpek, Kaya, Lam, Sahin, Elcik and Celik20
Our study is a preliminary study, considered as a proposal. The main limitation of our study is lack of CRP or other established markers of inflammation as a reference for comparison. Furthermore, we did not check the neutrophil-to-lymphocyte ratio values of sleep apnoea patients treated with surgery or mandibular appliances. In our study, the sample size was small. Studies with a larger number of patients are needed to confirm our findings.
Our study demonstrated that the neutrophil-to-lymphocyte ratio was positively correlated with OSAS severity. The results suggest that the neutrophil-to-lymphocyte ratio, which increases as a consequence of systemic inflammatory responses in OSAS, will be significant in the clinical follow up of OSAS patients. This study is the first to reveal the significant value of the neutrophil-to-lymphocyte ratio in OSAS. We advocate utilising the neutrophil-to-lymphocyte ratio as an auxiliary diagnostic method in all patients. However, we do not think this could replace polysomnography. A polysomnographic evaluation is required for the diagnosis of OSAS. Polysomnography is also needed to determine whether CPAP is required, and for planning the CPAP treatment protocol.Reference Kushida, Littner, Morgenthaler, Alessi, Bailey and Coleman3
• Obstructive sleep apnoea syndrome (OSAS) is characterised by recurrent nocturnal upper airway obstruction
• The neutrophil-to-lymphocyte ratio, integrating the deleterious effects of neutrophilia and lymphopenia, is considered a systemic inflammatory marker
• This study investigated the association between neutrophil-to-lymphocyte ratio and OSAS severity
• It is the first to show the relationship between neutrophil-to-lymphocyte ratio and OSAS
This study is the first to show the relationship between neutrophil-to-lymphocyte ratio and OSAS. The results highlight the value of the neutrophil-to-lymphocyte ratio as a biomarker of systemic inflammation in patients with OSAS. The neutrophil-to-lymphocyte ratio calculation is an easy-to-use and readily available tool that can be carried out almost anywhere. It can be successfully employed at no extra cost in OSAS cases, as complete blood count is one of the basic routine laboratory tests performed. In our country, the cost of conducting complete blood count tests is approximately 3.5 Euros (10 Turkish Lira). Use of the ratio may help to avoid probable cardiac complications.