I. INTRODUCTION
With the rapid growth of industrial development, as we all know, energy conservation and environmental protection have become topics of global concern. Reference Zhang and Wen1–Reference Filippín, Larsen, Beascochea and Lesino3 Therefore, it is a priority for all of humanity to develop high-tech products with green technology to ensure the persistence of green environment on the earth. Nanomaterials are the essential foundation for the future development of the society. Nanoscience technology is a breakthrough for the future, and its rapid development has brought a series of significant changes to the field of industrial production technology and quality of life of the residents. With the continuous improvement of the preparation technology of nanomaterials and the new nanomaterials constantly emerging, we have reason to believe that the proportion of high-end nanoproducts will be steadily increased. Reference Lowe, Bishop, Burns, Hartford, Parkin and Trewhella4–Reference Duan and Lieber7
The transparent thermal insulation water-based nanocoatings as a new energy saving material now not only allows the glass to maintain a higher visible light transmittance but also can block a considerable part of infrared transmittance. The research found that n-type semiconductor materials with a wide band gap, such as indium tin oxide (ITO), Reference Shih, Allen and Potter8–Reference Senthilkumar, Vickraman and Ravikumar10 fluorine or antimony doped tin oxide (FTO, ATO), Reference Ravichandran, Ravikumar and Sakthivel11–Reference Sun, Liu, Liu and Yin15 aluminum or gallium doped zinc oxide (AZO, GZO), Reference Seo, Won, Chae and Cho16–Reference Cimitan, Albonetti, Forni, Peri and Lazzari21 and so on, which have the similar optical properties (the material has high absorption in the ultraviolet light (UV light) and near infrared (NIR) region, high transmittance in the visual light (Vis light) region), are an ideal transparent insulation materials. The nanomaterials are used as the functional filler and made into the nanofunction coatings which have the properties of transparency and thermal insulation.
Nano-ATO has a good conductivity, light-colored transparency, barrier infrared and UV performance, and good weather resistance and stability with the excellent performance and high accessional value in nonferrous metal industry chain. Reference Koo and Ahn22–Reference Li, Wang, Feng, Duan and Weng27 It can effectively solve the problem of energy saving of building and other glasses by applying it to a transparent heat insulation material. Moreover, because the production engineering is simple and feasible, the manufacturing process is safe and environmentally friendly, product performance is excellent and stable, and the cost is low, ATO has a high market value and broad application prospects.
To obtain the stable performance of ATO nanodispersions and measure the transparent and thermal insulation properties of the ATO coatings, we investigated the effect of a dispersant and sand milling on the stability of ATO dispersion and applied the heat insulation water-based coatings on quartz glasses to test the physical properties of thin films.
II. EXPERIMENTAL
A. Preparation of the ATO water-based dispersion
We synthesized the ATO nanopowders by the solid–liquid heterogenous co-precipitation reaction. Reference Sun, Liu, Liu and Yin15 In a typical experiment, we added 100 g ATO nanopowders into 160 g deionized water under stirring conditions, then mixing a certain amount of a dispersant. After stirring and dispersing for 10 min, sand grinding in Nano sand mill (PHN 0.3CE, PUHLER Smart Nano Tech Co., Ltd, Guangzhou, China) and dispersion of 2.0 h, we obtained the stable ATO nanodispersion of the solid content of 30%.
B. Preparation of the ATO coatings on quartz glass
A series of transparent thermal insulation water-based coatings were prepared using the ATO nanodispersion and waterborne polyurethane (PU) or polyacrylate (PA) emulsion by the blending method, the coating concentration was 25% among them. By the spin coating method, the transparent thermal insulation water-based coatings were applied on the surface of quartz glasses which were pretreated; after the thin films had been completely dry, we tested the physical properties.
C. Characterization
The morphology, dispersity, and the nanostructure of the ATO dispersions were observed by a TEM (Tecnai G2 F30, FEI Company, Oregon, US). The particle size and zeta potential of ATO dispersions were determined by a laser particle size analyzer (Zetasizer Nano ZS90, Malvern Instruments Ltd, Worcestershire, UK). The optical properties were measured using UV–Vis–NIR spectrophotometry, giving the transmittance (UV-3600Plus, Shimadzu Corporation, Kyoto, Japan) and reflection (FieldSpec 4, Analytical Spectral Devices, Inc., Colorado, USA) of ATO dispersions in the wavelength range of 200–2500 nm at room temperature.
III. RESULTS AND DISCUSSION
A. Study on the ATO dispersion
The ATO nanodispersion should have good dispersion and storage stability. However, ATO nanoparticles have a large surface activity, so the particles are not stationary in the dispersion. The collision motion and gravity settlement have a great influence on the dispersion stability of ATO nanodispersion. Finally, the nanoparticles will be automatically assembled and aggregated. To make ATO nanoparticles stabilize in the dispersion, we usually need to take some effective measures, for instance, ultrasonic dispersion, high speed sand mill, adding a dispersant, and adjusting the pH value of the solution. Reference Wang, Hu, Song, Xing, Lu, Lv and Jie28–Reference Cho, Kim, Hong, Yi, Jang and Yang32
1. Effect of pH value on stability of the ATO dispersion
According to the model of the diffusing-double electric layer and the Boris Derjaguin and Lev Landau, Evert Verwey and Theodoor Overbeek (DLVO) theory, nanoparticles dispersed in a liquid suspension are mainly influenced by the electrostatic repulsion and van der Waals forces. When the electrostatic repulsion between the nanoparticles is large enough, the aggregation of particles can be prevented, and the nanoparticles, as the results, achieve the effect of stability in the suspension. The size of the electrostatic repulsion between the nanoparticles depends on the zeta potential and the thickness of the diffusion double electron layer. When the pH value is in a specified range, the absolute value of the zeta potential of the suspension reaches the maximum, at this point the electrostatic repulsion between nanoparticles accumulates to the maximum, and the dispersion and stability of the suspension are the best.
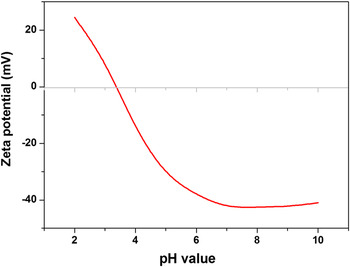
10.0 g ATO nanopowders were added into 50.0 g deionized water, sand milling for 1.0 h, the solution of HCl (1.0 mol/L, Sinopharm Group Co. Ltd, Shanghai, China) and KOH (1.0 mol/L, Sinopharm Group Co. Ltd, Shanghai, China) were used to adjust the pH value of the dispersion obtained, and the zeta potential of the dispersions was determined under different pH values. The results are shown in Fig. 1.
Zeta potential versus pH value of ATO dispersion.

As depicted in Fig. 1, the isoelectric point of ATO nanodispersion is about 3.4 when the zeta potential is zero; at this time, the interaction between the nanoparticles is the biggest and the agglomeration is very easy to occur. The higher the absolute value of the zeta potential, the more stable is the dispersion system because it can keep a certain distance between nanoparticles and reduce the chance of reaction between molecules. When the pH value is between 6.0 and 9.0, the absolute value of the zeta potential basically reaches the peak, at this very moment; the nanoparticles in the dispersion are the most stable. Taking into account the application of ATO nanodispersion, the pH value of dispersion is identified as 7.5 thereby.
2. Effect of dispersant on the stability of the ATO dispersion
There are two ways to realize the stabilization of nanoparticles in different solvents: for one thing, it is effective to absorb the same charge to the surface of the nanoparticles, the nanoparticles are mutually exclusive to each other; for another adsorption of a substance on the surface of the nanoparticles, such as polymer, it prevents the nanoparticles from approaching each other. The electrolyte dispersant, which belongs to the former, is ionized in the solution. The ions in the dispersion medium change the number of charged ions adsorbed on the surface of the nanoparticles, and the double electric layer is affected so as to achieve the electrostatic stabilization. A polymeric dispersant is mainly used for the adsorption on the surface of the nanoparticles, which can form the steric hindrance and produce the repulsive effect so as to attain the steric stabilization.
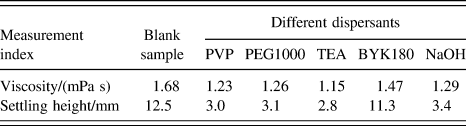
We use different types of dispersants for preliminary screening, mainly including polyvinyl pyrrolidone (PVP, Sinopharm Group Co. Ltd, Shanghai, China), polyethylene glycol 1000 (PEG-1000, Sinopharm Group Co. Ltd, Shanghai, China), triethanolamine (TEA, Sinopharm Group Co. Ltd, Shanghai, China), BYK180 (Sunny Chemicals Ltd., Hong Kong, China), and NaOH (Sinopharm Group Co. Ltd, Shanghai, China). First, we dispersed 1.0 g ATO nanopowders in 5.0 g deionized water by using the equal amount of a dispersing agent and also prepared a blank sample without the dispersing agent. After 10 min ultrasonic dispersion and high speed shear mixing, we tested the viscosity of the dispersions by a Ubbelohde viscometer, and then loaded the dispersions into a color tube with the scale, respectively. After the settlement experiment for one week, we measured the height of upper water in the dispersions, and the experimental results are shown in Table I.
The effect of different dispersants on ATO stability.

From Table I, we can see that the stability of ATO dispersions with different dispersants was improved, but the effect of BYK180 is not visible, and the viscosity and sedimentation height of the remaining dispersions are almost the same. So the experiment was carried out with the other four kinds of dispersants.
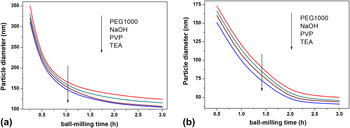
We chose PVP, PEG-1000, TEA, and NaOH as the dispersants to carry on the experiment and weighed the dispersant in accordance with 2.0% of the ATO nanopowders weight, sand milling for the same time; the particle size of the ATO dispersions at different time points was surveyed and the results are as shown in Fig. 2(a). As we can see, the average particle size of ATO dispersions with different dispersants decreased with the increase of the sand milling time, and the effect of dispersants is not identical yet.
(a) Effect of different dispersants on ATO average particle diameter by sand milling in deionized water with the same amount of dispersant (2%). (b) Effect of sand milling on ATO average particle diameter by sand milling in deionized water with the same amount of dispersant (5%).

3. Effect of dispersant concentration on the stability of the ATO dispersion
The addition amount has a close influence on the stability of dispersion and the size of nanoparticles for different types of dispersing agent. PVP and PEG-1000 are members of a high molecular dispersant. The dispersant cannot form effective adsorption on the surface of the nanoparticles when the additive amount is less, the molecular chain of dispersant also possible has little adsorption of nanoparticles, which results in bridging flocculation. When the additive amount is too much, there will be twine between the molecular chains of the dispersion, which also causes the accumulation phenomenon. On the contrary, NaOH belongs to the electrolyte dispersant and TEA is similar to electrolyte dispersant. The ionic strength in the dispersion cannot change the structure of the double electron layer on the surface of the nanoparticles, which leads to the instability of nanoparticles when the additive content is a little. While the additive content reaches a certain degree or more, the ions in the dispersion can enter the diffusion double electron layer of the nanoparticles, so the same symbol of the charges absorb on the surface of the nanoparticles, and they are mutually exclusive to each other so as to achieve the effect of stability.
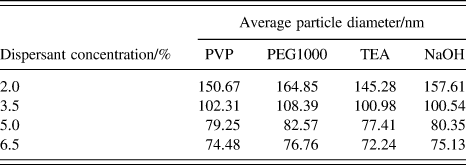
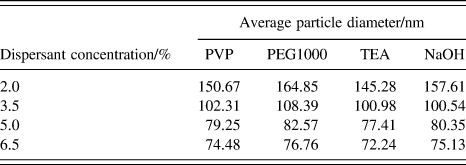
On the basis of 2.0%, 3.5%, 5.0%, and 6.5% of the ATO nanopowders weight, we weigh different types of dispersing agent, after sand milling for 1.0 h; the particle size of the dispersions was analyzed and the results are as shown in Table II. The average particle size of nanoparticles was not significantly changed when the dosage of the dispersant was used for more than 5.0% from Table II, and the stability of dispersions meets the requirements.
The effect of the dispersant concentration on the ATO average particle diameter.
4. Effect of sand milling on the stability of the ATO dispersion
In addition to using the suitable dispersing agent, it is paramount to prepare the uniform dispersion and stable performance of nanodispersion by using different dispersing methods. The conventional mechanical dispersion methods include the ultrasonic dispersion, high speed shear dispersion, and sand milling dispersion. As we all known, sand milling can grind powders with the shear stress and reduce the average particle size of particles and open soft agglomeration effectively. Reference Liu, Xu, Shi, Liu, Luo, Bao and Feng33 In this experiment, the self-prepared ATO nanopowders were explored by the method of sand milling.
According to adding 5.0% of ATO nanopowders mass to a dispersant for the different types of dispersant, sand milling for 3.0 h, the particle size of the ATO dispersions at various time points was surveyed and the results as shown in Fig. 2(b).
It can be seen from Fig. 2(b) that the average particle size of ATO nanoparticles becomes smaller with the increase of the milling time. But when the milling time is over 2.0 h, the grinding effect is not apparent and the average particle size of the nanoparticles remains unchanged. In the initial stage of sand milling, the milling media broke the soft aggregation of ATO nanopowders, together with the stabilizing effect of the dispersant on the surface of the newly formed nanoparticles, the grinding efficiency was high, and the average particle size of dispersion decreased rapidly. In the process of sand milling, the number of small aggregates in the dispersion was increased until the soft agglomerations were completely disappeared. As the milling time was longer, the nanoparticles in the dispersion were increased, the grinding efficiency was reduced, and the stable nanodispersion was obtained.
In the published research papers, Reference Li, Meng and Zhang29,Reference Peters, Zeller, Stefanic, Skoromets, Nemec, Kuzel and Fattakhova-Rohlfing31–Reference Tan, Yu, Liao, Hu and Zhang37 the preparation of the stable dispersions needed to modify ATO nanopowders and add enough dispersant, the time of sand milling was more than 10 h; some even took several days, then they got the ATO dispersion by high speed centrifugation. On the contrary, in this work, the amount of the dispersant does not exceed 5.0% of the nanopowders mass, and without the condition of high speed centrifugation, it just takes 2.0 h to obtain the steady performance of ATO dispersion by sand milling. It not only saves the time but also improves the efficiency. Most important of all, it provides supporting data for the industrialization application.
B. Characterization of the ATO dispersions
Using different types of dispersants, the dosage of a dispersant is added to the 5.0% in accordance with the weight of ATO nanopowders, sand milling for 2.0 h, adjusting the dispersion pH = 7.5, and then test it.
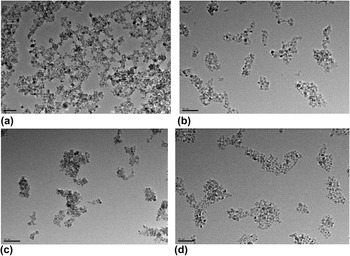
First, we investigated the morphology, dispersion, and nanostructure of the ATO dispersions by a TEM. Figure 3 displays the TEM images of the dispersions by sand milling in deionized water with different dispersants. The morphology of an ATO nanostructure is typical. The particle of ATO nanopowders is uniform and nearly similar to spherical, and the primary particle size is about 5–7 nm and the secondary particle size is about 50 nm. The particles are connected loosely, and there is no obvious hard agglomeration.
(a) TEM images of the ATO dispersions by sand milling in deionized water with dispersant (PVP). (b) TEM images of the ATO dispersions by sand milling in deionized water with dispersant (PEG1000). (c) TEM images of the ATO dispersions by sand milling in deionized water with dispersant (TEA). (d) TEM images of the ATO dispersions by sand milling in deionized water with dispersant (NaOH).

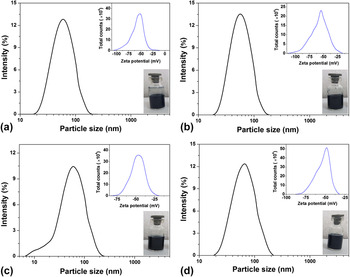
Later, the secondary particle sizes of the ATO dispersions were examined by a laser particle size analyzer. Figure 4 shows the particle size distribution of the dispersions by sand milling in deionized water with different dispersant. It is found that all the distribution ranges of the ATO dispersions’ particle size are basically consistent; the particle size is reduced under the dual role of sand milling and a dispersing agent. By comparing with TEM images, we can see that the particle size of the ATO dispersions with different dispersants is consistent. The inset images are the test results of the zeta potential, and it indicates that all of the ATO dispersions are stable with different dispersants.
(a) Particle size distribution range of the ATO dispersions by sand milling in deionized water with dispersant (PVP). The inset images are test results of the zeta potential and ATO dispersions with 30 wt% content. (b) Particle size distribution range of the ATO dispersions by sand milling in deionized water with dispersant (PEG1000). The inset images are test results of the zeta potential and ATO dispersions with 30 wt% content. (c) Particle size distribution range of the ATO dispersions by sand milling in deionized water with dispersant (TEA). The inset images are test results of the zeta potential and ATO dispersions with 30 wt% content. (d) Particle size distribution range of the ATO dispersions by sand milling in deionized water with dispersant (NaOH). The inset images are test results of the zeta potential and ATO dispersions with 30 wt% content.

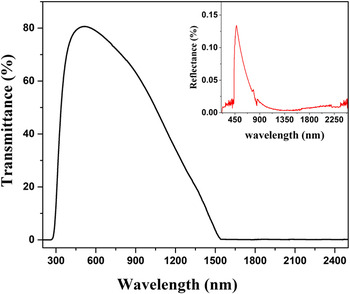
Figure 5 shows the transmittance and reflectance spectra of the obtained dispersion by ball milling in deionized water with PVP. It can be found that the ATO dispersion has a superior NIR shielding performance. At the same time, it has high enough transmittance in the visible region. The positive effect of the dispersant is not to be ignored. The uniform nanoparticle size, good wetting ability, and dispersion properties with dispersant are favorable for ATO particle continuous distribution in deionized water and improving the optical performance. The transmittance profiles of the ATO dispersions by sand milling in deionized water with other dispersants are basically consistent, so we do not list them one by one.
Transmittance spectra of the ATO dispersion by sand milling in deionized water with dispersant (PVP). The inset images are test results of the reflectance of ATO dispersion.

C. Characterization of the ATO coatings
According to the solid content of ATO in transparent thermal insulation coatings, we prepared a series of transparent insulating glasses, the solid content of ATO were 20%, 30%, 40%, 50%, and 60% in the dry film, and we marked them as S20, S30, S40, S50, and S60, respectively.
1. Optical performance
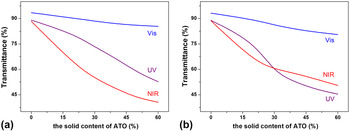
Figure 6 illustrates the transmittance of ATO thin films on the quartz glass substrates under the UV, Vis, and NIR. With the solid content of ATO increased, the thermal insulation performance of ATO coatings decreases. It can be seen that ATO/PU thin films have better a optical performance, and it can block about 60% of the NIR radiation energy when the transmittance of Vis is more than 85% and the transmittance of UV is only about 50% from Fig. 6(a). The optical performance of ATO/PA thin films compared with ATO/PU thin films is a bit weak under the same test conditions, but it also can meet the use requirements.
(a) The transmittance of ATO/PU thin films coated on the surface of quartz glasses (the center wavelength of UV is 365 nm; the wavelength of Vis is from 380 to 760 nm; the center wavelength of NIR is 1400 nm). (b) The transmittance of ATO/PA thin films coated on the surface of quartz glasses (the center wavelength of UV is 365 nm; the wavelength of Vis is from 380 to 760 nm; the center wavelength of NIR is 1400 nm).

2. Thermal insulation performance
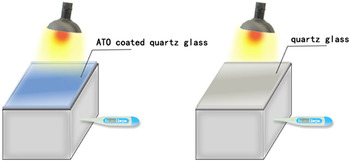
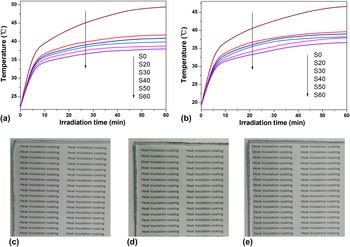
To confirm the thermal insulation ability of the ATO thin films from the viewpoint of the practical application, we designed the simulated experiment and it was performed by irradiating the sealed boxes with a 75 W halogen lamp covered by a quartz glass (S0), ATO/PU, or ATO/PA coated quartz glass, respectively, following by recording the changes of temperature upon irradiation time. The schematic illustration of simulated experiments is presented in Fig. 7.
Schematic illustration of simulated experiment.

Figures 8(a) and 8(b) show the changes on the temperature of the sealed boxes with time under the irradiation of a 75 W halogen lamp. It is clear that the temperature inside the sealed box of the pure quartz glass (S0) is increased from room temperature to near 50 °C. In other words, it reached almost 30 °C after 60 min direct irradiation. In contrast, the temperature in the sealed box covered with ATO/PU-S50 or ATO/PA-S50 is increased from 22 °C to 38 °C and from 19 °C to 37 °C, respectively. Compared to the S0, this temperature change had been significantly reduced. More importantly, the transmittance of ATO/PU-S50 and ATO/PA-S50 is the same as S0 from the Figs. 8(c)–8(e), which has no apparent visual effect. According to the above discussion, the ATO/PU or ATO/PA thin films could be considered as the materials that are useful for thermal insulation and very promising for practical application hence.
(a) Temperature versus irradiation time of ATO/PU thin films. (b) Temperature versus irradiation time of ATO/PA thin films. (c) The images of the sample glasses of S0. (d) The images of the sample glasses of ATO/PU-S50. (e) The images of the sample glasses of ATO/PA-S50.

IV. CONCLUSIONS
Adding an appropriate dispersant and sand milling for 2.0 h are conducive to the dispersions of ATO nanopowders. The practical dispersants include PVP, PEG1000, TEA, and NaOH and the amount of dispersant is 5% of the powder mass. The stable performance of ATO dispersions was successfully prepared without high speed centrifugation. The average particle size of different dispersions was about 50 nm, and their absolute value of all zeta potentials is more than 40 mV. It indicates that all dispersions can stably exist, and the nanoparticles do not occur agglomeration and aggregation.
A series of transparent thermal insulation water-based coatings based on different solid contents of ATO nanopowders were prepared using the ATO dispersions with TEA and waterborne polyurethane (PU) or polyacrylate (PA) emulsion by the blending method. We coated the coatings on quartz glasses by the spin coating method, and the effect of thermal insulation is apparent with the increase of the ATO content; there exists approximately 10 °C difference between the ATO sample and blank sample with the condition for maintaining a high transmittance of visible light.
ACKNOWLEDGMENTS
The authors declare no competing financial interest. We gratefully acknowledge support from the Nanning Science and Technology Project (Grant No. 20155347) and the Guangxi Nonferrous Metals and Featured Materials Processing Laboratory Foundation (Grant No. GXKFJ12-20).