I. INTRODUCTION
X-ray diffraction (XRD) Line Profile Analysis (LPA) is a well-known technique for the study of materials microstructure (Mittemeijer and Scardi, Reference Mittemeijer and Scardi2004; Scardi et al., Reference Scardi, Leoni and Delhez2004). Peak profiles in the diffraction pattern are modified in shape, intensity, and position by microstructural effects, like the shape and size distribution of the crystalline domains (aka crystallites), and/or lattice distortions present in the system (microstrain), and in general disorder present in the system. Together with these physical sources, the observed profile contains the instrumental contribution, which is a combined effect of photon source energy and spatial distribution, optical setup, and quality of its elements.
When dealing with nanostructured material, crystalline domain size produces the dominant effect on profiles. This can be treated according to the Scherrer's formula (Scherrer, Reference Scherrer1918; Patterson, Reference Patterson1939), correlating the measured integral breath β (2θ) with the volume-weighted mean crystallite size 〈D〉 V and the incoming photon beam wavelength λ:
 $$\beta \lpar 2\theta \rpar \, =\, \displaystyle{{{K_\beta }\lambda } \over {{{\left\langle D \right\rangle }_{\rm V}}{\cos}\theta }}.$$
Just considering the inverse proportionality occurring between the observed quantity and the average crystallite size, it comes clear how the error on the crystalline domain size diverges for small values of integral breadth, i.e. when instrumental effects are the main feature. Therefore, the LPA capability of determining the characteristics of nanostructured materials, mostly with large crystalline domains, is strongly affected by the shape and the stability of the Instrumental Profile Function (IPF).
An example of a nanostructured material with large crystalline domains can be found in a recent study on the microstructure of Cu2ZnSnS4 (aka kesterite, a solar absorbing semiconducting material; Malerba et al., Reference Malerba, Azanza Ricardo, Valentini, Biccari, Muüller, Rebuffi, Esposito, Mangiapane, Scardi and Mittiga2014), made at the MCX beamline at the Italian synchrotron Elettra-Sincrotrone Trieste (Rebuffi et al., Reference Rebuffi, Plaisier, Abdellatief, Lausi and Scardi2014). Sample with 〈D〉V ≈250 nm showed detectable effects on the shape of the peaks and allowed the calculation of the crystalline domain size distribution function. This was only possible by carefully measuring and keeping under control the IPF of the beamline (see Figure 1).
Kesterite XRD pattern at 15 keV photon energy, experimental data (circles), and fit (line), with their difference (residual, line below). Insets show details of the main diffraction peak and the comparison with the instrumental profile function.

Synchrotron radiation seems the most appropriate choice to collect high-quality diffraction data, thanks to the high beam brilliance, energy selectivity, and focusing conditions. But even a simple powder geometry can be affected by considerable aberrations (Hinrichsen et al., Reference Hinrichsen, Dinnebier, Jansen, Dinnebier and Billinge2008; Gozzo et al., Reference Gozzo, Cervellino, Leoni, Scardi, Bergamaschi and Schmitt2012), and the IPF needs to be “well-behaving”, i.e., easily represented in a convenient form for data analysis.
Several mathematical description of instrumental effects are available in literature, in particular describing the optical origin of the diffracted beam divergence (Caglioti et al., Reference Caglioti, Paoletti and Ricci1958; Sabine, Reference Sabine1987), and the optical aberrations effects (Cheary and Coelho, Reference Cheary and Coelho1998; Cheary et al., Reference Cheary, Coelho and Cline2004; Zuev, Reference Zuev2006, Reference Zuev2008), used by the methods for data analysis such as WPPM (Scardi et al., Reference Scardi, Ortolani and Leoni2010) to build a mathematical parametric representation of the IPF, available for calibration and fitting procedures.
In any case, the optical nature of the instrumental contribution to the diffraction pattern suggests a ray-tracing simulation approach for its description, prediction, and analysis (Leoni et al., Reference Leoni, Welzel and Scardi2004; Lambert and Giullet Reference Lambert and Giullet2008).
II. A MODERN RAY-TRACING TOOL
In the present work, we use SHADOW (Lai and Cerrina, Reference Lai and Cerrina1986; Welnak et al., Reference Welnak, Chen and Cerrina1994; Cerrina and Sanchez del Rio, Reference Cerrina, Sanchez del Rio and Bass2009; Sanchez del Rio et al., Reference Sanchez del Rio, Canestrari, Jiang and Cerrina2011), a well-known and widely used software for the simulation of realistic effects on the beam transport through optical elements, as the basis for a realistic ray-tracing simulation of a powder diffraction capillary sample (Debye–Scherrer geometry). The instrumental profile can then be obtained without any direct mathematical representation, describing it in terms of the contribution of every single optical component, from the photon source to the detector.
ORANGE (Demšar and Zupan, Reference Demšar and Zupan2004) is a Python-based software, representing active objects, i.e. containing data and procedures, as widgets in a desktop, exchanging data. The data flux is represented by connecting wires between widgets. By calling SHADOW via its python API (Sanchez del Rio et al., Reference Sanchez del Rio, Rebuffi, Demšar, Canestrari and Chubar2014), it was possible to create SHADOW objects representing the different optical elements and photon sources as widgets available to the user, exchanging a SHADOW object representing the photon beam as the I/O data passing through the wires.
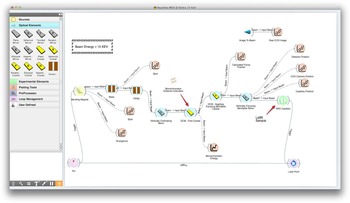
The widget-oriented aspect of ORANGE, drive us to fill the widget toolbox with dedicated widgets for every possible optical element, graphical, and calculation tool, originally present in SHADOW. By interacting with the toolbox the user can populate the workspace area with optical elements, drawing a beamline layout with a CAD-fashioned visual aspect, as visible in Figure 2.
Ray-tracing simulation of a powder diffraction experiment (MCX beamline at Elettra-Sincrotrone Trieste): layout appearance in the user interface.

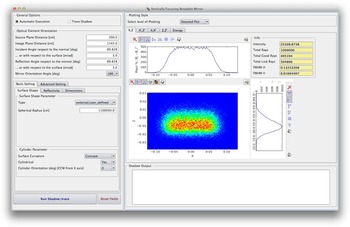
The first prototype combining SHADOW and ORANGE, simulates a hard X-ray powder diffraction (XRPD) beamline. Using the plug-in Python package already present in the SHADOW distribution, dedicated widgets wrapping SHADOW functionalities and objects were created. An example of an optical element widget is shown in Figure 3.
Appearance of the input form available for an optical element widget.

III. XRPD: A REALISTIC RAY-TRACING APPROACH
Together with the pristine functionalities of SHADOW, a special widget representing XRPD samples (in capillary holder) simulating the interaction of the photons with matter was developed, with the target of analyzing and predicting instrumental effects on experimental profiles.
The incident beam is obtained by a SHADOW ray-tracing simulation of the beamline, together with its capability of adding realistic features to the optical elements, such as reflectivity (both for mirrors and crystals) and slope error, using either simulated profiles or, when available, experimental data.
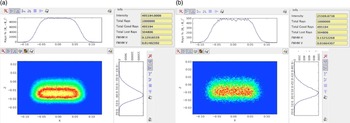
An example of intensity distribution within the cross-section at the sample position is shown in Figure 4, comparing the results of purely ideal elements and with the realistic features added.
Intensity distribution of the SHADOW incident beam within the cross-section at the sample position, with different simulation setups: (a) purely ideal elements, (b) realistic features added.

The main effect of the incident beam divergence, coming from the optical elements and source characteristics, on a powder diffraction pattern is a peak broadening, showing a dependence on the 2θ angle, that has been mathematically described in Caglioti et al. (Reference Caglioti, Paoletti and Ricci1958) and in Sabine (Reference Sabine1987), and it is usually represented and parameterized by the Caglioti's equation (Scardi et al., Reference Scardi, Lutterotti and Maistrelli1994; Scardi and Leoni, Reference Scardi and Leoni1999) for the full-width at half-maximum (FWHM) of the instrumental peak profiles, here represented as pseudo-Voigt curves:
 $${\rm FWHM}\lpar \theta \rpar \, =\, \sqrt {W\, +\, V\, {\tan}\theta \, +\, U{\tan}{^2}\theta } .$$
The three parameters, U, V, and W are obtained by analyzing the diffraction pattern from a sample of LaB6 (Lanthanum Hexaboride), a standard reference material produced by NIST (Black et al., Reference Black, Windover, Henins, Filliben and Cline2010). A similar characterization can also be made with silicon (Black et al., Reference Black, Windover, Henins, Gil, Filliben and Cline2009).
Thus, a realistic ray-tracing approach starts from the simulation of the interaction of the SHADOW photon beam with a capillary filled by such a standard reference material, generating a diffracted photon beam and prosecuting the ray-tracing onto the optical elements lying on the path from sample to detector.
The diffracted photon beam is generated geometrically: for each ray incident on the capillary a random point is generated along the path between the entry and the exit points, and then the diffracted ray is generated rotating the wave vector around the main axis of the capillary (orthogonal to the diffraction plane), by the nominal Bragg angles corrected for the angular divergence and the energy dispersion of the ray. In order to reproduce the diffraction rings of a powder, the diffracted ray is then rotated around the ideal optical axis (the reference axis where the incident beam has its main component), by a random angle within a range determined by the successive angular acceptance of the optical system driving the signal to the detector.
Every diffraction peak is normalized to the most intense one, calculated from the structure factor square modulus and the multiplicity of the reflection.
The experimental diffraction pattern is collected by a 2θ angle stepped scan of the diffracted signal, which is simulated via a repeated SHADOW ray-tracing of the detector optical system, rotated step by step around the capillary main axis.
Two possible optical system are available: a couple of collimating slits between the sample and the detector or an analyzer crystal with an entrance slit.
The final pattern can be normalized with the Lorentz-Polarization and Thermal factors, using the following expressions (Azaroff, Reference Azaroff1955; Wang, Reference Wang1987; Lippmann and Schneider Reference Lippmann and Schneider2000; Von Dreele and Rodriguez-Carvajal, Reference Von Dreele, Rodriguez-Carvajal, Dinnebier and Billinge2008):
 $$LP\lpar 2\theta\rpar = \left\{\matrix{\displaystyle\!{1 \over \sin \theta \sin \theta_{\rm bragg}} \displaystyle{\matrix{\lpar 1+Q\rpar + \lpar 1 - Q\rpar \cr \cos^2 2\theta \cos^2 2 \theta_{\rm mon}} \over 1+\cos^2 2 \theta_{\rm mon}} & \!\!\!{\rm system\, of\, slits\comma} \cr \displaystyle\!{1 \over \sin \theta \sin \theta_{\rm bragg}} \displaystyle{\matrix{1+\cos^2 2\theta \cr \cos^2 2\theta _{\rm ana}} \over 2} & \!\!\!\!\!\!\!{\rm analyzer\,crystal}\comma \; } \right.$$
 $$T\lpar 2\theta \rpar ={\exp}\left[{ - 2B{{\left({\displaystyle{{{\sin}\theta } \over \lambda }} \right)}^2}} \right]\comma \; $$
where θ bragg is the nominal Bragg angle of the reflection, Q = (I h−I v/I h+I v) is the degree of polarization (around 0.95 for the synchrotron radiation, I h and I v are, respectively, the intensity of the horizontally and vertically polarized radiation parts), θ mon is the angle between the incident beam and the first monochromator crystal, B is the Debye–Waller coefficient (in the present work, for simplicity, we consider an average B value).
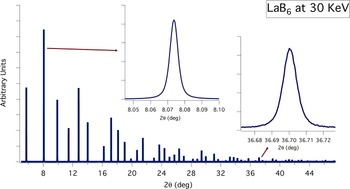
A complete ray-tracing simulation representing a powder diffraction experiment is shown in Figure 5. The experiment for characterizing the IPF used a 0.8 mm capillary filled by NIST 660a LaB6, and a photon beam energy of 30 keV.
LaB6 simulated diffraction pattern, from a 0.8 mm capillary at 30 keV photon energy. Insets show details of the simulated peaks: the progressive increment of the instrumental broadening is clearly visible.

The simulation takes into account several sources of aberrations, such as the displacement of the capillary with respect to the goniometric center, the displacement of the slits with respect to the ideal optical path, and a simple model of capillary wobbling, corresponding to a percent increase in diameter.
The software allows a background to be added to the generated diffraction pattern, selecting and/or combining three different functions: constant value, Chebyshev polynomial of the first kind up to 6th degree, and exponential decay. A random noise of adjustable intensity is generated around the selected background curve.
Finally, the simulation can take into account the absorption of the material, reducing the initial intensity I 0 of each incoming and diffracted ray according to the Beer–Lambert law:
 $$I\lpar \lambda\comma \; x\rpar \, =\, {I_0}\,{\exp}[ - \mu \lpar \lambda \rpar \rho x] \comma \; $$
where μ(λ) is the linear absorption coefficient at the photon wavelength λ, calculated with the xraylib API, providing a total photon–matter interaction cross-section with the contribution of Rayleigh elastic scattering, Compton inelastic scattering and photoionization (Schoonjans et al., Reference Schoonjans, Brunetti, Golosio, Sanchez del Rio, Solé, Ferrero and Vincze2011), ρ is the material density, and x is the path of the ray inside the capillary.
The absorption effect is also considered calculating the source points of the diffracted rays with a random generator based on a exponential probability distribution according to the transmitted intensity law [eq. (5)], rather than the more common default flat distribution:
 $$P\lpar \lambda\comma \; x\rpar \, =\, K\exp[ - \mu \lpar \lambda \rpar \rho x] \comma \; $$
where K is a normalization factor.
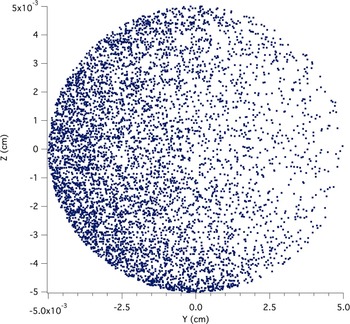
This choice is necessary because a flat distribution of source points cannot correctly account for absorption in the ray-tracing procedure. A suitable procedure, when generating a diffracted beam, is to introduce a probability of interaction with the material, responsible for the intensity drop along the beam path. An example of the generated source points, including X-ray absorption is shown in Figure 6: as clearly visible from the spatial distribution of the source points, the main effect of absorption is an apparent capillary displacement.
Generated source points of the diffracted beam, on a 0.1 mm diameter capillary, with the absorption calculation activated. The ZY-plane section refers to the SHADOW axis system.

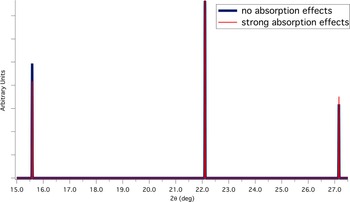
Figure 7 shows the result of the absorption calculation in terms of peak intensities of the diffraction profile; the apparently smaller Debye–Waller coefficient is clearly visible and reproduced. Absorption from the material of the capillary has not been taken into account in this preliminary phase. This choice must be considered as a first-order approximation, where the path differences inside the capillary walls have been neglected, and making absorption constant for all X-rays, i.e. acting as a constant reduction factor. This approximation is justified by the small thickness of the capillary wall (about 0.01 mm).
Comparison between simulated diffraction profiles of LaB6 at 11 keV photon energy, with and without the absorption calculation activated. The patterns are normalized respect to the central peak.

Further releases of the software will be based on a full absorption model, including capillary walls made of a selection of materials (e.g., quartz glass, borosilicate glass, and Kapton®), and specific material-dependent background patterns.
IV. RESULTS
Comparison between the simulation and experimental LaB6 XRD profiles from two different real beamlines is discussed in the following Subsections A and B.
A. The 11-BM at Argonne National Laboratory
With electron beam energy of 7 GeV, the source is a bending magnet with critical energy of 19.5 keV. The total length of the beamline is about 54 m and the optical layout is composed of a first vertically collimating cylindrical bendable Pt-coated mirror, followed by an Si(111) double-crystal monochromator, with a sagitally bendable second crystal (Zhang et al., Reference Zhang, Hustace, Hignette, Ziegler and Freund1998), and then by a second vertically focusing cylindrical bendable Pt-coated mirror.
The optical system, from the sample to the detector, is composed by an analyzer crystal at a distance of 1 m, with entry slits of adjustable aperture from 0.2 to 3 mm. The detector is actually made of 12 of these optical systems, covering a total angular range of 24° (Wang et al., Reference Wang, Toby, Lee, Ribaud, Antao, Kurtz, Ramanathan, Von Dreele and Beno2008).
The experiment for characterizing the IPF used a 0.8 mm capillary filled with NIST 660a LaB6, and photon beam energy of 29.958 keV.
Figures 8 and 9 show, respectively, a comparison between experimental diffraction peak and simulated one, and between experimental instrumental peak broadening and simulated one.
Comparison between experimental LaB6 (1,1,0) peak at 29.958 keV photon energy and the simulated one.

Comparison between experimental instrumental peaks broadening at 29.958 keV photon energy and the simulated one.

As visible from the figure, the general agreement is good, but some discrepancies in the shape of the peak are present, mostly in the tails of the peak, coming out of possible differences in the source spatial and divergence distribution, and the crystals diffraction profiles (in SHADOW crystals are modeled as perfect) and by not considering possible effects of a twist of the second sagitally bendable crystal of the monochromator.
Another possible origin of such a discrepancy can be a residual domain size effect in the standard material. In order to analyze it, we fit the experimental profile with a pseudo-Voigt function:
 $$\,pV\lpar x\rpar \, =\, {I_0}\left[{\left({ - \displaystyle{{\pi {x^2}} \over {\beta _{\rm G}^2 }}} \right)+\eta \displaystyle{1 \over {1+\lpar \pi {x^2}/\beta _{\rm L}^2 \rpar }}} \right].$$
The shape of the simulated profile can be considered as purely Gaussian, so we treat the Lorentzian part as emerging from a residual domain size effect with an average value given by the Scherrer's formula:
 $$\left\langle D \right\rangle \, =\, \displaystyle{{{K_\beta }\lambda } \over {{\beta _{\rm L}}\cos\theta }} \approx 400\, {\rm nm} .$$
By looking at the particle size distribution of the standard material in Figure 11, even in such a performing beamline, the estimated 〈D〉 value seems too small to completely justify this interpretation. We can suppose that adding in the simulation the missing optical effects (sources of broadening), this estimation would raise to more realistic values and could be taken into account as a possible contribution to the profile.
Particle size distribution of NIST 660a LaB6 (picture extracted from the original NIST certificate).

Comparison between experimental LaB6 (1,1,0) peak at 11 keV photon energy and the simulated one.

B. MCX at Elettra-Sincrotrone Trieste
Results were checked again making a complete simulation of the MCX beamline. The optical layout of the beamline is identical to that of 11-BM, but the electron beam energy is 2 GeV, so the critical energy of the bending magnet is 3.2 keV, and the total length of the beamline is about 36 m. The optical system, from the sample to the detector at a distance of 0.95 m, is composed by two horizontal slits, with adjustable aperture (Rebuffi et al., Reference Rebuffi, Plaisier, Abdellatief, Lausi and Scardi2014).
The experiment for characterizing the IPF used a 0.1 mm capillary filled with NIST 660a LaB6, and photon beam energy of 11 keV.
After a careful optimization of the optical setup, in order to let the simulation the most closely reproduce the real conditions of the experiment, Figures 11 and 12 show, respectively, a comparison between experimental diffraction peak and simulated one, and between experimental instrumental peak broadening and simulated one.
Comparison between experimental instrumental peaks broadening at 11 KeV photon energy and the simulated one.

As visible from the figure, again the general agreement is good, and small discrepancies in the shape of the peak and in the instrumental broadening are present, coming out of the aforementioned missing optical effects.
As a concluding remark, it can be noted the asymmetry of the experimental profile, a weak but visible feature on the high-angle tail of the peak, which is a fingerprint of absorption. By improving the simulation to account for the mentioned missing optical effects, we can expect an even better agreement between model and data; and then it would be possible to tune the absorption parameters, reproducing this asymmetric shape, providing not only an estimate of the density of a measured sample, but also an upper limit for this quantity in order to prevent aberrations.
V. CONCLUSION
We introduced new software for realistic ray-tracing of powder diffraction, to become a tool for simulating the instrumental effects in powder diffraction profiles at synchrotron radiation beamlines. As an off-line tool, it can be adopted by beamline users to drive the experiment design and sample preparation according to the beamline layout and beam energy, and by beamline scientists to improve the performance of existing beamlines. It can also become a valid tool to improve quality of design of optical components and beamline layouts, with a realistic-experiment-oriented approach.
Several features are under development, such as the usage of experimental rocking curves, bendable crystals twist effects, capillary wobbling effects, and diffractometer eccentricity effects.
Finally, the coupling between SHADOW and SRW (Chubar and Elleaume, Reference Chubar and Elleaume1998; Sanchez del Rio et al., Reference Sanchez del Rio, Rebuffi, Demšar, Canestrari and Chubar2014), a beamline simulator based on the wavefront propagation, is under development and will open the door to the simulation of the coherent diffraction.
ACKNOWLEDGEMENTS
We are sincerely grateful to Dr. Edoardo Busetto for his continuous support and for sharing with us his huge knowledge and experience in optical components. We kindly thank Dr. Janez Demšar and his staff for assisting us in approaching ORANGE and for rapid customizing it according to our needs. We also kindly thank Dr. Brian Toby, from Argonne National Laboratory (USA), for providing us all the information we need about 11-BM beamline.