
I. INTRODUCTION
Graphene, one-atom-thick layer of sp 2-hybridized carbon atoms arranged in a hexagonal lattice, has gained extensive attention due to its impressive electronic, optical, magnetic, thermal, and mechanical properties. Reference Wei and Qu1–Reference Yang, Lin, Huang, Tien, Wang and Ma3 It is used in several important areas such as supercapacitors, gas storage media, sensors, and lithium ion batteries. Reference Kim and Kim4–Reference Wisitsoraat and Tuantranont6 Many methods have been used to prepare graphene sheets, which includes micromechanical cleavage of highly ordered pyrolytic graphite (HOPG), Reference Burg and Poulikakos7 chemical vapor deposition (CVD), Reference Bae, Kim, Lee, Xu, Park, Zheng, Balakrishnan, Im, Lei, Song, Kim, Kim, Özyilmaz, Ahn, Hong and Iijima8 liquid-phase exfoliation of expanded graphite and graphite, Reference Choubak, Levesque, Gaufres, Biron, Desjardins and Martel9,Reference Zhu, Zhao, Li, Yu, Li and Zhang10 arc-discharge, Reference Du, Jiang and Zhu11,Reference Huang, Wu, Chen, Xue, Geng, Guo, Yu and Liu12 transforming from carbon nanotubes Reference Li, Wang, Zhao, Shi, Gu and Xu13 and the chemical oxidation–reduction of exfoliated graphite oxide. Reference Parashar, Bhandari, Srivastava, Jariwalab and Srivastava14–Reference Yuana, Bao, Qian, Wen, Xing, Song and Hu16 Although these methods have been successful in producing graphene, time-consuming processes led to high production costs, therefore, how to effectively mass-produce graphene-based materials is still arousing the interest of researchers.
The chemical oxidation-reduction method is widely considered as a promising approach for large-scale prepare graphene sheets (GSs), it includes the Brodie, Reference Zanon, Mancini, Pavanello, Bertolino and Grosso17 Hummers, Reference You, Luzan, Szabó and Talyzin18 and Staudenmaier methods. Reference Hummers and Offeman19 In these methods parent graphite is oxidized to graphite oxide (GO). On the one hand, the structure and chemical properties of GOs vary in the different oxidative degree: the formation of hydroxyl and carboxyl groups was detected at a lower oxidation level while epoxide groups formed at a higher level, we studied the order disruption in AB stacking during the increase in high oxidative levels have been studied. Reference Wong, Jankovský, Sofer and Pumera20 The use of strong acids and oxidants severely damages the sp 2-bonded of graphene and deteriorates its performance in various applications even though these damages could be recovered partly by subsequent reduction process. Reference Krishnamoorthy, Veerapandian, Yun and Kima21 By tuning the sp 2/sp 3 ratios of the carbon atoms the structure of GOs can be altered and the sp 2/sp 3 ratios in GOs can be tuned by changing the oxidation degree through suitable chemical reactions. Reference Wang, Robinson, Diankov and Dai22 The effect of the parent graphite on the structure of graphene oxide and the role of graphite precursor on the in graphite oxide synthesis were systematic study. Reference Botas, Álvarez, Blanco, Santamaría, Granda, Ares, Reinoso and Menéndez23,Reference Chowdhury, Singh and Paul24 The size of the graphite crystal affects the oxidation process and the functionality and sheet size of the resulting GOs. The important mechanism of GOs formation, a longer c-axis provides a greater surface area for the oxidants to attack on the graphitic sheets which leads to a high degree of basal plane oxidation was clearly expound. Many of the discussions about the GOs structure based on assumption have been revealed certain reasonability, which suggests that several kinds of functional groups are attached on both buckled planes and plane edges. Reference Zanon, Mancini, Pavanello, Bertolino and Grosso17 The detailed composition of GOs is determined by various functional groups attached on graphene planes, most representatively the hydroxyl, oxygen, and carbonyl groups, with a consequent increase in the layer distance of GOs. About the chemical structure of GO, GOs have no unambiguous model, however, the most well-known model is the one by Lerf and Klinowski. Reference Dreyer, Park, Bielawski and Ruoff25 The different oxidation degree of GOs was controlled by the number of times of oxidation, Reference Wang and Hu26 and the oxygen content of GOs with the oxidation time prolongation had been investigated. Reference Wang, Robinson, Diankov and Dai22 On the other hand, exfoliation of GOs is another crucial problem, numerous attempts have been adopted. Direct thermal treatment at elevated temperatures to reduce individual graphene oxide platelets and thermal treatment in atmosphere to obtain graphene have been reported in publications. Reference Lee, Suzuki and Miyayama27,Reference Zhu, Stoller, Cai, Velamakanni, Piner, Chen and Ruoff28 The graphene prepared by rapid heating GOs explore a new method to prepare graphene oxide with high yield, the road is a practical method for large-scale prepare graphene. But, the products prepare only by thermal treating result the many defects is inevitable, thermal exfoliated graphene still contains those C–O–C (epoxide), C=O, C–OH, and C–OOH functional groups, which result the poor conductivity. Those functional groups left in graphene oxide can partly remove by hydrazine and NaBH4, but the hydrazine is toxic chemical and the agglomeration of reduced products seemed to be unavoidable under these methods. Reference Qiu, Zhang, Wang, Chen and Wang29
To practical production of high-quality graphene with facile method and searching a practical method to prepare advisable GOs with the optimization design of oxidation process, a safe and facile method to prepare rEG have been proposed in this paper. GOs were synthesized by a modified Hummers method, afterward, exfoliated graphene (EG) and highly reduced graphene (rEG) are prepared by fast thermal exfoliation and post treatment at 800 °C for 4 h in H2/Ar mixed atmosphere (15/85, v%). The influence factors: ratio of KMnO4 to graphite, the oxidation time and oxidation temperature were investigated. According to the characterization on structure, morphology, and surface chemistry of the GOs, EG and rEG by XRD, FTIR, Raman spectrum and XPS, the appropriate parameters for the feasibility of mass production of GOs were found. It is expected that the results could provide a practical experience for large-scale production of graphene and support further research on graphene-based composites.
II. MATERIAL AND METHODS
A. Preparation of GOs
GOs were prepared based on an improved Hummers method by optimizing the oxidation conditions. The process is described as follows: potassium permanganate (Jin shan Chemical Reagents Co, Cheng Du, China) was slowly added to 500 mL flask filled with a mixture of 3 g commercial natural graphite powders (99%, 37 μm nominal particle size, Ji Xing Sheng An Industry & Trade Co, Bei Jing, China) and 69 mL 98% sulfuric acid (analytical grade) before the mixture was cooled down to 0 °C by means of an ice bath. Then, the solution was heated to suitable oxidation temperature with a water bath, and the mixture stirred with a magnetic stirring bar for suitable oxidation time (shown in Table III) until form a thick paste. After reaction, the deionized water (200 mL) was added into the thick paste with stirring. After that, temperature was heated to 93 °C over 30 min until the mixed solution became bright yellow. More deionized water (300 mL) was added into solution, and 3 mL H2O2 (30%) were gradually added until the bubbling disappeared. Finally, the mixture was filtrated with filter, the supernatant being decanted away. Brown remaining solid material was then washed with 1 M HCl aqueous solution and purified water, and this process being repeated until the pH was neutral. GO was dried under suction at 60 °C for 12 h, which was totally ground to obtain the GO powders. In the experiment, the ratio of KMnO4 to graphite (shown in Table I), the oxidation temperature (shown in Table II) and oxidation time (shown in Table III) were investigated by varying two of them while keeping other constant. Exfoliated graphene (EG) was obtained through thermally treating the optimized GO in terms of fast heating at 1050 °C for 1 min in a tube furnace. Transformation from EG to reduced graphene (rEG) was finished through a reduction step of heating in H2/Ar mixed atmosphere (15/85, v%) at 800 °C for 4 h.
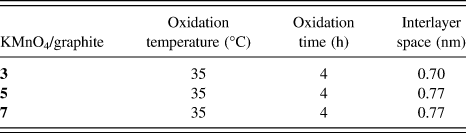
Influence of KMnO4 to graphite on the oxidation degree of graphite.

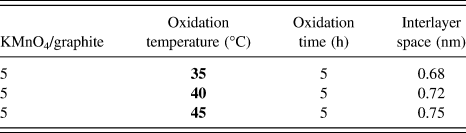
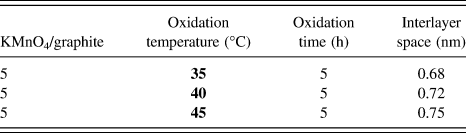
Influence of oxidation temperature on the oxidation degree of graphite.
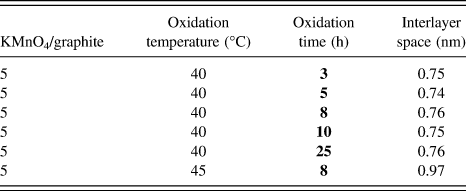
Influence of oxidation time on the oxidation degree of graphite.

B. Characterization
The crystal structure of graphite and GOs was determined by using powder diffraction (Rigaku D/Max 2200, Rigaku Corporation, Tokyo, Japan) with Cu KR (λ = 1.5406 Å) radiation at a scan speed of 1°/min and a step size of 0.03° in the range of 3° ≤ 2θ ≤ 80°. Functional groups on EG and GOs samples were characterized by FTIR (Bruker TENSOR27, Bruker Corporation, Karlsruhe, Germany). The morphology and structure of EG samples were characterized by TEM (FEI-Tecnai G2 TF30, FEI Company, Hillsboro, Oregon). Raman spectroscopy (LabRAM HR Evolution, HORIBA Scientific, Longjumeau, France), experimental conditions: Graphite and GOs (laser energy 50%, scanning 3 s, integral 3 times, acquisition time 9 s), EG (laser energy 25%, scanning 5 s, integral 5 times, acquisition time 25 s) and all samples were deposited on silicon wafers in powder form without using any solvent. The specific surface area of GO and EG was determined used BET (Beishid-3H-2000A, BeiShiDe Instrument Technology Co. Ltd., Beijing, China), while the chemical composition of GO, EG, and rEG was determined by x-ray photoelectron spectroscopy (PHI5500, Physical Electronics, Chanhassen, Minnesota).
III. RESULT AND DISCUSSION
A. The optimization of the oxidation parameters about GOs
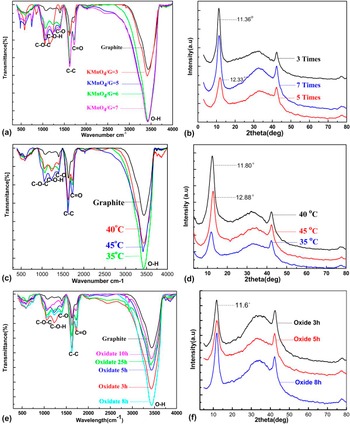
Figure 1 shows the typical FTIR spectra and XRD patterns of GOs synthesized by different ratios of KMnO4 to graphite. Through the analysis of FTIR spectra and XRD patterns, we can confirm the contents of residual functional groups and the interlayer space of GOs. Reference Lee, De Los Santos V., Seo, Felix, Bustamante D., Cole and Barnes30 The contents of functional groups and interlayer space are vastly affected by the oxidation degree. It is obviously found in Fig. 1(a), at which the relative intensity of the infrared absorption bands increase starkly when the ratio of KMnO4 to graphite changes from 3 to 7, and the resulting tendency is in accordance with the data of interlayer space shown in Table I. The absorption peak at 3419 cm−1 is assigned to O–H stretching vibration; comparing the FTIR spectra of graphite and GOs, the increase about the O–H absorption peak in GOs sample is attributed to the residual functional group C–O–H produced in the oxidization process. The peak detected on GOs sample at 1760 cm−1 is assigned to the stretching vibration of O–H. There is an additional band located at 1620 cm−1, which is the C–C vibration derived from the un-oxidized graphitic domain. The bands at 1450 cm−1 and 1230 cm−1 correspond to stretching vibrations of the C–O–H bond and C–O–C (epoxy) bond, respectively; their existence indicates that some the C–O–H and C–O–C bonds are attached on the graphite layer result the graphite functionalization. Reference Jeong, Lee, Lahaye, Park, An, Kim, Yang, Park, Ruoff and Lee31,Reference Boukhvalov and Katsnelson32 The FTIR spectral curves nearly overlap when the ratio of KMnO4 to graphite at 5 and 7, which means that the contents of functional groups are approximately equal in two GOs samples. Adjusting the ratio of oxidizer to graphite can be verified as a feasible way to increase the oxidation degree based on the transmittance difference in FTIR spectra between GOs and graphite, and the interlayer space and FTIR spectra suggests the ratio of KMnO4 to graphite set as 5 can be selected as the optimized for further investigation related to other parameters in oxidization process. XRD patterns are shown in Fig. 1(b). One can see that the position of the diffraction peak at approximately 11.3° is the typical diffraction peak of GOs, the peak demonstrates that the oxidation results in the tremendous increasing of the interlayer space from 0.34 nm to about 0.77 nm. The expansion of layer spacing is due to the decrease of interlayer Van der Waals force that have been expound in many publications. Reference Wang and Dou33,Reference Park, An, Potts, Velamakanni, Murali and Ruoff34 The diffraction peaks of GOs preparation in different ratio of KMnO4 to graphite are compared in Fig. 1(b), the distinction between positions of 2-theta in different ratio is weak which means that the relationship between the enlargement of the interlayer space and the oxidation degree is negligible. Nonetheless, that the oxidation process can expand the interlayer space is undisputed. Through the analysis on the FTIR spectra and XRD patterns, 5 times is the ideal ratio between KMnO4 to graphite under other condition constant.
(a) FTIR spectra, (b) XRD patterns of GOs prepared under various ratio of KMnO4 to graphite; (c) FTIR spectra, (d) XRD patterns of GOs prepared by varying oxidation temperature; (e) FTIR spectra, (f) XRD patterns of GOs prepared by varying oxidation time.

Figures 1(c) and 1(d) show the FTIR spectra and XRD patterns of GOs under different oxidation temperature. The preparation process of GOs the Hummers method is divided into 3 stages on account of temperature, oxidation mainly happens at the temperature zone in the range of 30–50 °C. Thus, the experiments about influence of oxidation temperature on the oxidation degree of graphite were carried out to find an appropriate oxidation temperature, and the data shows in Table II. The analysis about the type of functional groups and absorption peaks is shown in Fig. 1(c), which is consistent with that of Fig. 1(a), oxidizing temperature corresponds to the different absorption intensity of functional groups, and the temperature set at 45 °C produces the best infrared adsorption, which is below the possible explosion temperature (55 °C) according to the literature. Reference Park, An, Potts, Velamakanni, Murali and Ruoff34 The XRD patterns of GOs treated at 3 oxidation temperatures are depicted in Fig. 1(d), the position of diffraction peak at around 2θ = 12° move slightly implies that the interlayer space change in a small range from 0.68 nm to 0.75 nm. However, with the increase of oxidation temperature, the expansion of interlayer space is clear. The distinction of interlayer space of GOs reaction at 40 °C or 45 °C is not obvious, but compared to the samples treated at 35 °C, and the interlayer space at 45 °C is the biggest, which indicates the effect of increasing temperature to expand space the interlayer space is weak. Therefore, suitable reaction temperature for the synthesis of GOs should be 45 °C according to a fore mentioned systematic analysis.
Figures 1(e) and 1(f) show the FTIR spectra and XRD patterns of GOs with different oxidation time under other conditions invariant. In the FTIR spectra, 8 h oxidation equips the GOs with the strongest absorption of functional groups. Afterward, the intensity of partly functional groups (typical O–H groups) decrease, which may be attributed to the interlayer space expansion and the functional groups lost due to hydrolysis at high temperature. The XRD patterns show in Fig. 1(f), the interlayer distance in a range of 0.74 and 0.76 nm indicate that increasing the oxidizing time is not obvious in change of the interlayer spaces; the tendency is in accordance with that of FTIR spectra, and prolong the oxidation time to 10 and 25 h, the corresponding interlayer spaces show in Table III and 8 h can be viewed as the optimal oxidation time for the preparation of GOs. Based on the mentioned analysis of FTIR spectra and XRD patterns related to the preparation parameters including the ratio of KMnO4 to graphite, oxidation temperature and oxidation time, the conditions for preparing GOs with a highly oxidative degree is set as follows: 5 times of the ratio of oxidant (KMnO4) to graphite, and oxidization at 45 °C for 8 h, respectively.
B. Structure analysis on the GOs after optimizing parameter
The parameters are optimized to prepare GOs, and then, the optimized one is exfoliated by fast thermal expansion to prepare EG. To assess the exfoliation level of the graphene sheets, the sheet-like morphology of EG exfoliated with fast heating GO at 1050 °C are revealed by TEM images showed in Fig. 2. The graphene sheet is semitransparent, and the dimension of the sheet is over 500 nm. In addition, the specific surface area of GOs and EG were characterized by BET, and the specific surface area of GOs preparation under optimization condition is 152.716 g/m2, the specific surface area of EG is 586.84 g/m2, which indicated that the thermal exfoliation result GOs exfoliate to graphene sheet, and so large specific surface area leads to many wrinkles on the sheet plane and the wrinkles can intuitively show in TEM patterns in Fig. 2. From the TEM images and BET results, one can see that GOs have been completely exfoliated to graphene sheets in fast thermal exfoliation at 1050 °C and observations indicate that this graphene sheet is corrugated.
(a), (b), (c) are TEM images of EG with fully exfoliated at 1050 °C.

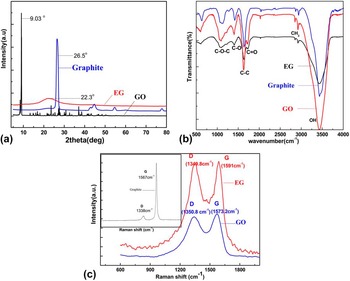
Figure 3(a) presents x-ray diffraction patterns of GOs and EG, compared to pristine graphite. The GOs sample exhibits a distinct diffraction peak at around 9.03° corresponding to an interlayer distance of 0.979 nm, which is assigned to the (001) plane of GOs. In GOs exhibited a significant increase of interlayer distance compared to graphite due to the incorporation of the oxygen functional groups and the intercalation of water molecules. The GOs exhibited highly oxidative and have good crystalline character after intensive drying from pattern of GOs in the Fig. 3(a). For EG sample, no peak was detected at 9.03°, but a broad peaks at around 22.5°, which implies the structure of EG packed turbostratically and the exfoliation of fast annealing result the layer separation, and the graphene stack disorder when GOs was exfoliated, the graphene is wrinkled amorphous structure like, which was confirmed by TEM analysis. Comparison between the XRD patterns of GO sample and EG sample confirm that not only most of the oxygen-containing functional groups on GO sheet are efficiently removed by fast thermal exfoliation but also the layer of graphene was also separated, further bring about the disorder of exfoliated graphene.
(a) XRD pattern. (b) FTIR spectra. (c) Raman spectrum of the graphite, GO and EG, respectively.

Fig. 3(b) shows the FTIR spectra of graphite, GOs, and EG, respectively. From the FTIR spectra, one can see that EG contains less functional group, especially, the absorption intensity of the O–H group is lower than that of GOs and original graphite. The reason could be concluded as that the water inside the interlayer lattice was removed during the thermal exfoliation of GOs. Although most of the functional groups are removed under the exfoliation process, the EG sample still contains some functional groups such as C–O, C=O, C–H. To further remove the residual groups, another strategy, namely, the deeper reduction of EG sample is carried out at 800 °C for 4 h in a furnace filled of mixed hydrogen/argon (85:15, v/v). Raman spectroscopy is a powerful tool to characterize carbon material, the Raman spectroscopy of GOs and EG was characterized using excitation source at 532 nm, the spectra was recorded under different experimental conditions. The Raman spectroscopy experimental conditions: Graphite and GOs (laser energy 50%, scanning 3 s, integral 3 times, acquisition time 9 s), EG (laser energy 25%, scanning 5 s, integral 5 times, acquisition time 25 s) and all samples were deposited on silicon wafers in powder form without using any solvent. Figure 3(c) shows Raman pattern of GOs, EG, and graphite, at approximately 1350 cm−1 (GOs), approximately 1573 cm−1 (GOs), approximately 1349.8 cm−1 (EG), approximately 1591 cm−1 (EG), and approximately 1338 cm−1 (graphite), approximately 1567 cm−1 (graphite) displays two strong bands, which are referred to as the D and G bands, respectively. A universal observation is that higher disorder in GOs and EG leads to a broader G band, as well as to a broad D band of higher relative intensity compared that to graphite. Specifically, in GOs, the D band and G band broaden significantly and displays a shift to higher frequencies (blue-shift), and the D band grows in intensity. Another, the widths of GOs and EG at half-maximum gradually increase than graphite, it is consistent with significant changes upon amorphization of GOs. Reference Kudin, Ozbas, Schniepp, Prud’homme, Aksay and Car35 The D mode originates from a breathing mode of k-point phonons of A1g symmetry, it is related to structural defects in the graphene sheets, and G is usually assigned to the E2g phonon of C sp 2 atoms. The intensity ratio of D to G (I D/I G) reflects the disorder degree of the measured carbonaceous materials. Reference Akhavan, Kalaee, Alavi, Ghiasi and Esfandiar36 The I D/I G results of GOs and EG are 0.98 and 1 respectively, next to that (0.094) of graphite, what indicates that there are defects existing in GOs and EG; in detail, the defects of GOs derive from the functional groups and expansion of the interlayer distance during the oxidation. Defects in EG are caused by the size of the in-plane sp2 domains and partial disorder of the graphene layer, and the I D/I G of EG increases than GOs, due to the decrease in the average size of crystalline graphitic domains. Reference Yuan, Bao, Qian, Wen, Xing, Song and Hu37 During exfoliation, the layers of GOs are separated, and part functional groups were removed, the TEM images of EG shown in Fig. 2, which demonstrates that the EG layer still maintains a disorder state.
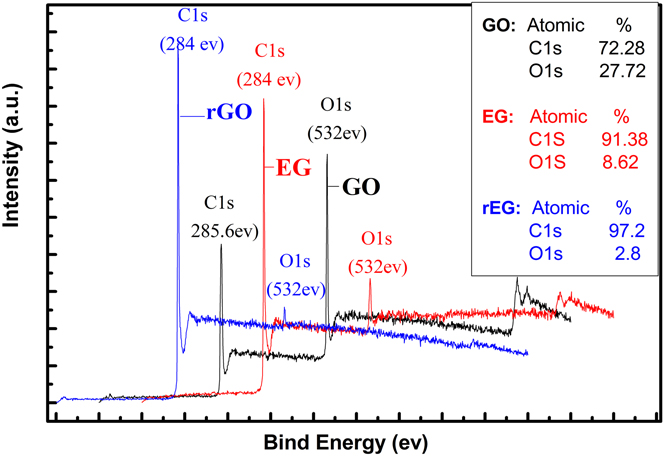
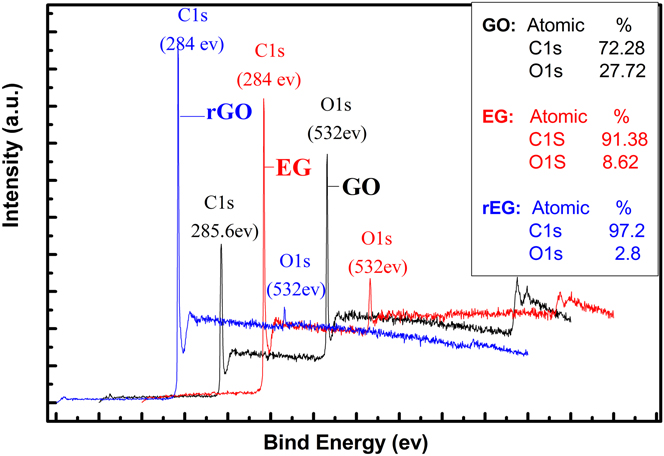
The GOs, EG, and reduced graphene (rEG) are characterized by XPS, and the result is shown in Fig. 4. From the XPS, the surface chemical composition of GOs, EG, and rEG are investigated, and C/O atomic ratio is adopted to assess the de-oxygenation efficiency of thermal exfoliation and the effort of reduction in the mixed argon/hydrogen atmosphere. The C 1s peak at approximately 284 eV and the O 1s peak at approximately 532 eV, and their percentage composition are shown in Fig. 4. Based on that, the C/O ratio of GO, EG, and rEG present at 2.6, 10.6, and 34.71, respectively. It suggests that the optimization on oxidization parameters is effective to obtain the GOs with highly oxidative degree, and the fast thermal exfoliation can efficiently remove most of the functional groups in a view of the C/O ratio changing from 2.6 to 10.6 by fast thermal exfoliation. In addition, the C/O ratio of EG sharply increases from 10.6 to 34.71 after further reduction process in hydrogen/argon mixed atmosphere. The oxygen content is low and the percentage composition of carbon reaches to 97.2%, which is higher than the carbon element composition of the graphene prepared by hydrazine-reduction method. Reference Yanga, Velamakannia, Bozoklub, Parka, Stollera, Pinera, Stankovichc, Junga, Fieldd, Ventrice and Ruoff38,Reference Shin, Kim, Benayad, Yoon, Park, Jung, Jin, Jeong, Kim, Choi and Lee39 The higher C/O ratio combined with the lower I D/I G (0.86) demonstrates that the method in this research succeeded in preparing the high reduced graphene on a large scale.
XPS spectra of GO, EG, and rEG.
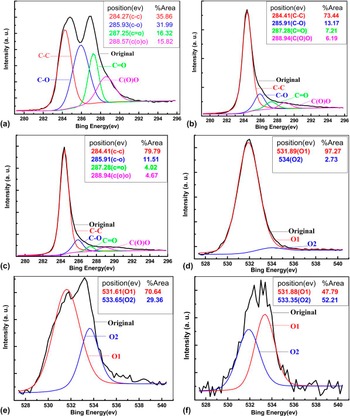
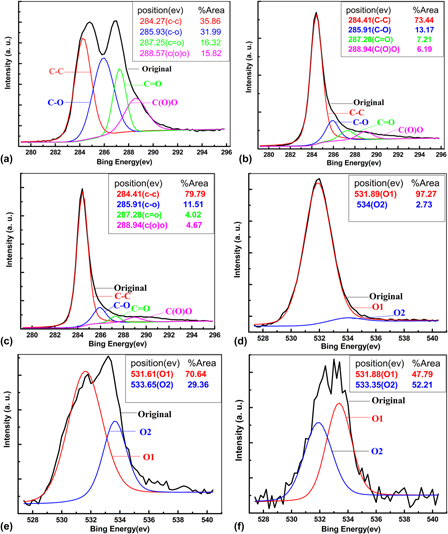
Figures 5(a)–5(f) show Gaussian fitting results of the C 1s and O 1s core lines of GO, EG, and rEG; the different type of functional groups such as C–C, C–O, C=O and C(O)O are obtained in Gaussian fitting results. In these patterns, a large number of functional groups exist in highly oxidized GOs, which agrees consist with FTIR spectra analysis, the binding energies of the C–C bonding are assigned at 284.5–285 eV, and chemical shifts with +1.5 eV, 2.75–3.2 eV, and 3.95–4.4 eV are typically assigned for the functional groups of C–O, C=O, and C(O)OH, respectively. After exfoliation at high temperature, the content of C–O, C=O, C(O)O is sharply decreased in EG and the content of C–C increases from 35.86% to 73.44%, which suggests that thermal treatment can remove most of the functional groups. In the further reduction, the content of C–O, C=O, and C(O)O of graphene (rEG) continues to decrease and the content of C–C raises to 79.79%, it is suggested that the reduction plays a role in restoring the pristine structure of graphene. Figures 5(d)–5(f) show the Gaussian fitting results of O constituent in GOs, EG and rEG. Two types of O constituent respectively exist at approximately 531 eV (O1) and 534 eV (O2), they are assigned to the oxygen from the functional groups and adsorption oxygen from air. From the transformation of the GOs to EG and rEG, the content of oxygen decreases due to the remove of functional groups and the reduction that occurred in the exfoliation process. Increase of O from air may be attributed to the adsorption effort of high surface energy supported by the sharp increase on the specific surface area of GOs sample (152.716 g/m2) and EG sample (586.845 g/m2). The contents of O1 and O2 measured in EG and rEG are shown in Figs. 5(e) and 5(f), it is clear to see that the content of O1 in rEG is less than that in EG, which verifies that the oxygen-containing functional groups are further removed in argon/hydrogen mixed atmosphere.
(a), (b), (c). Gaussian fitting results of the C 1s core lines of GO, EG, and rEG. (d), (e), (f) are Gaussian fitting results of the O 1s core lines of GO, EG, and rEG.

In conclusion, the reduction approach developed in this work is a cost-effective and highly efficient method for preparing rGO with less functional group. Through the optimization of the oxidation parameters and further treatment, the EG obtain the rGO in this paper, we supply a fire-new and feasible routes to large scale prepare graphene with less functional groups.
IV. CONCLUSION
In summary, a cost-effective and highly efficient method is proposed to prepare reduced graphene (rEG). First, the parameters of oxidation are systematic optimized to propose appropriate oxidation condition, and GOs exhibited highly oxidative and have good crystalline character after intensive drying. Second, the GOs is exfoliated to graphene by fast thermal, and the reduction of EG is conducted in H2/Ar mixed atmosphere (15/85, v%) atmosphere. The results of FTIR and XPS indicate that most of the oxygen functional groups of GOs are removed after thermal exfoliation and further reduction. TEM and Raman spectroscopy reveal the layer of EG well and the high-quality EG is obtained. And in our work we supply the method to modulate the oxidation degree of graphite. From the XPS results, it can be deduced that the amount of residual functional groups is small, where the C/O ratio reaches 34.71 and the percentage composition of C in rEG reaches 97.2%. This feasible approach provides a simple, efficient strategy for large scale preparation of reduced graphene with a reduced amount of functional groups, and a great number of edges that would be useful for ion intercalation. Another one is the small content of functional groups that would improve the electrical conductivity.
ACKNOWLEDGMENTS
This work was supported by the Joint Funds of the National Natural Science Foundation of China (Grant No. U1202272).We acknowledge operator Dan zhi Xu for their help in the measurement of Raman spectral. The BET detection work with the help of Yuanfeng Huan professor in Kunming Sino-Platinum Metals Co., Ltd.