I. INTRODUCTION
Metal oxide semiconductors are widely used in the field of gas sensors because of its good response to volatile organic compounds (VOCs), simple signal processing, low cost, and small size. Reference Li, Zhang and Zhang1 Among those, SnO2, a stable and large band gap (n-type) semiconductor, has been widely used due to its low cost, good reproducibility, simple fabrication process, rapid response, short recovery, Reference Ding, Zeng and Xie2–Reference Zeng, Liu and Liu5 and low detection limit. Reference Meng, Li, Kong, Liu, Jin, Li, Jia, Liu and Huang6 The SnO2-based sensors are used for various purposes, including detecting flammable gas in the home or office, detecting H2, Reference Takeshi, Ryota and Ken7 ethanol, Reference Liu, Xie, Li, Guo, Ji, Ding and Chaktong8 H2S, Reference Mir, Usmah and Ahsanulhaq9 and LPG Reference Srivastava, Pandey, Mishra and Dwivedi10 to prevent leakage, detecting CO Reference Thorsten, Kohl, Michael and Michael11 to prevent incomplete combustion, etc. The gas sensitivity of oxides is often divided into bulk- and surface-sensitive materials, although SnO2 belongs to the category of surface sensitive materials. Reference Matthias and Ulrike12 The gas-sensing application of SnO2 is based on the change of the material resistance when exposed to different atmospheres, which is due to the charge carrier exchange between the adsorbed gas and the oxide surface. Reference Hoefer and Frank13
Formaldehyde (HCHO) emitted from building, furnishing materials, and consumer products is one of the dominating VOCs in the indoor environment. Its existence causes nasal tumors, irritation of the mucous membranes of eyes, and respiratory tract and skin irritation, which is considered as a major indoor air pollutant in airtight houses. Reference Zhang and He14 It has been placed second on the Chinese priority control list of toxic chemicals and identified as a carcinogenic and teratogenic chemical by the World Health Organization (WHO). Reference Collins, Ness and Tyl15 Therefore, it is very important to monitor and control formaldehyde content in human breath and environments. The National Institute for Occupational Safety and Health (NIOSH) and the WHO have established permissible long-term exposure limit of 1 and 0.08 ppm to formaldehyde vapor, respectively. Reference Zheng, Wang and Yao16 Woutersen et al. Reference Woutersen, Hoetmer, Bruijntjes, Zwart and Ferson17 exposed that formaldehyde exposure for rats at 1.0 and 10 ppm increased the incidence of rhinitis, hyperplasia, and squamous metaplasia of the respiratory epithelium and the incidence of degeneration, hyperplasia, and metaplasia of the olfactory epithelium. Mitkus et al. Reference Mitkus, Hess and Schwartz18 obtained that the peak concentration of formaldehyde in blood/total body water was estimated to be 22 ppb, which is equivalent to a body burden of 66 μg or 1% of the endogenous level of formaldehyde, and the predicted level in the lymphatics was even lower. A concentration of 5 ppm is a typical level of residual formaldehyde measured in some yearly influenza vaccines by FDA chemists. Reference Mitkus, Hess and Schwartz18 What is the same for these is that the concentration of formaldehyde is low. Hence, the monitoring of low-level formaldehyde concentration is of utmost importance for food quality and human health. To date, gas chromatography-mass spectrometry (GC-MS), Reference Heck and Casanova19 gas chromatography with gas helium ionization detectors (HID), Reference Hopkins, Still, Haider, Fisher, Lewis and Seakins20 high performance liquid chromatography (HPLC), chromatography, and fluorimetry Reference Bareket, Rephaeli, Berkovitch, Nudelman and Rishpon21 have been applied to the detection of formaldehyde. However, these methods are expensive and time-consuming, requiring considerable experimental setup, toxic reagents or solvents and suffering from a number of interferences requiring time for apparatus setup, making it difficult to determine the chemical composition of a substance. Recently, several gas sensors based on different materials for formaldehyde detection have been developed due to their low cost, high sensitivity, fast response, excellent stability, and good suitability for the design of portable instruments. Reference Tian, Ding, Zeng, Wu, Zhang and Xie22 Thereinto, the SnO2-based sensor is the first considered sensor and a good candidate for this application because of the advantages described in the front while the research of the gas–solid adsorption relationships between formaldehyde and the SnO2-based sensor was relatively less.
The above sensing process with respect to organic molecules involves a number of oxidation reactions that consist of several elementary steps, including the activation of molecular oxygen (O2) to form active oxygen species Reference Gunawan, Lin, Teo, Ma, Highfield and Li23 while Fourier transform infrared spectroscopy (FTIR) is ideal to identify functional groups, reactive sites, adsorbed species, and intermediates on the surface of catalysts under reaction conditions. Diffuse reflectance infrared Fourier transform spectroscopy (DRIFTS) allows us to obtain the IR spectrum of samples in their original form being more sensitive to surface species than transmission IR, and its capability of controlling the environmental conditions has converted it into a powerful tool in surface chemistry. Reference Sambeth, Centeno, Paúl, Briand, Thoms and Odriozola24 Moreover, this technique allows us to study the adsorption as a function of time and temperature and to trace each elementary reaction. The initiation temperature of each elementary reaction can be investigated by altering the reaction temperature. In addition, variations in the amount of reagents, products, and the appearance or disappearance of intermediate species can also be monitored by in situ DRIFTS. Reference He and Ji25 Thus, in situ DRIFTS is an important tool for the characterization of the surface reactivity of gas-sensing materials.
In fact, in situ DRIFTS have been used to investigate the gas–solid adsorption relationships between different gases and different gas-sensing materials. Reference Tian, Ding, Zeng, Wu, Zhang and Xie22,Reference Gunawan, Lin, Teo, Ma, Highfield and Li23,Reference Huang, Kong, Yuan and Xie26,Reference Chen, Wang, Han, Gu and Guo27 For example, Tian et al. Reference Tian, Ding, Zeng, Wu, Zhang and Xie22 reported the possible formaldehyde-sensing mechanism on SnO2 films based on the DRIFTS at 190 °C, however, he did not study the DRIFTS at different temperatures and could not understand the evolution of formaldehyde on SnO2 films at different temperatures; Huang et al. Reference Huang, Kong, Yuan and Xie26 reported the formaldehyde gas adsorption and reactions on nano γ-Fe2O3 films by in situ DRIFTS; Chen et al. Reference Chen, Wang, Han, Gu and Guo27 reported the NO2-sensing mechanism on ZnO films by in situ DRIFTS; Gunawan et al. Reference Gunawan, Lin, Teo, Ma, Highfield and Li23 reported the acetone-sensing mechanism on α-Fe2O3 films by in situ DRIFTS.
In this paper, the nano-SnO2 flat-type coplanar formaldehyde gas sensor arrays were fabricated by a screen-printing technique based on nano-SnO2 powders prepared by a sol–gel method. The temperature- and concentration-dependent behaviors of the nano-SnO2 gas sensor arrays to formaldehyde are investigated. Tracing the surface reaction by DRIFTS sheds valuable light on the oxidation pathway and how this relates to the sensing mechanism.
II. EXPERIMENTAL
A. Synthesis of nano-SnO2 powders, fabrication of the flat-type coplanar gas sensor arrays, characterization of nano-SnO2 powders, and measurements of gas-sensing properties
The nano-SnO2 powders were prepared by a sol–gel method, the nano-SnO2 flat-type coplanar gas sensor arrays were fabricated by a screen-printing technique, and the nano-SnO2 powders were examined by XRD, FESEM, and BET techniques. In addition, the response to formaldehyde of the nano-SnO2 flat-type coplanar gas sensor arrays was investigated in the static gas-sensing measurement system. The detailed process was given in our previous literature. Reference Huang, Zhang, Yuan and Xie28
Gas sensors were made from preprepared pure SnO2 powders. The final powders were mixed and ground with an organic solution in an agate mortar to form a gas-sensing paste. Then, the screen-printing technique was used to print the paste onto an alumina substrate with preprinted Au interdigital electrodes (with a gap of about 0.2 mm) and a RuO2 heater, then sintered at 550 °C for 2 h. Finally, gold wires and a welding machine were used to solder the gas sensor arrays onto TO-8-003 supports to form gas-sensing devices and then aged at 250 °C for 3 days in air. The working temperature of sensors was adjusted through varying heating voltage. And formaldehyde was injected into a test chamber (30 L in volume) with a microliter syringe. The gas sensitivity in this paper was defined as S = R a/R g, where R a and R g were the resistances of a sensor in air and in a test gas, respectively. The response time was defined as the time required for the variation in conductance to reach 90% of the equilibrium value after a test gas was injected, and the recovery time as the time necessary for the sensor to return to 10% above the original conductance in air after releasing the test gas.
B. In situ DRIFTS measurement
The adsorption and reactions of formaldehyde on SnO2 films were studied by in situ DRIFTS. All spectra were recorded at 200–300 °C on a VERTEX 70 FT-IR Spectrometer (Bruker Optik GmbH, Leipzig, Germany) equipped with a liquid-nitrogen-cooled mercury cadmium telluride detector with a range of 4000–600 cm−1 and a diffuse reflection accessory containing a controlled environment and temperature reflectance cell, equipped with KBr windows, averaging 128 scans with a 4 cm−1 resolution and analyzed using OPUS software. In each DRIFTS experiment, an amount of KBr powders was located in the reactive cell with the nano-SnO2 films (2.8 × 2. 8 mm2) on the top of the powders, which was connected with a vacuum chamber for materials treatment to obtain reproducible reflecting planes. In addition, the temperature of the reactive cell was controlled by a thermostat ranging from room temperature to 600 °C. The pretreatment process at 200 °C and 5.0 × 10⁻³ Pa was performed for 15 min to make the sample reproducible, and the spectra of KBr powders were recorded for use as the background. A gas stream (30 mL/min) of 100 ppm formaldehyde was introduced into the cell at different temperatures, and the spectra were recorded after the sample was pretreated and heated to the predetermined temperature under flowing formaldehyde gas. A background spectrum was collected before each test. Spectra were measured in Kubelka–Munk (K–M) units: F(R ∞) = K/S = (1 − R ∞)2/2R ∞, where K, S, and R ∞ are the absorption coefficient, the scattering coefficient, and the reflectance of an infinite thick layer, respectively. When the scattering coefficient S is a constant, the Kubelka–Munk function F(R ∞) is proportional to the absorption coefficient K at a given wave length. Since, the scattering coefficient S varies only slightly with the wave number of the IR radiation, the shape of K–M spectrum mirrors the wave number dependence of the absorption coefficient K. Therefore, the K–M function is usually used as the IR absorption spectrum. Reference Tolvaj, Mitsui and Varga29
III. RESULTS AND DISCUSSION
A. Structural characterization
The XRD, SEM, and the specific BET surface area results of the nano-SnO2 powders were described in our previous literature. Reference Huang, Zhang, Yuan and Xie28 The XRD result testified the crystalline rutile structure of SnO2, and the average grain size was about 12 nm. According to the FESEM images of SnO2 powders presented in our previous literature, Reference Huang, Zhang, Yuan and Xie28 the nano-SnO2 powders were spherical and uniformly dispersed. In addition, the specific BET surface area of the nano-SnO2 powders was calculated to be 51.6819 m2/g, with a corresponding Barrett–Joyner–Halenda (BJH) desorption cumulative pore surface area of 63.0978 m2/g and a BJH desorption average pore diameter of 11.4319 nm.
B. Gas-sensing properties of nano-SnO2 flat-type coplanar gas sensor arrays
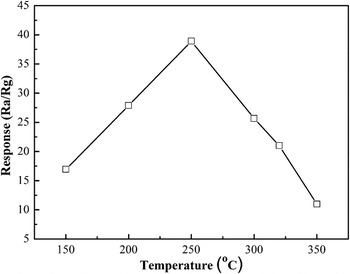
Figure 1 depicts the relationship between the response and the operating temperature of the sensor. The operating temperature has a great influence on the response. Interestingly, the responses increase with operating temperature, reach a maximum at 250 °C, and begin to reduce above the optimum working temperature. The changes in response to the operating temperature can be attributed to the fact that the adsorption type of oxygen molecules is chemisorption at higher temperature and physisorption at lower temperature. The quantity of the chemical adsorbed formaldehyde increases when the working temperature becomes high, which traps more electrons from the conductance band and causes the larger change of the resistance. Hence, the responses are enhanced with the increasing temperature. The adsorption attains a dynamic equilibrium of absorption–desorption at a proper temperature because the chemisorption is an exothermic reaction. If the working temperature keeps increasing, the reactants begin to desorb in large quantities. Given its volatile nature, the steady-state level of absorbed formaldehyde molecules will decrease progressively, and the balance will move to desorption, resulting in a decreased gas response above 250 °C. Reference Xie, Xiao, Hu, Bai, Xia and Zeng30,Reference Dong, Qin, Xu, Pan, Cheng and Xiang31
The effect of operating temperature on the sensor responses to 100 ppm formaldehyde.

The concentration of the adsorbates may be approximated from simple adsorption models. In the Lennard-Jones model, the rate of chemisorption is determined by an activation barrier between a physisorbed state and the chemisorbed state and an activation barrier of desorption as is illustrated in the literature.
Reference Matthias and Ulrike12
Using this model, the rate of chemisorption
 ${\rm{d}}\Theta /{\rm{d}}t$
is expressed as the difference in adsorption and desorption rates:
 $${\rm{d}}\Theta /{\rm{d}}t = {k_{{\rm{abs}}}}\exp \{ - \Delta {E_{\rm{A}}}/kT\} - \,{k_{{\rm{des}}}}\Theta \exp \{ - (\Delta {E_{\rm{A}}} + \Delta {H_{{\rm{chem}}}})/kT\} \quad ,$$
where ΔE
A is the activation barrier for chemisorption and ΔH
chem is the heat of chemisorption. Under steady-state conditions,
 ${\rm{d}}\Theta /{\rm{d}}t = 0$
, i.e., the rate of adsorption is equal to the rate of desorption, the coverage θ is dependent on the heat of chemisorption ΔH
chem and is given by
 $$\Theta = {k_{{\rm{abs}}}}/{k_{{\rm{des}}}}\exp \{ \Delta {H_{{\rm{chem}}}}/kT\} \quad .$$
Thus, generally the coverage will decrease with temperature. At low temperatures, the molecules are, however, trapped in a physisorbed state and cannot overcome the activation barrier ΔE A. This results in a maximum coverage at a temperature T max as is illustrated in the literature. Reference Matthias and Ulrike12 Hence, this theory further illustrates that the responses increase with operating temperature, reach a maximum at a certain temperature, and begin to reduce above the temperature.
As a typical n-type semiconductor, SnO2 belongs to the category of surface-sensitive materials. The gas-sensing mechanism is based on the changes in conductance of the SnO2 material. The oxygen adsorbed on the surface of the material influences the conductance of the SnO2 sensor. The oxygen adsorption depends on the particle size, large specific area of the material, and the operating temperature of the sensor. With the increasing temperature in air, the state of oxygen adsorbed on the surface of the SnO2 material undergoes the following reactions:
 $${{\rm{O}}_2}({\rm{g}}) \leftrightarrow {{\rm{O}}_2}({\rm{ads}})\quad ,$$
 $${{\rm{O}}_2}({\rm{ads}}) + {{\rm{e}}^ - } \leftrightarrow {\rm{O}}_2^ - ({\rm{ads}})\quad ,$$
 $${\rm{O}}_2^ - ({\rm{ads}}) + {{\rm{e}}^ - } \leftrightarrow 2{{\rm{O}}^ - }({\rm{ads}})\quad ,$$
 $${{\rm{O}}^ - }({\rm{ads}}) + {{\rm{e}}^ - } \leftrightarrow {{\rm{O}}^{2 - }}({\rm{ads}})\quad ,$$
wherein “g” and “ads” refer to gas and adsorbate, respectively. A transition temperature of 150 °C was found among the chemisorbed oxygen species. Below this temperature, oxygen adsorption on the surface was mainly in the form of
 ${\rm{O}}_{\rm{2}}^ -$
, whereas above 150 °C, chemisorbed oxygen in the form of O− or O2− was found.
Reference Matthias and Ulrike12
The oxygen species capture electrons from the material, leading to an increase in hole concentration and a decrease in electron concentration. As a result, negatively charged chemisorbed oxygen species cause an upward band bending and consequently a depletion layer in the near-surface region, and thus a reduced conductivity compared to the flat band situation. This causes a Schottky-like barrier across grain boundaries.
When the sensor is exposed to formaldehyde gas, the electrons trapped by the adsorptive states will be released, and go back into the semiconductor, reversing the band bending and resulting in an increased conductivity. The reaction process may be expressed in the Eq. (7). So, the nano-SnO2 flat-type coplanar gas sensor arrays are sensitive to reducing formaldehyde gas.
 $${\rm{HCHO}}({\rm{ads}}) + 2{{\rm{O}}^{2 - }}({\rm{ads}}) \leftrightarrow {\rm{C}}{{\rm{O}}_2} + {{\rm{H}}_2}{\rm{O}} + 4{{\rm{e}}^ - }\quad .$$
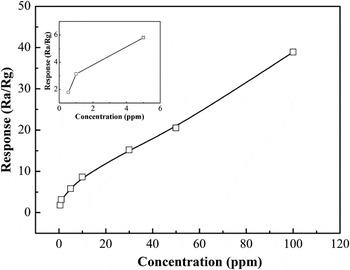
As shown in Fig. 2, the response of the nano-SnO2 flat-type coplanar gas sensor arrays operated at 250 °C shows good dependence on the gas concentration. These measurements were performed by injecting various amounts of the testing vapors into the sealed chamber at the operating temperature of 250 °C. The sensor arrays exhibit a response of 1.78 to formaldehyde with a concentration as low as 0.54 ppm, which is lower than the permissible long-term exposure limit 1 ppm of the NIOSH, Reference Zheng, Wang and Yao16 indicating that the nano-SnO2 flat-type coplanar gas sensor arrays can be applied for monitoring and controlling the formaldehyde gas.
Responses to formaldehyde concentrations in the range from 0.54 to 100 ppm of the nano-SnO2 flat-type coplanar gas sensor arrays at 250 °C.

The excellent formaldehyde gas-sensing property may be caused by the following reasons: first, the nanometer-size effect of nano-SnO2 powders. When the average size of the nano-SnO2 powders is comparable with 2L d, where L d is the thickness of the surface electron depletion layer resulting from oxygen adsorption, the gas sensitivity of SnO2 will be promoted much more. Reference Neri, Bonavita, Rizza, Galvagno, Pinna, Niederberger, Capone and Siciliano32 In fact, the L d of SnO2 is about 3 nm, Reference Chen, Nie, Xue, Wang and Wang33,Reference Zhang, Liu, Qi, Li and Lu34 and the average size of the nano-SnO2 powders prepared by the sol–gel method in this paper was about 12 nm, Reference Huang, Zhang, Yuan and Xie28 so most of the electrons are depleted because of the adsorption of oxygen in air. Another reason is the relatively large surface-to-volume ratio (51.6819 m2/g), which could provide good accessibility of gases to active sites. As a result, gas response of the nano-SnO2 sensor has a good sensitive performance to formaldehyde.
In addition, the fit curve namely the logarithm of sensitivity (lgS) as a function of the logarithm of formaldehyde gas concentration (lgC) is shown in Fig. 3. The fit curve shows the linear relationship lgS = lgA + N lgC, where the constant A is modified with the microstructure and surface reaction of gas materials and N is related to the morphology of the gas materials and the stoichiometry of the elements on the surface. The curve fitting shows the linear relationship lgS = 2.624 + 0.54466 lgC, and the correlation coefficient R is 0.98361, which is calculated by the least-squares method. The results show that the nano-SnO2 flat-type coplanar gas sensor arrays match with a dilogarithm for practical application in the detection range of 0.54–100 ppm of formaldehyde.
Dilogarithm fit curve of the gas response versus the concentration of formaldehyde at 250 °C.

A good response and quick response/recovery time were observed with this sensor at the optimal operating temperature of 250 °C. The response changes of the gas sensor to different formaldehyde gas concentrations (0.54–100 ppm) are shown in Fig. 4. As a highly sensitive sensor, it can measure very low concentrations, even 0.54 ppm. The output voltage approximately increases in a linear relationship to the formaldehyde gas concentration with a short response time. And the response time and recovery time (defined as the time required to reaching 90% of the final equilibrium value) to 0.54 ppm formaldehyde were 12 and 18 s, respectively.
Real-time response and recovery times of the sensor toward formaldehyde with increasing concentrations operated at an operating temperature of 250 °C.

C. In situ DRIFTS study
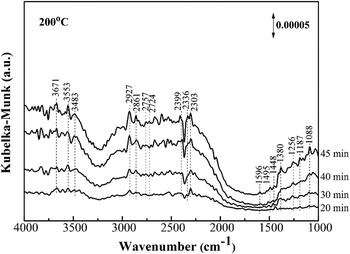
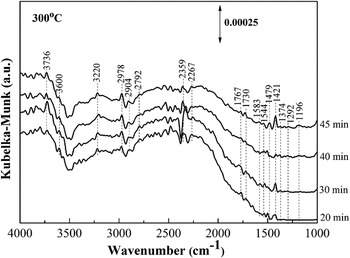
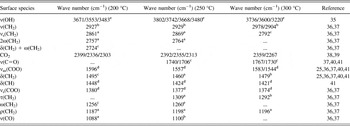
Formaldehyde was introduced into the cell at 200, 250, and 300 °C to investigate the adsorption of formaldehyde over SnO2, respectively. The results are presented in Figs. 5–7. The IR assignments of formaldehyde adsorption on SnO2 films at different temperatures are shown in Table I.
In situ DRIFTS spectra of 100 ppm formaldehyde adsorption on nano-SnO2 films at 200 °C.

In situ DRIFTS spectra of 100 ppm formaldehyde adsorption on nano-SnO2 films at 250 °C.

In situ DRIFTS spectra of 100 ppm formaldehyde adsorption on nano-SnO2 film at 300 °C.

IR assignments of formaldehyde adsorption on nano-SnO2 films at different temperatures.

a DOM.
b POM.
c HCHO.
d
 ${\rm{HCOO}}_{{\rm{(ads)}}}^ -$
.
e H2O.
As shown in Fig. 5, no obvious peaks appeared after 20 min adsorption of formaldehyde exposure on nano-SnO2 films at 200 °C. With increasing absorption time, the bands at 3671, 3553, and 3483 cm−1 (Ref. Reference Grossmann, Pavelko, Barsan and Weimar35) appeared, which were attributed to ν(OH) of the major surface species that adsorbed water during the adsorption of formaldehyde over SnO2 films. In addition, two weak bands at 1596 Reference Millar, Colin, Rochester and Waugh40 and 1380 cm−1 (Ref. Reference Raskó, Kecskés and Kiss36) ascribed to νas(COO) and νs(COO) were typical peaks of formate species. The absorption band at 1448 cm−1, Reference Lochař41 assigned to the deformation vibration δs(CH), also confirms the presence of formate species. However, no peaks due to molecularly adsorbed HCOOH were observed. Beside the formate species, the weak peaks at 2861, 2757, 1187, and 1088 cm−1 attributed to the characteristic peak of dioxymethylene [DOM, νs(CH2), 2ω(CH2), ρ(CH2), and ν(CO), respectively], Reference Raskó, Kecskés and Kiss36,Reference Kecskés, Raskó and Kiss37 a part of which underwent surface polymerization resulting in polyoxymethylene [POM, 2927 cm−1, Reference Raskó, Kecskés and Kiss36,Reference Kecskés, Raskó and Kiss37 ν(CH2)], appeared and dominated on the SnO2 films, at the same time, gradually strengthened with the time elapsed. The bands at 2724, 1495, and 1256 cm−1 were due to the molecularly adsorbed formaldehyde. Reference Raskó, Kecskés and Kiss36,Reference Kecskés, Raskó and Kiss37,Reference Lochař41 Finally, the bands characteristic of CO2 gas developed at 2399, 2303, and 2336 cm−1. Reference Xu, Raftery and Francisco38,Reference Du, Du and George39 According to the results, we can infer that when the sensor was exposed to formaldehyde gas, the gas was initially adsorbed on the surface at first. Then the adsorbed formaldehyde gas was oxidized to form dioxymethylene by chemisorbed oxygen species. After that, the intermediate product dioxymethylene was active, and it had a propensity to combine with surface oxygen to form formate ions with the breakage of C–H bonds. Finally, CO2 and H2O were formed after the oxidation of formate ions. Meanwhile, formaldehyde could be polymerized to linear polyoxymethylene (POM). The possible mechanism for formaldehyde decomposition may be shown as the following Eqs. (8)–(12):
 $$\rm{HCHO(g) \to HCHO(ads)}\quad ,$$
 $$\rm{HCHO(ads) + {O^{2 - }}(ads) \to {H_2}COO(ads) + 2{e^ - }}\quad ,$$
 $${{\rm{H}_2}{\rm{COO}}({\rm{ads}}) + {{\rm{O}}^{2 - }}({\rm{ads}}) \to\,\, {\rm{HCO}}{{\rm{O}}^ - }({\rm{ads}}) \,+ {\rm{O}}{{\rm{H}}^ - }({\rm{ads}})\quad ,$$
 $$\rm{HCO{O^ - }(ads) + O{H^ - }(ads) \to C{O_2} + {H_2}O + 2{e^ - }}\quad ,$$
 $$n{\rm{HCHO}} \to {[{\rm{C{H_2} - O}}]_n}\quad {\rm{.}}$$
Figure 6 displayed the spectra obtained from a time-dependence study of formaldehyde adsorption on SnO2 films at 250 °C. Most bands were observed at this temperature and quite stronger at this temperature compared with 200 °C, which was in accord with the gas-sensing properties (as shown in Fig. 1). Moreover, the band intensities increased with the progression of the reaction, indicating an active reaction on the surface. Initially, bands at 3802, 3742, 3668, and 3480 cm−1 indicated a certain amount of the weakly bound water molecules. Reference Grossmann, Pavelko, Barsan and Weimar35 Among them, the band at 3668 cm−1 was a terminal OH group (Sn–OH). Reference Grossmann, Pavelko, Barsan and Weimar35 It had also been proposed that the new band at 2692 cm−1 was possibly a vibration of formate species, Reference Millar, Colin, Rochester and Waugh40 due to Fermi resonance between ν(CH) and an overtone of the νs(COO) mode. In the lower wave number region, the new bands at 1557, Reference Raskó, Kecskés and Kiss36,Reference Kecskés, Raskó and Kiss37 1377, Reference Raskó, Kecskés and Kiss36,Reference Kecskés, Raskó and Kiss37 and 1424 cm−1 (Ref. Reference Lochař41) were assigned to the characteristic peaks of formate species [νas(COO), νs(COO), and δ(CH), respectively]. The new band due to gaseous formaldehyde at 1740 cm−1 (Ref. Reference Millar, Colin, Rochester and Waugh40) was discerned as well as the band at 1706 cm−1 (Ref. Reference Kecskés, Raskó and Kiss37) due to formaldehyde physisorbed on SnO2 films. Moreover, the bands at 2929 and 1100 cm−1 [polyoxymethylene; ν(CH2) and ν(CO)], Reference Xu, Raftery and Francisco38 and the comparatively weak bands at 2869, Reference Raskó, Kecskés and Kiss36,Reference Kecskés, Raskó and Kiss37 1460, Reference He and Ji25,Reference Raskó, Kecskés and Kiss36,Reference Kecskés, Raskó and Kiss37 1309, Reference Raskó, Kecskés and Kiss36,Reference Kecskés, Raskó and Kiss37 and 1198 cm−1 (Refs. 36 and 37) [dioxymethylene; νs(CH2), δ(CH2), τ(CH2), and ρ(CH2), respectively] were also found on the surface as shown in Table I and grew in intensity with increasing the reaction time. Finally, three rather intense bands at 2392, 2355, and 2313 cm−1 were observable in the carbon dioxide region due to the reaction running actively at this temperature according to the results of Fig. 1. Reference Xu, Raftery and Francisco38,Reference Du, Du and George39 All of these indicated the way for the reaction process as Eqs. (8)–(12) went.
Figure 7 shows the in situ DRIFTS spectra of formaldehyde adsorption on SnO2 films at 300 °C. Compared with Fig. 6, the bands were relatively weak, possibly because of the rapid desorption at the higher temperature, and no new surface species appeared during the adsorption of formaldehyde on SnO2 films. The bands at 3736, 3600, and the shoulder band at 3220 cm−1 (Ref. Reference Grossmann, Pavelko, Barsan and Weimar35) were ascribed to the OH stretching vibrations ν(OH) of adsorbed water. In the C–H stretching region, the 2929 cm−1 band disappeared at this temperature, Reference Raskó, Kecskés and Kiss36,Reference Kecskés, Raskó and Kiss37 whereas the new bands at 2978, Reference Kecskés, Raskó and Kiss37,Reference Millar, Colin, Rochester and Waugh40 2904, Reference Millar, Colin, Rochester and Waugh40 and 1292 cm−1 (Ref. Reference Kecskés, Raskó and Kiss37) appeared, which were due to ν(CH2) and τ(CH2) of polyoxymethylene, and band at 1479 cm−1 (Ref. Reference Millar, Colin, Rochester and Waugh40) to δ(CH2) of dioxymethylene species. Meanwhile, two rather intense bands at 2359 and 2267 cm−1 were observable in the carbon dioxide region. Reference Xu, Raftery and Francisco38,Reference Du, Du and George39 Increasing the contact time caused all bands to intensify apart from those at 2792, Reference Kecskés, Raskó and Kiss37 1767, Reference Lochař41 and 1730 cm−1 (Ref. Reference Millar, Colin, Rochester and Waugh40) due to gaseous and physisorbed formaldehyde [νs(CH2) and ν(CO), respectively], which decreased in size. In addition, the new bands at 1583 Reference He and Ji25 and 1544 cm−1 (Refs. Reference Raskó, Kecskés and Kiss36, Reference Kecskés, Raskó and Kiss37, and Reference Lochař41) were characteristic peaks of formate species [νas(COO)].
On the basis of the results, we find that the intensities of the bands of all the adsorbed species on the nano-SnO2 films showed obvious changes with the temperature. When the temperature was raised from 200 to 250 °C, the intensity strengthened elapsed with time. However, when the temperature was increased to 300 °C, very weak adsorptions on the surface could still be observed. This was consistent with the variation tendency of the response and the operating temperature of the sensor. The dioxymethylene, formate species, and polyoxymethylene were the important reaction intermediates for HCHO adsorption on the surface of SnO2 films, whereas CO2 and H2O were the final products. Thus, a simplified reaction scheme for the mechanism study of HCHO on the SnO2 films was proposed and shown in Fig. 8. Therein, the pathway [HCHO → H2CO2 (DOM) → HCOO− → CO2 + H2O] was consistent with the literature, Reference He and Ji25 meanwhile linear polyoxymethylene was a main intermediate product during the oxidation process of formaldehyde. Reference Lochař41
Reaction scheme of the mechanism of the formaldehyde gas-sensing property.

IV. CONCLUSIONS
The nano-SnO2 flat-type coplanar formaldehyde gas sensor arrays were successfully fabricated by a screen-printing technique based on nano-SnO2 powders prepared by a sol–gel method. The gas-sensing properties to 0.54–100 ppm formaldehyde were tested. The detection concentration of formaldehyde was as low as 0.54 ppm when the working temperature was 250 °C. The sensing mechanism was elucidated by in situ DRIFTS based on the gas–solid adsorption relationships between formaldehyde and SnO2 films. The results of the in situ DRIFTS experiment revealed that formate species, DOM, POM, CO2, H2O, and molecularly adsorbed formaldehyde surface species were formed during the interaction of formaldehyde with nano-SnO2 films at different temperatures. The possible mechanism of the reaction process may promote the development of an improved gas sensor for formaldehyde, which offers ultrahigh detection capabilities for organic molecules.
ACKNOWLEDGMENTS
This work was supported by the Opening Project (Grant No. MPCS-2011-D-13) of State Key Laboratory of Multiphase Complex Systems, Institute of Process Engineering, Chinese Academy of Science, and the Opening Project (Grant No. 2012-KF-4) of State Key Laboratory of Advanced Technology for Materials Synthesis and Processing (Wuhan University of Technology). The authors are also grateful to Analytical and Testing Center of Huazhong University of Science and Technology.