

Gender bias is pervasive in American society. It is well documented that boys and girls, and women and men, are often treated differently by people in positions of authority, peers, and colleagues. For example, teachers are more likely to call on boys than girls (Sadker, Sadker, and Klein Reference Sadker1991, 296–99), and news media focus on female candidates’ appearances and abilities to meet family responsibilities if elected (Niven and Zilber Reference Niven2001; Banwart, Bystrom, and Roberson Reference Banwart2003; see Hayes and Lawless [Reference Hayes2016] for an alternative finding). Gender bias shows up regularly in political discourse. Women are more likely to be interrupted, and they enjoy fewer speaking opportunities (Zimmerman and West Reference Zimmerman1975; Kollock, Blumstein, and Schwartz Reference Kollock1985; Lakoff Reference Lakoff1990; Mattei Reference Mattei1998). Scholars have found that “men tend to be perceived as more competent and to enjoy a higher status than women in discussions of what are perceived to be masculine subjects, including politics” (Karpowitz and Mendelberg Reference Karpowitz2014, 116) and that “interruptions are a communication signal. People signal their status and others’ through their use of such communication cues” (Mendelberg, Karpowitz, and Oliphant Reference Mendelberg2014, 20). A higher proportion of women in the discussion does not necessarily cure gender bias. Kathlene (Reference Kathlene1994) examined state legislative committee hearing transcripts and found that “as the proportion of women increases in a legislative body, men become more verbally aggressive and controlling of the hearing” (560). The increased presence of women in a highly masculinized environment may even lead to backlash (Yoder Reference Yoder1991; Kathlene Reference Kathlene1994; Rudman et al. Reference Rudman2012; Bauer Reference Bauer2017).
The upshot of this research is that women face significant obstacles in political discourse. This article investigates a form of gender bias in a novel setting: interruptions by justices during Supreme Court oral arguments. We investigate whether female lawyers suffer the same sorts of comparative disadvantages at the Supreme Court as they do in other political contexts: whether they are interrupted more and permitted less speaking time. Despite the pervasiveness of gender bias in discourse across American society, it would be somewhat surprising to find similar behavior at the Supreme Court. First, the justices are regularly reminded through the disputes they hear of rules requiring equal treatment in the workplace. Second, either the highly structured process of oral arguments or the unique characteristics of the justices and attorneys could limit the effects of gender bias. Finally, all the participants know that their words will be transcribed and available for public scrutiny. For all these reasons, Supreme Court oral arguments present a sort of “least-likely case’” for the overt manifestation of gender bias in political institutions. Evidence of systematic discrimination here would suggest just how pervasive such behavior is in American society and the workplace.
To answer our research question, we apply automated content analysis to the transcripts of 3,583 oral arguments before the US Supreme Court to evaluate whether the justices treat male and female lawyers differently. We find that female lawyers are interrupted earlier and more often, allowed to speak for less time between interruptions, and subjected to more and longer speeches by the justices compared to male lawyers. However, when the legal dispute concerns a gender-related issue, women are not disadvantaged compared to men. Our most novel and significant theoretical finding is that female lawyers do not enjoy the well-documented positive effect of being on the winning side of a case. While male lawyers are treated substantially more deferentially when they represent the winning side of a case, female lawyers enjoy no such benefit from being on the winning side. Finally, we find that the increasing number of female justices on the Court does not seem to have mitigated the disparate treatment of female lawyers.
Gender Schemas and Implicit Attitudes
We draw on the extensive psychology literature on gender schemas and implicit attitudes as a theoretical foundation for our hypotheses regarding gender bias in oral arguments at the US Supreme Court. Schemas are cognitive processing structures that help individuals impose meaning on a large amount of stimuli (Neisser Reference Neisser1976). Preexisting schemas interact with incoming stimuli to create a perception (Bern Reference Bern1981). Gender schema theory was first posited by Bern (Reference Bern1981) and described in terms of development of self-concept and sex-typing largely occurring during childhood and influenced by cultural norms of masculine and feminine roles. These cognitive structures contribute to gender role expectations based on biological sex and help explain treatment of women and men in the workplace (Bern Reference Bern1993; Lemons and Parzinger Reference Lemons2007). Schematic processing has served as the foundation for some research on gender stereotyping, particularly examining the association of particular toys, jobs, activities, and so on, into gender categories of “for boys” or “for girls” (Martin and Halverson Reference Martin1981; Martin Reference Martin1987; Martin, Wood, and Little Reference Martin1990).
More recently, explicit and implicit attitudes have received attention in the field of psychology, particularly due to the widespread use of implicit association tests (Rudman and Kilianski Reference Rudman2000; Nosek, Banaji, and Greenwald Reference Nosek2002; Greenwald and Kreiger Reference Greenwald2006; Green et al. Reference Green2007; Stanley, Phelps, and Banaji Reference Stanley2008). Explicit attitudes are consciously professed, whereas implicit attitudes are unconscious automatic associations of a personal characteristic (gender, race, sexual orientation, religion, etc.) with a role or evaluation (career, family, science, liberal arts, good, bad, etc.; Greenwald and Kreiger Reference Greenwald2006). The distinction between implicit and explicit attitudes is important, particularly in terms of ability to alter one’s behavior (see Gawronski and Bodenhousen Reference Gawronski2006). Implicit attitudes are unconscious associations of an object with an evaluation and are not available for self-examination. Contrast this with a gender stereotype (e.g., girls are good at reading and bad at math), in which one is conscious of the stereotype and able to assess one’s thoughts and/or behavior in light of the stereotype. Kiefer and Sekaquaptewa (Reference Kiefer2007, 13) note, “Implicit and explicit stereotypes are different constructs with potentially distinct effects on performance and motivation.” Implicit associations (even ones that contradict our explicit attitudes) can influence our behavior (Graham and Lowery Reference Graham2004; Reskin Reference Reskin2005; Greenwald and Krieger Reference Greenwald2006; Kang et al. Reference Kang2012; Beattie, Cohen, and McGuire Reference Beattie2013).
In this research, we suggest that implicit gender attitudes held by Supreme Court justices may contribute to female lawyers being interrupted more often than male lawyers and subsequently afforded less speaking time during oral arguments. These unconscious attitudes may lead justices to associate male lawyers with evaluations such as “authoritative” and “credible,” resulting in more deference to male lawyers during oral arguments.
Courts, Gender, and Supreme Court Oral Arguments
Examination of gender bias in the courts is not new. As early as 1980, the National Organization for Women founded a program to promote equality in the courts. By the mid-1990s, numerous states had created task forces and issued reports detailing gender bias as a “pervasive problem” in state courts (Riger et al. Reference Riger1995, 466; see also Schafran Reference Schafran1987). Other studies have examined how genders of judges and lawyers affect decision making (e.g., Hahn and Clayton Reference Hahn1996; Segal Reference Segal2000; Pereise Reference Pereise2005; Collins and Moyer Reference Collins2008; Boyd, Epstein, and Martin Reference Boyd2010).
Recent work has employed gender schema theory to examine the influence of lawyer gender on Supreme Court decision making (Szmer, Sarver, and Kaheny Reference Szmer2010) and the courts of appeals (Szmer et al. Reference Szmer2013). Szmer et al. (Reference Szmer2010) do not find a statistically significant relationship between lawyer gender and case outcome, but they do find that conservative justices are less likely to support litigants represented by women. They also find that justices are more likely to side with female lawyers when the case focuses on a “women’s issue.”
In this article, we suggest that implicit gender bias toward female lawyers may result in disparate treatment, but our research differs from previous research in that our dependent variables focus on the speaking time of female lawyers compared to male lawyers during oral arguments rather than case outcome. Speaking time during oral arguments is a more direct test of disparate treatment because it is less influenced by the myriad of other factors that influence case outcomes (see, e.g., Collins Reference Collins2008). Oral arguments are the most public part of the Court’s decision process and the only chance the public gets to hear deliberation in action. Each side has the same amount of time to present its case, but justices are in charge of oral arguments and frequently interrupt lawyers at will to challenge arguments, ask for clarification, or try to influence the views of other justices (Johnson Reference Johnson2004; Black, Johnson, and Wedeking Reference Black2012; Ringsmuth, Bryan, and Johnson Reference Ringsmuth2013). The information from oral arguments can influence justices’ written opinions (Johnson Reference Johnson2001, Reference Johnson2004); hence, lawyers use oral arguments to emphasize points made in legal briefs, elaborate their legal positions, and respond to justices’ questions and counterarguments (Haire, Lindquist, and Hartley Reference Haire1999; Strum Reference Strum2000; Johnson Reference Johnson2001, Reference Johnson2004).
We suggest that when a justice interrupts a lawyer or speaks for a long time, it is a more spontaneous reaction than his or her vote on the case and is therefore a better indication of his or her potential implicit biases. In related research, Philips and Carter (Reference Phillips2010) evaluated whether justices’ interacted differently with male and female lawyers. Analyzing 57 cases from 2004 to 2008, Phillips and Carter found that liberal justices spoke less when female lawyers were presenting, and their questions to female lawyers were more likely to be open-ended or information-seeking. Conversely, conservative justices spoke more when female lawyers were presenting, and they were more likely to make declarations or ask constraining or leading questions to female lawyers. These findings are intriguing, but the short time frame and small number of arguments analyzed beg for a broader analysis of the relationship between justices’ questioning and lawyer gender.
The rich literature in psychology regarding gender schemas and implicit attitudes, combined with the well-documented gender bias that exists in both political and nonpolitical discourse, provides a strong theoretical foundation for our hypothesis regarding gender bias during oral arguments at the US Supreme Court:
Hypothesis 1. Justices will interrupt female lawyers more often and permit them less speaking time compared to male lawyers.
If we find support for our hypothesis of disparate treatment of female lawyers by Supreme Court justices, it should raise an alarm bell for workplaces across the country for the reasons we detail below.
A Least-Likely Case: Supreme Court Oral Arguments
Despite the strong evidence of gender-related differences in political discourse, several factors related to Supreme Court oral arguments might mitigate the effects of the gender of the arguing lawyer. Supreme Court oral arguments are public, closely observed by journalists, and recorded for posterity. All participants are aware of this scrutiny, so overt gender bias during oral arguments is unlikely. Second, the legal context of oral arguments could prime the justices to be aware of and monitor their treatment of male and female lawyers, because the justices are regularly reminded of rules requiring equal treatment of men and women in the workplace. Third, Supreme Court oral arguments are not free-form discussions. They are highly organized events, where each side gets an equal amount of time to present its argument and field questions from the bench. All participants are already familiar with the issues through briefs filed in advance. As Karpowitz and Mendleberg (Reference Karpowitz2014) show, institutional rules can influence the way gender interacts with discussions, so the highly structured nature of oral arguments could dampen the effect of gender. Finally, the participants in Supreme Court oral arguments are hardly typical. They have sought entry into the competitive and masculine (Haynes Reference Haynes2012) legal profession. The justices and lawyers are all high-achieving and ambitious products of top law schools and have undergone similar socialization into the field (Boyd et al. Reference Boyd2010, 391). The fact that the participants share experiences and characteristics that set them apart from everyday society could lead them to interact differently than general society. Hence, the characteristics of the participants, the processes, and the context of Supreme Court oral arguments could combine to mitigate the effect of gender.
Data and Methods
We utilize automated content analysis to build a data set to test our hypotheses. The use of automated content analysis to investigate judicial behavior is an established methodology (e.g., Evans et al. Reference Evans2007; Black and Spriggs Reference Black2008; Corley Reference Corley2008; Corley, Collins, and Calvin Reference Corley2011; Owens and Wedeking Reference Owens2011; Rice Reference Rice2017). We first downloaded the transcripts of Supreme Court oral arguments from the Court’s 1979 term (the earliest available on Lexis-Nexus) through the end of the 2013 term, producing a list of 3,583 arguments.Footnote 1 We then split the data by lawyer presentation. Each observation in the data set represents one presentation by one lawyer before the Supreme Court.Footnote 2
Supreme Court oral arguments are organized by litigant side, with the petitioners going first, followed by respondents.Footnote 3 Each side is given an equal amount of time, usually 30 minutes, to present its case. Within each side’s argument, the presentation may be broken up in several ways. Lawyers may speak for a portion of their time and reserve the balance for rebuttal argument or two or more lawyers may share the time allotted for a particular side. Either of these situations would result in multiple observations per side. For example, if three separate lawyers make one presentation each for the respondent’s side, the respondent has three observations in the data set. This generated 10,345 usable observations.Footnote 4 The splitting of the data, the counting of the justices’ questions, and measuring the lengths of justices’ and advocates’ speeches were accomplished with a series of self-constructed computer programs written in Python.Footnote 5 We first split each oral argument by presentation and then split each presentation into individual speeches by attorney and justices. We then counted and recorded the number of speeches and number of words in each speech.
We merged our data on oral arguments with the Supreme Court Data Base (SCDB; Spaeth et al. Reference Spaeth2014). This allows us to control for the issue being litigated, which side wins the case, and the alignment between the Court’s ideological median and the ideological direction represented by each side. These variables allow us to investigate whether the effect of a female lawyer is different depending on case subject (gendered or not) and whether the lawyer represents the winning side. Because our dependent variables are counts of words or interruptions, we use Poisson regression to evaluate our hypotheses.
Dependent Variables
We created four dependent variables measuring slightly different dimensions of the justices’ interactions with the lawyers appearing at oral argument:
-
1. Length of Lawyer’s Opening Speech. This variable measures the length, in words, of the lawyer’s first uninterrupted speech. This is important because it measures the extent to which the lawyer is allowed to present his or her prepared argument without being interrupted by a question or challenge from a justice. Allowing the lawyer to organize and lay out the argument shows deference by the justices and may be an indicator of the extent to which the justices trust that the lawyer will meet their informational needs. Because this variable reflects the very beginning of the lawyer’s presentation, the justices are not reacting to perceived quality of the presentation.
-
2. Average Length of Lawyer’s Speeches. This variable measures the mean number of words spoken by the lawyer between interruptions by the justices. Longer speeches by the lawyer suggest that the justices are allowing the lawyer the time to explain his or her arguments.
-
3. Average Length of Justices’ Speeches. This variable measures the extent to which justices’ interruptions are short or long. The longer the justices’ interruptions, the more the justices are dominating the discussion, possibly by challenging the lawyer with counterarguments or offering their own alternative arguments.
-
4. Number of Interruptions by Justices. This variable measures how many times the lawyer was interrupted. The total number of justice interruptions is adjusted for the length of the lawyer’s presentation by dividing the number of justices’ interruptions by the total number of words spoken (by both justices and lawyer) during the lawyer’s presentation. More interruptions indicate less deference toward the lawyer and undermine the lawyer’s ability to present his or her prepared argument.
Each of these measures reflects the Court’s willingness to allow lawyers to present their cases and have the best opportunity to persuade the justices, but each provides a slightly different view of how deferentially the justices treat the lawyers.
Independent Variables of Interest
Our primary independent variable of interest is the gender of the lawyer, denoted as Female Lawyer. We coded this variable by using the title (Mr., Mrs., Ms., or, occasionally, Miss) in the oral argument transcript.Footnote 6 Overall, 10.9% of the appearances were by female lawyers. The proportion of women appearing at oral argument increased over time: after the 2000 term, 14.2% of the appearances were by women. We expect justices will interrupt female lawyers more often and permit them less speaking time compared to male lawyers.
Control Variables
Based on the extant literature, we include several control variables. Gendered Issue, cases involving gender discrimination, abortion, or contraception, were coded based on the Supreme Court Database (SCDB; Spaeth et al. Reference Spaeth2014). Szmer et al. (Reference Szmer2010) found that justices were more likely to side with female lawyers when the case being argued was a gendered issue.Footnote 7 This suggests:
Hypothesis 2. Justices may show female lawyers a higher degree of deference when the case focuses on a “women’s issue.”
Thus, we expect that justices will interrupt female lawyers less often, resulting in comparable speaking time to male lawyers when the case being argued is a gendered issue compared to when it is not.
Winning Side is a dummy variable indicating that the lawyer represents the litigant ultimately favored by the Court. This variable is also taken from the SCDB (Spaeth et al. Reference Spaeth2014). One of the most consistent results in the study of Supreme Court oral arguments is that the justices ask fewer and shorter questions of, and show greater deference toward, the winning side (Shullman Reference Shullman2004; Roberts Reference Roberts2005; Wrightsman Reference Wrightsman2008; Johnson, Black, and Wedeking Reference Johnson2009; Epstein, Landes, and Posner Reference Epstein2010). We thus include Winning Side as an important control variable and expect that it will have a negative relationship with interruptions and justice speaking time. The well-documented effect of being on the winning side provides a useful standard for evaluating the effect of gender: one way to measure the significance of gender is to measure whether female lawyers gain the same benefit as male lawyers from being on the winning side.
Hypothesis 3. Female lawyers will receive a smaller benefit, in terms of deference, from being on the winning side of a case than male lawyers receive.
Ideological Alignment records ideological agreement between the outcome sought by the litigant and the median justice on the Court. We used Martin-Quinn ideal point scores (Martin and Quinn Reference Martin2002) to identify the median justice. Higher numbers indicate greater alignment between the lawyer’s argument and the Court’s ideological leaning. In Martin-Quinn scores, higher numbers indicate more conservative ideology. For litigants seeking a conservative outcome, Ideological Alignment is simply the court median. For litigants seeking a liberal outcome, Ideological Alignment is the Court median multiplied by negative one.
Federal Solicitor General’s Office records whether the lawyer is affiliated with the Office of the Solicitor General in the Department of Justice. Private Lawyer Based in DC is a dummy variable indicating that the lawyer is based in Washington, DC, but is not affiliated with the US Department of Justice. This variable is included to reflect the high status of lawyers based in Washington, DC (McGuire Reference McGuire1993). State Attorney General indicates that the lawyer is representing a state attorney general’s office. Lawyer’s Previous Appearances is a count of the number of prior cases the lawyer has argued before the Supreme Court since 1968. To determine the number of previous appearances, we downloaded Supreme Court opinions from the 1968–78 terms and created a list of all lawyers who appeared in those cases. From this list we calculated the number of appearances by each lawyer, and we then used that number as a starting point, adding one for each case appeared in during the time frame covered by our data (beginning with the 1979 term). State Attorney General and Lawyer’s Previous Appearances have been shown to influence the justices’ treatment of lawyers during oral argument (McGuire Reference McGuire1995; Roberts Reference Roberts2005). Justices tend to speak more in highly salient cases (Black, Sorenson, and Johnson Reference Black2013), so we include Salience, measured at the time of oral argument (Clark, Lax, and Rice Reference Clark2015).
Because the justices’ questioning changes systematically as the oral argument progresses, we include variables representing the side and sequence of lawyers’ presentations. The justices systematically allow the first speaker more time at the beginning of the argument. The first lawyers for the petitioners (the side that speaks first) were allowed an average of 273 words at the beginning of their presentations. Subsequent speakers were allowed an average of 197 words before the first interruption. The average length of lawyers’ speaking turns also varied systematically. Justices’ interruptions are significantly longer, and lawyers’ speaking turns between interruptions are substantially shorter, during the first presentation for each side. First Petitioner is a dummy variable indicating that presentation was the first by the petitioner’s side. First Respondent indicates the presentation was the first by the respondent’s side. The reference category for these two dummy variables is a subsequent speaker for either side. Finally, we include dummy variables for each annual term of the Court to control for long-term changes in the way the justices interact with lawyers during oral argument (Posner Reference Posner2012).Footnote 8
The Effect of Gender on Oral Arguments
Our first empirical results are difference of means tests comparing the treatment of male and female lawyers during oral arguments. Table 1 presents difference of means tests for each of our dependent variables, showing that male lawyers are allowed significantly more speaking time than female lawyers. Columns 1–3 show comparisons among all lawyers appearing before the Court. Men were allowed an average of 225 words before the first interruption, compared to 192 words for women. Male lawyers spoke an average of about 95 words between interruptions, compared to 83 words for female lawyers. Justices’ interruptions are both longer and more frequent during presentations by female lawyers. The average length of a justice’s speech was 25.7 words during a male lawyer’s presentation compared to 28.3 words during a female lawyer’s presentation, and justices interrupted women an average of 51.3 times compared to 49.2 times for men.
Difference of Means Tests by Lawyer Gender (Unequal Variances)

Note.—Standard errors are in parentheses.
* p ≤ .01.
It is possible that women systematically represent different types of clients before the Court with potentially weaker legal arguments and that this difference is causing the differences in how they are treated. One way to control for this possibility is to compare the experiences of male and female lawyers who are representing the same client. The second set of data in table 1 (cols. 4–6) pertains only to lawyers appearing on behalf of the US Solicitor General’s Office. All these lawyers have the United States as a client, and all should be presenting legal arguments vetted by the Department of Justice. Within this subgroup of oral arguments, all the gender-related patterns from the larger group of oral arguments are repeated. Women representing the Solicitor General’s Office are allowed fewer words at the beginnings of and during their presentations, and they endure longer and more frequent interruptions compared to men representing the same office. All the differences shown in table 1 are statistically significant.
These results strongly suggest that justices are treating male and female lawyers systematically differently. However, we have not yet controlled for other plausible influences on justices’ behavior during oral arguments. In the next section, we present a series of multivariate regression analyses that do control for other factors.Footnote 9
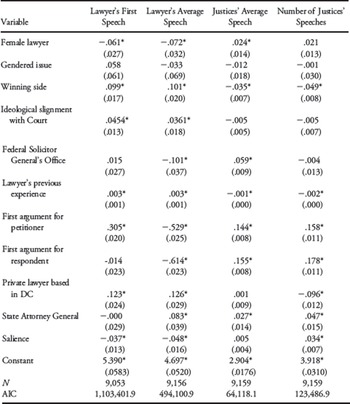
Figure 1 presents the results of our first set of regression models. Each column presents the results from a truncated Poisson regression for one of the four dependent variables. For each independent variable, the diamond identifies the estimated effect of a one-unit change in the independent variable on the dependent variable. The horizontal line displays the 90% confidence interval of the estimate.Footnote 10 The vertical reference line in each graph marks zero effect, so the effect is statistically significant if the confidence interval line does not cross the vertical line.
In each graph, the point estimates and standard errors show the change in the predicted value of the relevant dependent variable due to a one-unit change in the relevant independent variable. The estimates were produced using Stata’s truncated Poisson regression with errors clustered on the case. The vertical line in each column reflects zero effect. Error bars show 90% confidence intervals. The table of estimates and standard errors is table A2 in the appendix.

The results presented in figure 1 are consistent with our theoretical arguments. Recall that we expect Female Lawyer to be associated with shorter opening speeches, shorter average speech length, and more and longer interruptions by justices. These hypotheses are confirmed. Female Lawyer has a negative and significant effect on the length of the lawyer’s opening speech (col. 1) and on the average length of the lawyer speeches (col. 2). Female Lawyer has a positive and significant effect on the length of justices’ speeches (col. 3) and on the number of justices’ speeches (col. 4). For example, female lawyers are interrupted about 13.7 words earlier than male lawyers. The average number of words before the first interruption is 232, so female lawyers get about 5% less time to begin their arguments. The finding of a statistically significant difference at the beginning of the argument (opening speech) for male and female lawyers undermines the claim that justices are interrupting due to the quality of the argument. By interrupting earlier, they are not letting the lawyer display the quality of the argument.
Column 2 shows that the average speech length of female lawyers is 6.7 words shorter than the average speech length of a male lawyer. Although six or seven words does not sound like much, it is about 7% of the average speech length. During a 30-minute presentation, lawyers speak about 50 times, on average. This means female lawyers say approximately 350 fewer words (a little over one page of written text) compared to male lawyers. Column 3 shows that justices’ speeches are 0.6 words, or about 2%, longer during presentations by female lawyers. While not substantively impressive, this difference is statistically significant. Column 4 shows that justices interrupt female lawyers 1.1 more times per 30-minute presentation compared to male lawyers. This difference falls just short of statistical significance. Overall, these results support our hypothesis, and they show that the justices treat female lawyers less deferentially than male lawyers.
The second row of results in figure 1 examine the effect of Gendered Issue on the four dependent variables. We find no statistically significant effect of the subject of the case being a gendered issue (gender discrimination, abortion, contraception) on the Length of Lawyer’s First Speech, Average Length of Lawyer’s Speeches, Average Length of Justices’ Speeches, or Number of Justices’ Speeches. The third row of results relates to the effect of being on the winning side in the dispute. Lawyers on the winning side are treated substantially more deferentially than lawyers on the losing side. For example, the first and second columns show that lawyers for the winning side are allowed to speak 22.9 more words before being interrupted for the first time and 9.4 more words between each subsequent interruption. The remaining columns show that justices indulge in shorter (col. 3) and fewer (col. 4) speeches during the winning side’s presentation. Similarly, lawyers presenting arguments consistent with the Court’s median ideology (row 4) are allowed longer initial and average speeches (cols. 1 and 2).
As noted above, we include a number of control variables that measure the status of the attorneys appearing before the Court: Federal Solicitor General’s Office, Lawyer’s Previous Appearances, and Private Lawyer Based in DC. These variables are coded so that higher values indicate greater status and credibility. As such, we would expect that the effect of these variables would be opposite that of Female Lawyer. All three of the variables indicating the status of the attorney are associated with increases in Length of the Attorney’s First Speech (col. 1), although only Private Lawyer Based in DC is statistically significant. Private Lawyer Based in DC also shows positive and significant effect on Average Length of Lawyer’s Speeches (col. 2) and a negative and significant effect on Number of Justices’ Speeches (col. 4).
Two anomalies among these control variables are the significant effects of Federal Solicitor General’s Office in column 2, Average Length of Lawyer’s Speeches, and column 3, Average Length of Justices’ Speeches. This indicates that, like women, lawyers from the Solicitor General’s Office tend to be interrupted more frequently and justices speak longer during their presentations. Previous literature provides an explanation of the finding. Salokar (Reference Salokar1994) finds a relatively informal relationship develops between the justices and the frequently-appearing attorneys from the Solicitor General’s Office (Salokar Reference Salokar1994, 31). We suggest that this may result in a back-and-forth discussion between the justices and the solicitor general during oral arguments due to familiarity of argument style. Shullman (Reference Shullman2004, 278) finds that “justices’ questions often increase in number and hostility when they are addressed to the Solicitor General.” Our finding of frequent interruptions supports Shullman’s finding, although we do not address the tone of interruptions in this research.Footnote 11
The Effects of Gendered Issue and Winning Side
Our primary results, presented in figure 1, show strong support for our hypothesis that female lawyers arguing before the US Supreme Court experience more interruptions from the justices and endure longer speeches from the bench compared to their male counterparts. Recall that we posit that justices are not consciously manifesting sexism but are instead subject to the widespread gender schemas and implicit biases that affect most people in society. This finding alone is important. It points to disparate treatment in a place one would least expect to find it, suggesting that men likely receive more deferential treatment from bosses and coworkers in all manners of workplaces compared to their female counterparts. In this section of the article, we present two additional hypotheses based on the findings in the initial analysis. We examine whether the effect of lawyer gender may be mitigated by two variables of interest, Gendered Issue and Winning Side. The results of these analyses may help clarify whether disparate treatment occurs to a lesser degree in some situations than others.
Gendered Issue
The Supreme Court regularly hears arguments about issues of particular concern to women, such as reproductive rights and gender discrimination. Previous research shows that the context or situation in which implicit attitudes are activated affects how subjects are evaluated (Mitchell, Nosek, and Banaji Reference Mitchell2003). For example, the presence of an African American researcher and positive examples of African Americans resulted in more positive evaluations of African Americans on implicit association tests (Dasgupta and Greenwald Reference Dasgupta2001; Lowery, Hardin, and Sinclair Reference Lowery2001; Blair Reference Blair2002). Other research has shown that implicit negative biases toward the elderly (Karpinski and Hilton Reference Karpinski2001) and women (Blair, Ma, and Lenton Reference Blair2001) can be mitigated by a context that draws attention to the implicit attitude. Hence, the context of a particular case may prime the justices to treat female lawyers more similarly to male lawyers, perhaps viewing them as authorities on the particular issue, thus enhancing credibility. As McGuire (Reference McGuire1995) notes, “In making decisions, the justices have certain informational needs; they require a clear and faithful focus on the issues presented in a case, an understanding of the relationship of those issues to existing law, a clarification of uncertainties. … The justices need reliable information and thus place a premium on its more credible suppliers” (189, 194). Thus, justices’ implicit attitudes about female and male lawyers may lead to greater deference toward female lawyers in specific cases where the oral arguments center around a women’s issue.
Winning Side
A consistent body of literature finds that the justices ask fewer and shorter questions of, and show greater deference toward, lawyers representing the side that ultimately wins the case (Shullman Reference Shullman2004; Roberts Reference Roberts2005; Wrightsman Reference Wrightsman2008; Johnson et al. Reference Johnson2009; Epstein et al. Reference Epstein2010). This “winning side” effect could be the result of the justices having pre-argument preferences about which side they will vote for and treating that side more deferentially. It could also be the case that more skilled advocates are treated more deferentially and are more likely to win their cases. Research suggests that oral arguments have a small but discernible impact on which side wins. Johnson, Walhbeck, and Spriggs (Reference Johnson2006, 111–12) find that “the Justices are more likely to vote for the litigant whose lawyer provided higher quality oral advocacy.” However, it is difficult to separate the effect of justices’ pre-argument preferences from the effects of high-quality oral advocacy. Ringsmuth et al. (Reference Ringsmuth2013, 436) note that “oral arguments can and do change Justices’ minds,” but the relative frequency of vote-switching is less than 10%. Epstein et al. (Reference Epstein2010) advance the “realistic” argument that justices often make up their minds before oral argument. It seems fair to conclude that justices have pre-argument preferences about which side they will support and that those preferences are rarely changed by oral arguments. So most of the winning side effect on oral arguments is caused by the justices knowing which side they support and treating that side more deferentially. Thus, we can evaluate the extent to which the justices treat female lawyers differently by investigating whether female lawyers receive the same benefit as male lawyers from representing the winning side. A finding that being on the winning side does not help female lawyers the same way it helps male lawyers would be strong corroborating evidence for our earlier findings of biased treatment.
Estimation Strategy and Results
We retained all control variables from the primary analysis and added two interaction terms, Female Lawyer × Gendered Issue and Female Lawyer × Winning Side. Figure 2 presents predicted values for the four dependent variables for male and female lawyers based on the regression results.Footnote 12 Predicted values are presented for each gender under the scenario of arguing a case that is a gendered issue or a nongendered issue and for being on the losing or winning side. In each column, the labeled diamond represents the predicted value for that dependent variable in the relevant situation. The horizontal lines emanating from the diamonds represent the 90% confidence intervals. The vertical line in each column shows the predicted value of the dependent variable when all independent variables are held at their mean values.
In each graph, the point estimates and standard errors show the predicted values of the relevant dependent variable under the combinations listed on the left side. The estimates were produced using Stata’s truncated Poisson regression and standard errors clustered on the case. Error bars show 90% confidence intervals. The table of estimates and standard errors is table A3 in the appendix.

We hypothesized that female lawyers will be treated more deferentially when the dispute concerns a gendered issue compared to a nongendered issue. The results, presented in the top half of figure 2, largely bear this out. When arguing gendered issues, female lawyers are allowed more time at the beginning of their presentations (col. 1) and more time between interruptions (col. 2), and they are interrupted fewer times (col. 4). In fact, they are treated more deferentially than men in these situations. These differences are relatively large in magnitude, but, except for Number of Justices’ Speeches, they are not statistically significant due to the small number of observations of female lawyers arguing gendered issues.Footnote 13 Again, the sole exception to this pattern is the Average Length of Justices’ Speeches (col. 3). Justices speak longer than average when women are presenting on gendered issues, but the effect is not statistically significant.
The bottom half of figure 2 shows how the justices interact with male and female lawyers on the winning and losing sides in the dispute, respectively. Recall that being on the winning side is associated, theoretically and empirically, with more deferential treatment by the justices.
We find that only male lawyers get the benefit of being on the winning side. For a male lawyer, being on the winning side means getting to speak 244.4 words without interruption at the beginning of the presentation compared with 219.7 words if he is on the losing side (col. 1). This is a gain of about 25 words, or more than 10% of the average opening speech. For a woman, being on the winning side carries very little benefit: 219.9 words compared to 217.2 if she is on the losing side. Being on the winning side makes almost no difference for women. Female lawyers are treated like losers whether they are on the winning side or not.
The same pattern describes the effect of winning on the Average Length of Lawyer’s Speeches and Number of Justices’ Speeches (cols. 2 and 4). In both cases, men are treated significantly better when they are on the winning side, but women are not. Male lawyers get to speak an average of 98.1 words between interruptions when they are on the winning side, a bonus of 10 words over their average when on the losing side. Female lawyers get to speak an average of only 87.1 words when they are on the winning side, a bonus of only 1.1 words over their average when on the losing side, and still less than men on the losing side. Female lawyers on the winning side are treated like men on the losing side during oral arguments. The story is similar with regard to Number of Justices’ Speeches. Justices interrupt significantly fewer times when a male lawyer represents the winning side. But women get a much smaller, and statistically insignificant, benefit from being on the winning side. In terms of length of opening speeches, length of average speeches, and number of interruptions, female lawyers on the winning side are treated like men on the losing side and get no significant benefit from being on the winning side. The exception to this pattern is Length of Justices’ Speeches (col. 3). Both male and female lawyers benefit from being on the winning side in terms of shorter speeches by the justices, although the benefit for women is not statistically significant.
The Increasing Number of Female Justices
One of the virtues of the long span of data we analyze is that it stretches from the time of the all-male Supreme Court through the current three female justices, allowing us to evaluate the effect of the increasing number of women on the Court. Figure 3 shows the effect of Female Lawyer under zero, one, two, and three female justices, respectively (controlling for all other independent variables).Footnote 14 Each of the four graphs shows the effect of a female lawyer on a particular dependent variable as the number of female justices increases. In terms of their opening speeches, the upper-left graph in figure 3 shows a consistent trend: as the number of female justices increased, female lawyers were allowed longer opening speeches (relative to male lawyers). When there were no female justices, female lawyers’ opening speeches were nearly 60 words shorter than the opening speeches of male lawyers. That difference has shrunk as more female justices have been appointed. However, for the other three dependent variables, there is no such trend. The disparate treatment of female lawyers, in terms of the average length of their speeches and the length and number of justices’ speeches, is more dramatic with three female justices than it was when there were no women on the Court. This may support the backlash hypothesis posited by Yoder (Reference Yoder1991) and Kathlene (Reference Kathlene1994) regarding the increased presence of women in a highly masculine environment.
In each graph, the point estimates and standard errors show the change in the predicted value of the relevant dependent variable when the lawyer presenting the argument is female rather than male, as the number of female justices ranges from zero to three. The estimates were produced using Stata’s truncated Poisson regression and standard errors clustered on the case. Error bars show 90% confidence intervals.

Conclusion
This research advances the literature in several important ways. First, we demonstrate a method of analyzing interrupting behavior and the lengths of speaking turns in structured discourse. This approach is potentially useful in other contexts. It could be easily adapted to investigate disparate treatment in formal debates during political campaigns or congressional hearings, for example.
We examine a question that had not been addressed on a large scale: Are female lawyers treated differently than male lawyers during oral arguments before the Supreme Court? The answer is “yes.” Female lawyers are interrupted earlier and more often, and the justices speak more often and longer during women’s presentations. These inequities have not gone away as the number of female justices has increased. We find, however, that when oral arguments focus on gender-related issues, the justices show no bias against women. In fact, female lawyers are treated more deferentially than men in these situations. This finding is consistent with research on implicit attitudes indicating that context matters, but the effect of context on implicit evaluations fades quickly (Dasgupta and Greenwald Reference Dasgupta2001; Lowery et al. Reference Lowery2001; Blair Reference Blair2002).
Perhaps our most striking finding is that women do not benefit from being on the winning side. Previous research has shown that lawyers representing the winning side are treated more deferentially, but this finding does not hold for female lawyers. In fact, female lawyers on the winning side are treated like male lawyers on the losing side. This finding provides the strongest support for our theory that justices’ implicit (unconscious) attitudes regarding gender roles affect behavior during oral arguments.
The gender bias we have uncovered probably has a small impact on the outcomes of Supreme Court cases. To the extent that oral arguments are useful for persuading justices, the unequal interruptions faced by female lawyers undermine their ability to persuade. However, this is not the most important takeaway from our findings. As we noted in the introduction, Supreme Court oral arguments present a “least-likely case” to manifest systematic gender bias. Given our findings that gender bias does occur during Supreme Court oral arguments, we must assume that such behavior is far more pervasive in workplaces across American society than previously realized (at least by some). The increased interruptions and longer speeches suffered by female lawyers at the Supreme Court are types of micro-inequities, “apparently small events, which are often ephemeral and hard to prove; events that are covert, often unintentional, frequently unrecognized by the perpetrator” (e.g., Rowe Reference Rowe1974; Reference Rowe1981; Reference Rowe1990, 153). Workplaces and organizations interested in ending this form of gender bias will have to go beyond simple training programs that focus on overt discrimination. We hope that the US Supreme Court justices will serve as a role model for others by thinking carefully and acting quickly to end the disparate treatment female lawyers experience during oral arguments.
Appendix
Summary Statistics

Truncated Poisson Regression Results Presented in Figure 1

Note.—Fixed effects for each annual term of the Court were included in the model but are not shown. AIC = Akaike information criterion. Standard errors are in parentheses.
* p < .10.
Truncated Poisson Regression Results Presented in Figure 2

Note.—Fixed effects for each annual term of the Court were included in the model but are not shown. AIC = Akaike information criterion. Standard errors are in parentheses.
* p < .05.
** p < .01.
*** p < .001.