Introduction
It is common in natural scenes for an object to be partially occluded by one or more other objects (Fig. 1). Such occlusions can provide useful depth and segmentation (figure-ground) information; for example, if the bounding contour of an object can be identified, then other contours intersecting that bounding contour are likely to be occluded and hence likely to be at a greater distance and to derive from a different physical source than the bounding contour (e.g., a different object). However, the existence of occlusions can also greatly increase the difficulty of correctly interpreting natural images; for example, an occluding object necessarily obscures image features from the occluded objects, making identification of the occluded objects difficult.
(Color online) Examples of occlusion in natural scenes.

The human visual system contains powerful contour grouping mechanisms that are thought to play an important role in helping the visual system both exploit occlusions and overcome the loss of features produced by occlusions (e.g., Rock, Reference Rock1975; Barrow & Tenenbaum, Reference Barrow, Tenenbaum, Boff, Kaufman and Thomas1986; Kellman, Reference Kellman2003). For example, contour grouping mechanisms allow us to decide (correctly) that the two contours passing under the red leaf in Fig. 1 arise from the same physical source (surface boundary). These contour grouping mechanisms undoubtedly evolved and/or develop in response to the properties of natural environments, and thus, there have been recent efforts to directly measure the statistical properties of contours in natural images, with the aim of gaining a deeper understanding of the image information available to support contour grouping and of developing more refined models of contour grouping (Geisler et al., Reference Geisler, Perry, Super and Gallogly2001; Elder & Goldberg, Reference Elder and Goldberg2002; Martin et al., Reference Martin, Fowlkes and Malik2004).
One approach has been to extract contour elements from natural images using an automatic edge detection algorithm and then examine the pair-wise statistics of the extracted contour elements. Using this approach, Sigman et al. (Reference Sigman, Cecchi, Gilbert and Magnasco2001) and Geisler et al. (Reference Geisler, Perry, Super and Gallogly2001) examined the statistics of the geometrical relationship between contour elements and found that there is a local maximum in the pair-wise probability distribution for edge elements that are approximately co-circular (i.e., are approximately tangent to a common circle, but see later). Geisler et al. (Reference Geisler, Perry, Super and Gallogly2001) also showed that there is a larger local maximum for edge elements that are approximately parallel (i.e., are approximately tangent to parallel lines). These two properties undoubtedly reflect the fact that natural contours are relatively smooth (e.g., the bounding contours of a branch or leaf in Fig. 1) and that natural images contain many parallel contours (e.g., the two sides of a branch or leaf in Fig. 1). Such measurements of pair-wise statistics can identify important statistical structure that is relevant for grouping; however, the measurements are obtained completely within the domain of images.
Potentially more relevant statistical relationships can be obtained by measuring across-domain statistics, which involves measurements both within images as well as within the corresponding environments in order to obtain ground truth information. Measurements of ground truth are essential for determining how a rational observer should use image information when interacting with, or drawing inferences about, the environment. (For more discussion of the distinction between within-domain and across-domain statistics, see Geisler, Reference Geisler2008.) Direct measurement of ground truth information can be difficult, and thus, a common shortcut is to exploit hand segmentation by human observers (Brunswik & Kamia, Reference Brunswik and Kamiya1953; Geisler et al., Reference Geisler, Perry, Super and Gallogly2001; Elder & Goldberg, Reference Elder and Goldberg2002; Martin et al., Reference Martin, Fowlkes and Malik2004). The premise of this approach is that under some circumstances, human observers can make veridical assignments of image pixels to physical sources in the environment. To the extent that this assumption holds (see later), the assignment data can provide useful ground truth information.
The present study uses the hand segmentation database for natural images reported in Geisler et al. (Reference Geisler, Perry, Super and Gallogly2001). In that study, we applied an automatic algorithm to detect local contour elements (at a small spatial scale) in a diverse collection of natural images and then had observers assign the elements to physical sources (surface/material boundary contours, shadow/shading contours, or surface marking contours). The earlier study only considered the statistics of the geometrical relationship between contour elements. In the current study, we extend the statistical analysis to include the contrast relationship between contour elements (specifically the contrast polarity). We then describe a contour grouping experiment where subjects are required to decide whether a pair of contour elements at the boundary of an occluder belongs to the same or different physical contours. We then compare human performance in this task with that of a parameter-free ideal observer that directly uses the measured natural scene statistics to perform the contour occlusion task. A preliminary report of the study described here appeared in a conference proceedings (Geisler et al., Reference Geisler, Perry, Ing, Rogowitz and Pappas2008).
Materials and methods
Natural contour statistics
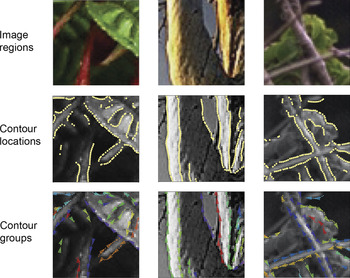
Much of the procedure for measuring contour statistics is described elsewhere (Geisler et al., Reference Geisler, Perry, Super and Gallogly2001). Briefly, we analyzed a set of natural images (480 × 480 pixels) that were picked to be as diverse as possible, without containing human-made objects or structures. The images included close-up and distant views of different environments (i.e., forests, mountains, deserts, plains, and seashore) and image constituents (e.g., water, sky, snow, plants, trees, and rocks). Small regions cut from three of the images are shown at the top of Fig. 2 (thumb nails of all the full images can be found in Geisler et al., Reference Geisler, Perry, Super and Gallogly2001, also see fig. 3a).
Edges were extracted from each image using an automatic algorithm containing the following steps: (a) convert the image to gray scale; (b) filter the gray scale image with a nonoriented log Gabor filter (in the Fourier domain) having a spatial frequency bandwidth of 1.5 octaves and a peak spatial frequency of 0.1 cycles/pixel (the frequency was picked to provide a dense sampling of contours); (c) identify the locations of zero crossings in the filtered image; (d) at each zero crossing point in the (unfiltered) gray scale image, apply a bank of odd and even log Gabor filters with a spatial frequency bandwidth of 1.5 octaves, a peak spatial frequency of 0.1 cycles/pixel, and an orientation bandwidth of 40 deg; (e) normalize the filter responses by dividing by the sum of the responses across all orientations; (f) combine the odd and even responses to obtain an energy response; (g) find the peak of the energy response across orientation to determine the local contour orientation; (h) eliminate edge elements with peak normalized energy responses that do not exceed a low threshold; (i) interpolate the even and odd responses to better localize the edge position; and (j) reapply an odd log Gabor filter at the estimated edge element orientation and position in the gray scale image to determine the contrast polarity (the sign of the contrast) of the edge element. The last two steps were not applied in the original study (Geisler et al., Reference Geisler, Perry, Super and Gallogly2001). The above edge extraction procedure was applied to synthetic test images with known contour positions, orientations, and contrast polarities and was found to be accurate for the test images.
We note that the extraction of contrast polarity information is new to the current study. We chose not to examine contrast magnitude because the images were neither luminance nor color calibrated, and thus for these images, we can only be confident about measurements of edge geometry and contrast polarity.
The colored pixels in the middle panels of Fig. 2 are examples of the locations of extracted edge elements. The arrows in the bottom panels of Fig. 2 show a small subset of the extracted edge elements. The center point of an arrow indicates the position of the edge element (corresponding to a pixel in the middle panels), and the orientation of the arrow indicates the orientation of the edge element. Reversals in arrow direction indicate flips in contrast polarity.
Contour locations and contour groups for small example patches from three different natural images. The contour locations and contrast polarities were detected by an automatic algorithm. The contour groups were obtained by hand segmentation. The direction of the arrows in the bottom images indicates the contrast polarity of the contour; the different colors represent different groups (note that because colors are randomly selected from a color palette, different groups may have a similar color).

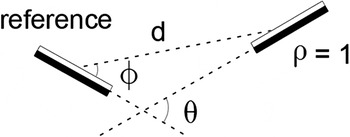
We measured both the within-domain and the across-domain statistics of edge geometry and contrast polarity. For both, we measured pair-wise statistics. Specifically, for each pairing of extracted edge elements, we considered one of them as the reference and described the geometrical and contrast relationship of the other element relative to the reference element (every edge element served as a reference element). Thus, we average over the absolute orientation of the reference element. The relationship between the elements is described by four parameters (Fig. 3): the distance between the centers of the edge elements (d), the direction of the second element from the reference element (−90° ≤ φ ≤ 90°), the orientation difference between the edge elements (−90° ≤ θ ≤ 90°), and difference between the edge elements in contrast polarity (ρ = 1, same polarity; ρ = 0, different polarity). Thus, the pair-wise statistics can be described by a four-dimensional probability density function, p(d,φ,θ,ρ). This function was estimated by binning the edge element pairs along the four dimensions (6 distances × 36 directions × 36 orientation differences × 2 contrast polarities for a total of 15,552 bins). This four-dimensional probability distribution summarizes the within-domain statistics of edge element geometry and contrast polarity. We briefly describe these statistics in the Results section, but the statistics of primary interest here are the across-domain statistics, which were obtained using the hand segmentation results.
Definition of parameters describing the geometrical and contrast relationship between a pair of contour elements.

For the across-domain statistics, we first had two observers segment the extracted edge elements into groups that belong to the same physical contour. The observers viewed the images with each extracted edge element labeled by a single colored pixel (e.g., middle panels in Fig. 2). They then selected those pixels that belong to the same contour (e.g., the yellow pixels in the middle panels). To aid them in the segmentation, they were allowed to zoom in and out, toggle to the full color image (upper panels), and toggle the colored pixels on and off. The fundamental premise here is that most of the segmentations correspond to the physical ground truth (i.e., the grouped pixels do indeed arise from a common physical source—a surface/material boundary, a shadow/shading boundary, or surface marking boundary). The observers noted that some ambiguous cases arose but that they were highly confident about most of the pixels assignments, which was supported by the high inter-observer agreement (Geisler et al., Reference Geisler, Perry, Super and Gallogly2001; also see Discussion). Given the segmentation data, it is then possible to estimate (by binning the edge element pairs) the across-domain probability distribution p(c,d,φ,θ,ρ), where c takes on two possible values: c = 1 if the edge elements belong to the same contour and c = 0 if they belong to different contours. The images and segmented contours can be found at the following Web site: http://www.cps.utexas.edu/kodakdb/.
Contour occlusion task
In the contour occlusion task, we measured subjects’ ability to identity whether a pair of edge elements passing under an occluder belongs to the same or different physical contours. On half the trials, the edge elements belonged to the same contour and on half to different contours.
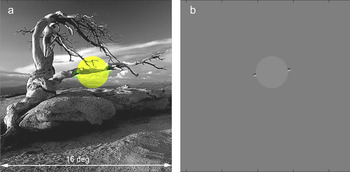
On each trial, a pair of edge elements was extracted directly from our database of natural images via the following procedure. First, an image was randomly selected, and then, a single edge element was randomly selected from that image (e.g., one of the two green-highlighted edge elements in Fig. 4a). Second, we considered the set of all edge elements at a given distance from the selected edge element, where the distance equaled the occluder diameter for that trial. On “different” trials, we randomly selected an edge element from those that belonged to a physical contour different from the contour containing the initially selected element. On “same” trials, we randomly selected from those elements (usually just one or two elements) that belonged to the same physical contour as the initial selected element (e.g., in Fig. 4a, the second green-highlighted element belongs to the same physical contour). Same and different trials occurred randomly with equal probability, and subjects were informed that the probabilities were equal. Forcing the prior probabilities to be equal is unnatural but greatly reduces the number of trials required to obtain useful data. As will be seen below, subjects had no trouble dealing with equal prior probabilities.
(Color online) Contour occlusion task stimuli. The largest occluder diameter was 90 pixels (shown here), corresponding 3 deg of visual angle.

Once the edge elements were selected, they were displayed to the subject as shown in Fig. 4b. Specifically, the 480 × 480–pixel image subtended 16 deg in visual angle with a gray background luminance of 55 cd/m2 and a gray, circular occluder of 60 cd/m2. (The video mode was set to 1280 × 960 and the image upsampled to allow better anti-aliasing of the occluder boundary.) As in Fig. 4b, the 3.0 c/deg edge elements were always located on opposite ends of a line through the center of the occluder. The size of the edge elements in the display was the same as that of the oriented filter kernels used to extract the edge elements when we measured the pair-wise statistics. The center pixel of the edge element sat on the occluder boundary. The contrast of the edge elements was set so that their locations and orientations were clearly visible (Michelson contrast = 0.6). On each trial, the display remained up until the subject responded, and the subject was free to make eye movements.
Performance was measured, in counterbalanced blocks, for occluder diameters of 20, 40, and 90 pixels (0.67, 1.33, and 3 deg). (We note that it was not possible to measure performance for occluder diameters greater that 90 pixels because there are too few contours of sufficient length in the database.) In addition, we measured performance with and without the contrast polarity information; in the blocks where the polarity information was absent, we replaced the odd symmetric edge elements with even symmetric elements.
Finally, we also manipulated feedback. For the first 600 trials of the experiment, no feedback was provided; for the second 600 trials, feedback was provided on each trial (a tone indicated whether the response was correct or incorrect); for the third block of 600 trials, no feedback was provided. We chose to manipulate feedback because of concern that our occlusion displays were so simplified (unnatural) that subjects may not be able to use the edge geometry and contrast information in the way that they would normally use that information in natural images. We reasoned that if the subjects show no improvement with feedback, then it strongly suggests that they are able to apply their normal contour processing mechanisms to our simplified displays.
Seven subjects participated in the study. Two were familiar with the aims of the study, and five were naïve. On the first day (prior to the main experiment), each subject completed 10 trials designed to help them understand the task and display. Specifically, after each stimulus presentation and response (which was the same as in the main experiment), the subjects were shown a display like the one in Fig. 4a, which illustrated exactly how the simplified display was obtained from the original image. For the remainder of the study, the subjects only saw displays like the one in Fig. 4b. The study extended over a period of 3–6 days, depending on the subject.
Ideal observer for contour occlusion task
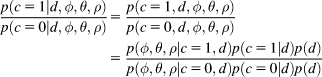
The only information available to perform the contour occlusion task is the geometrical relationship between the pair of edge elements, and in some conditions, the geometrical and contrast polarity relationship between the elements. Thus, using the measured contour statistics, we can derive the performance of a rational (ideal) observer that has perfect knowledge of the natural scene statistics of edge element geometry and contrast polarity. An ideal observer that wishes to maximize accuracy will compare the posterior probability that the observed contour elements belong to the same physical contour with the posterior probability that they belong to different physical contours and then respond “same” if the former posterior probability is the larger:

In the Appendix, we show that this decision rule is identical to this one:Footnote 1

The term on the left is a distance-dependent likelihood ratio: the probability of the observed direction, orientation and polarity relationship between the edge elements given the observed distance and that the elements belong to the same contour, divided by the probability of the same observed relationship between the elements given the observed distance and that they belong to different contours. We represent this likelihood ratio by  . The term on the right is the ratio of the prior probabilities that two edge elements separated by distance d belong to different versus the same contour. We represent this distance-dependent decision criterion by β(d). In the present contour occlusion task, we forced the prior probability of the edge elements belonging to the same contour to be 0.5, and hence, we forced the ideal criterion to be 1.0 (β(d) = 1.0). The subjects were told that the prior probabilities were 0.5 before the start of the experiment. We applied eqn. (2) to each individual trial for each subject, which allowed us to compare human and ideal observer responses on a trial-by-trial basis.
Results
This section begins with a description of the pair-wise statistics of contour elements within natural images (the within-domain statistics), followed by a description of the pair-wise statistics of contour elements referenced to the ground truth of whether the elements arise from the same or different physical sources (the across-domain statistics). Finally, we describe the results of contour occlusion experiment and compare them with the predictions of an ideal observer that has full knowledge of the measured across-domain statistics.
Natural contour statistics: Within domain
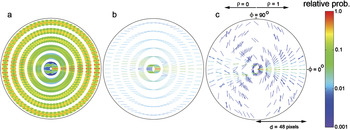
The within-domain statistics are shown in Fig. 5a, which plots the measured four-dimensional probability distribution, p(d,φ,θ,ρ), normalized to a peak of 1.0 for each distance bin. The reference element is not shown but would be a horizontal element in the center of the diagram. Each of the line segments in the plot represents one of the 15,552 bins covering the four-dimensional space (note that the line segments are so dense that they blend into solid regions.) In this figure, distance (d) from the reference is represented by the six rings, which correspond to the six distance bins. Direction (φ) is represented by the angular direction along a ring (range = ±90°; we can restrict this range to ±90° because a plot with a range of ±180°, for a given contrast polarity, is symmetric about the origin). Orientation difference (θ) is represented by the orientation of the line segment (range = ±90°) drawn at a given distance and direction. Contrast polarity (ρ) is represented by the two halves of the display, the right half for same polarity and the left for opposite (Fig. 3). As can be seen, the most common relationships between edge elements are collinear and same polarity at near distances and parallel and same polarity at larger distances. As noted in Geisler et al. (Reference Geisler, Perry, Super and Gallogly2001), the probability distribution in Fig. 5a reflects the combination of two general trends in natural images, which are revealed in Fig. 5b and 5c. Fig. 5b plots, for each distance, direction and polarity, the highest probability (most likely) orientation difference. In general, the most likely orientation difference is zero. This result undoubtedly reflects the fact that there is a great deal of parallel structure in natural images. Fig. 5c plots for each distance, orientation difference and polarity, the highest probability (most likely) direction. The most likely direction is the one consistent with approximate co-circularity (although there are systematic deviations). This result undoubtedly reflects the fact that natural contours are relatively smooth (orientations tend to change slowly along natural contours).
(Color online) Within-domain co-occurrence statistics of contour elements in natural images. (a) Four-dimensional joint probability distribution for pairs of contour elements. One element of the pair is represented by a horizontal line segment at the center of the plot (this line segment is not drawn). Each line segment that is drawn in the figure represents one of 15,552 bins covering the four-dimensional space. The ring containing the line segment represents distance; the position around the ring represents angular direction; the orientation of the line segment represents the orientation difference from the reference element; and the side of the figure where the line segment is drawn represents the relative contrast polarity (same on right, opposite on left). The probabilities in each ring have been normalized to a peak of 1.0. (b) For each distance, direction, and contrast polarity, the plotted line segment represents the most probable orientation difference. (c) For each distance, orientation difference, and contrast polarity, the plotted line segment represents the most probable direction. In b and c, the entire plot has been normalized to a peak of 1.0.

The new result here, not reported in Geisler et al. (Reference Geisler, Perry, Super and Gallogly2001), is that these trends also hold when contrast polarity reverses. It is interesting to note, however, that two displaced “fans” appear in the opposite polarity side of Fig. 5c (see also Fig. 5a). Presumably this occurs because nearby parallel contours tend to be of opposite polarity (e.g., the two sides of a branch).
Natural contour statistics: Across domain
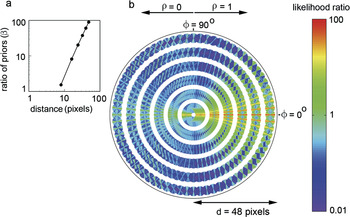
The across-domain statistics of natural contours are shown Fig. 6. In order to be consistent with the new optimal decision rule given in eqn. (2), the plotting conventions here are somewhat different from those of Geisler et al. (Reference Geisler, Perry, Super and Gallogly2001). Specifically, Fig. 6a plots the distance-dependent decision criterion (ratio of priors) β(d), and Fig. 6b plots the distance-dependent likelihood ratio  . As can be seen, for any given distance, the most likely geometrical relationship between edge elements is one consistent with approximate co-circularity. This is true whether the polarity is the same or opposite; however, the likelihoods (for approximately co-circular geometrical relationships) are lower for opposite-polarity edge elements. We note, however, that there are systematic deviations from co-circularity; the relationship between pairs of edge elements tends to be more parabolic than co-circular (see Discussion). Not surprisingly, the ratio of the priors increases approximately in proportion to (but slightly more rapidly than) the square of the distance (Fig. 6a).
Across-domain co-occurrence statistics of contour elements in natural images. (a) Ratio of the prior probabilities that a pair of contour elements belongs to different versus the same physical source, as a function of distance between the pair of elements. (b) Plot of the likelihood ratio for a given relationship between pairs of contour elements. A likelihood ratio greater then 1.0 means (given equal priors) that it is more likely that the elements belong to the same physical contour; a ratio less than 1.0 means that it is more likely that the elements belong to different physical contours. [For each distance, direction, and polarity, the orientation difference bins (line segments) are drawn in rank order starting from the lowest likelihood; thus, the highest likelihoods are the most visible in the plot.]

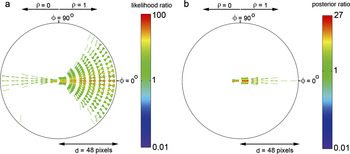
Fig. 6b can be used directly to obtain the predictions of the ideal observer in the contour occlusion task. Recall that the prior probability of two edge elements belonging to the same physical contour was forced to be 0.5, and thus, the optimal decision rule is to respond “same contour” if the likelihood ratio is greater than 1.0. Fig. 7a plots all the likelihood ratios in Fig. 6b that are greater than 1.0. Every geometrical and contrast polarity relationship represented by a line segment in this plot is one for which a rational observer would respond “same contour;” otherwise, the observer would respond “different contour.” Here one can see even more clearly that edge elements that are approximately co-circular should be linked together.
(Color online) Edge-linking decision rules. Each line segment in these diagrams represents a geometrical and contrast polarity relationship (relative to the center reference) for which a pair of edge elements is linked. (a) Decision rule for ideal observer in contour occlusion task with equal prior probabilities of edge elements belonging to the same or different contours. (b) Decision rule for ideal observer in contour occlusion task with natural prior probabilities of edge elements belonging to the same or different contours (Fig. 6a).

Interestingly, even if the contrast polarity of edge elements reverses across an occlusion, there are still conditions where the response should be “same contour.” However, the criterion for responding “same contour” is more stringent—the elements must be more nearly collinear. This result may seem counterintuitive at first but is explained by the fact that the boundary of a foreground object often crosses over background objects of different luminance, some of greater and some less of luminance than the foreground object (Field et al., Reference Field, Hayes and Hess2000).
In a contour occlusion task with completely random edge pair selection, a rational observer will take into account the distance-dependent prior probabilities. One way to describe the decision rule is to divide both sides of eqn. (2) by the distance dependent prior to obtain the distance-dependent posterior probability ratio. If this posterior probability ratio exceeds 1.0, then the elements should be linked. Fig. 7b plots all the posterior probability ratios that are greater than 1.0. We see that with natural priors, a rational observer should be much more conservative in linking edge elements, especially at larger distances.
Contour occlusion task
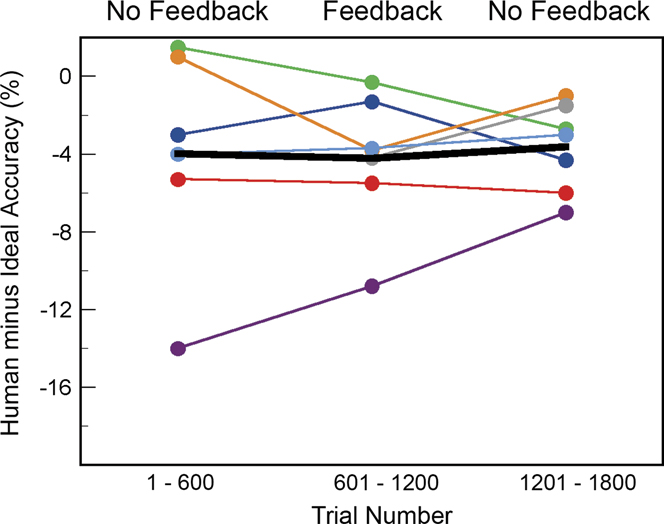
The contour occlusion task was run first without feedback, then with trial-to-trial feedback, and finally again without feedback. Feedback was manipulated because of concern that the occlusion displays were so unnatural that subjects would not be able to use the edge geometry and contrast information in the way that they would in natural images. Fig. 8 summarizes the overall performance of each of the seven subjects in the study, across the three phases of feedback. The vertical axis shows overall human accuracy minus the overall ideal observer accuracy on the same stimuli. Values less than zero indicate performance below ideal. The important point of this figure is that performance was relatively constant before, during, and after the feedback sessions, except perhaps for one subject. The black curve shows the average performance for all seven observers. We conclude that subjects started the experiment with stable decision criteria and that there is no evidence that they were using different criteria from what they would use in natural scenes (for the dimensions of edge element geometry and contrast polarity).
(Color online) Effect of practice with feedback on the overall performance of seven subjects. The solid curve is the average of the seven subjects, which is 4.0% below ideal. (Without the subject who showed strong practice effects, the average human performance is 2.8% below ideal.)
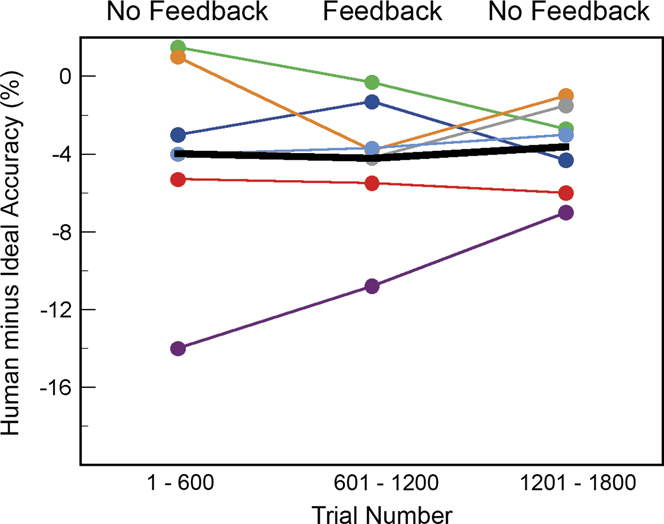
Therefore, in subsequent analyses, we combined the data across the phases of feedback.
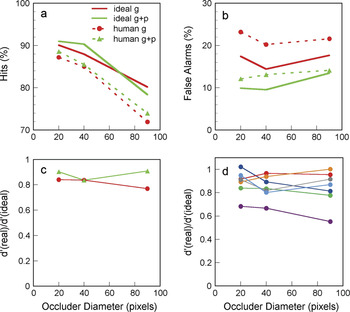
The average hits and false alarms of the human subjects and ideal observer, as a function of occluder diameter, are shown in Figs. 9a and 9b, respectively. The green symbols and curves are for the conditions where both edge element geometry and contrast polarity were displayed (g + p). The red symbols and curves are for the conditions where only the edge element geometry was displayed (g). Humans and ideal observers are affected similarly by occluder diameter and exclusion of contrast polarity information. As occluder diameter increases, hit rate declines and false alarm rate remains relatively constant. Excluding the contrast polarity information causes a slight reduction in hit rate (average of 1.3% for humans and 0.5% for ideal) but a more substantial increase in false alarm rate (average of 8.6% for humans and 5.6% for ideal). The similarity of human and ideal performance can be quantified by converting the hit and false alarm rates into d′ values for real and ideal observers and plotting their ratio. A constant ratio means constant efficiency. As shown in Fig. 9c, efficiency is high and nearly constant with occluder diameter and perhaps slightly higher when contrast polarity information is presented. Near-constant efficiency is also seen for the individual subjects (Fig. 9d). Overall, these results suggest that humans have good knowledge of the pair-wise statistics of edge element geometry and contrast polarity in natural images and are able to use that knowledge efficiently.
(Color online) Performance of seven subjects and the ideal observer in the contour occlusion experiment. (a) Average percent hits for human and ideal observers plotted separately for tasks where the contrast polarity cue was present (green) and absent (red). (b) Average percent false alarms for human and ideal observers plotted separately for contrast polarity cue present (green) and absent (red). (c) Average ratio of sensitivity (d′) of human and ideal observers plotted separately for contrast polarity cue present (green) and absent (red). (d) Ratio of sensitivity (d′) of human and ideal observers plotted separately for each of the human observers. Pixel size was 2 min of arc.

A more detailed comparison of human and ideal decision rules can be obtained by examining the individual trials. Fig. 10 plots histograms of the specific stimuli associated with hits, misses, false alarms, and correct rejections, combined across all seven subjects. Fig. 11 plots the corresponding histograms for the ideal observer (on exactly the same stimuli). The plotting convention is similar to that for the natural contour statistics (Figs. 5–7) except that there are only three rings corresponding to the three occluder diameters, and the line segments are half length, with the bases of the line segments at the centers of the direction bins.
(Color online) Distribution of specific stimuli associated with (a) hits, (b) misses, (c) false alarms, and (d) correct rejections, for the human observers. The three rings correspond to the three occluder diameters; the location around a ring corresponds to the direction from the reference element; and the orientation of the line segment corresponds to the orientation difference between the elements. The right side of the plot represents the same contrast polarity and the left the opposite polarity. The numbers in parentheses are the total numbers of trials represented in each of the plots. (Note that the line segments in this plot are half the length of those in Figs. 5–7, but otherwise the plotting conventions are the same.)

(Color online) Distribution of specific stimuli associated with (a) hits, (b) misses, (c) false alarms, and (d) correct rejections, for the ideal observer. (For more description of the plots, see legend for Fig. 10.)

The first observation is that the subjects (like the ideal observer) do not show a strong bias on average; the hits and correct rejections are about equally frequent, and the false alarms and misses are about equally frequent (see numbers in parentheses). The second observation is that humans respond very similarly to the ideal observer along the various stimulus dimensions (distance, direction, orientation difference, and contrast polarity); there are no obvious regions of stimulus space where humans are particularly inefficient. In other words, the human visual system appears to implement an accurate representation of the optimal decision rules captured in Fig. 7a.
To quantify the similarity of the human decisions to those of the ideal observer, we analyzed, for each bin in Figs. 10 and 11, the trials in which the human observers made a decision that was incorrect according to the ideal observer (i.e., according to the measured natural scene statistics). There are two types of incorrect decisions, and those were considered separately. First, for each bin, we counted the number of times the human observers judged the two contour elements as belonging to different contours, when according to the ideal observer they should have judged them as belonging to the same contour. Second, for each bin, we counted the number of times the human observers judged the two contour elements as belonging to the same contour, when according to the ideal observer they should have judged them as belonging to different contours. Finally, a Z score (the number of average standard deviations separating human and ideal decisions) was computed for each bin based on the binomial probability distribution,
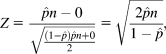
where n is the number of stimuli in the bin and  is the observed proportion of incorrect decisions. All Z scores are plotted in Fig. 12.
(Color online) Statistical comparison human and ideal decisions. Each line segment represents a geometrical and contrast polarity relationship between contour elements where humans made nonoptimal decisions (as defined by the ideal observer). The three rings correspond to the three occluder diameters; the location around a ring corresponds to the direction from the reference element; and the orientation of the line segment corresponds to the orientation difference between the elements. The right side of each plot represents the same contrast polarity and the left the opposite polarity. A Z score of 2.0 represents a significant difference between human and ideal observers at the 0.05 level (uncorrected for multiple statistical tests).

Fig. 12 confirms the impression obtained by comparing Figs. 10 and 11; namely, there are no obvious regions of stimulus space where humans are particularly inefficient. If one assumes that a significant difference between human and ideal decision criteria corresponds to two standard deviations (a Z score of 2.0), then Fig. 12 also shows that there are very few significant differences, and the few that are significant may be due to chance since there was no correction for the multiple statistical tests.
Discussion
Partial occlusion of one object by another is a frequent event in all natural scenes, and thus, many natural tasks involve interpolation of partially occluded contours. The present study considered a simple task, from this family of natural tasks, where the observer is required to decide whether or not a pair of contour segments passing under an occluding surface belongs to the same or different contours. There are a number of sources of information that a visual system might exploit in performing this contour occlusion task, including geometry, luminance contrast, chromatic contrast, motion parallax, and binocular disparity relationships between contour segments. Because the contour occlusion task is ubiquitous and is a critical component of natural image interpretation, it seems certain that the human visual system exploits all these sources of information. However, it is not practical to consider all of them simultaneously, and thus, the present study focused on the geometric and luminance contrast relationships between contour segments.
The specific aims of the study were fourfold: (a) measure some of the natural scene statistics relevant to performing the contour occlusion task (i.e., the pair-wise statistics of contour geometry and luminance contrast polarity); (b) derive the Bayesian decision rule that optimally uses those specific natural scene statistics to perform the task; (c) measure human performance in the natural task, where only those stimulus dimensions for which the statistics were measured are presented to the human subjects; and (d) compare the details of human performance with those of the ideal observer.
The measurements of the natural scene statistics were systematic and extended the results reported in Geisler et al. (Reference Geisler, Perry, Super and Gallogly2001). One new finding was that if contrast polarity reverses, there is a substantially increased probability that the contour elements do not belong to the same physical contour (Fig. 6b); nonetheless, if the contour elements are nearby and if they are nearly co-linear, then it is still more likely that they do belong to the same contour (Fig. 7). Another new finding was that the prior probability of a pair of contour elements belonging to different contours increases approximately in proportion to square of the distance (Fig 6a).
The derivation of the ideal observer’s decision rule was straightforward, but in doing so for the contour occlusion task, we were led to a slightly improved formulation (eqn. 2) over that reported in Geisler et al. (Reference Geisler, Perry, Super and Gallogly2001). The advantage of the new formulation is that it explicitly includes the distance-dependent prior probability and likelihood of contour elements belonging to the same physical contour.
To directly compare human and ideal observer performance (without free parameters), we devised a simple contour completion task where the stimuli were extracted directly from natural images and where the only information available to the subjects was the geometry and contrast polarity of the two contour elements at the boundary of the occluder (Fig. 4). We found that two experienced and five naïve subjects performed uniformly well in this task, with or without feedback and with little practice (82% correct across all subjects and conditions). This is surprisingly good performance given all the other sources of information in natural scenes that were not made available to the subjects. The performance of the ideal observer paralleled and slightly exceeded that of the human subjects, confirming that the geometry and contrast polarity of contour elements at the boundary of an occluder provide important information for dealing with occlusions in natural scenes. Detailed comparison of the decisions made by the humans and ideal observer revealed a remarkable consistency—there were no regions of the geometry and contrast polarity space where humans were consistently more or less efficient. Thus, we conclude that humans use contour geometry and contrast polarity information with high precision when interpreting natural scenes.
The statistics and ideal observer analysis of contrast polarity reported here complement the results of Elder and Goldberg (Reference Elder and Goldberg2002). They measured and analyzed contrast magnitude (averaged over contrast polarity) and showed that it provides a modestly useful cue for contour grouping. They conclude that contrast cues are much less useful than geometrical cues. However, they did not consider contrast polarity, which we find to be a quite useful cue. Presumably, contrast is even more useful when the two cues (magnitude and polarity) are combined.
The edge element statistics for natural contours described here are relevant for real contour occlusion tasks in the natural environment, but obviously they do not capture all the statistical information potentially available to the human visual system, including color, texture, disparity, motion parallax, and curvature information. Hopefully these other sources of information will be measured in the future. Nonetheless, it is surprising how well humans and ideal observers can perform with only edge element geometry and contrast polarity.
Another potential limitation of the current study is that we did not directly examine occlusions in natural images but inferred the statistics from all the contours in the natural images. This is unlikely to be a serious limitation. First, there is probably nothing special about those pieces of contour in a natural scene that are occluded or intersect an occluding surface, because what is occluded or intersects an occluding surface depends on the position of the observer (which is always changing). Second, most physical contours will sometimes be part of the background and sometimes part of an occluding surface, again because humans (or objects) move around.
Using hand labeling to measure across domain statistics
To determine separately the statistics of image contour elements from the same physical contour and from different physical contours, it is necessary to know which image contour elements do, in fact, arise from the same physical contour. To obtain this ground truth information, we used the hand segmentations by two humans who were shown the (objectively detected) contour element locations overlaid on the underlying full color image. The assumption is that when given full image information, humans are able to make veridical assignments of contour elements to physical sources (contours). Because of ambiguity in natural images (especially in dense contour regions), there are undoubtedly some labeling errors. However, several factors suggest that the error rate is relatively low. First, most of the segmentations were made with high confidence. Presumably, this high confidence is based on an adult’s enormous experience interacting with the environment. For example, the reader might visually inspect her/his local environment (with one eye closed and no head movement), select possible physical contour sources, and then physically check those source assignments for accuracy (e.g., touch, move, or closely inspect objects to verify that the source is a unique shadow, surface boundary, or surface reflectance contour). The reader will find that very few, if any, mistakes are made, in agreement with the reader's high self-confidence. Second, there was a high level of agreement between the segmentations made by the two humans (Geisler et al., Reference Geisler, Perry, Super and Gallogly2001). If the percentage of labeling errors is modest, then they should have little effect on the average statistics. Third, the objective within-domain statistics in Fig. 5c, which most likely reflect the shapes of natural contours, are reasonably consistent with the across-domain statistics of contours in Fig. 6b (also see next section).
Measurements of the ground truth correspondence between image properties and physical environmental properties are critical for understanding the natural scene statistics relevant for the specific natural tasks that an organism normally performs. Although hand labeling methods are practical in some situations, it is also important to exploit more direct physical measurement such as combining range images with calibrated color images in order to, for example, align ground truth depth discontinuities with image contours (see Geisler, Reference Geisler2008, for more discussion).
Contour grouping across occlusions
The hypothesis that contour grouping involves some form of smoothness constraint was first proposed by the Gestalt psychologists as the principle of “good continuation” (Wertheimer, Reference Wertheimer, Beardslee and Wertheimer1958) and has been the basis for many models of human performance (e.g., Kellman & Shipley, Reference Kellman and Shipley1991; Field et al., Reference Field, Hayes and Hess1993; Feldman, Reference Feldman2001; Neumann, & Mingolla, Reference Neumann, Mingolla, Shipley and Kellman2001) and for many computational vision algorithms (e.g., Grossberg & Mingolla, Reference Grossberg and Mingolla1985; Sha'ashua & Ullman, Reference Sha'ashua and Ullman1988; Parent & Zucker, Reference Parent and Zucker1989). Our results suggest that the specific smoothness constraint that humans use is based directly on the average statistical properties of contours in natural images. Although this constraint is qualitatively similar to many earlier proposals, it is quantitatively different. For example, a simple assumption is that human contour interpolation favors co-circular (including collinear) relationships between edge elements (Sigman et al., Reference Sigman, Cecchi, Gilbert and Magnasco2001). However, both the natural scene statistics and the decisions of our human observers differ substantially from a preference for co-circular relationships. To see this, consider edge elements at a distance d and direction φ from the reference element in Fig. 6b. If the most likely element orientation difference θ were co-circular with the reference element, then the highest-likelihood orientation difference would be 2φ, independent of the distance d. The solid horizontal lines in Fig. 13 plot this predicted relationship for different directions from the reference element. The symbols show the actual highest likelihood values from Fig. 6b (excluding likelihoods less than 1.0). Except for a direction of zero, where the orientation difference is consistent with a collinear relationship, the highest-likelihood orientation differences are less than those predicted by a co-circular relationship.
(Color online) Orientation difference as a function of the distance and direction of one edge element from another. The symbols show the most likely orientation differences for edge elements of natural contours (from the upper quadrant of Fig. 6b; see also Fig. 7a). The solid horizontal lines show the predictions if the most likely relationship were co-circular. The horizontal dashed line shows the predictions if the most likely relationship were parabolic.

Another hypothesis for contour grouping (and interpolation) is based on the definition of “relatable” contours: Two edge elements are relatable if their linear extensions (toward each other) intersect and if the outer angle of their intersection is acute (Shipley & Kellman, Reference Kellman and Shipley1991; Kellman, Reference Kellman2003). The range of relatable orientation differences decreases as a function of direction so that for a direction near 0 deg, the range of relatable orientation differences is 0–90 deg and for a direction of 50 deg, the range of relatable orientation differences is 50–90 deg (see Supplementary Fig. 1). Our measurements of natural contours show that many natural contours are not relatable and that many relatable contours are unlikely to occur in natural scenes (Fig. 7a). Our measurements of (naïve) human performance in the natural contour occlusion task show that human decisions closely match the natural scene statistics; thus, humans do not perceptually link many edge element pairs that are relatable, and they do perceptually link many contour element pairs that are not relatable.
Interestingly, the statistics of natural contours are roughly consistent with a parabolic relationship. If the most likely element orientation difference θ has a parabolic relationship to the reference element (with the origin of the parabola tangent to the reference element), then the highest-likelihood orientation difference would be tan−1(2tan φ), independent of the distance d. The horizontal dashed lines in Fig. 13 show the predictions of a parabolic relationship. However, it is important to keep in mind that this only summarizes the highest-likelihood orientation difference in each distance and direction bin, whereas human performance in our task depends on the entire likelihood distribution.
The approximately parabolic relationship between edge elements in natural images also holds for the within-domain statistics in Fig. 5c (which also undoubtedly reflect the shape properties of contours). This finding supports the validity of the hand segmentation method used to obtain the across-domain statistics.
Singh and Fulvio (Reference Singh and Fulvio2005, Reference Singh and Fulvio2007) had observers extrapolate smooth contours across half-disk occlusion regions. They varied the disk diameter and inducing contour shape. Observers set the direction and orientation of the test edge element to smoothly extrapolate the inducing contour. They found that observers extrapolate contours with a bias toward decreasing curvature with increasing distance, a bias more consistent with parabolic than circular contours. Their result is therefore qualitatively consistent with our natural scene statistics and with our observer’s performance in the natural contour occlusion task.
The finding of an approximately parabolic statistical relationship between the edge elements of natural contours implies that natural contours tend not to be circular in shape, but the finding does not imply that contours tend to be parabolic in shape. Recall that all elements on a contour serve as the reference (not just the elements at points of the highest curvature) and that both edge elements in each pair-wise comparison serve as the reference element. If natural contours tend to be circular in shape, then no matter which elements serve as the reference, one would expect a co-circular relationship rather than the parabolic relationship in Figs. 5c and 6b. On the other hand, the observed parabolic relationship is not related to any particular simple underlying shape. Rather, it is a purely statistical result that undoubtedly depends on the fact that most natural contours contain random changes in curvature, including changes in the sign of the curvature (i.e., inflection points). Thus, no matter where one starts on a contour, if a contour element at some distance from the starting element happens to end up in a different direction from the direction pointed to by the orientation of the starting element, then its orientation (because of the distribution of random changes in curvature) ends up on average in a parabolic relationship with the starting element. Our psychophysical results suggest that humans use knowledge of this parabolic relationship (and the appropriate range around it) to decide whether or not to link contours passing under an occluding surface. We also note that even though humans may know that most natural contours tend to randomly change in curvature and to have one or more inflection points, they probably choose to make smooth monotonic interpolations (when forced to do so) because they generally have no information that would allow them to select specific points behind the occluding surface for an inflection or rapid change in curvature. Of course, in cases with convincing information (e.g., a very wiggly contour exiting both sides of the occluding surface), they would probably make less smooth nonmonotonic interpolations.
Contour integration
Another useful task for investigating the mechanisms of contour grouping over extended distances is the contour integration task (Beck et al., Reference Beck, Rosenfeld and Ivry1989; Field et al., Reference Field, Hayes and Hess1993; Kovacs & Julesz, Reference Kovacs and Julesz1993). In this task, the signal-plus-noise stimulus consists of an extended contour defined by discrete contour elements embedded in a background of random contour elements; the noise stimulus consists of only random contour elements. The subject’s task is to detect the embedded contour. Much has been learned about the mechanisms of contour grouping by manipulating specific properties of the embedded contour elements relative to those of the background elements. The contour integration task is very useful because when the stimuli are properly designed, the embedded contour can be only detected if the visual system contains mechanisms that group contour elements using the specific properties of interest. Our measured natural contour statistics are potentially relevant to a number of studies using the contour integration task, but we mention just two here.
In our earlier study, we measured detection performance for line segment contours embedded in line segment backgrounds (Geisler et al., Reference Geisler, Perry, Super and Gallogly2001; see also Tversky et al., Reference Tversky, Geisler and Perry2004). Parametric data were obtained for a number of embedded contour properties: contour length, contour shape, and contour element orientation jitter (orientation noise). Based on a somewhat different characterization of the across-domain contour statistics described here, we proposed a single-parameter model of performance in the contour integration task. That model did not take into account the contrast polarity dimension and used a less well-defined version of the ideal decision rule for pair-wise contour element grouping (compare the current eqn. (2) with eqns. (1) and (2) in Geisler et al., Reference Geisler, Perry, Super and Gallogly2001). We have generated predictions for the earlier contour integration task, using the characterization of the contour statistics in Fig. 6 and the current eqn. (2). Specifically, the model assumes that the observer first links together all line segments in the display that satisfy eqn. (2), then forms larger groups by transitive grouping (i.e., finds those groups of line segments that are linked to each other either directly or through unbroken links to other elements), and finally selects the stimulus interval containing the longest group (for more details, see Geisler et al., Reference Geisler, Perry, Super and Gallogly2001). The version of this model observer that uses both the likelihoods and the distant-dependent decision criterion (Fig. 7b) performs poorly in the contour integration task, much poorer than the human observers. However, the version of this model that uses a fixed decision criterion of 1.0 (Fig. 7a) performs well in the contour integration task, and its performance correlates well with human observer performance (r = 0.88).
This is a surprising result because in the contour integration task, the prior probability of a pair of contour elements belonging to the same contour falls rapidly with distance (as in natural scenes). Apparently, ignoring the pair-wise priors that would be appropriate for a simple contour occlusion task (with natural priors) yields an effective heuristic for grouping extended contours. It is important to note, however, that the true ideal observer for the contour integration task is unknown, and thus, it is also unknown how close our model observer approaches ideal performance. Also, in exploring the class of contour integration models that have a fixed decision criterion over distance, we discovered that it is possible to maintain nearly equivalent good performance by trading off the radius over which the initial pair-wise edge linking occurs with the value of the fixed decision criterion—the larger the radius, the larger the value of the decision criterion.
Field et al. (Reference Field, Hayes and Hess2000) conducted contour integration experiments where the phase (contrast polarity) of the contour elements was either maintained or alternated along the embedded contour. They found that contour detection performance was substantially reduced when contrast polarity was alternated. Our measurements of natural contour statistics show that when contrast polarity reverses, a rational observer should apply a more stringent criterion for integrating the contour elements. Although we have not derived specific predictions for the Field et al. stimuli, we have shown that applying a more stringent criterion (the left half of Fig. 7a) produces a substantial drop in contour integration performance. Thus, their findings are at least qualitatively consistent with the hypothesis that humans are basing their decisions on the average statistical properties of natural contours.
Natural systems analysis
The study described in this article is representative of a new approach to perceptual neuroscience that has been emerging in recent years. This approach, which might be termed “natural systems analysis,” consists of several components. The first is to identify and characterize a natural task or natural subtask that is performed by the organism under natural conditions. In our case, this is the contour occlusion task (Fig. 1). The second component is to measure and analyze those specific environmental properties (natural scene statistics) relevant for performing the task. Usually, these would be across-domain statistics such as the pair-wise contour statistics described in Fig. 6. The third component is a computational analysis to determine how a rational (ideal) perceptual system would exploit the measured environmental properties to perform the natural task. This component is critical because it provides insight into the information contained in the natural stimuli and it can suggest principled hypotheses for the neural mechanisms the organism might use to exploit that information. The fourth component is to formulate specific hypotheses for neural mechanisms (based on the first three components) and test them in physiological and/or behavioral studies that capture the essence of the natural task. In our case, the hypotheses were based on the optimal grouping rules derived from the natural scene statistics (Fig. 7a), and the behavioral studies used a simplified contour occlusion task where the stimuli were constructed directly from natural images (Fig. 4). The study described here is unusual in that it involves all four components of a natural systems analysis, but that is not particularly important. What is important is the growing realization among perception researchers that the perceptual systems must reflect the tasks the organism performs and the statistical properties of the stimuli it uses to perform those tasks. Studies that take this realization to heart are more likely to produce significant advances in behavioral and systems neuroscience.