Predictions of the United States presidential election vote outcome have been growing in scope and popularity in the academic realm. Traditional election forecasting models predict the United States presidential popular vote outcome on a national level based primarily on economic indicators (e.g., real income growth, unemployment), public approval ratings, and incumbency advantage. Many of these forecasting models are rooted in retrospective voting theory (Downs Reference Downs1957; Fiorina Reference Fiorina1981), essentially rewarding the party in office if times are good, punishing it if times are bad. These models have successfully predicted election results by modeling economic performance and incumbent approval ratings (Campbell Reference Campbell2012; Fair Reference Fair1992; Fair Reference Fair1996; Klarner Reference Klarner2012). For example, Abramowitz's (Reference Abramowitz2004; Reference Abramowitz2005) “time for a change model” predicts election results using economic performance during the first half of the election year, the number of years the incumbent party has been in office, and presidential approval. For a full review of 13 presidential forecasts for the US 2012 election, see PS: Political Science and Politics October 2012 (45 (4): 610–75). Although national models are the most common, researchers have also started to use state-level predictions for presidential and congressional outcomes, with mostly positive success (Berry and Bickers Reference Berry and Bickers2012; Jerome and Jerome-Speziari Reference Jerome and Jerome-Speziari2012; Klarner Reference Klarner2012; Silver Reference Silver2012). These models use similar predictors, such as incumbency, economic conditions, and home-state advantage, and predict the per-candidate percentage of popular vote. Unfortunately, with state-level models, many of the economic variables used in predicting national models are unavailable beyond 10–15 election cycles (compounded also by 1959 additions of Alaska and Hawaii), so state-level models naturally have a shorter period of analysis than do national models.
Both national and state-level models can be accurate (with R-squares of .90 and above), however, some models use data collected close to, or after, the November election date, such as the latest Gallup (Newport Reference Newport2010) poll data and changes in quarterly gross domestic product (GDP), the latter of which is frequently released after the election. Instead, the authors in the October 2012 issue of PS: Political Science and Politics forecast their models at least two months in advance: of the 13 models, the mean forecast day was 108 days prior to the election, with a median forecast date of 99 days prior to the November election. In similar fashion, the model presented in this article also forecasts the 2012 election with data acquired by July 31, 2012, 97 days in advance of Election Day.
This research builds on past results (Granka Reference Granka2010a) by using two types of search query volume to supplement a baseline model of state-level election outcomes. The search queries include (a) the Democrat and Republican presidential candidates, and (b) searches of two partisan issues—taxes and abortion. We use search query volume to draw comparisons about candidate popularity and issue salience within each state. In this article, we hypothesize that a state's presidential vote can be approximated through assessing whether the volume of searches for a candidate or issue in a given state is significantly higher (or lower) than what we might expect from the national average.
ONLINE SEARCH TRAFFIC
Online search queries represent a variety of needs and desires. Most search queries are still interpreted within a loose context of Broder's 2002 classification, which identified search queries as being one of (a) navigational, (b) informational, or (c) transactional. Specifically, navigational queries are search terms that are aimed to take a user directly to a website (e.g., a search for google.com or amazon.com); informational queries are those that seek to resolve a question or basic information need (e.g., how long is the flight from New York to London); and finally, transactional queries involve a purchase or transaction. Clearly these three query types are not a fully discrete classification as queries can easily straddle the lines between the two (Jansen and Booth Reference Jansen and Booth2010; Rose and Levinson Reference Rose and Levinson2004), and the proportion of each query type has changed over time (Church and Smyth Reference Church and Smyth2008). That said, recent analyses still estimate that informational searches account for at least half of all online search traffic (Jansen and Booth Reference Jansen and Booth2010). This majority is important for the present analysis, as we are interested in the cases when individuals actively seek out information about candidates and issues in the run-up to the presidential election; informational queries fill that space.
Advantages of Using Search Traffic as Data
Aggregate search queries are now freely available for download (such as on Google Trends) and have been proven to be predictive of flu outbreaks (Ginsberg et al. Reference Ginsberg, Mohebbi, Patel, Brammer, Smolinski and Brilliant2009), consumer behavior (Choi and Varian Reference Choi and Varian2009, Goel et al. Reference Goel, Hofman, Lahaie, Pennock and Watts2010), and correlated with media coverage (Granka Reference Granka2009; Granka Reference Granka2010b; Mellon Reference Mellon2011; Ripberger Reference Ripberger2011; Weeks and Southwell Reference Weeks and Southwell2010). These models have been largely successful in predicting the correlation between online search traffic and salient current events, which suggests that search query volume might also have a reciprocal relationship to the public's interest in presidential candidates and elections.
Search queries are one measure of what topics, people, and issues the public cares about and frequently fluctuate with the volume of news coverage for a given topic (Granka Reference Granka2010b Weber, Garimella, and Borra Reference Weber, Garimella and Borra2012; Weeks and Southwell Reference Weeks and Southwell2010). For example, a celebrity is likely to have a consistently high volume of search traffic year-round, but the search intent and search frequency may fluctuate based on external factors, like news coverage. There may be a relatively constant stream of search queries for the musical artist Bruce Springsteen, largely comprised of people looking for his music, or desiring to learn more about him. However, when Bruce Springsteen does something that is featured in the news cycle, or when he goes on tour, the nature of queries may change or increase to reflect the public's desire to learn more about the specific news issue or upcoming tour dates. Analogously, we might also expect a relatively higher volume of searches in New Jersey—Bruce Springsteen's home state—due to a heightened base interest in Springsteen.
In sum, an online search is an active form of information acquisition, and it presumes the searcher has some degree of prior knowledge and motivation. The political sphere provides a natural application to analyze search queries, as candidate and issue awareness is a prerequisite to conduct a search, and hopefully also to the voting booth.
Using online search traffic to better understand political attitudes is also a methodological opportunity. The most common method of assessing users' political preferences and ideologies is rooted in is self-reported behavioral assessments, that is, surveys. Although certainly useful, self-report methods do little to capitalize on the structural and sampling advantages of digital media. Online digital media gives researchers a naturally robust platform on which to track actual user behaviors, both in the points of access, sites visited, and the content that gets read, shared, or searched. Using online search query traffic (what people are searching for online) may reduce the biases inherent to traditional measures of estimating presidential approval and popularity by supplementing (or replacing) self-report data with actual logged online user behaviors.
Concerns about Using Online Search Traffic as Data
One objection to using search queries as a unit of measurement in the social sciences stems from the ambiguity inherent to a given search term (see Grimes, Tang, and Russell (Reference Grimes, Tang and Russell2007) for a discussion). For example, the query term “economy” can represent a number of topics, including related to cars (fuel economy), the national economy, or even school subjects about economics. Although certainly an issue, this article manages to alleviate many of these concerns by comparing relative query volume between all states. We assume that for the terms selected, nonelection intents (e.g., the “noise”) will be evenly distributed across all states such that the relative differences will stand out and be most salient to analyses. For reference, the most common searches containing the issue and candidate names are presented in appendix A. From these national averages it is evident that a majority, but not all, of the top 10 searches for each term, in fact, do match the desired intent and are generally applicable to the presidential election.
Another critique of using aggregate search query data is that the relevant demographics of the searchers, such as political ideology, age, gender, or consumer behavior, are relatively unknown. Borra and Weber (Reference Borra and Weber2012) have come closest to systematically assessing the partisanship inherent to searches (see also Weber, Garimella, and Borra Reference Weber, Garimella and Borra2012), and created a tool, Yahoo! Political Search Trends, which estimates the latent ideology of a search term based on how often queries containing that term lead to clicks on partisan political blogs. Their analysis showed that many political search terms (e.g., “Obama” “abortion,” “health care”) are associated with both right- and left-leaning informational intents. A candidate query could signify an interest in viewing a video of a politician's gaff or a genuine interest in the candidate's campaign schedule; in other words, not all queries for a given candidate represent unequivocal support.
A final objection to using search query data is the tenuous relationship to subsequent behavior. It has been assumed that the individuals searching online for a given topic are more interested and engaged in the subject matter, and thus more likely to participate and affect the outcome (whether it be voting in an election, viewing a movie, or making a car purchase). Analysis by Choi and Varian (Reference Choi and Varian2009) supports this assumption by analyzing the relationship between search and behavior in the travel, retail, auto, and home sales domains. In this article, we similarly hypothesize that a higher volume of candidate searches will be indicative of voting outcomes: when it comes to the act of voting, we test the assumption that positive queries outweigh the negative.
METHODS
Search volume data was collected online via Google Trends, from July 1 through October 31 for 2004, 2008, and 2012. Data was collected individually for all 50 states (and the District of Columbia), as well as for the national average. Because absolute search volume is less useful when compared against populations of varying sizes (i.e., states with smaller populations have lower levels of total search volume), the data on Google Trends are normalized within the prescribed time period. The data are scaled so that the date with the largest volume of search traffic is allotted a score of 100; the volumes on all remaining dates are calculated as a proportion of this figure. (For more details, see http://support.google.com/trends/?hl=en-US.)
A note on Google Trends data: For periods of three months or less, given enough search query volume, Google Trends will output the query volume on a daily basis. To maintain user privacy, Google does not disclose query details if the total search volume in a selected geography does not meet a sufficient threshold. During the three-month periods of either July through September, or August through October, some states did not meet this threshold, and did not have enough search traffic to output daily query volume. To compensate, a four-month period (with weekly averages) was chosen to ensure that the query volume of all states had the same unit of time and measurement. Daily volume is most effective at assessing how query volume fluctuates with breaking news and events, but to assess relative state-level interest, weekly volume is sufficient.
Presidential Candidate Queries
Candidate queries were downloaded in Republican and Democrat pairs for the 2004, 2008, and 2012 elections, resulting in 53 query measurements (50 states, District of Columbia, and the United States national average) in each election year. Due to this data structure, a natural comparison exists between the competing candidates in each year (2004: Kerry and Bush; 2008: Obama and McCain; 2012: Obama and Romney).
Issue Queries
As discussed earlier, abortion and taxes were selected as two political issue queries to track between states. Taxes was selected because nearly all election forecasting models include some measure of the economy (whether it be unemployment figures, GDP, the stock market) to predict vote outcomes. Taxes represent one measure of the economy that has perhaps the strongest perceptible effect on voter's wallets. Abortion was selected because it has consistently been a polarizing issue in politics, and relative search query volume could indicate how salient the issue is for residents of each state.
Finally, even with the extension of a four-month period, 14 states in 2004 did not have enough query volume for the terms taxes and abortion: Alaska, Arkansas, Delaware, Hawaii, Maine, Montana, Nebraska, New Mexico, North Dakota, Rhode Island, South Dakota, Vermont, West Virginia, and Wyoming (note that these are states with smaller populations). As described in the methods section, interaction terms were applied to the regression to account for the disparity in query volume for some states, accounting for the overall population size, proportion of college-educated residents, and the percentage of each state with household computer access.
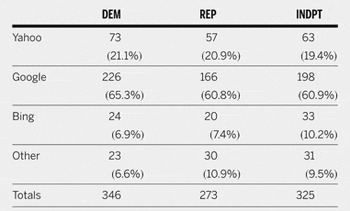
To assess whether the ideologies and characteristics are randomly distributed across search engines, a survey of a sample of 1,000 registered voters throughout the United States was conducted in April 2010, asking about search-engine use and political engagement. This study was run through YouGov, and was part of a larger study assessing media and political preferences (see Granka Reference Granka2011). Results indicate no significant difference exists between partisans and search-engine choice, nor between state lines. Table 1 shows the fairly consistent partisan ideology across search engines.
Political Characteristics of Online Searchers

N = 944
Several permutations of query volume were calculated for both the presidential candidates and the issues at both weekly (n = 16 weeks) and monthly (n = 4) levels. To create a model that predicts the election sufficiently in advance, we focus exclusively on data in the months of July. Due to natural imbalances in popularity among the query terms in candidates, the data was not directly analyzed in the raw format outputted by Google Trends. The calculations used in the model are listed as follows:
1. Within-state ratios of query volume, between candidates. Specifically:
a) Republican Candidate/Democratic Candidate
This transformation facilitates between-state comparisons (e.g., which states have a higher Republican to Democratic search ratio) and can help determine whether candidate- and issue-fluctuations are greater or less than other states. Clearly, the ratio is greater than one if there are more searches for the Republican candidate, one if they are equal, less than one if the Democratic searches are greater.
H1: States with a greater ratio of Republican to Democratic searches will be more likely to vote Republican.
2. Ratio of State and National differences for each candidate and issue.
This transformation also puts into perspective each state's query volume; in this case, by comparing a given state to the national average. Again, for ratios greater than one, the state has more query volume for the given candidate or issue than the national average, possibly indicating greater attention or interest. The specific calculations were:
c) Republican Candidate: State volume/National volume
d) Democratic Candidate: State volume/National volume
e) Taxes: State volume/National volume
f) Abortion: State volume/National volume
H2: States with a greater candidate ratio than national average will be more likely to vote in the direction of that candidate.
H2a: States with a greater issue ratio than national average will be more likely to vote in the direction of the issue (more searches for [Taxes] will lean Republic, and more searches for [abortion] will lean Democrat).
We also expect the state/national search ratio may be affected by the percentage of households within each state with home-computer access. Specifically, states with a higher population of home-computer users may naturally produce a greater ratio.
H3: States with a higher proportion of home-computer use will have a greater candidate and issue ratios than national average.
BASELINE MODELS
Note that the models reported herein have a much smaller sample than typical state-level forecasting models (two years versus 10–15) because of the limited amount of search data available. Specifically Google Trends only dates query volume back to 2004, so we can use only the 2004 and 2008 elections to predict outcomes in 2012. Clearly, this is not optimal, and future work should evaluate how these basic metrics perform and change over time as the available dataset increases. Given this challenge, we do not have enough variability to predict the incumbent vote (which is what most forecasting models choose as the dependent variable), and instead predict 2012 popular vote in the form of a Republican/Democratic ratio, based on the lagged-presidential election year Republican/Democrat popular vote ratio, where ratios greater than one indicate a win for the Republican candidate. A proportional dependent variable was deemed suitable because the search independent variables are comparably structured as state/national or within-state ratios of query volume.
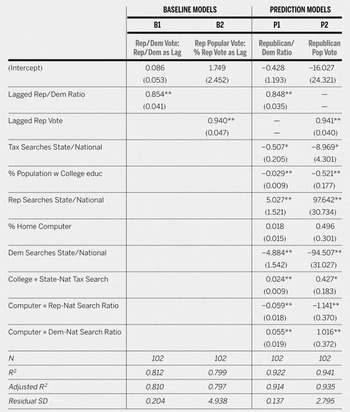
Although the ratio of Republican to Democratic vote can easily identify a winner in each state, it does not directly provide the measure that people are most interested in—the percentage of popular vote going to either candidate. Therefore, we create a second baseline, predicting the percentage of 2012 Republican popular vote in each state based on the lagged percentage of Republican popular vote. These lagged-vote trends alone account for approximately 85% of the variance in predicting the state-level popular vote (table 2), and incorrectly predict only four states (Indiana, Montana, Missouri, and North Carolina).
Regression Results—Predicting 2012 Popular Vote Based on 2004 and 2008 Elections

All coefficients are obtained at the state level
All search query data is represents the July prior to election
Standard errors are reported in parentheses
* p < 0.05;
** p < 0.001
Baseline models:
a) VOTE R/D = LAGVOTE R/D
b) VOTE R = LAGVOTE R
Where “lagged” is the previous election year, in this case 2002, 2004, or 2008.
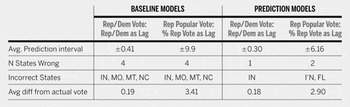
Because these baseline metrics alone account for so much of the variance, the goal for incorporating search queries is to not simply increase the R 2 and number of states accurately predicted, but also to decrease the width of the prediction interval, which is nearly ±10 points using the lagged popular vote and .41 using the Rep/Dem vote ratio (see table 3).
Model Accuracy— Predicting 2012 Popular Vote Based on 2004 and 2008 Elections

RESULTS
The final models used search metrics from only the month of July prior to the election. Models including unemployment data (specifically, state-national differences in the June unemployment rate) (Bureau of Labor Statistics 2012), abortion searches, and the within-state candidate ratios were not significant when included with the other variables, and were omitted from the final models. The final models extended on both baselines and contained the following ten terms:
a) VOTE R/D = LAGVOTE R/D + REP[St/Nat] + DEM[St/Nat] + TAX[St/Nat] + COLLEGE + COMP + TAX[St/Nat] * COLLEGE + REP[St/Nat] * COMP + DEM[St/Nat] * COMP
b) VOTE R = LAGVOTE R + REP[St/Nat] + DEM[St/Nat] + TAX[St/Nat] + COLLEGE + COMP + TAX[St/Nat] * COLLEGE + REP[St/Nat] * COMP + DEM[St/Nat] * COMP
Where LAGVOTE is again the previous election cycle (2002, 2004, or 2008), REP and DEM represent the State/National ratio of queries for the candidates, COLLEGE indicates the proportion of individuals in a given state with a bachelor's degree or higher, and COMP represents the proportion of households in a state with home computer access.
The resulting search query prediction models (see tables 2 and 3) improved the R 2 by 11% for the Republican/Democratic ratio and 14% for the Republican lagged-vote baseline. The new models also decreased the prediction intervals by 26 and 37 percentage points respectively, and increased the number of states correctly predicted, with only one error in the Rep/Dem ratio model (Indiana) and two errors in the lagged-vote model (Indiana and Florida). Results are shown in tables 2 and table 3.
State-National Differences in Candidate Searches
With the exception of lagged-vote trends, the most significant factors predicting state-level popular vote were the query differences between each state and the national average. These differences played out according to hypotheses: states with a higher proportion of Republican searches than the national average were significantly more likely to support the Republican nominee; states with a higher proportion of searches for the Democratic nominee were significantly more likely to support the Democratic nominee. This relationship is also clear when looking at the directionality of coefficients in table 2: a larger volume of searches for the Republican candidate are positively associated with a Republican vote outcome; a larger volume of searches for the Democratic candidate have a significant negative association on Republican vote outcome.
These results support our initial hypothesis: more searches for a candidate seem indicative of subsequent behavioral support. In the instances reported here, higher searches for a candidate corresponded to a higher likelihood of an Election Day vote.
Home-Computer Access
The candidate search variables were also interacted with home-computer use, as home access represents a potential voter's ability to search. Home-computer use was measured as the percentage of each state's population with a computer at home, as reported by 2010 census estimates (US Census Bureau 2010c). Although there were no main effects of home-computer use, the final model showed significant interactions between home-computer use and state-national candidate query differences. Specifically: states with a lower percentage of household computers, but with an above-average ratio of Republican searches, were more likely to vote Republican. Conversely, states with both a high proportion of home-computer users and an above-average ratio of Democratic candidate searches were more likely to vote Democrat.
Issue Searches and College Education
Each state's ratio of searches for [taxes] was also compared against the national average, and interacted with a “college” variable (the percent of each state's population with a bachelor's degree). Individuals with a college education may be more inclined to search for taxes, as they have a higher likelihood of being affected by any tax changes. However, the main effect for taxes did not conform to initial hypotheses: a higher than national ratio of searches for taxes had a significant negative effect on the Republican vote outcome.
Although intended as a mediating term, college degree also had a significant and negative main effect in the model, with a higher percentage of college-educated residents making the state lean more Democratic. The interaction between searches for taxes and college degrees was also significant: states that execute more searches for taxes are more likely to swing Republican when they also have a higher percentage of college-educated residents. This result indicates the original hypothesis was only partially correct—searches for “taxes” may indicate Republican-leaning preferences but only when mediated by college education.
Overall National Popular Vote
The results reported herein correctly predict the outcomes in 48 (P2) to 49 (P1) states and support an overall win for Obama in the 2012 presidential election. The state-level popular vote predictions were also used to compute a national percentage of popular vote for Romney. The predicted result was that 48.09% of national popular vote would support the Republican candidate, which was a difference of 0.73 points from the actual 2012 vote outcome (the actual Republican support was 47.36%; we refer to this as “ground truth”). Thus, the model reported here performs fairly well according to the goals identified at the outset—decreasing the prediction intervals and reducing the number of states predicted incorrectly.
FUTURE RESEARCH
The two interaction terms included in this model—home-computer use and college education—point to some potential differences in urban and rural areas. The analysis in this article analyzes search data on a state level, but assuming enough query volume, a similar approach may successfully predict election outcomes on a county-level, or even more useful, predict outcomes for state gubernatorial or senate elections.
Of course, a true test of this model is how well it will perform in the next presidential election. In the interim, future research could more creatively exploit the relationship between search queries and news coverage, identifying instances when search volume deviates from what news media coverage might predict. Political campaign and media effects research have shown that a tightly coupled relationship exists between political events, the media agenda, the public agenda, and vote choice (Iyengar and McGrady Reference Iyengar and McGrady2007; McCombs and Shaw Reference McCombs and Shaw1972). Citizens frequently enter the voting booth primed with the topics covered most prominently in the media prior to the election; as such, aggregate search query volume should approximate the effects of media agenda-setting and priming to better predict an election outcome. This information could be especially useful by selecting specific campaign and primary events: for example, by using the start date of the event as Time Zero, one could measure how long both news coverage and search traffic are sustained after the event. State-by-state differences in the search volume rate of decay may be indicative of a state's popular vote.
Methodologically, other options for future work could explore using moving averages to assess how well the model withstands changes closer to the election date. For example, do some variables have a stronger or weaker effect as Election Day nears? There are several possibilities to fully explore and exploit search queries in the context of election forecasting, and the models reported here give credence to this area, showcasing a successful case study of search queries and their predictive utility.
APPENDIX A
Top 10 Searches Nationally for Issues and Candidates

APPENDIX B
Predictions, Baseline Models, and Actual Vote Outcomes