

1. INTRODUCTION
Populations in contemporary industrialized societies have passed through a unique series of demographic regimes, referred to as the (First) Demographic Transition. This has two principal features, the first of which is a decline in fertility from a level of about five children per woman in the nineteenth centuryFootnote 1 to a level of about two children per woman, conventionally referred to as ‘replacement level fertility’, achieved around 1970, followed by a period with fertility below this level which continues to the present. While countries have shown some variations in the timing and magnitude of their fertility patterns, the similarity in trends is more striking than the differences. The second principal feature of the Demographic Transition is a decline in mortality that has seen the expectation of life at birth rise from approximately 40 years in 1900 to about double that today. In the first part of the twentieth century, improvements were particularly marked at younger ages but, more recently, substantial improvements have been experienced at older ages as well.Footnote 2
These factors have led to the well-recognised ageing of populations, initially dominated by reductions in fertility but more recently reinforced by mortality improvement at older ages. The First Demographic Transition occurred in all Western industrialized societies; although the magnitude and timing varied, the first indications of fertility decline tended to be concentrated around 1880.Footnote 3 The reduction in fertility associated with the First Demographic Transition was succeeded in many cases by an increase, often referred to as the ‘baby boom’, in the post-World War II periodFootnote 4 followed by a further decline from the mid-1960s, which intensified in the 1970s. A particularly striking demographic phenomenon that started to become apparent at about the same time in vanguard societies such as Sweden, and that has come to be experienced across industrialized societies to a greater or lesser extent is the series of linked changes that are of a magnitude and coherence to be designated by some as a ‘Second Demographic Transition’Footnote 5 although this interpretation has been challenged.Footnote 6 This complex of changes includes a substantial reduction in nuptiality, with later ages at marriage and lower propensities both to marry for the first time and to remarry after a broken marriage; an increase in non-marital cohabitation as a prelude to, or increasingly as an alternative to, formal marriage, with such unions tending to be more fragile than marriage and less usually including childbearing; marital unions being subject to higher rates of breakdown, so that a large fraction of marriages in many industrialized countries is expected to end in divorce; and increases in the proportion of births occurring outside marriage, many of them taking place within cohabiting unions.
These developments involve changes in living and partnership arrangements, some of which are closely bound up with the changes in fertility: for example, effective, available and acceptable contraception is an important factor in both fertility and partnership trends.Footnote 7 As a result, by 2006 over half of births in France and the Scandinavian countries were outside marriage, and the mean age of women at their first childbirth in the United Kingdom in 2007 was over 30 (and even higher for men).Footnote 8 Although neither the changing nature of partnership nor the availability of the contraceptive pill was a necessary condition for this more recent fertility decline (as the case of Japan attests), the Second (or ‘partnership’) Demographic Transition has not only had a major influence on behaviour among younger age groups, but the often contemporaneous fertility decline has reinforced the long-term ageing of these societies.
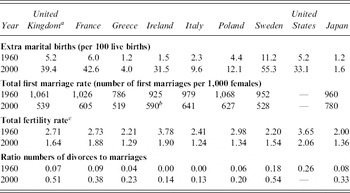
While the precise path of the Second Demographic Transition differs between countries, the trends are generally in the same direction. Even in Mediterranean European countries where extra-marital births were historically low and remain so, the proportions have increased; for example, with a five-fold increase in the case of Greece, from 1.2 per cent of all births in 1960 to 5.8 per cent in 2000. This is dwarfed by changes in some countries that had been considered demographically traditional, such as Ireland, where the proportion of births outside marriage increased by a factor of 20, from 1.5 per cent in 1960 to 33.2 per cent in 2006.Footnote 9
Table 1 shows some indicators for the recent period in industrialized countries, and includes a range of demographic regimes. The similarity of trends in the European countries is noteworthy, and is paralleled by those in non-European industrialized societies such as the USA and, to a lesser extent, Japan. France and Britain have very similar values on these variables over this period, although other indicators show greater differences, such as the proportion of women who are childless. Scandinavian societies have gone further along the path of the Second Demographic Transition; the pace in countries of Southern and Eastern Europe is much slower, and it remains unresolved at present whether they will, in fact, fully follow the trends found elsewhere in Europe.Footnote 10
Period indicators of demographic change in selected European countries, 1960 and 2000

a As reported in international databases.
b 1999 data.
c The total fertility rate is the number of children a woman would bear if she survived to the end of the childbearing phase and experienced the fertility rates of the given year through the childbearing period.
Sources: Council of Europe, Recent demographic developments in Europe 2005 (Strasbourg, 2006);
Institut National d'Etudes Démographique database, available at http://www.ined.fr/en/pop_figures/developed_countries/situation/one_indicator/; Leibniz-Institut für Sozialwissenschaften (GESIS) data archive, Publications of the Social Indicators Department, available at http://www.gesis.org/en/social_monitoring/social_indicators/data/Eusi/pdf_files/A7212.pdf; and
National Institute of Population and Social Security Research, Japan, Trends in partnership behaviours in Japan from the cohort perspective, WP.11 (2007), available at http://www.unece.org/stats/documents/2007.10.projections.htm.
As noted earlier, these experiences are common to a greater or lesser extent in other industrialized societies, and since Britain tends to have an intermediate position on most of the indicators of Table 1, its experiences may provide insights for other countries as well. England and Wales were chosen because suitable data have been estimated for the model used later in this article, including data not currently available in most countries, such as time series of rates of entry into and exit from cohabitation.Footnote 11
While the First (fertility) Demographic Transition was concerned mainly with changing patterns of fertility and mortality, the second was more concerned with changes in partnership behaviour (including both marriage and cohabitation). There was, in addition, an ‘Epidemiological Transition’Footnote 12 associated with long-term patterns of mortality change, especially by cause of death. Changes in fertility, mortality and partnership behaviours will obviously affect those directly involved, and they also have – and will continue to have – a profound effect on national population structures. The macro-level and individual-level implications of these changes have been widely studied but other aspects have been less extensively considered. For example, among those most directly affected by changes in partnership behaviour are their close kin: if a couple divorces, this is likely to affect not only the relationships between the former partners and their children but also those between the children and the children's grandparents. Some types of kin relationships that were rare in the past may become common, but others less so – in a true one-child-family society, no one would have a brother, sister, aunt, uncle, nephew or niece, whereas they may have many more living grandparents as mortality improves. In parts of Europe, there are societies – designated as ‘lowest-low fertility’ societies – that have experienced a decade or more with total fertility rates below 1.3 and, if persistent, this will lead to historically unprecedented types of family and kinship networks.Footnote 13
Both transitions are usually discussed, and their causes and consequences analysed, from a period rather than a cohort perspective. Demographic transitions do not act equally or even in qualitatively similar ways across generations; for example, reduced fertility and mortality will simultaneously tend to increase the number of living siblings of the parental generation through improved survival, but will reduce the number in the child generation through lower fertility so the experiences of different birth cohorts may diverge.
The increased availability of survey data in recent periods means that the continuing effects of earlier demographic transitions can be identified. However, apart from information on marital status available in decennial censuses since 1851, there are no direct national-level estimates of any other type of living kin over extended time periods, apart from some information about children of married women from the Censuses of 1911, 1951, 1961 and 1971, together with the 1946 Family Census and vital registration in 1938–1939.Footnote 14 Therefore kinship estimates over extended time periods can be produced only by demographic modelling. In the next section, the micro-simulation model used is described. Section 3 presents results estimating the changes in the average numbers of – and the proportions with – various types of kin at different ages in Britain from 1875, just before the time from which the First Demographic Transition is usually dated to the present day when many of the manifestations of the Second Demographic Transition, such as declining marriage and increasing divorce rates, appear to have stabilized compared with values a few decades ago. Finally, in Section 4, the implications of these findings are discussed.
2. METHODS AND DATA
Demographic micro-simulation is the principal method used to elucidate kinship patterns in historical, contemporary and future populations.Footnote 15 The analysis here uses an updated version of the Berkeley SOCSIM demographic micro-simulation model.Footnote 16 While information on co-resident groups, including families and households, is available from data sources such as surveys and censuses and has been analysed in detail,Footnote 17 much less is known about non-co-resident kin although the greater instability of family life means that many types of family members outside the household are becoming much more common and important.Footnote 18 This article is concerned with such wider kinship and family networks, whether co-resident or not. Households are not identified in SOCSIM but, with additional assumptions, it is possible to draw inferences about co-residence. For example, following partnership breakdown, it is much more likely that young children will live with their natural mother than with their natural father, but such information does not form part of this analysis.
The entire kinship network of any group of people depends only on their own and their ancestors' fertility, mortality and nuptiality experiences so, if these values are known exactly, their kin universes can be determined precisely. In this application, a large initial population of size 40,000 is used in order to reduce sampling variability. The initial population distribution was that of England in 1751, obtained from the Cambridge Group for the History of Population and Social Structure,Footnote 19 and then subjected to appropriate age-specific rates of fertility, mortality and nuptiality (including divorce using marriage-duration-specific rates) for the period since 1751. Migration is not included in this analysis, but cohabitation is included since it has become increasingly important in recent decades.Footnote 20 The SOCSIM model is closedFootnote 21 so that partners have to be found within the existing unpartnered simulation population using an algorithm to ensure a realistic distribution of spousal age differences. In any month, each individual has a chance of experiencing an event such as becoming a parent or dying by generating a random variable that gives the correct probability of the event occurring (in the case of divorce, the probability of the marriage dissolving is estimated). Over time, a full set of kinship links is constructed as the individuals marry and procreate and die, so that any kinship relationship through blood or partnership (married or cohabiting) may be traced through living and/or dead kin.Footnote 22
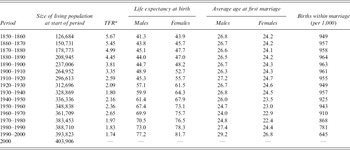
The model values are summarized in Table 2. The model does try to incorporate realistic features where possible; for example, it is known that fertility behaviour tends to be inherited (whether the mechanism is genetic, cultural or socio-economic is irrelevant) and correlated behaviours have been included in the model.Footnote 23 Such models cannot replicate the exact patterns over this period since they do not model the fine detail of population inter-relationships: for example the rates used are ten-year averages and the probability of divorce in this model depends on duration of marriage, but does not depend on the number of children born nor age at marriage, both of which are also known affect divorce propensity.Footnote 24 (In any case such detailed data do not exist over the period analysed.) Therefore it needs to be established that the model, using realistic but simplified assumptions, gives output values acceptably similar to the actual values, so some comparisons with data from censuses and surveys will now be presented.
Summary of main demographic parameter values, 1850–2000, obtained from SOCSIM micro-simulation model fitted over the period 1751–2000

a TFR=total fertility rate (for definition, see Table 1, note c).
Sources: For the base population, see text and note 19; early vital registration data: Cambridge Group for the History of Population and Social Structure; later fertility and nuptiality rates: Office of Population Censuses and Surveys, Birth statistics: historical series of statistics from registrations of births in England and Wales, 1837–1983, Series FM1, no. 13 (London, 1987), updated at http://www.statistics.gov.uk/statbase/mainmenu.asp; Office of Population Censuses and Surveys, Marriage and divorce statistics: historical series of statistics on marriages and divorces in England and Wales, 1837–1983, Series FM2, no. 13, (London, 1990), updated at http://www.statistics.gov.uk/statbase/mainmenu.asp; later mortality data: Human Mortality Database, University of California, Berkeley (USA) and Max Planck Institute for Demographic Research (Germany), available at http://www.mortality.org/.
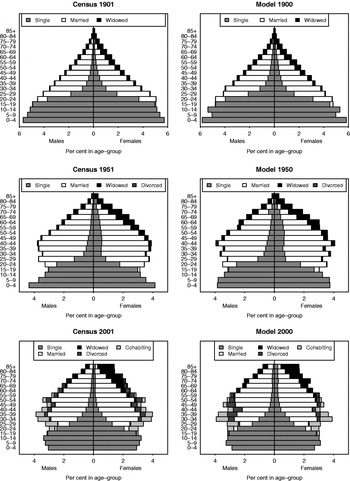
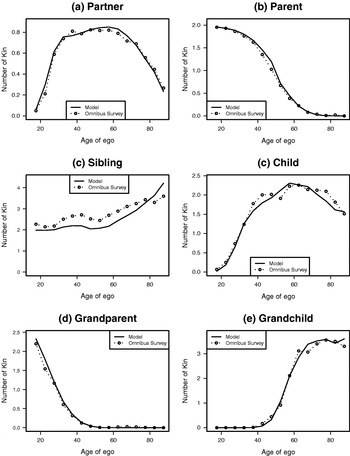
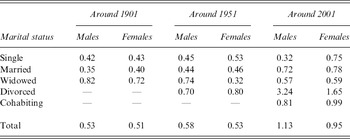
Comparison of the pairs of population pyramids in Figure 1 shows that the simulated populations for 1900, 1950 and 2000 compare well with the observed population distributions by marital status recorded by the 1901, 1951 and 2001 Censuses of England and Wales (the last of which also includes information on cohabiting people).Footnote 25 Figure 2 shows some comparisons of model results with the proportion of the British population with different types of kin from a specially commissioned module on kinship in the Office for National Statistics Omnibus Survey in 1999,Footnote 26 which collected information on kin and kin exchanges. Each graph shows the actual number and the predicted number of a particular type of kin an individual ego will have, on average, as they move through their life cycle. Although the simulation is based on the initial 1751 population's age distribution and estimated rates for up to 250 years, there is a close fit between the observed and the model values for those types of kin for which comparison may be made. Thus the model values appear to form a satisfactory basis for investigating those aspects of family and kin structures for which no directly observed data exist in the past.Footnote 27
Age and marital status distributions around 1901, 1951 and 2001: a comparison of the England and Wales census (on the left) and model data (on the right). Note that the vertical axes display five-year age groups for the age groups 0–84 and 85+. (Sources: unpublished census table from Office for National Statistics official labour market statistics (nomis), unpublished 2001 table census nomis_2008_02_04_205929, available at https://www.nomisweb.co.uk/home/census2001.asp.)

Comparisons of actual and simulated number of kin around the year 2000 in England and Wales, by age of ego. (Source: Living kin module, England and Wales, in the 1999 Omnibus Survey; for details of the Omnibus Survey data set, see note 26.)

Tables 3 and 4 show summary measures of the goodness of fit based on differences of the model and the empirical values shown in Figures 1 and 2. The root mean square (RMS) difference in the first two periods is about 0.5 per cent in the values shown in Figure 1, and about 1 per cent around 2000.Footnote 28 For kin, the RMS difference averaged across five-year age groups was about 0.1 for each kin type, apart from siblings where the value is about 0.4 (it must be remembered that the survey results are based on a total sample size of 3,651, so these are subject to substantial sampling variability within individual age bands).
Root mean square (RMS) difference of the distributions (in percentages) in each five-year age group by sex and marital status of the Census of Population values for England and Wales in the years 1901, 1951 and 2001 compared with corresponding model values obtained from SOCSIM micro-simulation model fitted over the period 1751–2000

Sources: See Figure 1.
Root mean square (RMS) difference between the average number of different types of kin in the 1999 Omnibus Survey and model values in each five-year age group

Source: Living kin module in the 1999 Omnibus Survey; for details of the Omnibus Survey data set, see note 26.
In order to produce estimates of kinship networks, the simulated population over the period 1751 to 2000 was ‘censored’ at five-year intervals from 1850 and 2000, to produce the kinship networks of people that would have been alive at those dates, based only on kin born before the relevant date.Footnote 29 Thus comparisons are made of the same population at different points of time. (For clarity only values every 25 years are shown.) After the 250 years for which the simulation was run, the number of living people in the simulation population had risen from 40,000 to 404,000. For each type of kinship relationship, the relevant kin of each living member of the simulation population (‘ego’) at various points were identified: for example, in the case of siblings in a sibship size of N, there are 0.5N(N−1) such sibling pairs. It is then possible to calculate summary measures such as the average number of various types of kin and the proportion of those in a given age group who have one or more of the relevant kin type.
The principal trends in family and kin structures over the period 1875 to 2000 will now be discussed.
3. CHANGING PATTERNS OF KIN AVAILABILITY, 1875–2000
3.1 Partners
In the North Western European marriage pattern,Footnote 30 marriage was historically relatively late and high proportions – sometimes about one quarter of women – never married, although marriage was more common in societies such as those of Southern and Eastern Europe.Footnote 31 Marriage rates in Britain were particularly low in the 1920s and 1930s, for reasons including shortages of men following the 1914–1918 War and poor economic conditions at the time. However, post-World War II many countries experienced an unprecedented marriage boom, with higher proportions marrying and at earlier ages than in earlier or later periods. In Britain that peaked about 1970: indeed the synthetic index of the total first marriage rate (TFMR)Footnote 32 was over 1.0 in a number of countries. The subsequent decline in marriage has been substantial, with the TFMR falling by half in some countries (see Table 1). While cohabitation has increased, this has generally not been sufficient to offset the decline in marriage so that the overall proportions of young people in partnerships have declined.Footnote 33 While it is impossible to prove that this reduction in marriage is only a temporary phenomenon and that marriages were merely postponed and so would occur later, such a suggestion is becoming increasingly implausible after three decades, as marriage rates continue to show no clear tendency to recover.
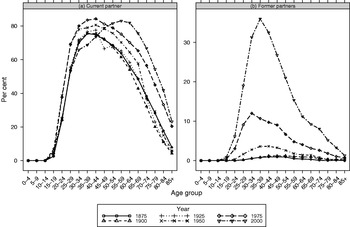
Turning to the model results, the highest proportions of individuals currently in either a marital or cohabiting partnership, are found among those in their late-30s in 1975 (and therefore aged around 60 in 2000; see Figure 3(a)), people who were in the prime marriage age groups. The proportions of this cohort still in a partnership are high because of their lifetime experience of high marriage rates and low divorce rates compared with later cohorts and their lower mortality than earlier cohorts. Compared to cohorts born since at least the start of the nineteenth century, and very probably in all earlier periods as well,Footnote 34 those born in the 1940s are likely to be the most advantaged in terms of having a living partner at older ages, since more recent cohorts are subject to both lower partnership-formation rates and higher partnership-dissolution rates, which is visible in the shift in the peak age for proportions currently in a partnership to around age 60 in 2000. At ages beyond 60, the proportions in a partnership at a given age have been increasing in recent years since improving mortality, especially for men, has an important impact on the likelihood of having a partner at older ages, especially for women.Footnote 35
Estimated percentages of population in England and Wales with (a) current and (b) former partners, by age group, for selected years. (Sources: as for Table 2.)

One trend that has really only started to emerge in the last half-century and that will be reinforced in the next one is the existence of living former partners following cohabitation breakdown or divorce. The analysis here suggests that the numbers of such cases were trivial before 1950, being confined mainly to the small number of ever-divorced people with a surviving former spouse (see Figure 3(b)). Some cohabiting couples who had separated from their former partners should also be included, but since there is no information available on cohabitation before 1950, the number of such former partners will be underestimated, although the evidence emerging for the 1950s suggests that numbers would have been low in earlier times.Footnote 36 However, having a living former partner is clearly becoming much more common over recent decades, so that by 2000 about 20 per cent of those aged between the late 20s and mid-60s have a living former partner. While some of these cases will be the result of short-term childless cohabitation spells, others will have had more substantial long-term emotional, financial and parental implications, but former partners in general are becoming a numerically much more important group.
3.2 Natural parents and children
Together with partners (who, by definition, are likely to live together), the most important kin relationship is that of parents and children, who often provide the most contact and support for each other.Footnote 37 In a cross-national European survey, 49 per cent of family carers of cared-for older people were children compared with 22 per cent who were spouses/partners.Footnote 38
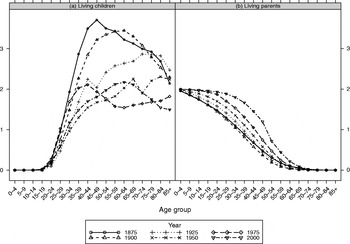
Although there must be one child and one parent in any given parent–child relationship, the overall trends for having living children and living parents are rather different (see Figure 4). Since the mortality of young people in contemporary developed societies is low, it has little impact on the number of living children people have, except at the oldest ages,Footnote 39 but the mortality of children had a considerable impact in the past. Therefore the average number of surviving children in the latter part of the twentieth century largely reflects the fertility of the parents, so that the highest values for those aged around 60 are observed before 1950 (among people who had started childbearing in the higher-fertility phase before the 1914–1918 War) but there is also a relative peak around 2000, since those who were having their children at the peak of the baby boom in the mid-1960s had higher numbers of surviving children than surrounding cohorts, as shown by the values for those around age 60 in 1975 and 1950. In the late nineteenth and early twentieth centuries, people between ages 40 and 75 generally had an average of over three surviving children (note that these data include both men and women so are not directly comparable to published fertility rates), but then deaths of children at older working ages meant that the average number fell close to two children per adult at high ages – 85 and over – similar to that in the latter part of the twentieth century.
Estimated average total numbers of living children and living parents in England and Wales, by age group, for selected years. (Sources: as for Table 2.)

There is comparatively little change in the probability of having one or both parents alive in the first half of the period covered (see Figure 4(b)) – all that matters is parental survival from the parental age at childbearing, and mortality at older ages showed little improvement until the second half of the analysis period. However, the proportions of people with parents alive have recently increased substantially. For comparability with the average number of living children, average number of living parents is shown. Note that the age at which people have on average one living parent is not the same as the median age for having at least one living parent (that is, the oldest age at which 50 per cent have at least one living parent), although they will tend to move in the same direction over time.Footnote 40 This median age (not shown) increased nearly as much in the last 25 years – from 49 to 55 years – as in the previous century – from about 43 to 49 years. For parental survival, the timing of the epidemiological (mortality) transition has been the most important factor determining whether one had living parents at a given age, although this increase is likely to be reversed in decades to come as the effect of increasing ages at childbearing outweighs likely improvements in mortality.Footnote 41
Unlike the average number of living children, the proportion of people who have no living child from about age 35 is similar across the whole period; although this is not shown in any of the figures presented here, it usually amounted to between a quarter and a third of such persons, apart from those who experienced the 1960s fertility boom that resulted in much lower proportions of the childless among those born in the 1940s, lower even than those experiencing the much higher overall fertility levels of the nineteenth century,Footnote 42 once more emphasizing the unique experience of those born in the 1940s.
3.3 Grandparents and grandchildren
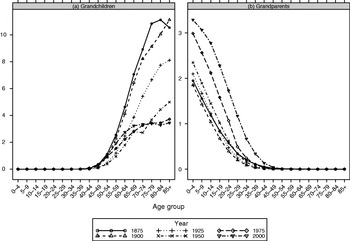
Many of the points made with respect to the determinants of trends in parent/child kinship ties are relevant to a discussion of grandparent/grandchild links as well, typically with effects magnified since links across two generations rather than one are involved. One of the consequences of mortality improvement is that intergenerational relationships spanning more than one generation become more common. In the first half of the period considered, a child aged under 5 was likely to have an average of just over 2 grandparents alive (mainly grandmothers), but this had risen to about 3.5 grandparents alive by 2000 (see Figure 5(b)). Children today have an average of at least three living grandparents for most of their childhood. The implications of mortality improvement for adults having grandparents alive are even more substantial. Further analyses of these models that estimated the proportions with living kin rather than the average numbers show that up to 1950, half of people aged 20 had no living grandparent, whereas in 2000 this point was not reached until after age 30, at which age the proportion of people with at least one grandparent alive is double the proportion even 25 years earlier.
Estimated average total numbers of living grandchildren and living grandparents in England and Wales, by age group, for selected years. (Sources: as for Table 2.)

For later cohorts, children have more grandparents alive on average, but the converse does not hold: in fact the average number of living grandchildren was over 10 for those at the oldest ages around the start of the twentieth century, for people whose own and whose children's childbearing took place in the pre-transitional period. This number declined sharply to a value around four in the past half-century (see Figure 5(a)). when potential grandparents and their children had both experienced lower fertility levels when they themselves and their children were around age 30, so they had fewer than half as many grandchildren at age 60 compared with those born in the first half of the nineteenth century. Although lower overall fertility is one reason for such a substantial fall, another important factor affecting the chance of grandparenthood for some cohorts is the changing age at parenthood (more particularly, the age at first birth) over the period, since to be a grandparent at an age such as 60 requires that the relevant ages at birth averaged over two successive generations is under 30 years. The median age of grandparenthood (the age at which half of people had at least one living grandchild) was just over 55 in 2000, nearly ten years lower than in 1950, but early grandparenthood is likely to become increasingly rare, especially for men; in years to come, grandparenthood will become less common and will occur later in life. Availability of grandchildren to older people has been a particularly variable component of kinship ties over the 1875–2000 period because of changing patterns of ages at childbearing and childlessness, in contrast to that of having living children, which has been much more stable, since even at the end of the twentieth century few individuals started childbearing after about age 35, so that the timing effects on having a living child are important for only a relatively short period of people's lifetimes.
3.4 Brothers and sisters
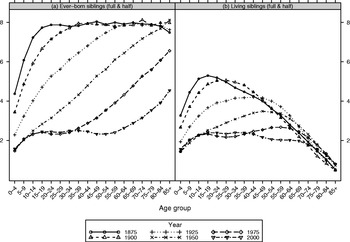
In the hierarchy of consanguineous kin relationships, siblings are the most important after parents and children – one has the same genetic relationship (50 per cent) in common with a full sibling (100 per cent for monozygotic twins) as with a parent or a child. Figure 6 shows the estimated average total numbers of ever-born and living siblings (including both full, that is those with both natural parents in common, and half, that is those with only one in common). As late as 1950, older people (aged 80 and over) had around 8 ever-born siblings on average (see Figure 6(a)), although because mortality rates for infants and children remained high through the nineteenth century,Footnote 43 the number of living siblings was considerably lower due to death. For ‘egos’ born around 1900, about 60 per cent of their siblings were still alive when they reached age 50 in 1950, reflecting the improved mortality of the twentieth century, especially for infants and children.
Estimated average total numbers of ever-born and living (full and half-) siblings in England and Wales, by age group, for selected years. (Sources: as for Table 2.)

The figure of around 8 ever-born siblings might appear high for those born in the second half of the nineteenth century, especially as total fertility rates (TFRs) of the order of 4 to 5 children per woman are quoted for this period.Footnote 44 However, the sibship size figure reflects the fact that there were relatively high proportions of the childless and therefore higher average family sizes among the parous population (those who had given birth at least once), and because in the calculation of sibship sizes each child is multiply counted in a large sibship, whereas it is counted only once in calculations of family size.Footnote 45 This figure for ever-born siblings is almost identical to one calculated from the data collected in the 1911 Census of England and Wales on the completed fertility of married women, so referring to births around the same period.Footnote 46
The decline in fertility from the end of the nineteenth century leads to the sharp drop in number of ever-born siblings of school-age children, from about 5 to 2 over a period of just 50 years, a substantial change in the childhood experiences of people in a relatively short time. Even today, those aged 85 and over have about twice as many ever-born siblings as those now aged about 60 (see Figure 6(a)).
Although the childhood experiences of these groups over this 125-year period, as reflected in ever-born sibship sizes, are so different, the adult experiences, as reflected in living sibship size, are much more similar at all time periods from about age 70, when all cohorts have an average of about 2 living siblings, declining to about 1 at ages 85 and over (see Figure 6(b)).Footnote 47 Therefore the improvement in mortality over this period means that people aged 70 and over have similar average numbers of living siblings at any given age in all time periods, even though those born later had much smaller numbers of siblings when they were children. Half of those in their early 80s have at least one living sibling, considerably more than have a living spouse (see Figure 3(a)).
Only children are clearly the sole group who cannot potentially have a living sibling, and the frequency of such families will affect the proportions without siblings, although information on family-size distributions in Britain for those born before the 1920s is sparse.Footnote 48 In the early part of the analysis period covered here, most young people would have had many siblings on average and even if each one had a high chance of not surviving to a high age, there was still a high chance that at least one would survive. Over this period, survival increased steadily, offsetting the reduction in average numbers of siblings so that even with a smaller average number of siblings ever born for later cohorts, the number of living siblings at high ages has remained.
3.5 Stepfamilies
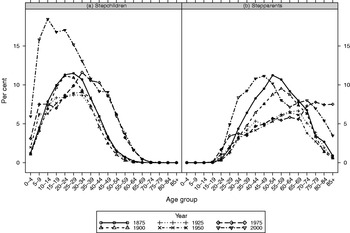
The implications of high rates of partnership breakdown are a key social issue in contemporary societies.Footnote 49 Some children will be born to non-co-resident parents and others to couples who may split up later. With the values experienced around the year 2000, over 40 per cent of marriages in Britain will end in divorce within 30 years.Footnote 50 About 40 per cent of births occur outside marriage, with about two-thirds of these to cohabiting couples around the year 2000 (see Table 1). Some of the children resulting from these extra-marital births may subsequently be brought up in a stable union with the parents continuing to cohabit or marrying later, but cohabiting relationships tend to be more fragile than marriages. Thus a substantial proportion of children will find that one or both of their natural parents will form a new partnership so that they become a stepchild.Footnote 51 Figure 7 shows the proportions of people in each age group who are stepchildren as defined above (in particular, this does not imply co-residence since adult stepchildren and stepparents will rarely live together). In earlier times, when divorce and cohabitation were rare, stepfamilies overwhelmingly arose when a widowed parent remarried. The proportion of school-age children in a stepfamily in 1950 was about 5 per cent (see Figure 7(a)), a figure that rises with age as increasing numbers of older parents remarry, before falling as these reconstituted families dissolve due to deaths. The proportions for younger children in stepfamilies were about three times as high in 2000, with over 15 per cent of school-age children having a stepparent.Footnote 52 In contrast with earlier periods, the proportions with stepparents in 2000 then decline with age, since their parents had experienced lower rates of partnership breakdown when they were young compared with later cohorts in 2000; this is more than sufficient to offset the additional years at risk of partnership breakdown experienced by the older generations.
Estimated percentages of population with living stepchildren and living stepparents in England and Wales, by age group, for selected years. (Sources: as for Table 2.)

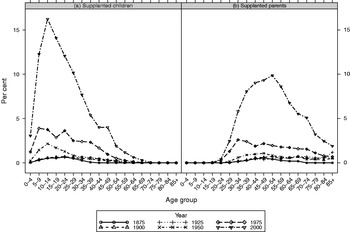
While considerable discussion in the area of reconstituted families has been devoted to stepfamilies, little attention has been given to ‘supplanted’ parents – living natural parents whose former partner and the parent of their child(ren) has subsequently repartnered. Indeed there appears to be no term in either common parlance or kinship terminology that identifies this relationship. For all concerned, this is a situation where another person has taken over at least some of the roles and relationships of the natural parent.Footnote 53
Comparing Figure 7 with Figure 8, it can be seen that the proportions of children and young adults with a stepparent and with a supplanted parent are similar, as would be expected, although not identical for a number of reasons, including that an individual could have a living stepparent but a dead natural parent, or a dead stepparent and a living natural parent, or that a person with a ‘missing’ (that is, unknown) father can have a stepfather but not a supplanted father. Before the second half of the twentieth century, the number of supplanted parents was trivial, only involving remarriages of the small number of divorced parents with children (and some cohabiting couples but, as noted earlier, information on this is lacking). However, the numbers increased subsequently, especially towards the end of the century when about 10 per cent of people aged 50 were in that position, whereas the highest proportion at the same age in any earlier period shown was just over 2 per cent. There are relatively few supplanted parents compared to stepparents before 2000, largely because in the past repartnering usually followed the death of a spouse rather than partnership breakdown, whereas the reverse is the case today.
Estimated percentages of population with living supplanted children and living supplanted parents in England and Wales, by age group, for selected years. (See the text for definition of ‘supplanted’.) (Sources: as for Table 2.)

3.6 Lone motherhood
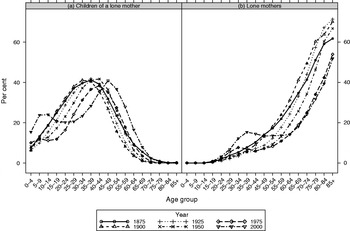
The final component of family change considered here is that of lone motherhood. Similar proportions of marriages were broken after 20 years' duration in the nineteenth century as around 1980, although the mechanism was very different: death rather than divorce.Footnote 54 A similar point applies to lone parenthood. Figure 9 shows estimates of the proportions of children with lone mothers and the proportions of women who are lone mothers (only mothers are shown rather than combining both sexes, as elsewhere in this article, because there is more information on, and interest in, lone-mother than in lone-father families). A lone mother as defined here is an unpartnered woman with at least one living child, irrespective of the child's marital or co-residential status, whereas alternative definitions may require dependent children, co-resident family units or never-married children. Being a child of a lone mother is most common about age 40, where situations with levels of about 40 per cent are found across the whole period 1875–2000. Of course, these are mainly the married children of elderly widows, and the improvements in mortality that are pushing back the average age at entry into widowhood will consequently tend to push back the peak age of lone parenthood.
Estimated percentages of children who are the children of a lone mother and of mothers who are lone mothers in England and Wales, by age group, for selected years. (Sources: as for Table 2.)

The experience of lone motherhood is very different for both mother and child in cases where the lone parent family contains young children and in those where the child is middle-aged and the lone parent is an older widow. The levels of lone parenthood experienced by dependent children (ages 0 to 15) were broadly similar when comparing 1875 and 1975, but with somewhat lower levels in the intervening period; indeed the low point of such ‘young’ lone parenthood was around 1940, when the children benefited both from lower mortality among their fathers as compared with earlier periods and from low levels of extra-marital childbearing and divorce (the 1939–1945 War led to both increased widowhood and divorce; the more recent partnership patterns involving increased partnership breakdown have been discussed earlier). The most recent periods show a steep increase in lone motherhood to an historically unprecedented value so that about a quarter of school-age children are now in lone-mother families (see Figure 9(a)).
4. CONCLUSIONS AND IMPLICATIONS
Of all demographic analyses, those concerned with kin availability are among the most sensitive to long-term population trends. Whether one has a living grandparent or grandchild is affected by fertility, mortality and nuptiality over a period of close to a century, and therefore the demographic transition that started in the late nineteenth century is only just starting to lose its impact for some types of kin availability and its effects were still clearly visible in the 1950s in such examples as the numbers of siblings of older people. These relatively recent experiences may still influence some of our thinking about ideal forms of generational relations. In the past, the relative rarity of remarriage of those with a living former partner may have led to the current lack of emphasis on the characteristics of, and impact upon, supplanted parents as compared to the attention given to stepparenthood. Thus while the rights of access to their children by their natural parents, even those who have had little input into childrearing or support, is accepted, natural grandparents, who may have made a substantial contribution to their grandchildren's welfare, have no such rights at present in Britain, although it has been argued that grandparents should have rights of access to their grandchildren.
Apart from the effects of changing kin relations due to earlier changes in partnership regimes, the ageing of populations has had an independent and sometimes reinforcing impact. It is not clear if the expectation that a couple who marry in their mid-20s are likely to remain a couple for 60 years in the absence of divorce may actually act as a stimulus for divorce and a disincentive for marriage, or the reverse.
The changing demographic regime, which causes the ageing of populations, has had two main impacts on kin relations, apart from the issue of availability of kin. The first is that there has been an ageing of generational relationships: events that formerly occurred early in life are being pushed back at present, such as the experience of one's parents' deaths, or are likely to do so in the future, such as the age of becoming a grandparent. The second is that patterns of repartnering are leading to more partial relationships involving step- and supplanted parents, half-siblings, former partners and stepchildren. These trends seem likely to intensify in years to come. Some scholars have seen these new, more fluid forms of family life as a positive development that will provide a wider pool of kin with whom to interact,Footnote 55 and possibly promoting civic participation by reducing the importance of narrow, often family-oriented ‘binding’ social capital at the expense of wider ‘bridging’ social capital based on wider but weaker ties with friends, neighbours and community organizations.Footnote 56 Others have been more sceptical about the enduring nature of ties between kin who have no longer a direct connectionFootnote 57 and of the social benefits of more fragile family forms.Footnote 58
Changing fertility and mortality patterns associated with the First Demographic Transition have well-recognized effects at the individual and at the societal level, whereas their implications at the mezzo-level of kinship are much more complex, in that the implications for different types of kin differ substantially, and the effects may take up to a century to work through the kinship universe. While the social implications of these trends remain unclear, what is inescapable is that not only is the population ageing in all industrialized countries, but many of the kin relationships are also ageing as a consequence.
Acknowledgements
Thanks are due to the Economic and Social Research Council who funded this work as part of the project ‘Modelling Needs and Resources of Older People to 2030’ (RES-339-25-0002); to Professor Ken Wachter and his colleagues at Berkeley for access to and advice in using SOCSIM; to Professor Richard Smith and Jim Oeppen of the Cambridge Group for the History of Population and Social Structure for providing historical vital rates; to the Office for National Statistics (ONS) who collected the ‘Kin Module’ data in the 1999 Omnibus Survey, funded by Economic and Social Research Council grants R000237776 and R000237076; and to Professor Emily Grundy (London School of Hygiene and Tropical Medicine) and Olwen Rowlands (ONS) in preparing the questions used. The original collectors of data bear no responsibility for the analyses or interpretation presented here.