INTRODUCTION
Efficiency and profitability in beef breeding herds in Northern Ireland is reported to be poor (McCann & Colhoun Reference McCann and Colhoun2007). Profitability is linked directly to the number of calves reared per female served annually (Woods, unpublished), with cows that fail to calve or taking longer than 12 months to give birth and wean a calf incurring a higher cost per kilogram of calf produced than cows that produce a calf in 12 months (Herd & Sprott Reference Herd and Sprott1998). Lowman (Reference Lowman2012) estimated that each day the calving interval (CI) was extended it costs the farmer an additional £3·50 and a study by Macgregor & Casey (Reference MacGregor and Casey2000) found that each 1-day increase in CI was associated with a 0·3 ± 0·01 kg decrease in weaning weight. The desired CI is widely reported as 365 days (Olori et al. Reference Olori, Meuwissen and Veerkamp2002; Kunkle & Sand Reference Kunkle and Sand2006), i.e. one calving per cow every 365 days. A study in Great Britain by Gates (Reference Gates2013) found the 25th percentile of CI for beef breeds to be 350 days and the 25th percentile of CI for beef herds to be 372 days, suggesting that a 365-day CI is an achievable target. Despite this, the mean CI for beef cow breeds was reported as 394 days in Great Britain (Gates Reference Gates2013) and 395 days in Ireland (Irish Cattle Breeding Federation 2015). At the time of carrying out the current study (2013), the estimated mean CI of beef cows in Northern Ireland was estimated to be 415 days (Titterington, unpublished). This suggests that there is the opportunity for beef cow farmers in Northern Ireland to improve their CI.
There are several common indicators of the level of fertility in commercial beef breeding herds including: CI (Gutierrez et al. Reference Gutierrez, Alverez, Fernandez, Royo, Diez and Goyache2002; Costa et al. Reference Costa, Ponsano, De Souza and Malafaia2016), calving date (Meyer et al. Reference Meyer, Hammond, Parnell, MacKinnon and Sivarajasingam1990; Gutierrez et al. Reference Gutierrez, Alverez, Fernandez, Royo, Diez and Goyache2002; Mokhtari et al. Reference Mokhtari, Shahrbabak, Javaremi and Rosa2015) and pregnancy or calving rate (Meyer et al. Reference Meyer, Hammond, Parnell, MacKinnon and Sivarajasingam1990; Donoghue et al. Reference Donoghue, Rekaya, Bertrand and Misztal2004; Ramsey et al. Reference Ramsey, Doye, Ward, McGrann, Falconer and Bevers2005; Mokhtari et al. Reference Mokhtari, Shahrbabak, Javaremi and Rosa2015; Costa et al. Reference Costa, Ponsano, De Souza and Malafaia2016). These measures reflect the cows’ ability to conceive and produce a viable calf within an acceptable timeframe, leading to optimum productivity. For many of these measures, detailed knowledge of management practices is required. Age at first calving is also used as a measure of fertility (Gutierrez et al. Reference Gutierrez, Alverez, Fernandez, Royo, Diez and Goyache2002), as heifers that calve at 24 months will have a higher output of calves over their lifetime than those calving at 36 months or later (Núñez-Domínguez et al. Reference Núñez-Domínguez, Cundiff, Dickerson, Gregory and Koch1991; Morrison et al. Reference Morrison, Feazel, Bagley and Blouin1992). In the current study, CI was used as a measure of fertility.
There is a paucity of research on farm management decisions that contribute to poor fertility. A comprehensive survey was designed to identify management practices that contributed to better herd fertility to offset this knowledge gap. An improved knowledge of management practices that benefit herd fertility will help provide management directives for beef cow producers to employ on their farms and improve the fertility of beef breeding herds.
MATERIALS AND METHODS
Farm selection
This study was carried out by the Agri-Food and Biosciences Institute in Northern Ireland. Five years of fertility data on 150 beef breeding herds, which had been selected from the farm national census and stratified by farm type and land area type, were used. Land area types included were less-favoured areas (LFA) and non-LFA; LFAs are areas of poorer agricultural land which qualify for grants from the Northern Ireland Rural Development Programme and can further be divided into Disadvantaged Areas (DA) and Severely Disadvantaged Areas (SDA) (DAERA 2014). Each farm had made previous use of extension services and was familiar with their extension officer. Previous engagement with the extension officer suggests that the respondents included in the current study may have been more progressive than farmers who were not; despite this, the study included a range of fertility levels and farm management types. In total, respondents from 105 of these farms returned completed surveys within the allotted time frame. The survey was intended to cover a wide range of farm sizes and management styles. Farm business size was calculated in standard labour units from the data provided in the ‘Your Herd’ section of the survey (including number and type of livestock held on farm and land use) using coefficients from Fulton & McCormack (Reference Fulton and McCormack2012) and compared with the numbers of Northern Ireland cattle and sheep farm business sizes according to labour units required (small, medium or large enterprise; Fulton & McCormack Reference Fulton and McCormack2012). On average, a 1·0% (s.d. 0·30) and 0·6% (s.d. 0·44) sample of each business size of LFA and non LFA farms was taken, respectively.
Design of the survey
The survey consisted of 59 questions, including nine free-form open questions and 50 closed questions. Closed questions were either yes/no answers or included options; for example, selecting a rating from a scale, choosing from a finite list, listing a proportion or use of visual aids. Rating from a scale included rating the farm extension service (an education service to assist producers in improving their farm enterprise) from 1 (very poor) to 5 (very good). Choosing from a finite list included selecting how long the bull had access to the cows (10–12 weeks, 13–16 weeks, 17–40 weeks or longer than 40 weeks). Listing a proportion included the proportion of cow genotype on farm. Cow genotype could be broken down into three types: native or British beef breeds, such as Hereford or Aberdeen Angus; continental or European beef breeds, such as Limousin or Charolais; and dairy breeds, such as Holstein Friesian. Consequently, respondents were given 11 options to define the current breakdown of cow genotype. These were: proportion of fully continental cows; proportion of ¾ continental, ¼ native cows; proportion of ¾ continental, ¼ dairy cows; proportion of ½ continental, ½ native cows; proportion of ½ continental, ½ dairy cows; proportion of fully dairy cows; proportion of fully native cows; proportion of ¾ native, ¼ continental cows; proportion of ¾ native, ¼ dairy cows; proportion of ¾ dairy, ¼ native cows; proportion of ¾ dairy, ¼ continental cows; proportion of ½ native, ½ dairy cows; and proportion of composite breed. Visual aids included giving respondents the choice between two bulls as a terminal sire, where one bull had superior estimated breeding values (EBVs) describing the breeding potential of the bull, and the other was visually superior but had poor EBV figures.
The survey was broken down into seven sections: general information (a general background on the respondent including extension services (s)he used and education), herd information (breakdown of cattle in the farm enterprise, breakdown of land use and type, breeds held on farm and measures taken to improve and monitor herd fertility), breeding (sire selection, breakdown of females mated and methods used, records kept and reasons for extended CI), replacement heifer management (disease/vaccination controls on heifers, how growth was monitored, target calving/service age and weight, and criteria for selecting heifers to breed), cow management (disease/vaccination controls on cows, condition scoring of cows, and weaning), health status (herd disease status for common infections, i.e. Bovine Viral Diarrhoea (BVD), IBR (infectious bovine rhinotracheitis), Johne's disease, leptospirosis, Salmonella and neosporosis) and grazing management (breakdown of grazing system employed on farm and the number of days breeding beef cows are housed/grazing).
Prior to carrying out the survey, a group discussion took place with the College of Agriculture, Food and Rural Enterprise (CAFRE) development advisers, who act as extension officers in Northern Ireland. This discussion was used to pre-test the survey, with minor adjustments made where necessary, and also to train the extension officers in survey technique and standardize the approach. The survey was carried out by extension officers over a period of 74 days using face-to-face interviews, with each survey taking approximately 1·5 h to complete. It was deemed unnecessary to pilot the survey with producers as the CAFRE extension officers were present throughout the duration of the questionnaire and so could respond to any queries.
Calculating fertility
Fertility data were based on animal birth date and movement data recorded on the Animal and Public Health Information System (APHIS), a centralized government database which holds records of all cattle in Northern Ireland. Extension officers used the information on APHIS to generate a calving report for each farm, which consisted of the farms’ calving records. Each calving record included: herd ID, unique dam tag number, calving date, parity, previous calving date, calf tag number, age at calving, CI, age at first calving and year of calving. The reports also highlighted the CI, considering <390 days acceptable, 391–450 days as a concern and >451 days as overly extended. Over a period of 5 years, 16 233 calving records were accumulated accounting for 6715 cows on the farms surveyed. This provided a robust data set of calving dates at both dam and farm level. Age at first calving was discounted as a measure of fertility because it was only available for cows which were bred on-farm as replacements and were no more than fourth parity. Measures such as calving rate, days to calving and calving percentage could not be assessed because no information was available on when the cows were mated. As a result, the current study concentrates on CI as a measure of herd fertility. To account for the possibility that herd mean may have been skewed by a small number of overly extended calving intervals (ECIs), the proportion of cows within the herd with ECI was included as an indication of CI distribution. Calving interval is defined as the time (days) elapsing from the date of birth of a cow's calf until the birth date of her next calf (Brown et al. Reference Brown, Durham, Cobb and Knox1954), and was calculated as the difference between two consecutive parturitions from an individual dam. The proportion ECI was calculated as:
 $$\hbox{Proportion extended calving interval (ECI}) = \displaystyle{{n \hbox{OECI}} \over {{\rm \Sigma \; cc}}}$$
where nOECI is number of overly ECIs (>451 days) and Σ cc is total number of cows calved in herd.
Statistical analyses
To determine fertility measures for each herd, CI and proportion ECI were adjusted via the methodology of linear mixed models using a restricted maximum likelihood (REML) algorithm with geographical area, year of parturition and parity age fitted as fixed effects, and herd and dam within herd as random effects. In this way, a single predicted value was produced for each herd for each variable. These adjusted response variables were then used in all subsequent analyses.
The results of each respondent's questionnaire were manually entered into a Microsoft Excel (2007) spreadsheet and, where appropriate, answers to open questions were categorized using thematic analysis methodology (Attride-Stirling Reference Attride-Stirling2001; Cresswell et al. Reference Cresswell, Brennan, Barkema and Wapenaar2014). Where possible, numerical values were converted to proportions, allowing more accurate comparisons across different herd and farm sizes. Once converted for analysis, the survey broke down into 441 variables.
Not all questionnaires were completed fully, with respondents leaving blank responses for different variables. As a result, only 84 variables with 55 common non-missing data points were available for inclusion in the multivariate analysis. The decision was made to reduce the number of variables included in the analysis and, as a result, maximize the number of responses for each variable analysed. All variables with <70 responses were discarded; subsequently, as a screening technique, the relationship between each response variable (CI and proportion ECI) and each explanatory variable (respondents’ answers to questionnaire) in turn was examined using univariate linear regression analysis; variables that were P > 0·05 and had <95 responses were not included in the multivariate analysis.
In total, six multivariable analyses were completed, which corresponded to different sections within the survey (including number of variables included in analyses and the number of common data points): general information (27 variables, 71 common data points), herd information (including herd health and nutrition; 86 variables, 70 common data points), breeding information (126 variables, 71 common data points), replacement heifer management (21 variables, 77 common data points), cow management (27 variables, 62 common data points) and a full data set analyses which included variables from all sections of the questionnaire (233 variables, 64 common data points). For each analysis, response variables were modelled against each group in turn using a fully automated multivariate stepwise regression algorithm employing the method of forward selection with backward elimination. All analyses were carried out in GenStat 64-bit Release 16·2 (VSN International Ltd, Hemel Hempstead, UK).
RESULTS
Descriptive analysis
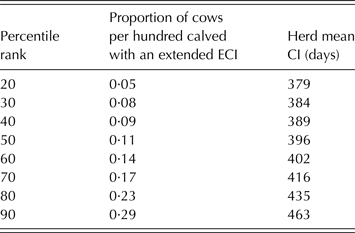
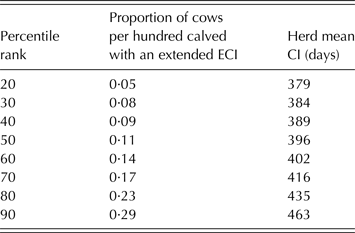
The mean herd CI was 407 days (±35·1), with a 20th percentile of 379 days (Table 1). Within herd, CI was highly variable, with an average range of 253 days (±66·4); thus, proportion ECI was included to account for the mean CI being skewed by an outlying CI. The mean proportion ECI for all herds was 14 cows per hundred calved, (±9·4), with a maximum value of 38 cows per hundred calved. The 20th percentile of the ECI was 5 cows per hundred calved, with a 90th percentile of 29 cows per hundred calved (Table 1). On each farm, the number of calvings recorded each year ranged from 4·3 to 154·0 (mean 33 ± 8·3). Farm size ranged from 14 to 280 ha (mean 64 ± 50·1 ha).
Percentile rank of both herd proportion extended calving interval (ECI) and herd mean calving interval (CI)
Management effects on fertility
Univariate analyses
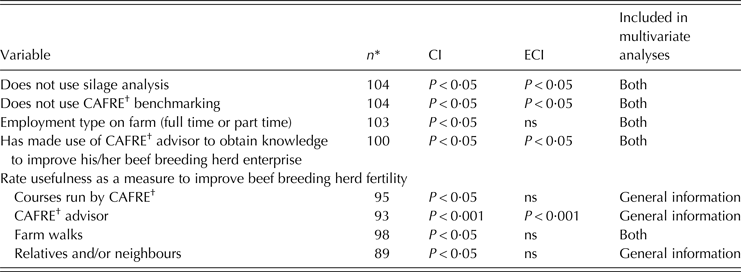
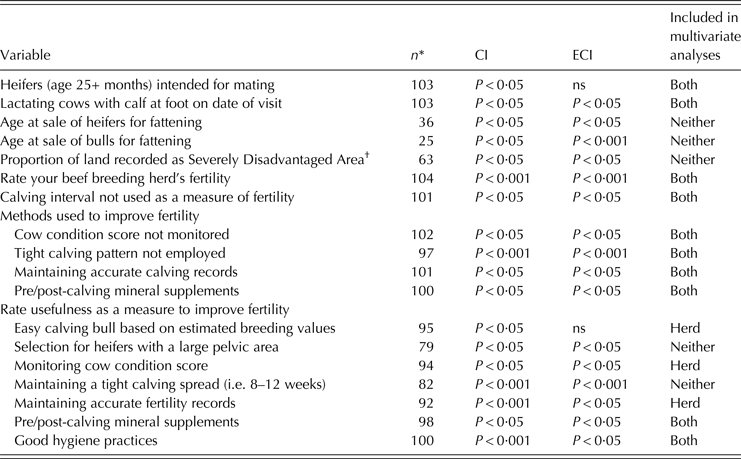
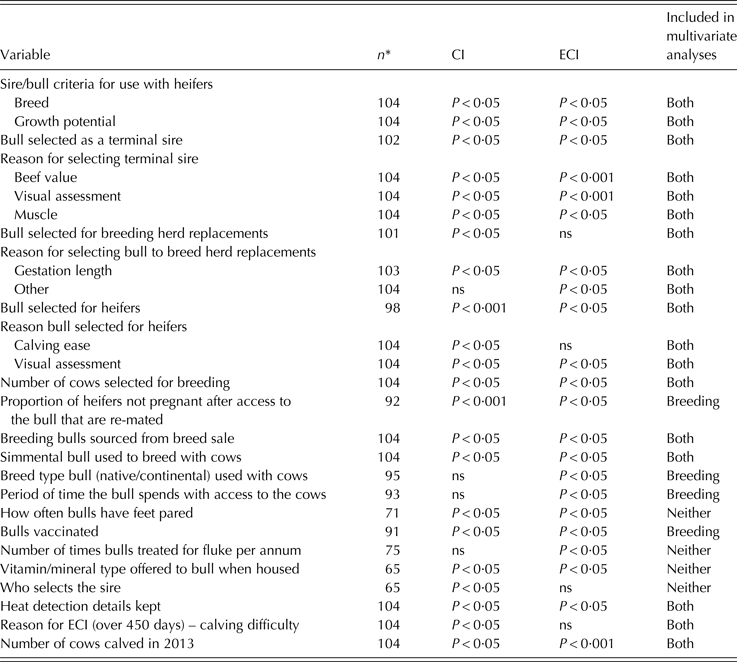
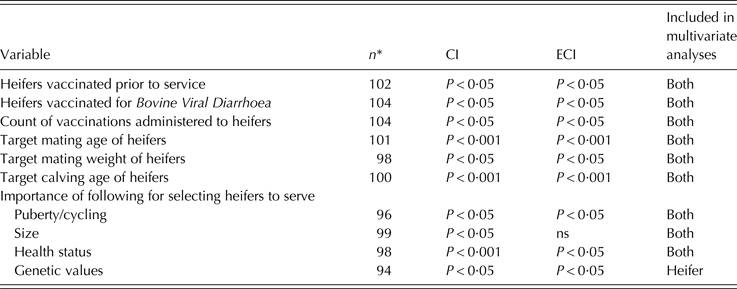
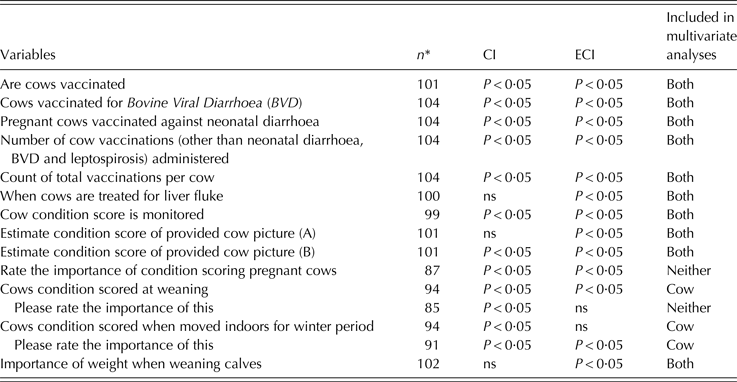
Significant relationships were found between 70 variables and CI, of which 60 were included in the multivariate analysis, and 64 variables and proportion ECI, all of which were included in the multivariate analysis (Tables 2–6). Fifty-seven variables had significant relationships with both CI and proportion ECI, of which 49 were included in the multivariate analyses.
General information variables that elicited a significant response from calving interval (CI) or proportion extended calving interval (ECI) in the univariate analyses and their inclusion in the multivariate analysis

ns, not significant.
* Number of respondents for that variable.
† CAFRE: College of Agriculture, Food and Rural Enterprise (the organization that provides extension services in Northern Ireland).
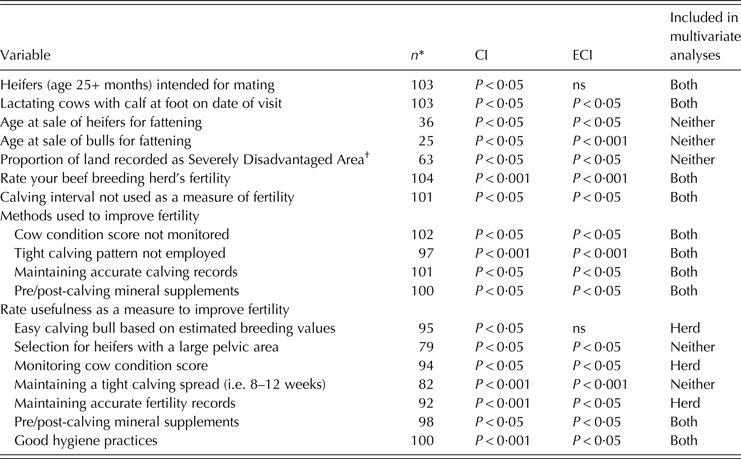
Herd variables that elicited a significant response from calving interval (CI) or proportion extended calving interval (ECI) in the univariate analyses and their inclusion in the multivariate analysis
ns, not significant.
* Number of respondents for that variable.
† Denotes an area that has been assessed as having very poor soil or conditions and as such farms in the area are entitled to government financial support.
Breeding variables that elicited a significant response from calving interval (CI) or proportion extended calving interval (ECI) in the univariate analyses and their inclusion in the multivariate analysis
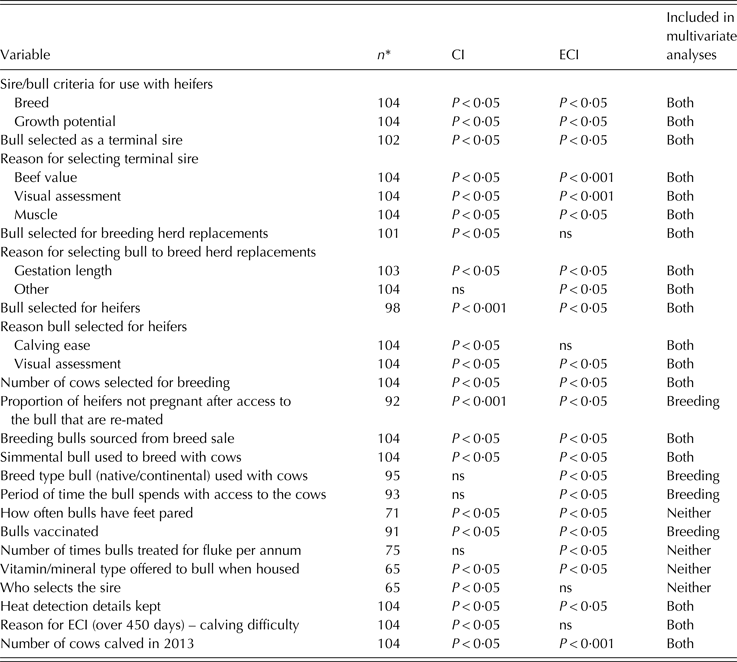
ns, not significant.
* Number of respondents for that variable.
Heifer management variables that elicited a significant response from calving interval (CI) or proportion extended calving interval (ECI) in the univariate analyses and their inclusion in the multivariate analysis
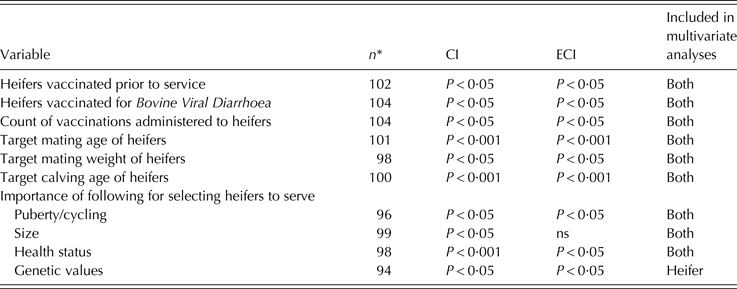
ns, not significant.
* Number of respondents for that variable.
Cow management variables that elicited a significant response from calving interval (CI) or proportion extended calving interval (ECI) in the univariate analyses and their inclusion in the multivariate analysis
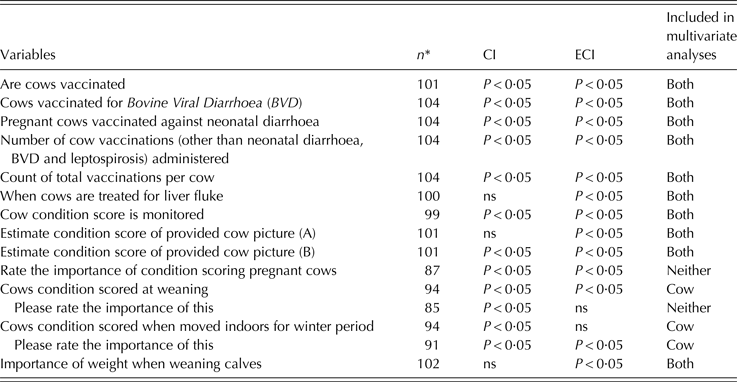
ns, not significant.
* Number of respondents for that variable.
General information analysis
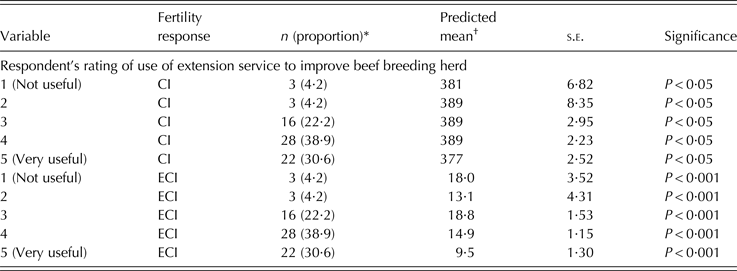
Table 7 shows that respondents who rated the extension service as ‘5 – very useful’ had a significantly lower CI (P < 0·05) than those who rated it ‘3’ or ‘4’ and numerically lower CI than those who rated it a ‘1’ or ‘2’. Similarly, a lower proportion ECI (P < 0·05) was observed for respondents who rated the extension service as ‘5’ compared with those rating it ‘4’, ‘3’ or ‘1’.
Distribution of variables that elicited significant response from calving interval (CI) or proportion extended calving interval (ECI) analysed in the ‘general information’ multivariate analysis
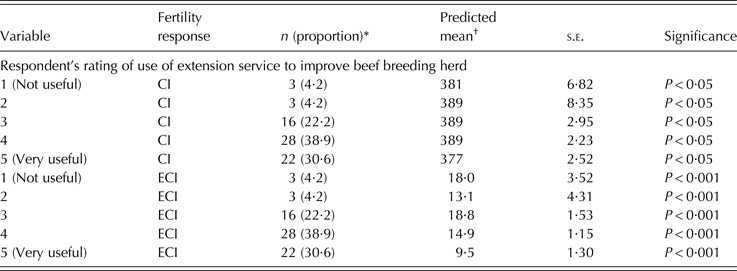
* n denotes number of respondents who chose that option and figure in brackets denotes number of respondents as a proportion per 100 analysed.
† Predicted mean of fertility response.
Herd analysis
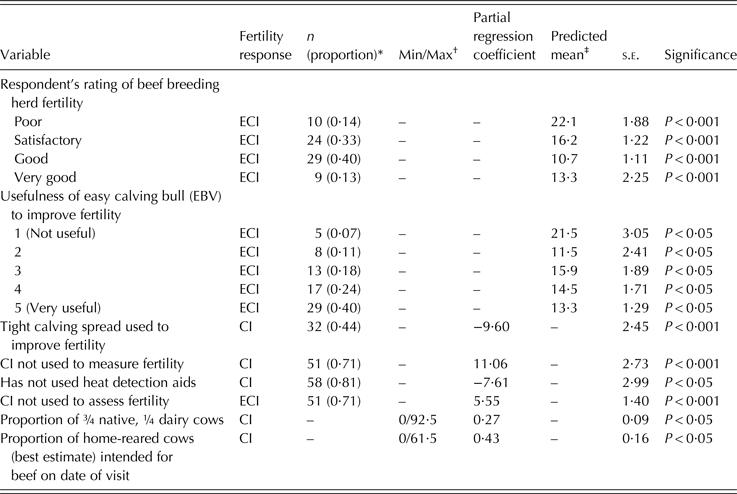
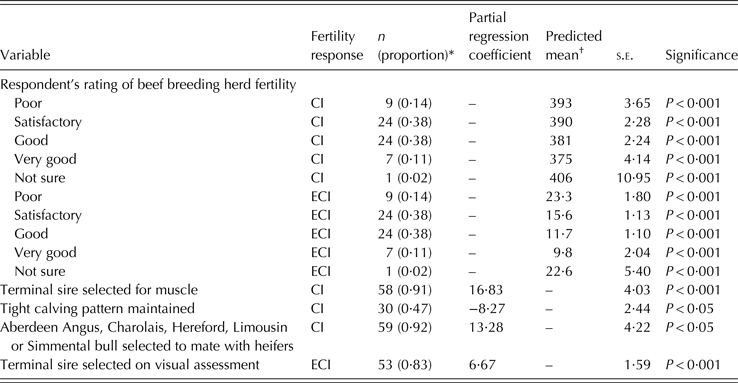
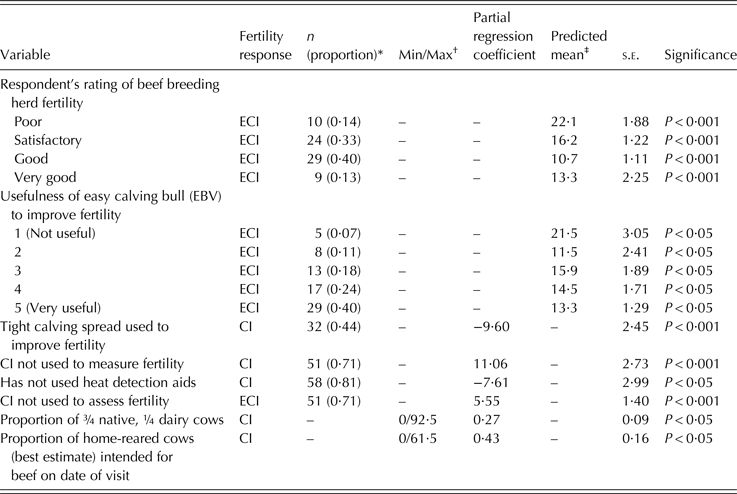
Respondents who rated their herd fertility as ‘good’ or ‘very good’ had significantly lower proportion ECI (P < 0·05) than those who rated their herd fertility as ‘poor’. Although numerically lower, those who rated their herd fertility as ‘very good’ did not have significantly lower ECI than those who rated their fertility as ‘satisfactory’ (Table 8).
Distribution of variables that elicited significant response from calving interval (CI) or proportion extended calving interval (ECI) analysed in the ‘herd information’ multivariate analysis
EBV, estimated breeding value.
* n denotes number of respondents who chose that option and figure in brackets denotes number of respondents as a proportion per 100 analysed; only applicable to discreet and binary variables.
† Denotes minimum and maximum values from respondents, only applicable to continuous variables.
‡ Predicted mean of fertility response.
Respondents were asked if they maintained a tight calving spread, i.e. limited the duration of the calving period; those who employed a tight calving spread to improve fertility had a shorter CI (P < 0·001) than those who did not (Table 8). Respondents who used CI as a measure of fertility had shorter CI (P < 0·001) and lower proportion ECI (P < 0·001) than those who did not. Respondents who had not used heat detection aids had a shorter CI (P < 0·05) than those who did (Table 8).
The breakdown of cows in the herd had two significant associations with fertility in the herd analysis (Table 8). As the proportion of ¾ native and ¼ dairy cows increased by an increment of 1%, there was an increase in CI (P < 0·05). Furthermore, each percentage increase in proportion of home-reared cows led to a 0·43-day increase in CI (P < 0·05).
Breeding analysis
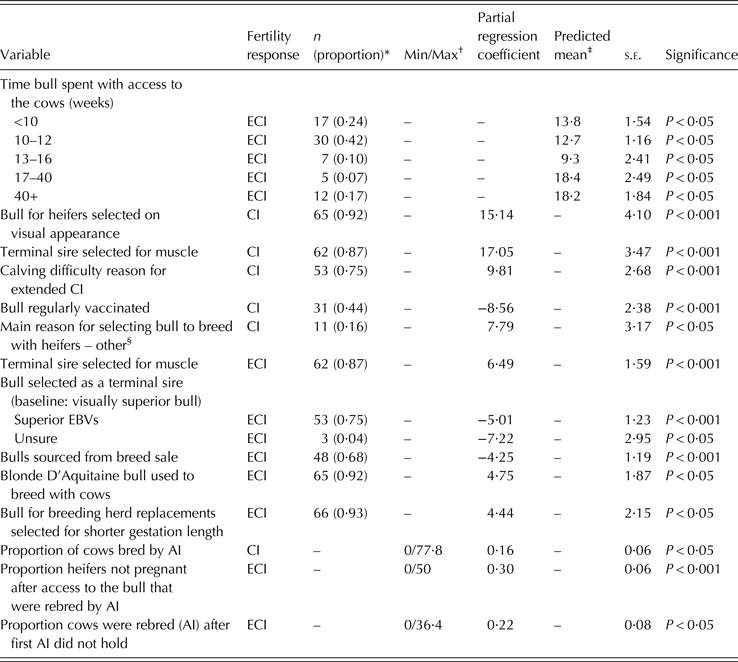
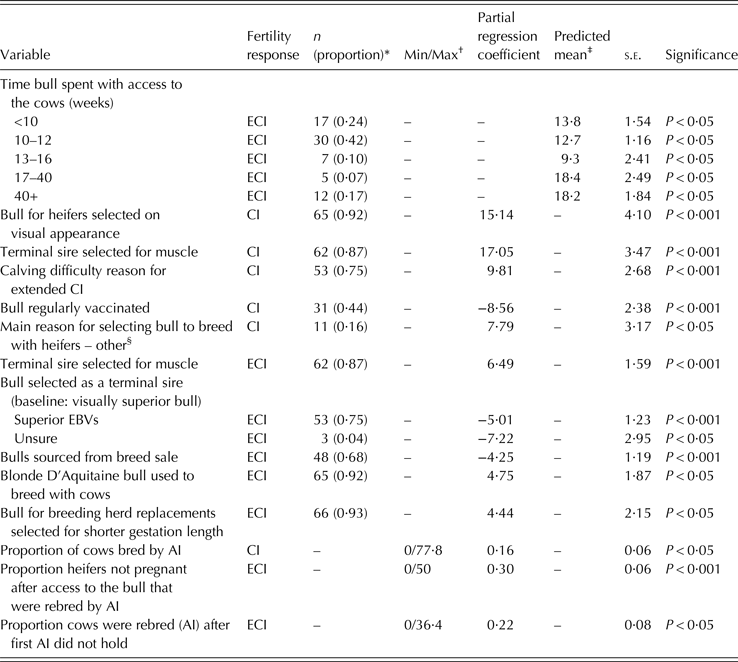
Respondents who allowed the bull access to cows for mating longer than 17 weeks had numerically higher proportion ECI than those who only allowed the bull to run with the cows for 16 weeks or less (Table 9). Respondents who allowed the bull access to the cows for mating for a period of 10–12 weeks, the most favoured length of time (0·42), had a lower proportion ECI (P < 0·05) than those who allowed the bull access to cows for 40 weeks or longer.
Distribution of variables that elicited significant response from calving interval (CI) or proportion extended calving interval (ECI) analysed in the ‘breeding’ multivariate analysis
EBVs, estimated breeding values; AI, artificial insemination.
* n denotes number of respondents who chose that option and figure in brackets denotes number of respondents as a proportion per 100 analysed; only applicable to discreet and binary variables.
† Denotes minimum and maximum values from respondents, only applicable to continuous variables.
‡ Predicted mean of fertility response.
§ ‘Other’ reasons included: milk figures, breeding schemes, growth figures and beef value.
It was found that respondents who selected bulls for visual appearance had a longer mean herd CI than those who did not (P < 0·001; Table 9). Selecting a terminal sire that had proven EBVs for muscle had a significant association with both CI and proportion ECI, increasing CI (P < 0·001) and proportion ECI (P < 0·001); respondents who selected bulls for breeding replacements by their EBV gestation length had a higher proportion ECI than those who did not (P < 0·05). Respondents who chose the bull with better EBV figures had a lower proportion ECI compared with those who chose the visually superior bull (P < 0·001). Respondents who were unsure of whether to choose the visually superior bull or the bull with better EBVs had a lower proportion ECI than those who selected the visually superior bull (P < 0·05). When given a list of options of characteristics taken into consideration when choosing a bull to breed with heifers which included breed, conformation, easy calving EBVs, growth potential EBVs, maternal traits EBVs, milk EBVs or other, respondents who chose ‘other’ had a longer CI than those who did not (P < 0·05). ‘Other’ reasons included: milk figures, breeding schemes, growth figures and beef value EBV.
Respondents who chose a Blonde D'Aquitaine to breed with cows had a higher proportion ECI (P < 0·05) than those who did not. Respondents who regularly vaccinated their breeding bulls had a shorter CI than those who did not practice regular vaccination (P < 0·001). Furthermore, respondents who purchased their bulls from pedigree breed sales had a lower proportion ECI than those who acquired bulls from other sources (P < 0·001), such as purchased direct from a commercial farm or from a local market, or home bred.
Increased use of artificial insemination (AI) had a detrimental effect on fertility (Table 9), with each percentile increase in the proportion of cattle served by AI leading to an increase in the CI (P < 0·05). As one would expect, as the proportion of cattle that were not pregnant after first mating and subsequently re-mated increased, herd fertility decreased; proportion ECI increased both with the number of heifers needing re-mated after access to the bull for mating (P < 0·001) and with the number of cows that were not pregnant after first mating and subsequently re-mated after the first AI (P < 0·05). Table 9 shows that respondents who identified calving difficulty as a reason for extended CI had a longer CI (P < 0·001) than those who did not.
Replacement heifer and cow management analyses
There were no significant associations with the replacement heifer variables and the herd fertility levels. Respondents who condition scored their cows at weaning had a lower proportion ECI (P < 0·05; Table 10). Cow health management was also important, with respondents who vaccinated their cows having a reduction in proportion ECI (P < 0·05). Furthermore, a decrease in CI (P < 0·05) for each vaccination administered to cows was observed (Table 10).
Distribution of variables that elicited significant response from calving interval (CI) or proportion extended calving interval (ECI) analysed in the ‘cow management’ multivariate analysis

* n denotes number of respondents who chose that option and figure in brackets denotes number of respondents as a proportion per 100 analysed; only applicable to discreet and binary variables.
† Denotes minimum and maximum values from respondents, only applicable to continuous variables.
Full data set analysis
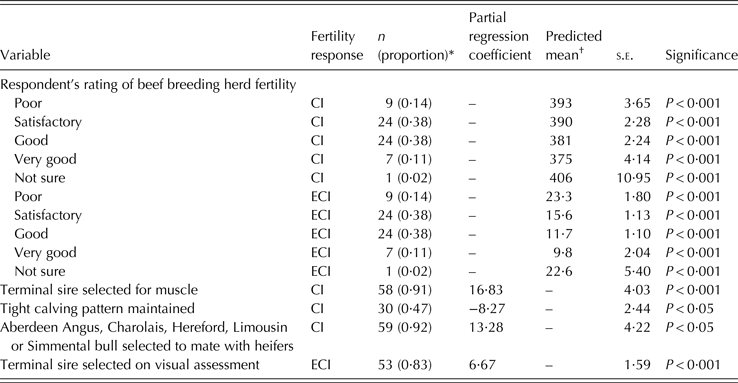
Table 11 shows the results for the comprehensive analysis which included all variables. Respondents who considered their herd fertility as ‘good’ or ‘very good’ had a significantly (P < 0·05) shorter CI than those who considered herd fertility as ‘very poor’, ‘satisfactory’ or were unsure. This is similar to the response in the proportion ECI, which shows those who rated their herd fertility as ‘good’ or ‘very good’ had significantly lower proportion ECI (P < 0·05) than those who rated it as ‘poor’ or ‘satisfactory’.
Distribution of variables that elicited significant response from calving interval (CI) or proportion extended calving interval (ECI) analysed in the full data set multivariate analysis
* n denotes number of respondents who chose that option and figure in brackets denotes number of respondents as a proportion per 100 analysed; only applicable to discreet and binary variables.
† Predicted mean of fertility response.
Respondents who did not select terminal sire with superior EBV for muscle had a shorter CI (P < 0·001) than those who did; respondents who selected terminal sire on visual appearance had a higher proportion ECI (P < 0·001; Table 11). Sire breed used when breeding heifers also affected herd fertility, with herds that were using one of the more common breeds of bull (Aberdeen Angus, Charolais, Hereford, Limousin or Simmental) rather than a less common breed of bull (Shorthorn, European Angus, Salers, Stabiliser, Belgian Blue or Blonde D'Aquitaine) were found to have shorter CI (P < 0·05).
Similar to the herd analysis, respondents who maintained a tight calving spread had a shorter CI (P < 0·05) than those who did not employ this management technique.
DISCUSSION
In the current study, only 0·06 of respondents achieved a mean herd CI of ⩽365 days, suggesting that this target is not ideal in a commercial setting. A mean herd CI ⩽395 days was achieved by 0·45 of respondents; suggesting that it may be more appropriate to set a commercial target CI of <13 months rather than a prescriptive number of days. Less than 0·01 of herds achieved the target proportion ECI of 0 cows per hundred calved. As the maximum CI recorded was 600 days, all the cows which had not calved at an interval of 365 days would have been pregnant and as a result the respondent may have chosen not to cull them. From this perspective, it is perhaps unrealistic to expect a proportion ECI of 0 cows per hundred calved, and a proportion ECI of 5 cows per hundred calved is a more commercially suitable target. The distribution of both CI and proportion ECI show that there are opportunities to improve both CI and proportion ECI; and there are a range of management practices associated with improved fertility.
It is clear from the analyses that those who used visual assessment to choose a sire had longer CI compared with those who did not; and that using EBVs for selection rather than visual appearance was more effective regardless of sire purpose. This demonstrates that it is not effective to use only visual appraisal as a means of selection to increase production of beef cattle. This is further supported by Sasaki et al. (Reference Sasaki, Miyake, Gaillard, Oguni, Matsumoto, Ito, Kurahara, Sasae, Fujinaka, Ohtagaki and Dougo2006) who found that genetic gains in Wagyu cattle were small and not significantly different to zero during a period of visual-only testing, and Lubout & Swanepoel (Reference Lubout and Swanepoel1992) who reported that over a period of 9 years when only visual assessment was used for selection, only one of five growth measurements improved. Unexpectedly, selecting bulls for breeding replacements by EBV for shorter gestation length led to a higher proportion ECI; however a very low proportion of respondents used this criterion to select bulls to breed heifer replacements, which may have skewed this result. Sire selection is also known to be an effective management tool to prevent dystocia (Mee Reference Mee2008), widely reported as a factor in extending CI (Laster et al. Reference Laster, Glimp, Cundiff and Gregory1973; Hickson et al. Reference Hickson, Morris, Kenyon and Lopez-Villalobos2006). Dystocia greatly affects animal welfare and profitability of herds via increased labour and veterinary costs, calf mortality and increased time to next conception (Phocas & Laloë Reference Phocas and Laloë2003). Dystocia is particularly important in the beef breeding herd, as breeding beef cows are reported to experience significantly more dystocia than dairy cows (Zaborski et al. Reference Zaborski, Grzesiak, Szatkowska, Dybus, Muszynska and Jedrzejczak2009) and dystocia identified as second only to infertility as the most costly reproductive condition in beef herds (Bellows et al. Reference Bellows, Ott and Bellows2002).
Those who did not source their breeding bull direct from a pedigree breeder or breed sale had a longer CI compared with those who did. Alternative purchase options offered to the breed sale/pedigree breeder were direct from commercial farm, local market or home-reared. This could be a result of better quality bulls being available at breed sales, with many breeders involved in breed improvement programmes which concentrate on genetic improvement. Thus, the difference in fertility could be attributed to the bulls sourced at pedigree breeders or breed sales being genetically superior. Sires categorized as ‘other breed’ (Blonde D'Aquitaine, Shorthorn, Salers, Stabiliser and European Angus) had a longer CI than those who used a breed named in the study (Limousin, Hereford, Charolais, Aberdeen Angus and Simmental). There is limited research on the direct effect sire breed has on CI, as most are calculated from the dam breed. However, sire breed can affect gestation period and dystocia (Mee Reference Mee2008) and gestation period is a component of CI. The variation between breeds included in the category ‘other breed’ means it is difficult to attribute this variation to a specific breed effect. This association may be due to a wider choice in the more common, named breeds; meaning respondents were able to target more specific EBVs and choose superior bulls.
In the current study, respondents were chosen through information held on a database run by the government extension service, and so all respondents had previously made use of this service. Respondents who rated the extension service as the highest rating for usefulness ‘5 – very good’ had a lower proportion of ECI and a shorter CI than those who rated it as a lower, less useful score. This reflects the Technology Acceptance Model, which proposes user acceptance and usage of technology is determined by perceived usefulness and perceived ease of use (Flett et al. Reference Flett, Alpass, Humphries, Massey, Morriss and Long2004). It was reported by Ingram (Reference Ingram2008) that farm visits from agricultural advisors are the most powerful and effective method of communication in the farming community. Thus, respondents who had previously used the extension service and considered it as very useful were more likely to use it again, and as a result, were more likely to understand and employ beneficial management techniques promoted by the extension service, for example the use of EBVs. The data show that higher proportions of those respondents who rated the extension service as 4 – useful (0·87) or 5 – very useful (0·93) chose a sire with superior EBVs rather than a visually superior sire compared with 0·56 of respondents who considered the extension service as three or less out of five.
The increased use of AI was found to lead to an extended CI. The implementation of AI typically requires oestrus detection by the farmers (Grimard et al. Reference Grimard, Freret, Chevallier, Pinto, Ponsart and Humblot2006), thus the detrimental effect on herd fertility from AI may be attributed to poor oestrus detection. This is supported by a study carried out by Van Eerdenburg et al. (Reference Van Eerdenburg, Loeffler and van Vliet1996) which found that the traditional method for detecting cows in oestrus (i.e. observing standing heat) was not sufficient, as it was only observed in 0·37 cases of oestrus. A review by Roelofs et al. (Reference Roelofs, López-Gatius, Hunter, Van Eerdenburg and Hanzen2010) suggests that between 0·05 and 0·30 of dairy cattle inseminated are not in heat, indicative of poor heat detection. This inadequate heat detection may contribute to unsuccessful AI and lead to increased CI. First ovulation in both dairy and beef cattle is generally silent (i.e. no behavioural oestrus; Crowe Reference Crowe2008) and as a result not possible for a herdsman to identify; however, bulls can predict onset of oestrus by several days using olfactory/gustatory signals produced by pro-oestrus cows (French et al. Reference French, Moore, Perry and Long1989). Furthermore, in the present study respondents who used heat detection aids had an increased CI. Rao et al. (Reference Rao, Kumar, Kumar, Chaurasia and Patel2013) suggest that using heat detection aids in combination with visual observation will give more accurate results in heat detection than heat detection aids or observation alone. This is supported by Smith et al. (Reference Smith, Pohler, Perry and Patterson2013), who state that increased visual observation in addition to the use of heat detection aids can improve pregnancy rates by determining the most appropriate time for insemination. One reason for heat detection on farms sampled being poor is that the time taken for heat detection may not have been sufficient. Respondents were asked how many times they checked their cows/heifers and if they kept heat detection records; <70 respondents answered and so these questions were omitted from the final analysis. However, it is worth noting that the average number of heifer checks was 1·3 (±0·45 s.d.) per day and the number of cow checks was only marginally higher at 1·3 (±0·67 s.d.). When asked how long heat checks lasted, a high proportion of both heifer and cow checks lasted ⩽10 min (0·54 and 0·55, respectively) with only 0·12 and 0·10 of respondents spending 30 min per heat detection period for heifers and cows, respectively. These figures compare poorly with recommended figures of two to three periods of oestrous detection a day for a minimum duration of 30 min each (DuPonte Reference Duponte2007).
It was repeatedly seen in the analyses that respondents’ interpretation of their herd fertility corresponded with the actual fertility calculated using both CI and ECI as a measure. This suggests that either farm managers are not aware of the costs associated with poor fertility or are not sure how to address this issue. A higher proportion of the respondents who rated their fertility as ‘poor’ did not record CI to assess fertility (0·90), compared with those who rated fertility as ‘good’ (0·59) or ‘very good’ (0·71). Respondents who were aware of low fertility may have been unwilling to implement management changes to remedy the situation; farmers are widely reported to be traditionalists (McCown Reference McCown2002) who are risk averse, slow to adopt unproven ideas and unwilling to change long-standing management practices (Guerin & Guerin Reference Guerin and Guerin1994; Willock et al. Reference Willock, Deary, McGregor, Sutherland, Edwards-Jones, Morgan, Dent, Grieve, Gibson and Austin1999; Titterington et al. Reference Titterington, Morrison, Lively, Wylie, Gordon and Browne2015). Furthermore, an Australian study by Kilpatrick (Reference Kilpatrick1996) found that farm businesses with a management team of fewer than two were less likely to implement changes in management than those with larger management teams; in the current study, each farm had only one main decision maker. Newman et al. (Reference Newman, Lynch and Plummer2000) found that farmers did not adopt new technologies as they often saw no reason for changing current management methods, suggesting that to encourage adoption of methods to improve herd fertility, the economic benefits of improved fertility need to be highlighted.
Respondents who reported to maintain a tight calving period improved CI by 10 days in the herd analysis and 8 days in the comprehensive analysis. Benefits of a compact calving period include reduced production costs and greater financial returns (Vickers Reference Vickers2014). A tight calving period is indicative of good management on-farm, with a defined length at a time of year that can make the best use of available pasture (Blanc & Agabriel Reference Blanc and Agabriel2008). This good management is reflected in sire selection and vaccinations administered by respondents who maintained a tight calving period; with only 0·05 of those who maintained a tight calving period citing visual assessment as the main reason for selecting a bull to breed with heifers and a higher mean number of vaccinations administered to cows by respondents who did maintain a tight calving period (1·23 vaccinations) compared with those who did not (0·85 vaccinations).
In the current study, respondents who did not keep a record of CI to assess herd fertility had an 11-day longer CI and 6 cows per hundred calved higher proportion ECI than those who did not. A lower proportion of respondents who kept records of CI chose a bull to breed with heifers on visual appearance compared with those who chose for EBVs, and those who kept records administered on average 1·83 vaccinations per cow compared with 0·76 vaccinations administered by respondents who did not keep records. Little research exists on the usefulness of record keeping in breeding beef cattle; however, record keeping on individual dairy cows is reported to improve milk quality and production (Losinger & Heinrichs Reference Losinger and Heinrichs1996; Rhone et al. Reference Rhone, Koonawootrittriron and Elzo2008). Lewis (Reference Lewis1998) reports that record keeping is one of the most valuable sources of specialized information about the farm operation, and continues that this information can be used to support the business decision-making process. This is relevant to the current study, as respondents who recorded CI were able to assess the problem and implement an adjusted breeding protocol to manage CI, suggesting that further adoption and improved record keeping may have a positive effect on herd fertility.
Vaccination for both cows and bulls had significant associations with fertility. Respondents who did not regularly vaccinate bulls had a longer CI than those who did. Options for vaccinations offered to bulls were clostridial, BVD, leptospirosis and pneumonia; however, none of the individual vaccinations had a significant association with herd fertility. Research regarding infectious infertility in bulls has been reported to be extremely limited (Givens Reference Givens2006). However, several pathogens can lead to infertility in bulls or transmit via semen (Givens & Marley Reference Givens and Marley2008), with mental and physical health affecting a bull's desire and ability to breed (Palmer Reference Palmer2011). Similar associations between cow vaccinations and herd fertility were observed; respondents who did not vaccinate cows had a higher proportion ECI. There were three options for vaccinations used on cows listed in the analysis (BVD, leptospirosis and neonatal diarrhoea) with any vaccines that were administered by fewer than five respondents listed as ‘other’. Leptospira hardjo and BVD are listed amongst the most common infection causes of abortion in Ireland (Sayers et al. Reference Sayers, O'Doherty, Bloemhoff, Byrne and Dillon2012), thus vaccinating for BVD and leptospirosis would be expected to reduce the number of abortions and in turn reduce the length of CI. In the multivariate analysis, it was the number of vaccinations administered rather than the specific vaccination that elicited a significant response and reduced CI. These results could be indicative of either an additive effect of vaccinations, or reflective of better management practices of progressive respondents who employed a comprehensive vaccination regimen. Since many diseases are detrimental to health and, in turn, reproductive performance, it is plausible that a comprehensive vaccination programme for both cows and bulls is more effective in improving herd fertility than targeting one specific disease.
As the proportion of home-reared cows intended for beef increases, CI also increases. The primary reason for culling is identified by Bascom & Young (Reference Bascom and Young1998) as failure to conceive. A higher proportion of cows being slaughtered is an indication of a higher proportion of cows failing to conceive, hence the extended CI. However, it is an indication of good management that cows that have failed to conceive are being slaughtered. Powell (Reference Powell2004) identifies open cows as a drain on resources, and it is economically wise to cull them if not pregnant at pregnancy diagnosis (Loucks et al. Reference Loucks, Oltjen and Trapp2012). As the number of cows needing re-mated increased, so did CI. Calving interval consists of the time taken to resume cyclic activity after calving, conceive and the resulting gestation length (Berry et al. Reference Berry, Wall and Pryce2014), thus as the time between parturition and conception increases, the CI will increase.
As the proportion of cows that were ¾ native and ¼ dairy incremented, the CI increased by 0·27 days. There was no significant association with the other breeds or breed proportions. Although there is evidence that cow breed will affect gestation period (Burris & Blunn Reference Burris and Blunn1952; Bourdon & Brinks Reference Bourdon and Brinks1982; Casas et al. Reference Casas, Thallman and Cundiff2011, Reference Casas, Thallman and Cundiff2012), a very low proportion of respondents (0·04) reported having a higher proportion than 0·00 of ¾ native and ¼ dairy cows, which may have skewed this result.
Body condition score is widely documented as an important factor in reproductive ability of cattle (Herd & Sprott Reference Herd and Sprott1998; Roche et al. Reference Roche, Mackey and Diskin2000; Crowe Reference Crowe2008). A study by Melendez et al. (Reference Melendez, Donovan, Risco, Littell and Goff2003) found that cows in good condition (BCS > 2·5) 120 days postpartum were 9·22 times more likely to conceive at first service than cows with a BCS ⩽ 2·5. The current study shows that respondents who condition scored cattle at weaning had lower proportion ECI. It is difficult to improve the BCS of cows in early lactation in an economical and cost-effective technique (Diskin & Kenny Reference Diskin and Kenny2016), and weaning is a useful period for manipulating a cow's diet to either increase or decrease BCS (Lamb Reference Lamb1999). Thus, respondents who condition scored at weaning may have had better proportion ECI because they are informed of BCS and can adjust subsequent cow management and diet to achieve the required BCS at both breeding and calving.
CONCLUSION
When using CI as a measure, beef breeding herd fertility in Northern Ireland falls short of the optimum 365-day CI and 0 cows per hundred calved proportion ECI; however these targets were not widely attained in the current study. This suggests that targets of a 380-day CI and 5 cows per hundred calved proportion ECI should be advocated as more realistic targets. In addition to more achievable targets, the current study identified several important variables linked to improved beef breeding herd fertility. Positive perception of the extension service, employing a robust vaccination programme, improved record keeping, and selecting sires based on EBVs were associated with improved herd fertility alongside more obvious factors such as appropriate heat detection and breeding female management. There is potential to increase herd fertility in Northern Ireland by reporting fertility measures such as CI to producers and encouraging them to adopt the aforementioned methods.
The authors would like to thank the CAFRE advisers for their assistance in developing and carrying out the survey and also the farmers who took part in the survey.