Implications
The high frequency of bovine urine samples found positive for prednisolone in the last few years in northern Italy, when compared with the whole positives, might suggest a ‘natural’ origin of this corticosteroid. This is a significant possibility, even more important in those European Union member states (Italy, the Netherlands) where corticosteroids are classified as unauthorised substances in zootechnics. The hypothesis that neo-formation of prednisolone in bovine urine may occur, simulating poor sampling (by contamination with faeces) or storage (by incubation at 37°C) conditions, is considered and proven.
Introduction
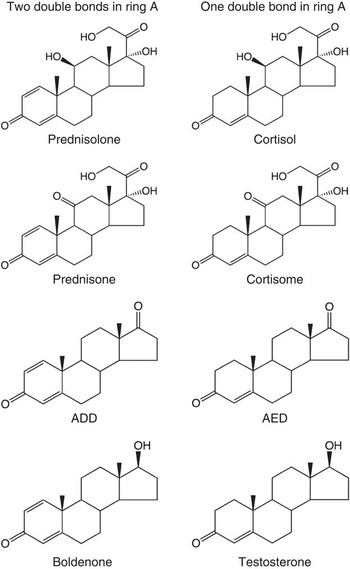
The use of corticosteroids in livestock is regulated in the European Union for therapeutic purposes. The maximum residue limit of prednisolone (pregna-1,4-diene-11β, 17α, 21-triol-3, 20 dione), the structure of which is closely related to cortisol (pregn-4-ene-11β, 17α, 21-triol-3, 20-dione), is 4 μg/kg in muscle and fat, 10 μg/kg in the liver and kidneys and 6 μg/kg in milk (European Community, 2010). In Italy and the Netherlands, corticosteroids are classed as group A3 substances (those having an anabolic effect and unauthorised substances/steroids) because of their steroidal structure, whereas other member states classify them as B2f (other pharmacologically active substances; European Community, 2008). It should be noted that in northern Italy, in 2007 and 2008, the most frequent form of non-compliance was by far due to corticosteroids. In 2007, 18 bovine farms out of 20 showed irregularities due to corticosteroids in Piedmont, with 38 non-compliances of bovine urine for these steroids (88% of the total), with those involving prednisolone or prednisone accounting for 70% of this total (Regione Piemonte, 2007). In Lombardy, 79 non-compliances were detected in the tests carried out on urine at the slaughterhouse in 2008: 70 because of corticosteroids (89%); and more precisely, 65 because of prednisolone or prednisone (82%) (unpublished data). In 2009, 78 non-compliances were found in cows at the slaughterhouse: five because of dexamethasone and 73 (94%) because of prednisolone (Regione Lombardia, 2009). In the same year and in the whole of Italy, 76 non-compliances for prednisolone were recorded in cattle, constituting by far the majority of the 91 irregularities in group A3 substances and being found in different bovine matrices (liver, urine; Ministero della Salute, 2009). Moreover, there is a close resemblance in the A ring of prednisolone, prednisone (pregna-1,4-diene-17α, 21-diol-3,11,20-trione), androstadienedione (androsta-1,4-diene-3,17-dione; ADD) and its precursors/metabolites α- and β-boldenone (androsta-1,4-diene-17α-ol-3-one and androsta-1,4-diene-17β-ol-3-one) on the one hand, and of cortisol, cortisone (pregn-4-ene–17α, 21-diol-3,11,20-trione), androstenedione (androst-4-ene-3,17-dione; AED) and its precursors/metabolites epitestosterone and testosterone (androst-4-ene-17α-ol-3-one and androst-4-ene-17β-ol-3-one) on the other, as shown in Figure 1. In a previous study, we described the dehydrogenation of the androgenic steroids testosterone, epitestosterone and AED: saline-suspended faeces spiked with the examined anabolic steroids were analysed by HPLC-MS/MS and the conclusions were that neo-formation of dehydrogenated steroids can occur, ‘AED possibly being the pivotal compound giving rise to boldenone in contaminated urine’ through its transformation into ADD (Arioli et al., Reference Arioli, Gavinelli, Fracchiolla, Casati, Fidani, Ferrer and Pompa2008). Similarly, when we checked the dehydrogenation of cortisol and cortisone in faecal suspensions, we observed their transformation into prednisolone and prednisone, respectively (Arioli et al., Reference Arioli, Fidani, Casati, Fracchiolla and Pompa2010). The analogy with anabolic steroids could also regard a possible metabolic pathway as reported by Verheyden et al. (Reference Verheyden, Noppe, Vanhaecke, Wille, Vanden Bussche, Bekaert, Thas, Janssen and De Brabander2009), who occasionally found ADD – the C1–2 dehydrogenated analogue of AED – in human urine, supposing that its formation could be because of the consumption of phytosterols and because of increased redox potential in the gut. The endogenous production of C1–2 dehydrogenated steroids in man has also been demonstrated through the determination of the 13C/12C ratios of boldenone and its metabolite 5β-androst-1-en-17β-ol-3-one in 11 out of 23 urine samples by gas chromatography/combustion/isotope ratio mass spectrometry; Piper et al., Reference Piper, Geyer, Gougoulidis, Flenker and Schänzer2010). The production of corticosteroids, and of anabolic steroids in the adrenal gland, passes through common intermediate molecules like pregnenolone and progesterone. Moreover, adrenocorticotropic hormone regulates adrenal production of cortisol in the zona fasciculata and of androgenic steroids (i.e. dehydroepiandrosterone and ADD) in the zona reticularis (Schimmer and Funder, Reference Schimmer and Funder2011; Xing et al., Reference Xing, Edwards, Ahlem, Kennedy, Cohen, Gomez-Sanchez and Rainey2011), a phenomenon constituting another similarity between the two classes of steroids.
Endogenous steroids and dehydrogenated analogues.

The eventuality that feed-borne fungi, potentially living on animal feed, could convert phytosterols into probable precursors of boldenone – offered to cattle through their feed – has also been hypothesised in order to explain the endogenous boldenone formation in cattle (Verheyden et al., Reference Verheyden, Noppe, Zorn, Van Immerseelc, Vanden Bussche, Wille, Bekaert, Janssen, De Brabander and Vanhaecke2010). The possibility of an endogenous source of prednisolone was reported in a study (Noppe et al., Reference Noppe, Le Bizec, Verheyden and De Brabander2008), in which corticosteroids were measured in edible matrices, stating: ‘Besides the endogenous corticosteroids (f.i. cortisol, cortisone) and those suspected to be endogenous (f.i. prednisone, prednisolone)’. A study on the presence of corticosteroids in bovine urine reports the presence of prednisolone at an average concentration of 0.6 ng/ml in live control animals or live animals before treatment (5 of 72 samples;Ferranti et al., Reference Ferranti, Delli Quadri, Palleschi, Ferretti, Marchiafava, Pezzolato, Bozzetta, Caramelli and Draisci2011). Moreover, Andersen et al. (Reference Andersen, Hansen and Pedersen2008) showed the detection of prednisolone in 3 of 19 ‘blank’ bovine urine samples at concentrations of 13.0, 5.9 and 4.2 ng/ml, not specifying, however, whether the sampling was made on live or slaughtered bovines. The possibility of contamination of urine is in fact much higher when the collection is made from live animals rather than directly from the bladder. The possibility of false positives for prednisolone has also been encountered in human doping, under the aspect of microbial contaminations (Bredehöft et al., Reference Bredehöft, Baginski, Parr, Thevis and Schänzer2010), once again demonstrating that the problem exists.
In this work carried out with urine samples, both non-contaminated and contaminated by faecal matter, the observations already carried out on faecal suspensions were confirmed. Some tests were also carried out to determine whether Helix pomatia juice, which is frequently used to deconjugate the phase II metabolites, can interfere with prednisolone detection by favouring its production during the incubation period.
Experimental
Reagents and chemicals
Cortisol, cortisone, prednisolone, prednisone, flumethasone (as internal standard), β-glucuronidase Type HP-2, from H. pomatia aqueous solution, were purchased from Sigma-Aldrich (St Louis, MO, USA). All other chemicals were from Fluka Chemie GmbH (Buchs, Switzerland). Standard stock solutions in ethanol (1 mg/ml) were prepared and stored at −18°C; working solutions were prepared daily by dilution of stock solutions with methanol : water (50 : 50, v/v).
Sample collection and preparation
First trial – neo-formation of prednisolone
To investigate the C1–2 dehydrogenation of cortisol and cortisone, seven urine samples from 27- to 80-month-old Holstein–Friesian cows belonging to a larger batch, made up of 60 samples from Lombard farms, were used. The selection was made according to the prednisolone and prednisone concentration, which was always lower than their CCα values (0.4 and 0.5 ng/ml, respectively), and the concentration of cortisol, which was always higher than 80 ng/ml. The samples were collected using a sterile container kept far away from the body to avoid faecal contamination, cooled at 4°C and immediately transported to the laboratory and stored frozen at −18°C. A volume of 20 ml of each urine sample was incubated in a shaking water bath maintained at 37 ± 1°C. Aliquots of 2 ml were collected at 0, 2, 4, 6 and 24 h. An analogous experiment was conducted simultaneously on the same urine samples, after the addition of fresh faeces (0.2 mg/20 ml), to mimic poor collection conditions. The faecal matter had been randomly pooled just after collection. According to these procedures, the urine samples in this trial were named as ‘non-contaminated’ or ‘contaminated’ urine samples.
Second trial – influence of H. pomatia juice
Six urine samples from Holstein–Friesian cows with a detected and quantified prednisolone concentration of approximately 2 ng/ml were used to verify whether H. pomatia juice, which is often used to catalyse the deconjugation of corticosteroids, could induce unwanted transformations, as described regarding the production of AED from testosterone (De la Torre et al., Reference De la Torre, de la Torre, Alia, Segua, Baró and Torres-Rodriguez2001). Each sample was divided into three parts: one part was immediately extracted (control) and two parts were incubated overnight at 37°C in a shaking water bath; H. pomatia juice was added (50 μl/ml) to one of these latter two parts.
Sample extraction
A measure of 10 ng/ml of internal standard (flumethasone) and 4 ml of a mixture of tert-butyl methyl ether : ethyl acetate (80 : 20) were added to each 2 ml sample. After 20 min of shaking in a vertical rotary shaker, the samples were centrifuged for 20 min at 2000 × g. The upper organic layer was collected and dried under vacuum in a centrifugal evaporator. The residue was dissolved in 200 μl of a mixture of methanol : aqueous formic acid 0.1% (50 : 50, v/v) and transferred to autosampler vials.
LC-MS3 analysis
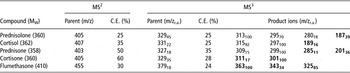
The chromatographic apparatus consisted of an AS autosampler and an LC pump Surveyor (ThermoFinnigan, San Jose, CA, USA). Separation was achieved using an Allure Biphenyl 100 mm × 2.1 mm i.d., 3 μm (Restek Corporation, Bellefonte, PA, USA) column, kept at 30°C, and an isocratic elution made with a mixture of aqueous formic acid 0.1% : methanol (40 : 60) having a flow rate of 0.2 ml/min. A Thermo LCQ DECA XP Max ion trap mass spectrometer (ThermoFinnigan, San Jose, CA, USA), operating in negative electrospray mode, was used under the following conditions: sheath and auxiliary gas (nitrogen) flow rates of 40 and 18 arbitrary units, respectively; a spray voltage of 5.50 kV; an ion transfer capillary temperature of 245°C; a capillary voltage of −23 V; and a tube lens offset of −77 V. Helium was used for collision-induced dissociation. The data were acquired in consecutive reaction monitoring mode; the parent ion was the adduct of the corticosteroid molecule with formic acid ([M+HCOO]−) and the following transitions were monitored (Table 1). Xcalibur™ data acquisition software from Thermo was used. The rationale for the use of MS3 is described elsewhere (Arioli et al., Reference Arioli, Fidani, Casati, Fracchiolla and Pompa2010).
Major ions in CRM mode for glucocorticoids analysed (C.E., r.a.)

Ions used for quantification are reported in bold characters.
CRM = consecutive reaction monitoring; C.E. = collision energy; r.a. = relative abundance.
Method validation
The method was validated according to the Commission Decision 657/2002/CE (European Community, 2002) in urine with seven concentration levels (0.2, 0.5, 1.0, 2.0, 10, 50 and 100 ng/ml), three replicates and 10 ng/ml of internal standard. The mean noise level was estimated in 20 unfortified samples. The four corticosteroids showed a linear relationship in the whole range of concentrations (0.984 ⩽ R2 ⩽ 0.990).
The CCα (decision limit) values were 0.4 ng/ml for cortisol, cortisone and prednisolone, and was 0.5 ng/ml for prednisone. Similarly, the CCβ (detection capability) values were 0.5 and 0.7 ng/ml, respectively. The intra- and inter-day coefficient of variations were 4.1 to 9.9 and 11.7 to 16.8, respectively. The recoveries, referred to the internal standard, ranged between 78% and 87%, except for cortisone, which had a recovery value of 114%.
Statistical analysis
In the first trial, the correlation between prednisolone, cortisol and cortisone was checked using the Pearson correlation test. The correlation coefficient, r, ranges between 1.0 in the case of a perfect relationship and –1.0 in the case of a perfect decreasing or negative relationship (anti-correlation). Generally, absolute values higher than 0.7 are considered as a strong correlation, from 0.3 to 0.7 as a weak correlation and from 0 to 0.3 as no or little correlation. The difference between prednisolone concentrations in non-contaminated and in contaminated urine was evaluated with the Wilcoxon matched-pairs signed-ranks test, preferred to the t-test because of the non-normal distribution. Statistical analysis of the second trial results comprised one-way ANOVA followed by the Student–Newman–Keuls post-hoc test. A P-value < 0.05 was considered significant. All analyses were performed using Instat® (GraphPad Software Inc., CA, USA).
Results
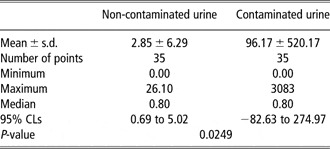
Prednisolone was always absent in samples at time 0; its neo-formation was observed in non-contaminated urine samples, with concentrations ranging from 0.5 to 26.1 ng/ml. The same occurred in contaminated urine, but the range was much wider: 0.5 ng/ml to 3.08 μg/ml. Cortisol concentrations ranged from 42.2 to 217 ng/ml in non-contaminated urine and from 0.6 to 1159 ng/ml in contaminated urine; cortisone concentrations ranged from 2.2 to 125 ng/ml and from 0.0 to 322 ng/ml, respectively.
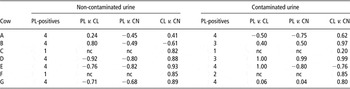
Each animal was represented by two sets of five urine samples (non-contaminated and contaminated), collected at different times: as at time 0 prednisolone was always absent, the maximum number of prednisolone-positive samples could be four in each set. When prednisolone was present in one or two samples per set, the correlation test was not considered. Cortisol was always detected, whereas cortisone was not detected in just one sample.
A strong correlation between cortisol and prednisolone mean concentrations was observed in four of the non-contaminated urine sets: three of them showed a negative value. One sample showed little association, whereas the remaining two were not considered.
The data were even more variable in contaminated urine samples; the range of concentrations was very wide and a strong correlation between prednisolone and cortisol was observed in two sets of samples, whereas a weak negative association was found in one set. The concentrations of cortisol and cortisone fluctuated over time and prednisone was detected in the 24-h sample, in two cows, at the concentrations of 150 and 614 ng/ml, respectively. All the results of the Pearson test are shown in Table 2.
Results of the Pearson test (expressed as r) performed on 14 different sets of urine (seven non-contaminated and seven contaminated), to check the correlations between PL, CL and CN concentrations in each set

PL = prednisolone; CL = cortisol; CN = cortisone; nc = not considered.
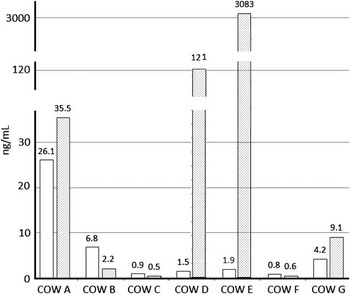
The comparison between prednisolone concentrations in non-contaminated and contaminated urine, checked with the Wilcoxon test, resulted in a significant difference, the P-value being 0.0249 (Table 3). In Figure 2, the maximum prednisolone concentrations detected in urine of each cow are shown.
Summary of data of the Wilcoxon matched-pairs signed-ranks test, comparing prednisolone concentrations (ng/ml) in non-contaminated and contaminated urine

Maximum prednisolone concentrations detected in non-contaminated (white bars) and contaminated (dotted bars) urine of each cow.

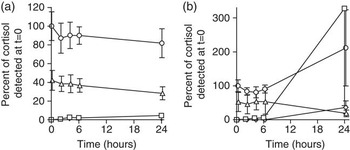
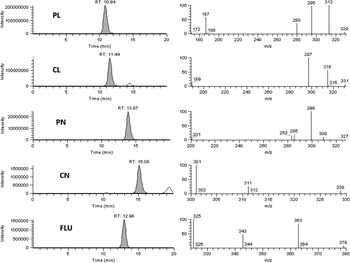
Figure 3 shows the changes over time in the average concentrations of corticosteroids in the urine of the seven animals, expressed as a percentage of the initial cortisol concentration; Figure 4 shows the chromatogram and the mass spectra of the corticosteroids detected (grey peaks) in one sample of contaminated urine.
Changes in cortisol ( ), cortisone (▵), prednisolone (
 ) and prednisone (◊) concentrations during incubation. The values are expressed as average percentages of initial cortisol concentration ± RSD. (a) Non-contaminated urine samples and (b) contaminated urine samples.

Chromatograms and MS3 spectra of the studied corticosteroids and the internal standard, as detected (grey peaks) in the contaminated urine sample from cow D at the 24-h collection. Each chromatogram is the sum of the diagnostic ions reported in the corresponding spectrum. PL = prednisolone; CL = cortisol; PN = prednisone; CN = cortisone; FLU = flumethasone.

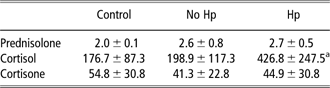
In the second trial, the concentrations of prednisolone and cortisone did not change significantly even after the overnight incubation both in the presence and absence of β-glucuronidase. In contrast, when incubated with the H. pomatia juice containing the deconjugating enzyme, cortisol showed a significant rise in concentration. Prednisone was never detected. The data are presented in Table 4.
Concentrations of prednisolone, cortisol and cortisone in six samples of cow urine before (control) and after incubation, in the absence (no Hp) or presence (Hp) of Hp juice
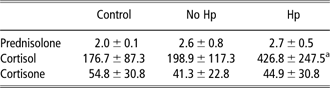
Hp = Helix pomatia.
Prednisone was not detected. Data expressed in ng/ml, as mean ± s.d.
aSignificantly different (P < 0.05) from cortisol-control and cortisol-no Hp.
Discussion
The storage of non-contaminated urine at 37°C induces the neo-formation of prednisolone. The concentration of this steroid at time = 0 was always lower than the CCα, both in non-contaminated and contaminated urine. The neo-formation observed in 22 non-contaminated and in 21 contaminated urine samples out of 56 samples was higher in the last ones, as shown by the Wilcoxon test results reported in Table 3. The variability was very high, the standard deviation being much higher than the mean. Moreover, when the data were averaged, based on time and not on individual animal, this variability was still evident (Figure 3) even if a negative relationship between the rise in prednisolone and the decrease in cortisol and cortisone concentrations in non-contaminated urine was graphically observed (Figure 3a). When cows were considered individually, the correlation between prednisolone, cortisol and cortisone was not evident, as the Pearson r-values were both positive and negative and showed strong or weak association (Table 2).
The time-based averaged data were even more contradictory in contaminated urine (Figure 3b), in which cortisone decreased in concentration, whereas prednisolone, cortisol and prednisone showed a ‘generalised’ increase, even if prednisone was only detected in two of the 24-h samples. This ‘graphical observation’ supports the results of the Pearson test obtained on contaminated urine, which showed an even more variable situation than in non-contaminated ones. The correlations were in fact both negative and positive, and the absolute values showed strong, weak or no associations (Table 2).
All these data partially confirm what was shown in previous work carried out on faecal suspensions, in which an increase in prednisolone and prednisone concentrations was always observed, accompanying the decrease in added cortisol and cortisone. In this work, however, there was not an evident negative correlation between prednisolone and cortisol. The difference in the matrices must therefore be considered: faecal suspensions in water or urine and the different chemical–physical characteristics of urine belonging to different animals.
The results obtained in the second trial can be interpreted as evidence that cortisol is present in bovine urine both in its free and conjugated form. When juice from H. pomatia was used, there was a significant increase in cortisol concentration (P < 0.05); this result is contradictory to the data of Antignac et al. (Reference Antignac, Le Bizec, Monteau and André2002), who observed in two animals that cortisol in bovine urine is almost entirely in its free form (92% and 98%). The possibility that neo-formation of cortisol occurred must be discarded: an increase in cortisol concentration was not seen in the samples incubated without H. pomatia. For the purposes of this study, this observation had a low importance: cortisol, unlike prednisolone, is not a relevant corticosteroid for residue control in food-producing animals. In this trial, prednisolone did not appear to be present in a conjugated form. Our data, if further confirmed, could allow removal of a step in the sample preparation and purification procedures.
It has to be noted, however, that the prednisolone concentration did not increase at any time in the second trial during incubation both with and without H. pomatia. This in turn conflicts with our observations in the first trial with regard to the neo-formation of prednisolone (Figure 3). The data from the two trials further show that the neo-formation of prednisolone may take place in urine after collection, even though this is only a possibility, probably depending on the temperature, length of storage or incubation and amount of faecal or environmental contamination, analogously to that observed for anabolic steroids in previous studies (Arioli et al., Reference Arioli, Gavinelli, Fracchiolla, Casati, Fidani, Ferrer and Pompa2008).
However, published evidence on the endogenous or natural (i.e. of non-illicit origin) presence of prednisolone in bovine urine is very scarce. Two suppositions about the unusual frequency of prednisolone-positive bovine urine in Northern Italy were made. The first was that prednisolone appears or increases to detectable concentrations when the animal is stressed. In a previous study (Pompa et al., Reference Pompa, Arioli, Casati, Fidani, Bertocchi and Dusi2011), the role of stress, both pharmacologically induced or caused by slaughter operations, on inducing the presence of prednisolone in bovine urine together with an increase in cortisol and cortisone concentrations was shown.
The second supposition regarded the formation of prednisolone in urine outside the body. In this work, and in the preliminary study (Arioli et al., Reference Arioli, Fidani, Casati, Fracchiolla and Pompa2010), we demonstrated this possibility, although the variability between different samples was high.
The results of our studies, together with the 2007 to 2009 data from Piedmont and Lombardy discussed in the introduction, indicate that endogenous or natural prednisolone may be detected in urine.
The assumption that the presence of endogenous prednisolone is caused by higher concentrations of precursor steroids, deriving from food or from stress conditions, is, at the moment, as likely as the supposition that prednisolone has a natural origin due to microbiological activity after sample collection.
Conclusion
The seven samples we used for this study belonged to a wider batch of 60 samples. The remaining 53 samples showed the presence of prednisolone and/or prednisone at concentrations higher than the CCα or CCβ (10 and 16, respectively). The frequency of positives is therefore about the 50%, a value indicating the importance of the topic presented in this study and the need of further studies to verify whether inadequate storage temperatures, or the enzymatic deconjugation itself, may give rise to results that are not representative of the actual urinary presence or concentration of the studied steroids, thus leading to incorrect accusations of non-compliance.
Acknowledgements
This work was carried out with a grant from the Regione Lombardia for the Research Project: ‘Presenza e persistenza di farmaci e ormoni nelle deiezioni animali e nel liquame per il potenziamento dell'attività di farmacosorveglianza’.