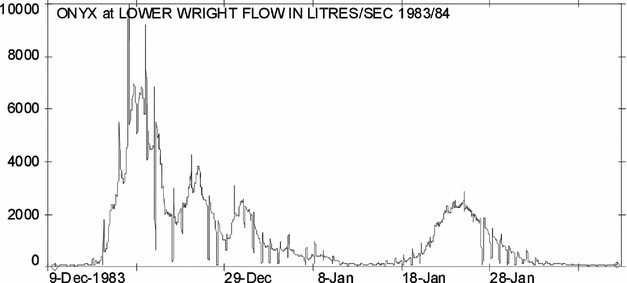
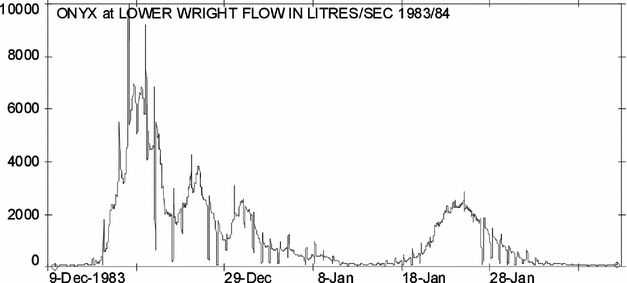
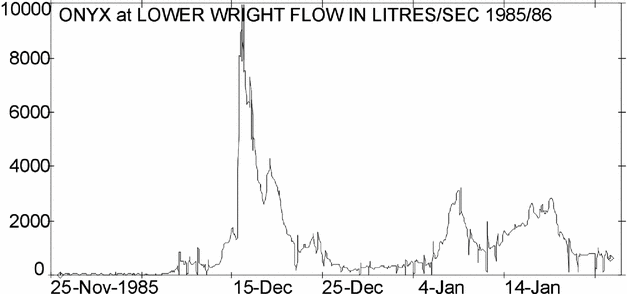
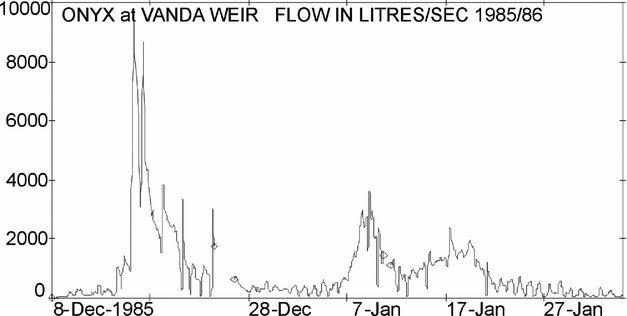
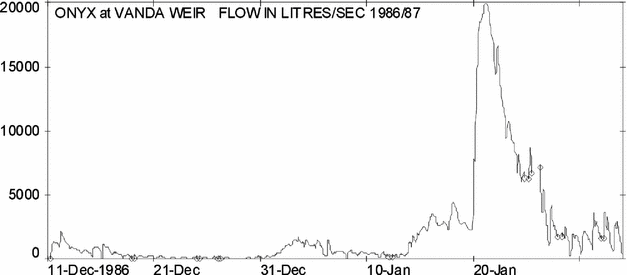
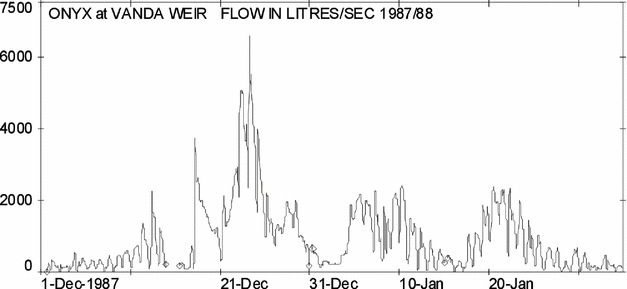
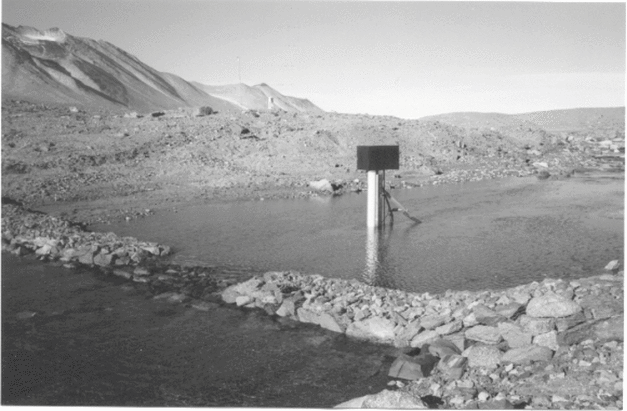
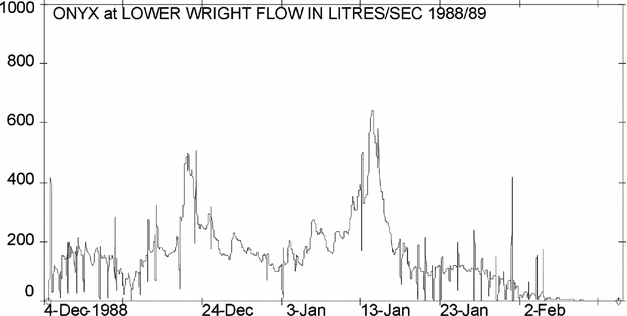
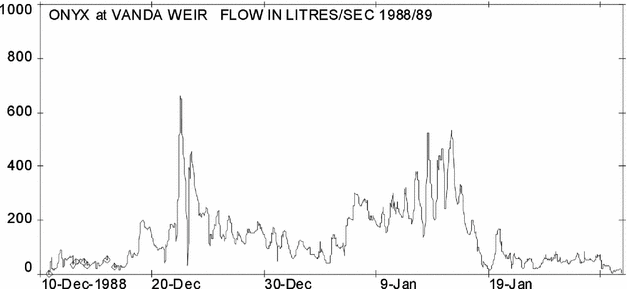
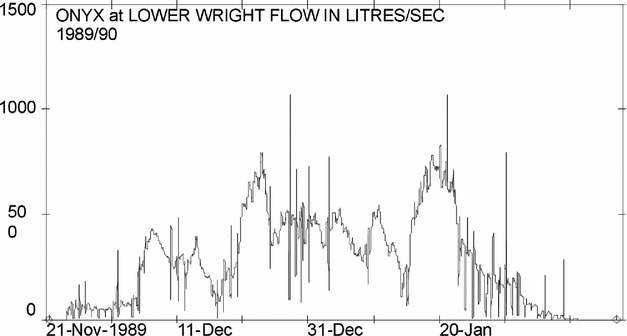
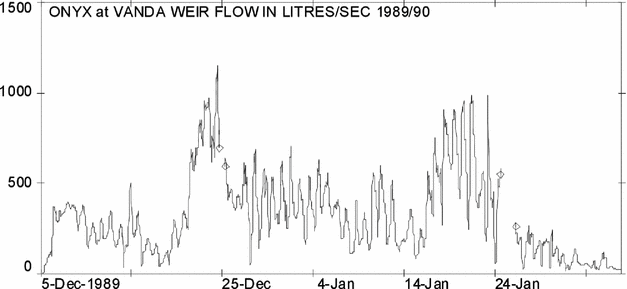
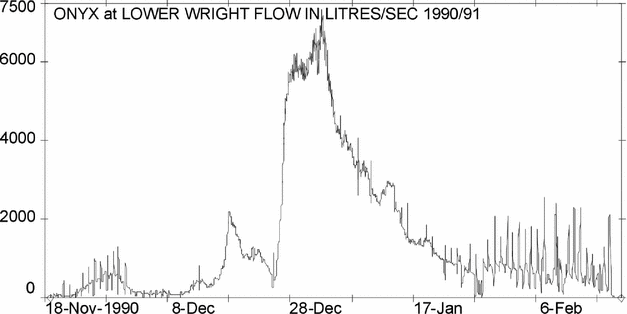
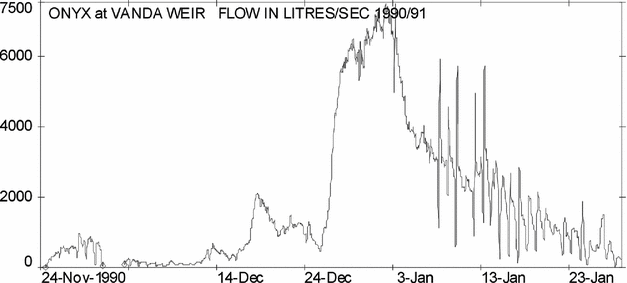
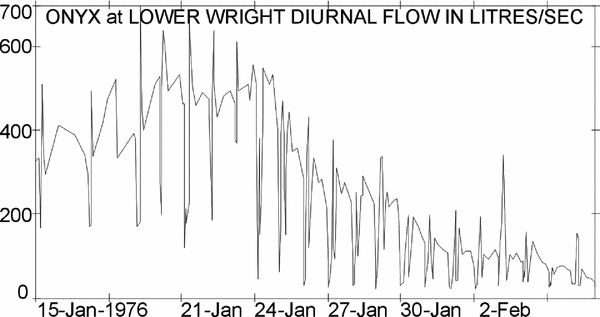
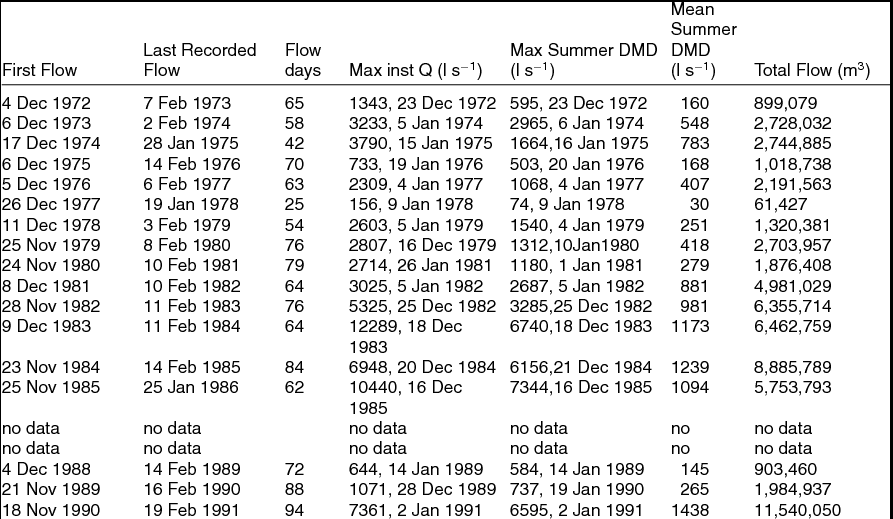
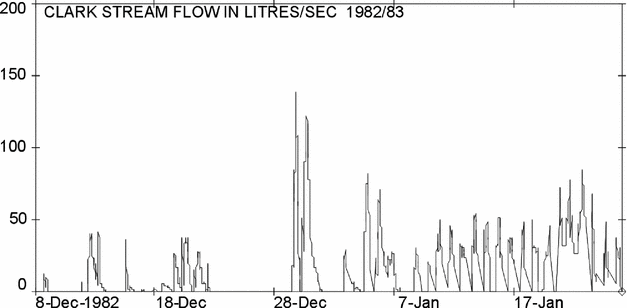
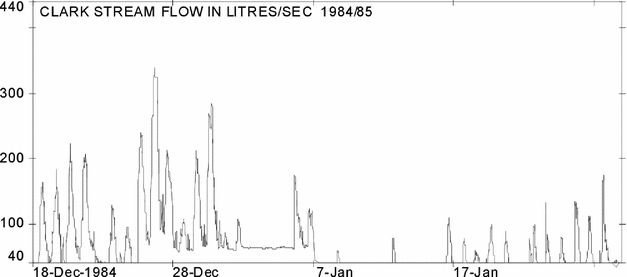
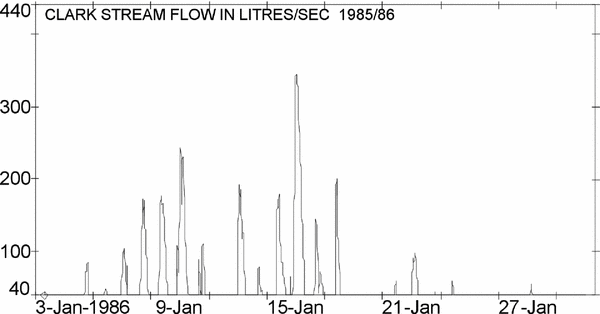
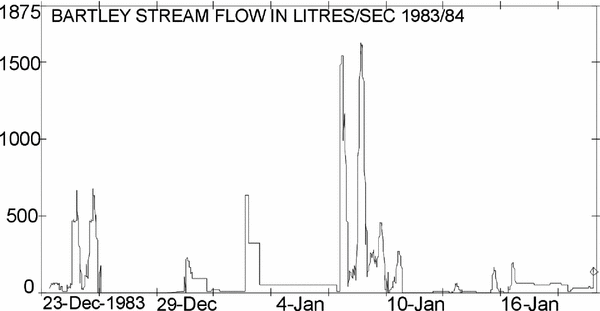
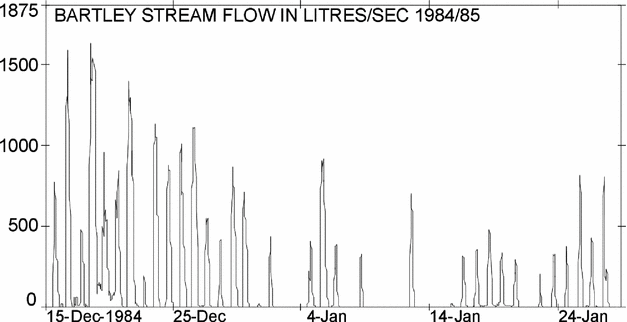
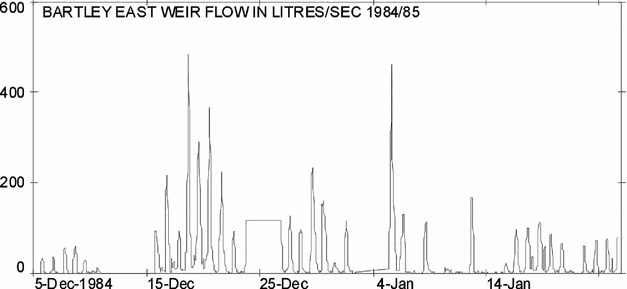
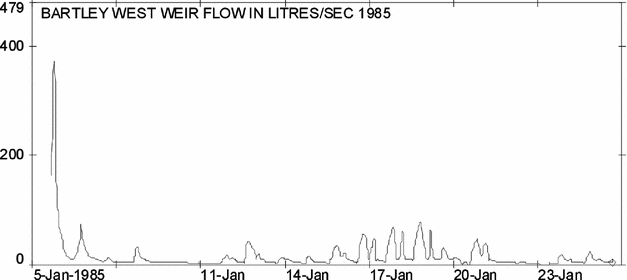
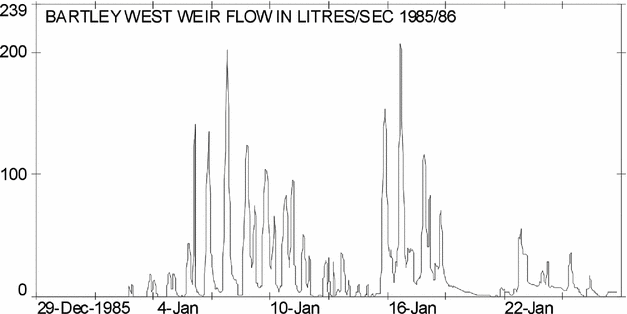
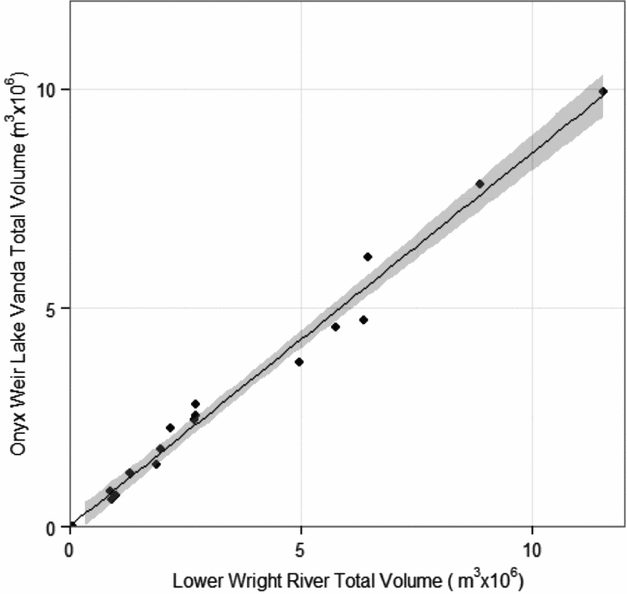
Methods employed were those of the N.Z. Hydrological Survey of that era and represent the transition from traditional manual flow gauging measurements and recording to electro-mechanical instrumentation, but without the later advances toward modelling, telemetry and remote sensing. Thus the data represent a rare set of ‘real time’ measurements made on site on observed events that may provide a unique manual set of data available for the calibration of current hydrological models.
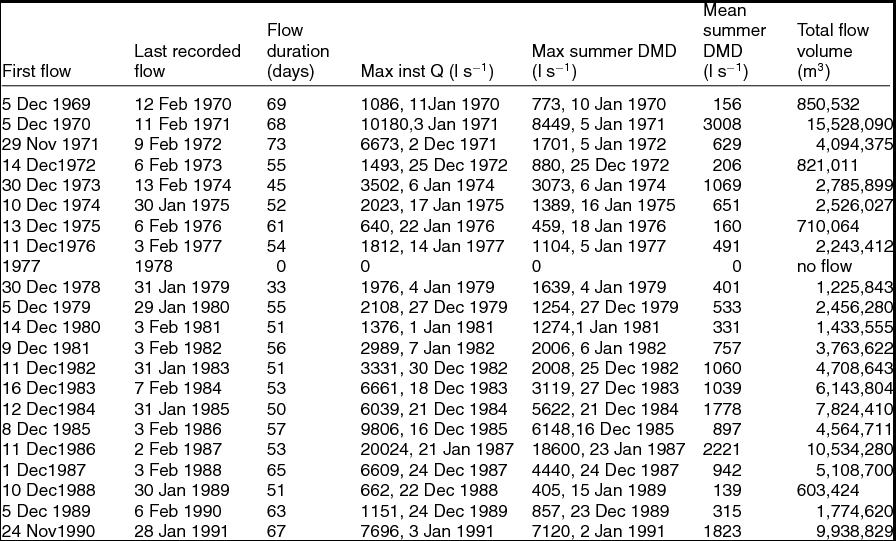
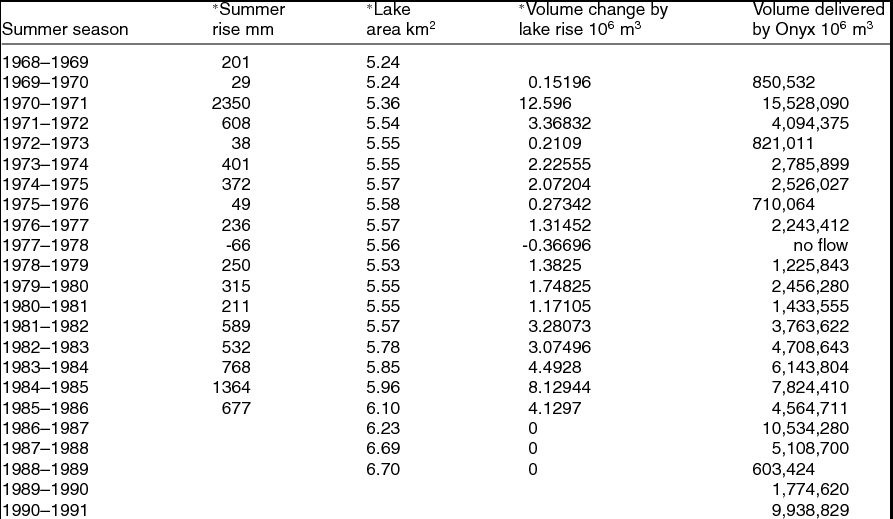
The annual flow records immediately demonstrated that although the summer discharge volumes were widely variable, the summers were only just warm enough to pass the threshold of providing some melt-water to the streams, indicating that the entire hydrological environment was very sensitive to very small changes. Such was the sensitivity of the environment that poor results from coarse correlations were misinterpreted as poor analyses. The record includes years of no flow to years of major floods. These floods were found to be in two categories; those produced by warm summers; and those resulting from glacier ice-dam failure. Throughout the entire period of the this study, the steadily increasing average annual discharge volumes recorded in great detail the persistent progress of global warming.
Contents
Because of the long 25-year chronology of annual data sets, this work deviates from the conventional scientific presentation sequence, and presents the methods and observations of each summer season in one section of both method and observations followed by a second section of particular results, and a third section on discussion and conclusions. The following abbreviations are used throughout: NZARP = New Zealand Antarctic Research Programme; MWD = Ministry of Works and Development, (NZ) organisation that supported this work and produced the annual numbered WS reports (WS = Water and Soil Division). DSIR = Department of Scientific and Industrial Research (NZ); USARP = United States Antarctic Research Program; DOSLI = Department of Survey and Land Information (NZ); RL = survey reduced level or measured height; USGS = United States Geological Survey; NIWA = National Institute of Water and Atmospheric Research Ltd. (NZ); LTER = Long-Term Ecological Research (USA); TIDEDA = TimeDependentData, a computer programme for handling hydrological data (NZ); LWR = ’Lower Wright’ the name of the Onyx River flow-gauging site near the Wright Lower Glacier; DVDP = Dry Valleys Drilling Programme that sampled sediment structures of Dry Valley floors; Units of water discharge (Q) are given in either litres per second written as l s−1, or cumecs, for large flows, where 1 cumec = 1 cubic metre per second, written as cubic metres per second. (1 cumec = 1000 l s−1). DMD = Daily mean discharge or average of all flows measured in one day. Dates, durations and times given of both survey and hydrological activities are for the measurements themselves and not for the entire event duation, for example lake levels are those made at the time the surveyor happened to be available and not at the time of lake level change.
1. Hydrological work carried out each summer season
Work took place each summer from 1969–1970 to 1994–1995. Certain summers require a special note as stated below.

II. Results and procedures from each summer season presented site by site in downstream sequence
1. Lower Wright glacier meltwater channels
1. Results: Onyx at Lower Wright.
2. Results: Onyx channel and tributaries
3. Results: Onyx at weir.
4. Lake Vanda
5. Water balances
III. Discussion and conclusion
Introduction
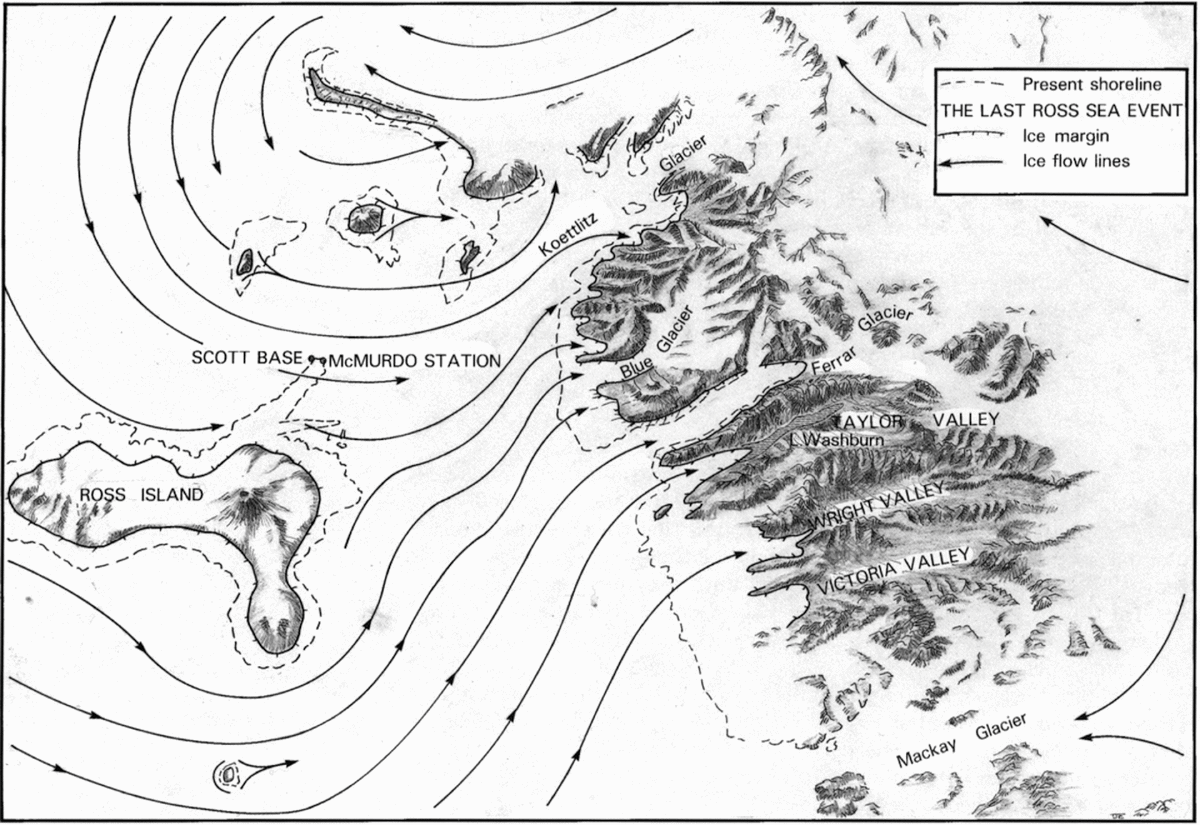
The Dry Valleys area of McMurdo Sound (Fig. 1) is a dry rocky area of about 4,500 km2 that has been called an ‘oasis’ in a desert of ice. It comprises three main east-west oriented valleys: Taylor, Wright and Victoria Valleys separated by mountain ranges of heights of up to 2,500 m. The valleys are of late Miocene age that were formed by ice erosion of pre-existing river valleys. The ice sheet withdrew from its largest size, which overflowed the entire Dry Valleys system, some 10 to 15 million years ago, to behind the high western threshold of the valleys. This left the main ranges separated by fiords. The subsequent Pleistocene glaciations that engulfed other parts of the world did little to this area. The increased cold generally caused less snowfall, causing the inland ice sheet to shrink, but expanding coastal ice cover. One effect of this Pleistocene increase of coastal ice area was to thicken the floating McMurdo ice shelf until it grounded and tongues of ice flowed from the sea, inland up the mouths of each of the Victoria, Wright and Taylor Valleys (Denton and others Reference Denton, Armstrong and Stuiver1970, Reference Denton, Prentice, Kellogg and Kellogg1984; Stuiver and others Reference Stuiver, Denton, Hughes, Fastook, Denton and Hughes1981). There was a number of these marine ‘Ross Sea glaciations’ occurring synchronously with the Pleistocene glaciations. Associated with these glacial events was extensive hydrological activity as, despite the cooler climate, meltwater filled each of the Dry Valleys with lakes (Fig. 2). The first of the Dry Valleys was discovered by accident during Scott's Discovery Expedition in 1901–1904 when an exploring party caught in cloud, stumbled down into the Taylor Valley. The Taylor Valley was not revisited until 1911, while the Wright and Victoria Valleys remained unseen for a futher 43 years when United States and New Zealand aircraft flew over the area between 1955 and 1958.
Dry Valleys location map (Molenaar Reference Molenaar1985).
The Dry Valleys during the Pleistocene ice age showing ice flow from the grounded McMurdo ice shelf flowing from the coast westward into the valley mouths where meltwater fed the large enclosed lakes of each valley.
The Onyx River (Fig. 3) was named by C. Bull and R. Barwick who made the first exploration of the Wright Valley in 1958–1959. According to David Harrowfield, (personal communication, December 2014) in a discussion with Colin Bull, on 8 August 1997, on the origin of the name which was given like this;
The Onyx river, flowing westward between the Asgaard and Olympus Ranges, from the terminus of the Wright Lower Glacier into Lake Vanda.
CB. ‘We had a fatuous discussion of the name of the river Onyx’.
DH ‘Why did you call it Onyx?’.
CB ‘Because I like the juxtaposition of the letters O, N, Y and X. . .and it calls to mind the Styx.’
DH ‘What does Onyx mean?’
CB ‘It doesn't mean anything but it is a semi-precious stone’.
The river is a unique melt-water stream that flows only in summer. It arises from a coastal piedmont glacier (Fig. 4) flows inland down a glaciated valley, the Wright Dry Valley, of permafrost-patterned ground, for 30 km to enter an enclosed lake that has a 2 to 3m thick permanent ice cover over solar heated thermo-haline stratified waters that are warmed to 25°C at the lake bottom. Water balance is maintained when the Onyx total summer inflow volume equals total annual volume lost from the lake surface to evaporation and ice sublimation. This hydrological environment in which melt only occurs at the upper threshold of summer temperatures, in which seasonal snow cover has no contribution to flow, in which permafrost means no gain or loss to a groundwater system, presents stream discharge measurements as straightforward as anywhere on earth, except for one problem, the regular diurnal freezing of the channel and recording structures. An additional benefit to the hydrology of this unique system is that the total river discharge is captured in a single basin Lake Vanda (Fig. 5) named by C. Bull after one of his sled dogs on his British North Greenland expedition, 1952, with effectively zero additional input from streams or groundwater. Thus the Dry Valleys of Antarctica provide a unique and detailed site for recording climate change that is conveniently located.
Eastward view of Lake Vanda towards the alpine glaciers of the Asgaard Range. Vanda Station and the nearby flow measuring weir in the middle distance. The Ferguson tractor is travelling on the 3m thick annual moat ice that surrounds a permanent ice cover.
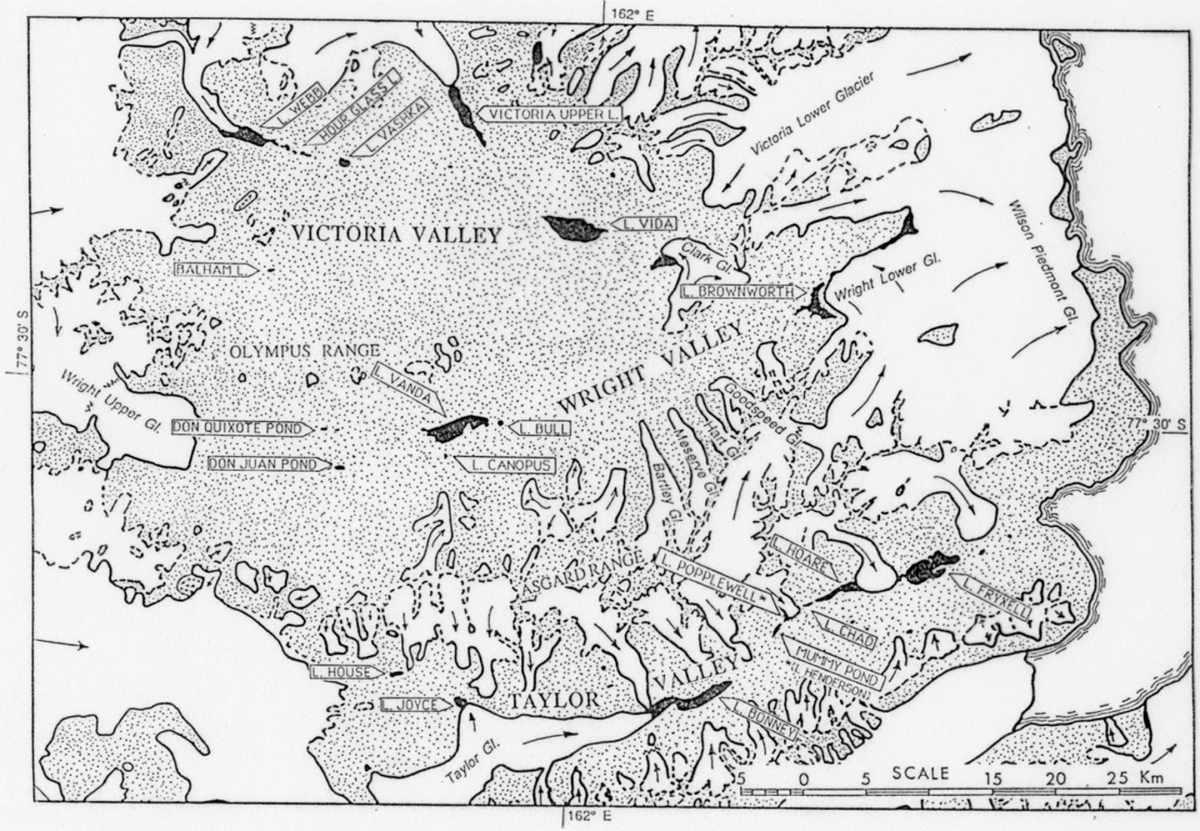
Possibly the most hydrologically valuable pieces of this unique topography are the many enclosed lakes (Fig. 6). Each of these lakes captures its individual supply of meltwater runoff to provide a uniquely accurate measure of summer runoff and hence climate. Compared to the complexity of hydrological studies of rivers, these lakes provide a single figure, their change in volume, that is a single annual measure of the year's climate. In addition, these lakes hold data on past climates as high levels of fossil beaches, and contain internal layering that records past lower levels.
Lake Vanda and nearby enclosed lakes (black areas) all of which have no outlets to the ocean.
This work has been compiled to enable general publication of the inaugural Antarctic hydrological achievements of 25 years of work on the Onyx by hydrologists of NZARP. Prior to the present publication these data have only been available as MWD annual reports and by mention in a few scientific papers. The data are presented here to publish the full content of the initial 25 years of hydrological work done in the Wright Dry Valley, and to identify the location and type of the data held by the NIWA archive. All of this data has been systematically checked and filed on the hydrology server of NIWA (http://www.niwa.co.nz).
In 1968 NZARP established a research station at Lake Vanda transporting the base accommodation building, laboratory and accessories, by driving a tractor train of sledges from Scott Base across 90 km of sea ice, over the Wilson Piedmont and Wright Lower Glaciers and up the Wright Valley to Lake Vanda. Once Vanda station materials had been towed down the length of the Wright Valley by tractor train and assembled in 1968–1969, the flow-measuring weir was installed early the next summer season and this programme commenced. Flow measurements had to be concluded in 1995 when both Vanda station and the weirs were removed. Observations of the Onyx flows have been continued by USARP personnel, who are carrying out additional hydrological work at several additional sites in the McMurdo Dry Valleys and elsewhere in Antarctica. However the necessary size limits and aims of this paper make it impractical to amalgamate with, or even refer to, the plethora of more recent Antarctic hydrological projects from which we can expect many further publications.
The hydrology of the Onyx was only a part of this programme as each year the levels of enclosed lakes in adjacent valleys were measured (Chinn Reference Chinn, Green and Friedmann1993) and about half of each season was spent on glaciological studies including glacier mass balances, ablation measurements and glacier front fluctuations. Each of these activities was surveyed as necessary.
Climate
At 77o S, the climate is fully polar, with temperatures ranging between +5 and –50oC (Bull Reference Bull and Rubin1966; Bromley Reference Bromley1985, Reference Bromley1986). The valleys are ‘dry’ because of extremely low polar desert snowfalls combined with no through-flow of ice sheet outlet glaciers (Chinn Reference Chinn1981b). There is data available for 3 full years from winter-over staffing of Vanda Station (Thompson and others Reference Thompson, Craig and Bromley1971; Thompson Reference Thompson1972; Riordan 1973; Sansom Reference Sansom1984). The Trans-Antarctic Mountains provide a precipitation shadow effect in which precipitation everywhere is less than sublimation except where topographic cirques and hollows provide snow accumulation niches that contain the present local glaciers. In addition to minimal precipitation, a high threshold along the Trans-Antarctic Mountains has dammed almost all ice flow from the ice sheet. The higher humidities from summer open water along the coastline provide snowfalls that maintain coastal piedmont glaciers. Because the summer temperatures barely cross the melting threshold, the hydrological systems are very sensitive to extreme climatic events (Chinn Reference Chinn1979a).
The Onyx River (Fig. 4)
The Onyx is a meltwater stream that flows for 2 to 3 months in summer from the coastal Wilson Piedmont Glacier, inland for some 30 km over permafrost polygon gravels and boulder-fields, into Lake Vanda, an enclosed lake with no outlet. Meltwater from tributary alpine glaciers along the valley sides (Chinn Reference Chinn.1980a) contributes relatively small amounts of the inflow. The stream bed changes from a channel in a bouldery moraine to a mainly braided bed in fine alluvial gravels (Shaw and Healy Reference Shaw and Healy1980). Towards Lake Vanda, bedload alluvium has yet to fill the rocky felsenmeer valley floor formed by permafrost ice-wedge movement, and there are some large ponding areas in glaciated depressions.
The final channel is through broken bedrock into Lake Vanda. The river is of particular interest because it is the largest of the very few streams that occur in Antarctica. It is the only river that has been studied where the streamflow is derived entirely from melt of glacier ice with no snowmelt or rain contribution, and because each annual flow is captured in a lake with no outlet.
Lake Vanda (77°32’S, 161 °40’E; Figs. 5, 6) is about 8 km long by 2 km wide with a maximum depth of 66 m. The lake has a permanent floating ice cover about 3–4 m thick that develops an open moat around its shoreline each summer. There is no outlet from the lake and water loss is entirely by evaporation and sublimation. Below the ice cover, saline layers mark previous lower levels, each increasing in salt concentration so that bottom waters are near 10 times as salty as sea water (Fig. 7). The first limnological reconnaisance of Lake Vanda was made in summer 1960–1961 and the physical, chemical and thermal properties of Lake Vanda have since been discussed by many workers (Wilson and Wellman Reference Wilson and Wellman1962; Armitage and House Reference Armitage and House1962; Angio and Armitage Reference Angio and Armitage1963).
The unique thermohaline stratified structure of Lake Vanda (Hatherton Reference Hatherton1990: 153).
The processes within these ‘solar trap’ lakes as summarised by Vincent, (Reference Vincent and Viner1987) are that during the summer, solar energy penetrating the ice cover enters by radiation but can only escape by conduction and is trapped and stored in separate thermo-haline density layers in which the different densities prevent water overturning. The resultant solar heating maintains the bottom temperature at 25°C in contrast to the mean annual air temperature of about –20°C at the surface (Fig. 7).
Wilson (Reference Wilson1967) noted the old strand lines on the northern shores of the lake that represent old lake levels where a preliminary radiocarbon date of the highest bench at 60.5 m above the 1970 level was recorded at 2350 years BP (Cutfield Reference Cutfield1974). The levels of Lake Vanda provide a unique measure of the Onyx River water input volumes balanced by a nearly constant annual evaporation/sublimation loss of approximately 500 mm, (Chinn Reference Chinn, Green and Friedmann1993; Fig. 7).
Previous work
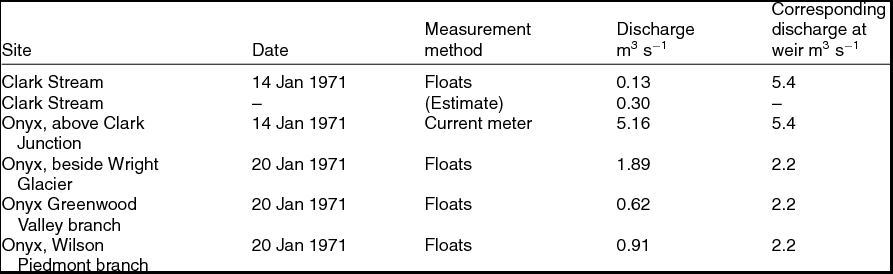
Research teams have been active in the Wright valley only since 1957. The first few discharge estimates, made to demonstrate aridity, were made by Colin Bull in the 1958–1959 summer (Table 1), when he predicted an 18 cm rise, in Lake Vanda. The rise to the end of summer was only 9.5 cm and he attributed the difference to the evaporation rate (Bull Reference Bull and Rubin1966). He estimated the Lake Vanda mean seasonal inflow volumes to be 1.5 106 m3 and the maximum up to three times greater. Peak discharges of 4–5 m3 sec−1 were measured during the 1961–1962 season (Calkin and Bull Reference Calkin and Bull1967). From seventeen flow gaugings carried out in 1968–1969 Cutfield (Reference Cutfield1974) calculated the total inflow for the season to be in the order of 5.55 106 m3. While the Vanda Station was being constructed in 1968–1969, a site for the flow measuring weir was surveyed by C. Hughes. The v-notch weir was installed near the station early in the following 1969–1970 summer season.
Summary of first observations of Onyx River flows.

*Q = stream discharge in volume per second units, either litres per second (l s−1) or cubic metres per second (cumecs).
1. Hydrological work carried out each summer season
During each summer season, the teams involved with this hydrology-glaciology programme carried out multiple glaciology, lake levelling and surveying work in addition to studies of the Onyx hydrology. This paper is limited to the work carried out on the hydrology of the Onyx and its tributaries, and their relationships with Lake Vanda. Only the Wright valley hydrological work carried out each summer season on this programme is documented, summer by summer, giving the work carried out at each site. The summer hydrographs measured from each of the Lower Wright and weir sites are included in this section to simplify annual cross referencing between personnel, flow charcteristics, and work carried out. The figures in this paper are numbered seriatim.
The 1969–1970 summer (Gousmett Reference Gousmett1970)
Personnel were A. Heine, K. Gousmett, A. Eskrick and G. McGillvray.
Field programme
Heine planned and carried out the initiation of this programme of hydrological and glaciological work. On this first summer, the main work was the construction of a v notch flow measuring weir across the Onyx, followed by installing, surveying and setting up automatic recorders. There was measurement of river and lake water levels and changes in the ice cover on the lake to complete the topographic survey of Lake Vanda.
Onyx at weir
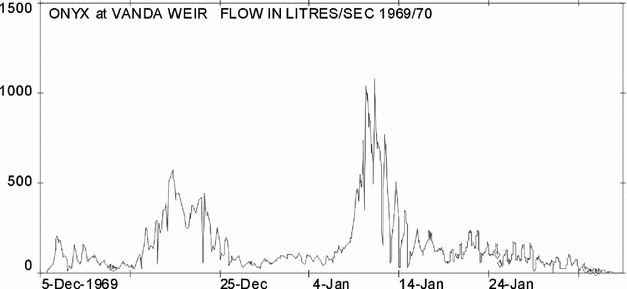
Gousmett and McGillvray selected a site on the Onyx most suitable for flow measurement control and immediately began the necessary excavations. The solid permafrost of the boulder-filled riverbed was difficult to excavate and a pneumatic drill was used to break up the larger rocks. Eventually after two and a half weeks of slow work, they had excavated a 6-inch trench across the riverbed. The timber framing and formwork for a plywood weir was then set out across the site. Concrete was not used as it may chemically contaminate the lake, and, following a winter, the structure would be cemented in by permafrost. With the weir structure nearly complete and the arrival of the river imminent, Heine and Eskrick assisted with the final construction which was completed at 18:00 just before the first water arrived at 20:30. Flow through the notch began half an hour later and recording equipment was installed the following day (Fig. 8). Continuous recording of the flow was made until 12 February when the river flow ceased (Fig. 9).
1969–1970. The first flow of the season passing through the V- notch of the measuring weir across the Onyx near Vanda Station. It was hoped that the ‘hood’ over the notch would reflect radiation downward to melt any ice accretion.
1969–1970. Onyx at weir Instantaneous discharge record.
The channel and tributaries
To establish the sources of the Onyx water, Heine and Gousmett travelled east by tractor from Vanda Station to the Lower Wright Glacier to inspect each side stream and estimate their water discharges. Water samples were collected twice weekly for both suspended sediment and chemical analyses.
Lake Vanda
After permanent bench marks were installed at the eastern end of Lake Vanda during the previous (1968–1969) summer, the true water level of the lake was re-measured. While working at the lake edge, Heine noticed a sudden surge in the water level. Further measurements established the existence of a ‘seiche’ movement of the lake surface (Heine Reference Heine1969; Reference Heine1971). It was then decided to install a water level recorder at the lake edge to take a continuous record of these oscillations. The considerable movement was easily correlated with wind speeds in the valley, and it was found that with wind speeds of 30-40 knots, the lake water level would swing by as much as 15 to 20 cm. During windless periods, the water level would usually (but not always) remain fairly constant. Summer lake level changes are given by Chinn (Reference Chinn, Green and Friedmann1993).
The Lake Vanda levels. Ideally the water levels on the lake should be surveyed at the times of the first and last flows into the lake from the Onyx. Such timing is impossible, and the dates given with the Lake Vanda levels are for when the surveys were made which should be compared with the Onyx Weir hydrograph plots for comparison with flow activity.
The 1970–1971 summer (Chinn Reference Chinn1980b)
Personnel were T. Chinn, G. Baker and A. Eskrick.
Field programme
Continuous flow recordings were made at the plywood V-notch weir and water levels of Lake Vanda. Water samples were taken over a greater part of the discharge range to measure the suspended sediment concentration. A number of flow measurements were made in the upper reaches of the river, and a levelling traverse was made from Vanda Station out to the sea at the Bay of Sails.
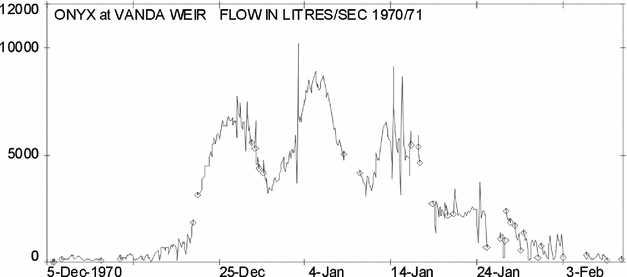
The season was one of unusually high flows that overtopped the weir structure for most of the season. This event led to a considerable loss in the accuracy of the flow measurements, and a second flow measuring site had to be established by bridging the Onyx downstream of the existing weir. The construction of this bridge during the high flows was an interesting exercise. From both sites a full set of daily mean flows was obtained and a value for the total volume discharged into Lake Vanda, was calculated.
Onyx at weir
Flows were again recorded on a Lea water-level recorder which had an 8 day chart, with a 1:1 direct drive from the float giving a high degree of sensitivity (Fig. 10). The weir itself had suffered no apparent damage over the winter period, although a small degree of buckling was apparent. A structure of this nature situated across a stream bed over permafrost will always be subject to annual thaw and freeze of the active surface layers. This strain will be resolved in directions mainly at right angles to the axis of the stream bed. In anticipation of slight outward movement of the ends of the weir structure, flexible sealing strips were prepared to cover any joint cracks which may have occurred when the site refroze.
1970–1971. Onyx at weir Instantaneous discharge record. Small circles mark spans of missing or incorrect record.
To prevent any further movement, hand-placed rock buttresses were built each side of the notch. This was a move that was possibly a major factor in preserving the weir from being destroyed when it was overtopped later in the summer (Fig. 11).
1970–1971. The first of many overtopping events at the weir which occurs at flow of approximately 2 cumecs.
Seasonal flow pattern
Soon after flow commenced, a series of cool overcast days contributed to ice collecting on the weir notch, thereby giving erroneous discharge values. With low flows towards the end of the season, icing problems again occurred. This problem was not relieved to any noticeable extent by use of a radiation hood (1969–1970 report). Icing occurred when water temperatures were at or possibly slightly below freezing point. Under these conditions the water carried a mush of platelet ice crystals, of similar shape and size to confetti. With the sudden change in velocity and pressure in the flow over the notch, these crystals would accumulate at the bottom of the fall and build up against the main stream in a spongy accretion, until the notch was obstructed.
The river exhibited a ‘normal’ flow pattern until 20 December, when discharges began to increase markedly, and at about 2400 on 21 December, the weir was overtopped at a discharge of approximately 2 cumecs measured at 1.9 m3 s−1, and remained overtopped throughout the season until about 19 January when the daily low flows began to fall below the weir crest level. The final overtopping occurred on 28 January. At the season's peak a discharge of 9.91 m3 s−1, (350 cusecs) occurred on 3 January, the weir was overtopped by 26 cm. From about 28 January the flows dropped progressively each day until the party closed the site and left the area on 2 February. Flows continued for an unknown period after this date, but from the recession rate and the previous year's pattern, this is estimated at between 3 and 5 days. The volume of water involved would be an insignificant fraction of the total discharge for the season.
Immediately after the weir was overtopped the downstream side of the weir was backfilled with rock, with the assistance of the Vanda station staff, (Fig. 12) to prevent further scouring from anticipated higher flows. On two occasions, 27 December and 3 January, as a result of high flows, scouring occurred around the eastern end of the weir structure. This damage was stabilised by rock filling.
1970–1971. Alarmed by the first weir overflow, the Vanda staff were co–opted into the ‘save–the–weir’ emergency rock tossing.
Once the weir was overtopped, the existing ratings did not apply and another stage-discharge relationship had to be established. The water level recorder was kept operating at the weir, where, although the site was relatively insensitive to changes in discharge, the recorder with its direct drive from the float to the chart, was very sensitive to changes in water level. The usual loss of records due to mechanical stoppages, etc, was encountered, together with float obstruction in the upper recorder stand framework, but no specifically Antarctic environment problems were encountered.
The gauging bridge
A flow measuring site was selected about 0.4 km downstream of the weir, and although the bed was very rough, it was the only suitable site available. The river was too deep to make flow gaugings by wading, so during 27 and 28 December the 12 m width of channel was bridged with any available scrap materials (Fig. 13). Lack of suitable timber and high flows both made this a difficult undertaking. A cutoff channel had to be excavated to ensure that all the flow passed through this site. A staff gauge was established at this bridge, and as many daily readings as possible were made to establish a firm relationship between the stage at the bridge and that recorded at the weir. As both sites were not very sensitive to fluctuations in discharge, clear plastic tubes were installed vertically on each staff gauge. These damped out surges and waves, giving a greater accuracy to the staff gauge readings. The surprisingly massive discharge experienced this summer lifted the level of lake Vanda by just over 2m, complicating access to the water level recorder (Fig. 14).
1970–1971. Baker measuring the discharge on the flood gauging bridge using a bucket–type current meter. Lake Vanda in background.
1970–1971. The rising Lake Vanda provides a challenge to keep the recorder operational.
Flow records
Nine flow measurements were made from the bridge over a wide range of discharges, from which a stage-discharge relationship was established. Individual velocity measurements for each flow gauging were made from the same points on the bridge, so that individual velocity curves for each vertical could be plotted to reduce errors. All flow measurements were made by a Watts-type current meter.
Daily mean discharge calculations
These were made from the three different stage-discharge rating curves constructed for the site. The main curve was for the v notch, then a second was constructed from the bridge gaugings for when the weir was overtopped and a third had to be constructed for the period after the flood to include subsequent scour leakage around the ends of the weir.
The channel and tributaries
The river is composed entirely of glacial meltwater as the area is very arid and normally the valley is completely bare of any snow; rainfall is unknown and snowfalls average under 1 cm a year. Any snowfall tends to sublime into the atmosphere rather than melt. No instance was seen of meltwater channels from any temporary snow patches, and if these did occur, the water would be absorbed by the dry sandy ground before reaching the river.
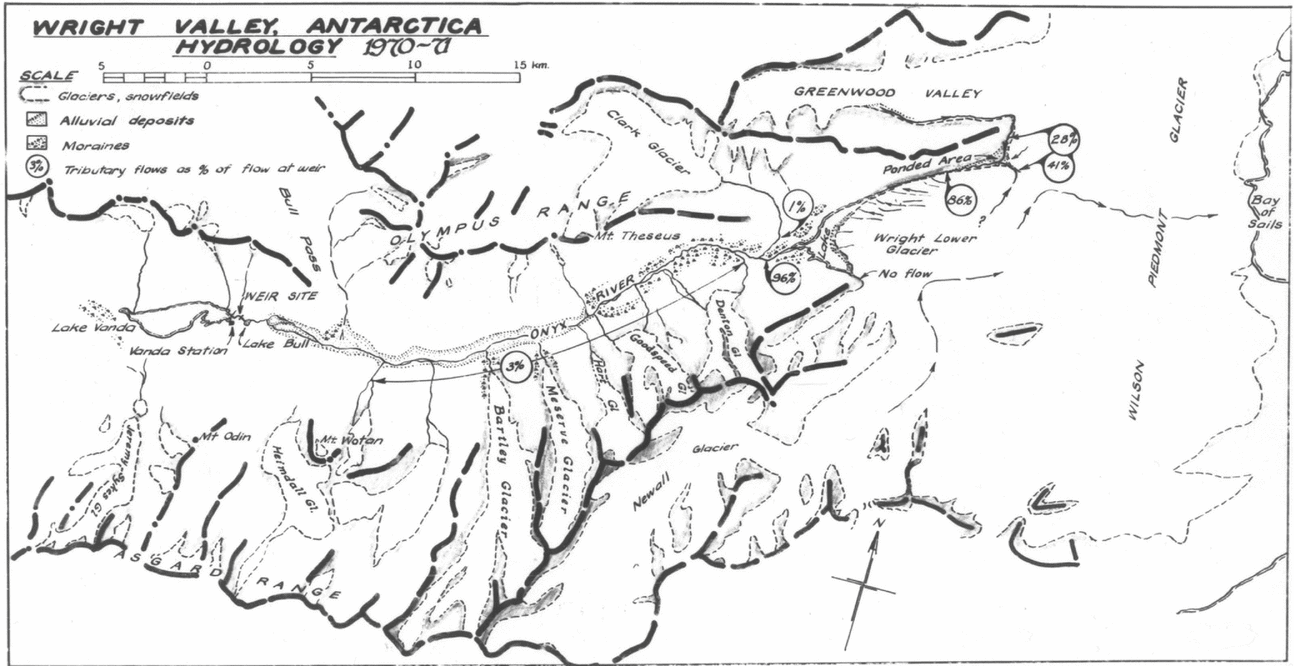
During a survey tractor traverse to the Wright Lower Glacier, during the visit observations and measurements were made in an attempt to ascertain the proportion of the flow contributed by the various tributaries (Fig. 15). It was surprising to find that the ‘Alpine’ glaciers contributed a very small proportion of the flow, as does the snout of the Lower Wright Glacier.
1970–1971. Occasionally the Vanda tractor was available for river crossings.
The main flow comes from two tributaries at the extreme eastern end of the Olympus Range, one flowing from the Greenwood Valley and one from the Wilson Piedmont Glacier. When the Greenwood Valley branch is considered, the total length of the Onyx becomes nearly 50 km.
All of the glaciers from this side of the valley contributed directly to the Onyx flows, but in relatively small amounts. From a visit on foot to these tributary channels, it was estimated that the total contribution from all of the channels would not have comprised more than 10% of the flow of the Onyx (Fig. 16).
1970–1971. The streams and glaciers of the Wright Valley with various tributary stream
Suspended sediment concentration
Although the Onyx carries a considerable quantity of sediment, both suspended and bedload, it has not yet completely filled all the depressions of the original glacial valley. Sediment carried as bedload reaches only as far as Lake Bull, where it is deposited in deltas. Beyond Lake Bull there is no bedload except for some insignificant amounts of wind-deposited sand. Suspended sediment samples were taken throughout the duration of the flow, and the concentrations of suspended sediment were generally low when compared to temperate zone rivers, but the amount of sediment carried rose dramatically in the floods.
The 1971–1972 summer (Hawes Reference Hawes1972)
Personnel were J. Hawes, W. Thompson and L. Cairns.
Field programme
The programme this season continued under the auspices of the DSIR, and closely followed the work schedule of the 1970–1971 summer.
Onyx at weir
The Onyx weir and recorder structures were modified and strengthened before flow commenced, and a sealed stilling well, filled with diesel oil to prevent freezing, was installed. Clear plastic tubing was attached to the staff gauge as a surge and wave damper to enable accurate water level readings to be made in the windy conditions. As the gauging bridge built the previous season was only 1.2 m above the Lake Vanda water level it was re-constructed approximately 50 m further upstream.
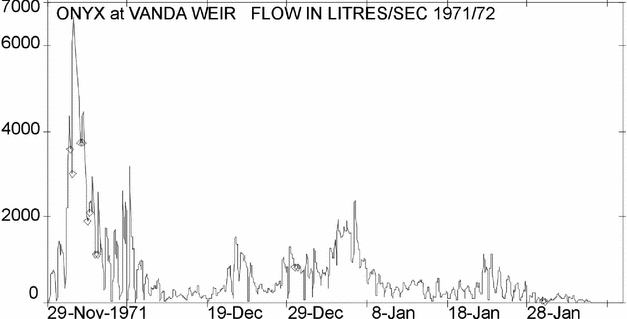
Onyx flow first reached the weir on 29 November. Discharge then increased rapidly and the weir was over-topped on 30 November and peak flow reached on 4th day of flow, 2 December (Fig. 17). After this peak flow, a gradual recession in flow occurred, with the Onyx finally settling down to an even mean daily flow. Water levels dropped below the crest of the weir on 10 December. Apart from a brief period of high discharges during the first week in January 1972, and an occasional day through the season, all flow passed through the notch from this date. Flow through the weir ceased on 9 February 1972.
1971–1972. Onyx at weir instantaneous discharge record.
Although the recorder stilling well was filled with diesel oil, the diurnal freezing problem encountered in previous years persisted. The counter-weight for the Lea recorder proved to be the cause. A seal surround was installed, also filled with diesel. This was immediately successful and no more problems with the recorder were experienced. An uninterrupted stage-hydrograph was obtained for the entire summer season, which with 22 bucket-type current meter flow gaugings, carried out at a wide range of stage heights, provided an accurate stage-discharge rating relationship, with an accuracy that should approach the theoretical value of 2 to 5%.
Water temperatures
A thermistor installed on the Onyx approximately 70 m upstream from Lake Vanda on 3 December 1971, was coupled to a Vanda Station multi-channel recorder and readings of the water temperature were taken at six-hourly intervals. The accuracy of the system from the many checks carried out was within 0.1° C.
Suspended sediment discharge and concentrations
Suspended sediment samples were taken throughout the duration of flow and a sediment concentration-discharge plot drawn up from the results. The maximum daily discharge was 15.30 tons/day with a maximum instantaneous discharge of 22 tons/day.
Lake Vanda
An automatic water level recorder was installed near Vanda Station. A staff gauge and recorder structure was bolted to a mounting frame to allow for adjustments if high-level changes occurred. Levels were recorded on a circular paper chart of a Foxboro pressure bulb recorder. A full record was gained for the season. Lake Vanda level changes were; 0.599 m rise from Nov. 1971 to 9 Feb 1972.
It was proposed to install a water level recorder on the Onyx at the Lower Wright site at the beginning of the 1972–1973 season, to monitor flow sources more closely.
The 1972–1973 summer Fenwick and Anderton (Reference Fenwick and Anderton1975)
Personnel were P.W. Anderton, J. Fenwick, I. Halstead, L. Cairns and D. Sidwell.
Field Programme
This was the first season following the transfer of the project from DSlR. to MWD. Water-level records were obtained from both the existing site near Lake Vanda, and at a new site close to the Lower Wright Glacier.
Onyx at Lower Wright
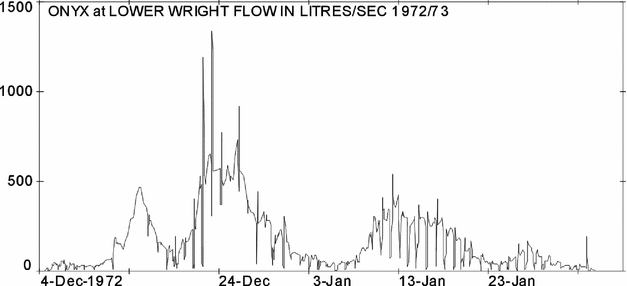
This site (Fig. 18) was established about 2 km downstream from Lake Brownworth near the terminus of the Lower Wright Glacier at 77°26’39”S, 162°39‘36“E. In order to monitor the flow contribution from the glacier to the river, it was necessary to select a site above the confluence with the stream from the Clarke Glacier and investigations showed only one site with any degree of sensitivity. This site is rough and boulder-strewn and unfortunately has some side flow, but the records indicate that has a reasonably sensitive control.
A Foxboro pressure-bulb recorder was installed, together with a staff gauge and 3 bench marks tied to the datum of a valley levelling traverse. The first streamflow was recorded on 4 December, and when the recorder was removed on 7 February the flow was negligible. A week's records were lost due to a temporary failure of the chart drive (Fig. 19).
1972–1973. Onyx at Lower Wright instantaneous discharge record.
Several gaugings were carried out at this site to establish a stage-discharge relationship. Some problems were encountered late in the season when ice collected on the Pygmy current meter, but it was considered that use of a screw-type meter should overcome this difficulty in future.
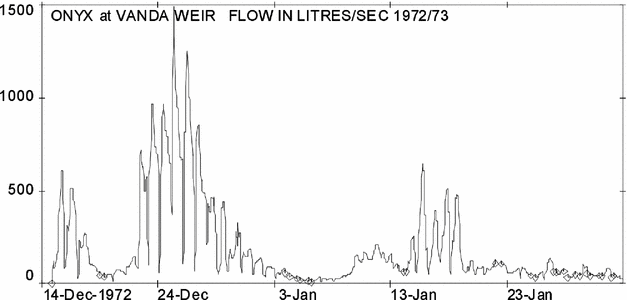
Onyx at weir (Fig. 20)
The V-notch weir and recorder structure were found to be in good condition and the Lea water-level recorder was re-installed. The stilling well and float-counterweight system constructed during the previous season operated satisfactorily with the addition of only a little diesel oil to prevent freezing of the stilling well. The zero on the staff gauge was adjusted in order to bring staff gauge and chart readings into direct correspondence and a full record was recorded (Fig. 20).
1972–1973. Onyx at weir instantaneous discharge record.
Near the start and end of the season, some problems were caused by ice accumulating on the notch and impeding flow to give erroneous stage readings. A simple boom barrier was made, which floated behind the notch and collected floating ice. This proved reasonably successful. Heights of points on the weir, v notch and staff gauge were determined by levelling to assess the amount of permafrost deformation over the 1972 winter and the summer.
Several flow gaugings were carried out to determine any changes that might have occurred in the stage-discharge rating curve established during the previous season. The gauging bridge was not used, as no flow occurred which was large enough to make the river unwadable. Suspended sediment samples were taken with each gauging. A thermistor was installed in the river at the same location as during the 1971–1972 season, about 40 m upstream from Lake Vanda and 6-hourly water temperature readings were taken in conjunction with meteorological observations.
Lake Vanda
The level of Lake Vanda rose 0.055 m by the end of December and subsequently declined so that a net rise of only 0.02 m was recorded for the summer. Consequently the chart record, with a 0 to 1.5m scale, did not provide an adequate resolution. Lake level fluctuations were determined by levelling.
The 1973–1974 summer Anderton and Fenwick (Reference Anderton and Fenwick1976)
Personnel were P.W. Anderton, G; Horrell, G. J. Boddy, J. Rothery and J.K. Fenwick.
Field programme
The project was operated by the MWD, with logistic support from DSIR.
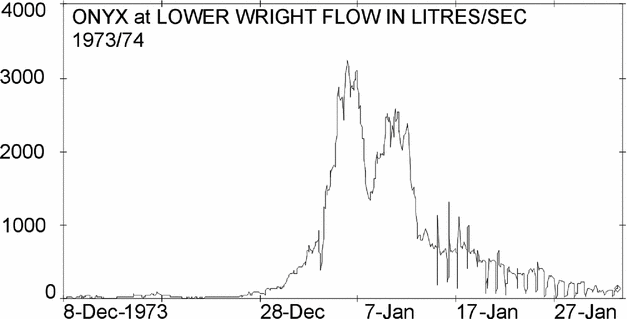
Unusually heavy snowfalls occurred in the ‘dry valleys’ region during October and November and low temperatures persisted until late December. Glacier melt was retarded significantly during this period but the unusually high temperatures which occurred from late December to the end of January effectively compensated for the reduced melt early in the season.
Onyx at Lower Wright
Although the site is boulder-strewn and not very satisfactory, it is the only site on this reach of the river with a reasonable degree of sensitivity. A Foxboro pressure-bulb recorder was installed in November. The earliest flow at the site was recorded on 7 December and a complete record of water level until 2 February was obtained (Fig. 21).
1973–1974. Onyx at Lower Wright instantaneous discharge record.
15 gaugings were carried out using an Ott screw-type current meter which proved more sensitive and less prone to freezing than the cup-type meter used during the previous season. Four suspended sediment samples were collected. The river was still flowing when the recorder was removed at the end of the field season. For transport over the 20 km between the Lower Wright and Vanda Station, the only mechanical assistance available was by the Vanda tractor (and later a 3-wheel Gnat vehicle) or helicopter. Many of the visits had to be made on foot (Fig. 22).
1973–1974. It's a long, long way from Lower Wright to Vanda.
Onyx at weir
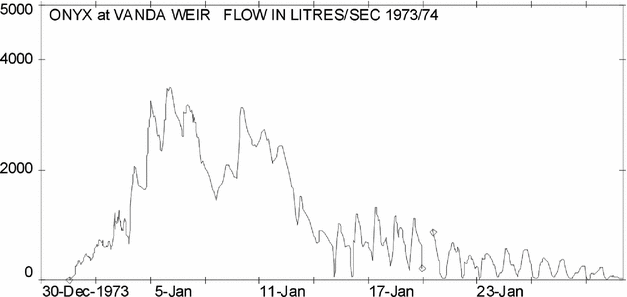
At the start of the season the plywood v notch weir and recorder structure were found to be in good condition and only minor repairs were needed. The first flow over the weir did not occur until 31 December, much later than in any of the previous five years of record. Flow increased rapidly to a peak on 6 January when the weir was overtopped (Fig. 23), and declined slowly for the rest of the season (Fig. 24). 23 flow gaugings were carried out and three sets of suspended-sediment samples were taken.
1973–1974. Boddy shooting the weir as a maximum velocity assessment.
1973–1974. Onyx at weir instantaneous discharge record.
Water temperatures were monitored at 6-hourly intervals using a thermistor connected to a recorder in the Vanda laboratory. When the recorder was removed on 2 February the river was still flowing, and members of the wintering party then read the staff gauge until flow ceased on 13 February.
Lake Vanda
A Foxboro pressure-bulb recorder with a 1.5 m range was installed early in November close to Vanda Station, at the same site used in previous years. At that time the surface of the lake was still completely frozen. Water level was recorded from the time the moat formed at the edge of the floating ice cover until the end of the field season.
At Vanda weir the first flow occurred on 31 December during the period of abnormally high temperatures and continued until 13 February. The hydrograph for this period is very similar to that for the Lower Wright site, but diurnal fluctuations are more marked and occur throughout most of the record. During the period of high flows from 31 December to 15 January the hydrograph shows a major peak of 3.6 m3 s−1 on 6 January and a secondary peak (3.1 m3 s−1) on 10 January. Discharge at Vanda weir was computed from a composite stage-discharge rating curve based on gaugings since records commenced (Fig. 25). The level of Lake Vanda dropped by 98 mm, from 10 November to 27 December, before significant inflows occurred. Drilling for the DVDP programme has indicated that Lake Vanda also loses water to a local groundwater system (Cartwright and others 1974). The magnitude of this loss is not known at present.
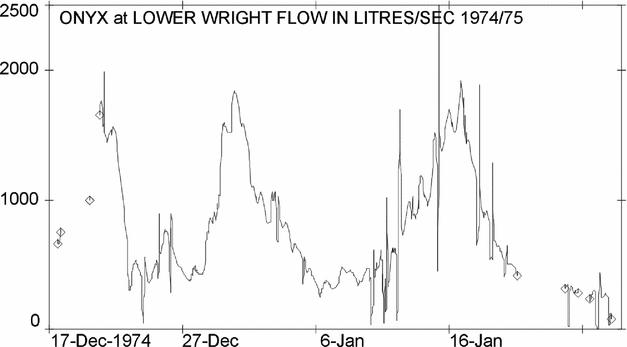
1974–1975. Onyx at Lower Wright instantaneous discharge record.
The 1974–1975 summer Chinn (Reference Chinn1979b)
Personnel were T. Chinn, P. Mason, T. Omundsen, W. King and J. Williams.
Field programme
The 1974–1975 programme was organised by MWD, and covered a work programme similar to previous years. A four man party, which had wintered over at Vanda Station during 1974, reported no unusual snowfalls and the 1974–1975 summer followed the normal weather pattern.
Onyx at Lower Wright (Fig. 25)
No alterations were made at the site so that the stream-flow ratings of previous years would apply again this season. The water level recorder was installed in November and the earliest flow occurred shortly before 2 December. A number of clock failures were responsible for gaps in the record that continued until 28 January when the instrument was removed. Three gaugings were carried out using an Ott screw-type current meter and levelling checks revealed that the staff gauge had moved by 10 mm during the season. The river was still flowing when the recorder was removed at the end of the field season.
Onyx at weir
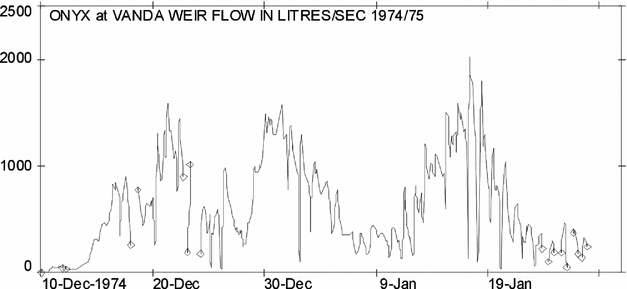
The first flow over the weir was delayed by a spell of cool, cloudy weather until 10 December at 0225. Flow increased rapidly to peak on three different occasions, with the maximum peak of 2.50 cumecs on 17 January. The weir was just overtopped on several occasions (Fig. 26). Eight gaugings were carried out and ten sets of suspended-sediment samples were taken. Water temperatures were monitored at 6-hourly intervals using a thermistor connected to a recorder in the Vanda laboratory. When the water level recorder was removed on 31 January, the river was still flowing.
1974–1975. Onyx at weir instantaneous discharge record.
Deformation of the weir is an inevitable result of being sited in permafrost, and is similar to the process responsible for the formation of ice-wedge polygons. With the winter cold, contraction fractures occurred which subsequently filled with sediment and water the next summer. Since any water entering fractures in permafrost will freeze almost immediately, such fractures in an earth dam will be self sealing and should not be a source of leaks. By employing this concept, a start was made to convert the plywood weir structure into an ice-cored earth dam, simply achieved by building a stone and earth dam around the existing structure. Provided that the final earth structure is thicker than the depth to which the active layer (summer thaw) penetrates, the core should remain as a permanent impervious barrier.
Water level measurement errors resulting from ice formation in the v notch of the weir were considerably reduced by coating the notch with a number of layers of slippery PTFE (polytetra-flouroethylene) using a commercial spray can. Applications of PTFE were also made to the current meters and other areas where icing had caused problems in the past. This substance does not prevent ice forming, but because of its low coefficient of friction, it markedly reduces the tendency of ice to adhere to a treated surface.
Channel and tributaries
Two days of stage records were made on the Bartley Glacier stream by temporarily uplifting the Lake Vanda surface follower recorder. The results give the stream pattern and time of peak flow. Two flow gaugings were also made of the Clark Glacier stream to estimate the fraction of flow contributed here. The discharges measured were 62.3 l/s on 17 December and 66.8 l/s on 19 December.
Lake Vanda
A surface-follower attached to a Fischer and Porter recorder was installed prior to the commencement of melt, to continuously monitor the water levels. This new type of instrument was installed for a trial assessment and proved eminently satisfactory for recording lake level changes.
The 1975–1976 summer Chinn (Reference Chinn1981)
Personnel were T. Chinn, G. Craig, S. Chatwin, J. Williams and W. Wicks.
Field programme
Cool, cloudy conditions tended to prevail throughout the season resulting in low flows in the Onyx and tributary streams. A relatively heavy snowfall occurred above valley floor levels on 23 November. Meltwater did not reach the Lower Wright recorder until 7 December. On the same day meltwater from the Meserve and Bartley Glaciers reached the Onyx River channel and by the next day there was a continuous flow from the Lower Wright to beyond Bull Pass.
Onyx at Lower Wright (Fig. 27)
Flow records made by the pressure-bulb recorder were found to be unstable, and a more stable mounting for both the recorder and staff gauge was erected 5 m down-stream of the site used in previous seasons. Nine flow and suspended sediment gaugings were made and the new recorder site was levelled to existing benchmarks.
1975–1976. Onyx at Lower Wright instantaneous discharge record.
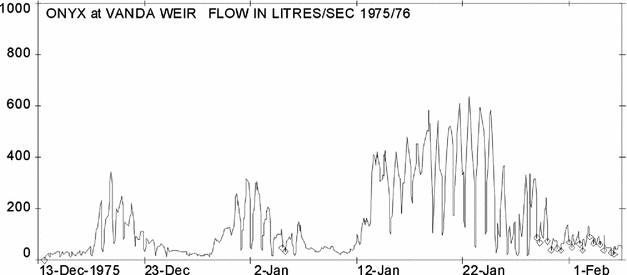
Onyx at weir (Fig. 28)
Water took 6.5 days to travel from the Lower Wright recorder and the first flow passed over the weir at 14:13 hours on 13 December 1975, to continue until some time after 29 January 1976, when the last chart change was made. This instrument was also left operating to provide an additional week of record. Ice forming in the notch of the weir at night caused problems on a number of occasions despite the use of plastic spray to reduce ice adhesion to the structure.
1975–1976. Onyx at weir instantaneous discharge record.
Movement within the permafrost of the stream bed by normal ice wedge processes continue to deform the weir structure. Levels of the surrounding benchmarks and the weir were checked on three occasions.
Water temperature records were made from the beginning of the flows and recorded in the Vanda laboratory. Five flow gaugings were made as a check on the weir rating, and suspended sediment samples were taken at the same time.
Channel and tributaries
During January flows in the Onyx channel and tributaries were measured or observed to identify the sources of the repeated daily fluctuations of flow recorded at the weir site. Observations indicate that tributaries on the south side of the Wright valley have peak flows about 13.00 each day, which dramatically fall off or cease about 1900. These tributary flows are very dependent on the weather conditions (temperature and cloud cover) as well as the time of day.
On 19 January, from a flight down the Wright Valley at 01.45, all the tributary streams were seen to be flowing. On a flight on 29 January, all tributary flows had ceased except for the Clark Glacier stream.
Lake Vanda
Continuous water level records were made throughout the summer by a surface-follower instrument installed the previous summer. The mountings of both the recorder and staff gauge were less stable than desirable, but check levels indicated that the staff gauge did not shift from 24 December onwards, after the meltwater moat had formed.
The early part of this record shows effects of diurnal freezing while the latter part of the record contains wind and sieching effects. The lake was still rising when the summer season ended and the field party departed, so that the full lake rise was not recorded.
Microclimate study, Lower Wright Glacier
During the 1974–1975, season, lake leveling in the Taylor Valley was carried out on foot. During the traverse alongside the margin of Taylor Glacier on 2 December, a surprisingly large amount of meltwater was seen coming off the ice cliffs, while little to no melt was occurring on the glacier horizontal ice surfaces. This phenomenon suggested that where a glacial cliff impinges against a sloping valley side, a radiation trap is formed creating a local environment that accelerates melt. To test this hypothesis, a microclimate study was made at the cliffed margin of the Lower Wright Glacier (Fig. 29). The results confirmed the hypothesis and were published (Chinn Reference Chinn1987).
1975–1976. The Vanda Gnat, an unsuitable farm vehicle used to travel to the Lower Wright sites long before the invention of the Quad–bike. This expedition was its’ last trip away from Vanda Station.
The 1976–1977 summer Chinn (Reference Chinn1983)
Personnel were H. Dengate and other members of the Vanda Station staff and J. Palmer.
Field programme
Basic hydrological measurements where possible, were continued this season. Continuous flow measurements of the Onyx were made at both of the sites, and daily staff-gauge water level readings were maintained on Lake Vanda.
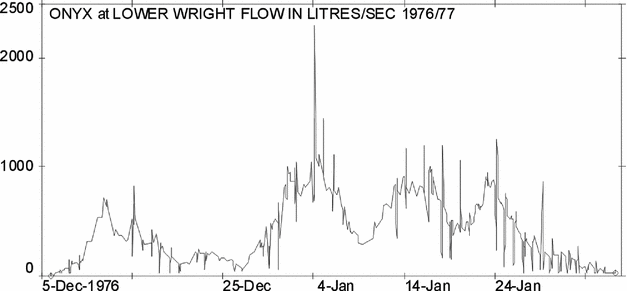
Onyx at Lower Wright
Flow records were maintained by a weekly Foxboro pressure-bulb recorder, although limited helicopter support made it difficult to adhere to weekly chart changes. Without air support, each chart change involved a 28 km walk each way between Vanda Station and the water level recorder site. This trek was made on foot many times.
First flow from Lake Brownworth (Fig. 30) was recorded at 1030 on 6 December 1976 and flows continued past the last chart change made on 27 January. This chart, left on for the winter, continued to recorded flows up until 11 February 1977 when the recorder stopped.
1976–1977. Onyx at Lower Wright instantaneous discharge record.
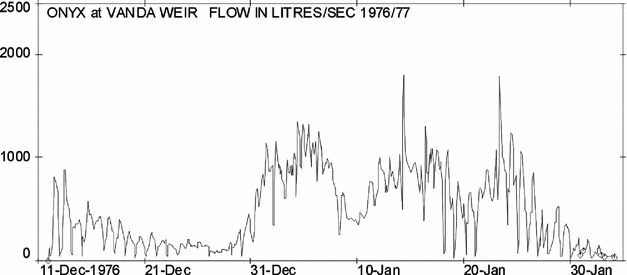
Continuous flow records were made at the v notch weir by the 1 m range weekly Lea float-type water level recorder (Fig. 31). First flow at the weir occurred at 22.23 on 11 Dec, taking five days for the water front to travel the length of the valley. Water levels overtopped the weir crest several times.
1976–1977. Onyx at weir instantaneous discharge record.
Lake Vanda
No automatic water level records were made on Lake Vanda this season, but a staff gauge was read daily. readings are plotted in the annual report for 1976–1977 and 1977–1978, Chinn (Reference Chinn1983). Since this lake sieches during windy weather, the times of high winds are indicated on this plot.
The 1977–1978 summer Chinn (Reference Chinn1983)
Personnel were T. Chinn, T. Omundsen, C. Longson, N. Nalder and J. Palmer.
Field programme
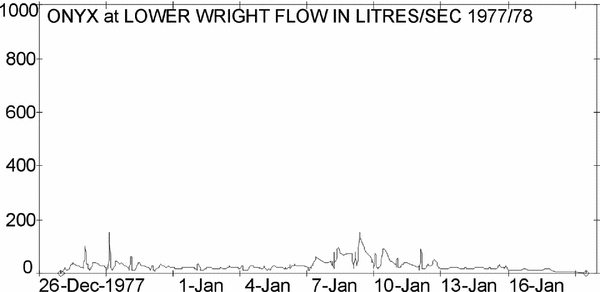
The 1977–1978 programme was organised by MWD. The season was notable for an unusually heavy snowfall which occurred over 3–5 December and covered the entire Dry Valleys region, except for a small low altitude area surrounding Lake Vanda. Snow depths of up to 10 mm may be expected from normal snowfalls. but from this storm, snow depths of over 200 mm occurred in coastal areas, and an estimated l50 mm of snow blanketed the Lower Wright Glacier area, the source of meltwater for the Onyx. Ice melt, but no significant stream flow had begun before the snowfall. The snow cover increased the albedo of the entire region so effectively that all melt and streamflow ceased for some time. It was not until 27 December that water began to flow past the Lower Wright recording station on the Onyx. This setback to river flow was not overcome during the remainder of the summer season, so there was insufficient meltwater produced to fill storage and overcome evaporation in the Onyx channel. The summer was the first season on record that the Onyx did not flow into Lake Vanda, but the event did provide an interesting means of assessing the volume of the Onyx channel storage.
Onyx at Lower Wright
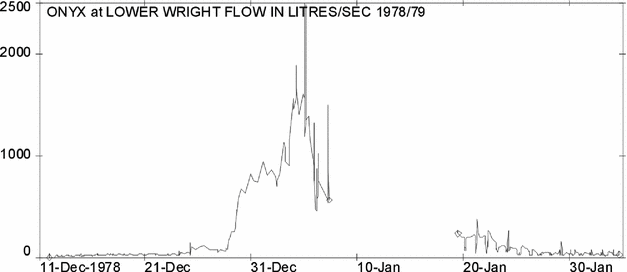
Continuous water level records were maintained on the Onyx River during limited flow at the Lower Wright site, but no flow occurred at the weir site (Fig. 32). Following the December snowfall, the first flow did not reach the recording site until 27 December. After initial low flows two periods of almost no flow occurred in early January, followed by marginal flows for the remainder of the season. Water level recorder charts indicate that there were times towards the end of January when possibly no flow occurred in the iced-over stream. Flows may have persisted beyond the last recorded flow on 4 February, but as discharges were very low, the record is considered to terminate at this time. Three flow gaugings were made at this site.
1977–1978. Onyx at Lower Wright instantaneous discharge record.
Lake Vanda
Continuous water level records were made throughout the summer on Lake Vanda. No useful record was obtained until after about 8 December when melt had advanced sufficiently to connect the moat water with the lake body. Some excavation had to be undertaken to keep water under the sensor as lake levels continued to fall. Low spikes indicate ice formation, and high oscillations occur during winds. Persistent winds cause sieching and lead to noticeable changes in lake level.
The 1978–1979 summer Chinn and Cumming (Reference Chinn and Cumming1983)
Personnel were R. Cumming, I. Halstead, A. Woods, L. Smith and C. Fink.
Field programme
The field programme continued the monitoring work of past years and included making continuous water level recordings at two sites on the Onyx River and levels of various enclosed lakes. Field travel (Fig. 33) was by helicopter and foot, with limited use of the tractor to service sites on Lake Vanda. The weekly chart changes at the Lower Wright water level recorder site were maintained, although it was proposed to replace this instrument with one that would run unattended for much longer periods.
1978–1979. Wishful transport for the Dry Valleys.
Flow records (Fig. 34) were maintained at this site by the weekly Foxboro pressure-bulb recorder which has the facility to continue recording for over two weeks. Thus it was not necessary to adhere to a difficult routine of weekly chart changes. Twelve days of record were lost between 7 January, when the recorder clock stopped, and 19 January, when the subsequent chart change was made.
1978–1979. Onyx at Lower Wright instantaneous discharge record.
The seasonal flow pattern was unusual by rising quickly to only a single peak for the summer, followed by a relatively uniform recession of flows without significant secondary periods of high flow. Work was continued on constructing a cutoff channel to improve the measurement sensitivity of the site during high flows. Two flow gaugings were made at the Lower Wright recorder site to improve on the rating.
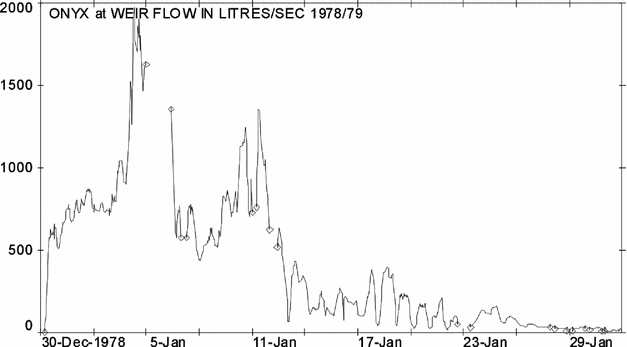
Onyx at weir (Fig. 35)
Water levels overtopped the weir crest continuously during the first few days of January. Discharge volumes fell quickly with falling temperatures, and rose to a small secondary peak over 10 and 11 January. This peak occurred during the period of missing record at the Lower Wright site.
1978–1979. Onyx at weir instantaneous discharge record.
Three flow gaugings were made at the weir site as a check on the rating. Suspended sediment samples were taken with four of these flow measurements. From a thermistor installed in the river, routine readings of water temperatures were made at the normal station meteorological observation times.
Channel and tributaries
Clark Stream (Fig. 4)
On 28 December a surface follower recorder was installed on the stream to record stage. This stream is very dirty and carries a sandy bedload during its intermittent daily flows. One flow gauging was made at the recorder installed on the Clark. Unfortunately the field party was not in the locality to make the more critical high flow gaugings.
Regrettably the recorder had to be removed on 30 December after only a 36 hour record. An estimated daily mean discharge of 100 litres per second is 27% of the Onyx daily mean discharge of 374 l s−1 recorded on the same day at the Lower Wright site. This site is located a few hundred metres upstream of the Clark confluence. Water temperature of the Clark reached 11.2°C on 29 December.
Lake Vanda
Continuous water levels were recorded on Lake Vanda over the summer period on a recorder mounted at the site used the previous season. The records were interrupted by a mechanical failure when about four days of record was lost in early January. The trace shows the usual early summer irregularities due to icing before the lake began rising. Effects of strong winds show quite clearly where wind sieche oscillations of lake level reach as much as 0.09 m.
The 1979–1980 summer Chinn and Oliver (Reference Chinn and Oliver1983)
Personnel were T. Oliver, P. Hall, D. Waghorn, M. Sinclair, R. Arbon, D. Thompson and J. McConchie.
Field programme
This season the monitoring of flow at the two sites on the Onyx continued. Automatic water level recordings were made on Lake Vanda. Additional hydrology this season included measuring the location and flow of meltwater channels on the upper surface of the Lower Wright Glacier (the source of the Onyx) and measuring the flow of several tributary streams in the Wright valley.
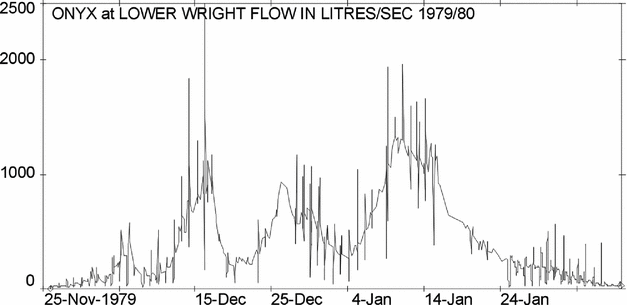
Onyx at Lower Wright (Fig. 36 )
The pressure-bulb chart recorder permanently installed at this site had poor resolution at low flows, so a second recorder was installed at the same site. Flows began unusually early at this site on 25 November 1979, and continued after the field party departed towards the end of January, when the recorder was left still operating. Fourteen flow measurements were carried out here, including some of high flows which are required to make an accurate rating curve. Work was continued on constructing an earth cutoff wall to ensure that high flows could not pass behind the recorder section. This well required further work, as it continued to leak at high flows.
1979–1980. Onyx at Lower Wright instantaneous discharge record.
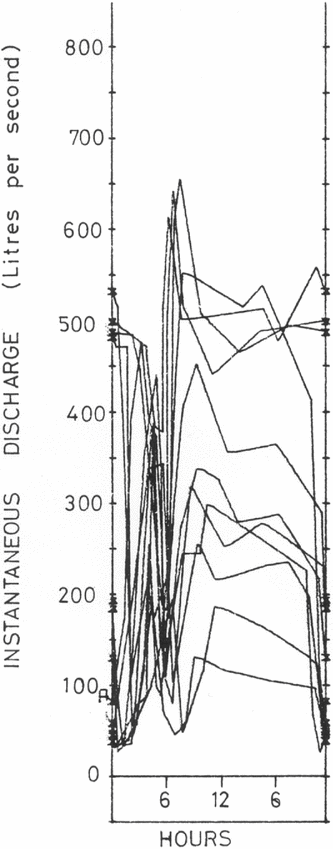
Repetitive diurnal oscillations in flow that appear on lower flows of every hydrograph have been assumed to be caused by temporary nocturnal ice dams forming in shallow parts of the river channel. Over 4 and 5 January, an all-night vigil was maintained watching the stream to find the reason for the early morning oscillation in flow patterns. Lowest daily flows occur in the early morning, about 04:00, and within an hour flows suddenly rise to usually the highest peak for the day. It was found that the stream surface began to ice over at 03:00 hours, and flows began a sharp drop. This ice formed into small arcuate terracettes that successfully dammed the stream (Fig. 37). The stream gradient is low between the recorder and Lake Brownworth with ample area to pond a considerable volume of water. As soon as the sun appeared from behind the Asgaard Range about 0500 this surface ice began to disintegrate and released ponded water to give a peak discharge at about 0530. Discharge then decreased to a steady flow.
1979–1980. Early morning temporary terrace–dams of platelet ice terraces between Lake Brownworth and the Lower Wright site.
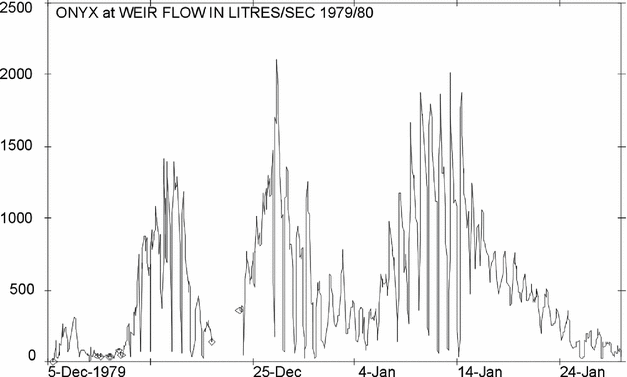
Onyx at weir (Fig. 38)
Benchmarks, staff gauge and weir were checked for levels near both the beginning and end of the season, and the weir structure was measured for deformation by permafrost movement. Rock walling of the structure continued but leaks still occurred at high flows.
1979–1980. Onyx at weir instantaneous discharge record.
A thermistor was installed in the river on 5 December to record water temperatures. On 21 December the recorder clock stopped, giving a period of missing records. Records recommenced on 23 December when a replacement clock was installed.
The predictable daily rise and fall of the river (Fig. 39) was used in an endeavour to test the site for a loop rating of suspended sediment discharge. Four flow gaugings and 11 suspended sediment samples were taken. To record the end-of-season flow, the recorder was left operating when Vanda Station closed on 25 January.
Ice terracettes example formed immediately above the weir by cooling in early morning shade in 1984–1985.
Discharge retention by platelet and terracette damming
By visually following the behaviour of the river ‘nocturnally’, the processes of ice platelet accretion into miniature terrace dams was observed and photographed in the early hours of the morning.
Lower Wright Glacier meltwater channels (Fig. 40)
In a programme to determine the dominant source of the Onyx, aerial photographs and measurements were made of the major meltwater tributary channels on the glacier tongue which flow from melting ice terraces. The terraces (Fig. 41), provide the vertical ice faces which melt much faster than the flat terrace tops (Chinn Reference Chinn1987) and the meltwater concentrates into semi-permanent channels (Fig. 42) both on and from the Lower Wright Glacier. In total, 16 flow measurements were made on these streams.
1979–1980. Map showing flow measurement sites of Lower Wright meltwater channels. Flow discharges were measured at sites C, A, F, B and Greenwood stream by Oliver in 1979–1980.
1979–1980. The ice terraces of the Lower Wright Glacier which provide vertical faces for accelerated melt on the Lower Wright Glacier.
1979–1980. The glacial stream near point C on the Lower Wright Glacier. Clark Glacier in background.
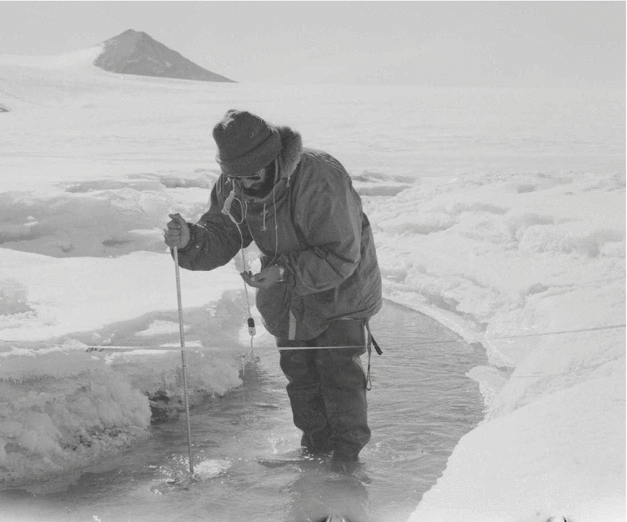
1979–1980. Gauging flow in an ice channel, Lower Wright Glacier.
Stream observations, Lower Wright Glacier
14 December. Site C visited and water level recorder installed in an ice channel. Flow commenced at 1600 and increased rapidly to maintain a steady flow for the remainder of the day.
17 December. Site C visited: the stream had cut a channel beneath the ice, and left recorder sensor dry. Less melt occurring than on the previous visit, with no waterfalls from the glacier face.
2 January. Site C visited and found to be flowing but the channel had shifted away from the water level recorder. Very little meltwater running off the glacier terminus and Lake Brownworth had frozen over.
3 January. Ice channel at site A gauged (approximately 15 m upstream of lake). Channel F (500 m east of site A) found, but it was infilled with snow and there was no flow. Greenwood Glacier channel found to be barely flowing below an ice cover. Channel B, seen on aerial photographs apparently now existed only as a series of ponds. At that time, January 1971, there was significant meltwater discharge. Little to no meltwater flowing off the glacier downstream of site C.
6 January. Site C, flowing steadily and flow gaugings were made (Fig. 43). Glacier margin melt streams were flowing and the new ice on Lake Brownworth was melting.
8 January. Most melt channels were flowing and flow gaugings were made at sites A and F. Limited flow in Greenwood Glacier stream was also measured. Sites A and F were revisited later in the day and flow gauginge made at higher flows. Another search was made for channel B and it was found to be only a chain of frozen ponds with no flow across the glacier towards the Bay of Sails. Melt streams continued to flow off Lower Wright Glacier margin.
9 January. Site C visited and gauged in late afternoon. The lake upstream of ‘C’ had lowered considerably since December. A party reported a flow of 1 to 2 m3 s−1 flowing into Lake Fryxell from Canada Glacier (Fig. 6).
From the above observations it appears that the greater part of the input into Lake Brownworth is from the adjacent margins of the Lower Wright Glacier rather than from glacier surface channels.
14 December. Site C; Water level recorder installed in an ice channel. Flow commenced at 1600 and increased rapidly to maintain a steady flow for the remainder of the day.
17 December. Site C; Stream had cut a channel beneath the ice, and left recorder sensor high and dry. Less melt occurring than on the previous visit, with no waterfalls from the glacier face.
2 January. Site C found to be flowing but the channel had shifted away from the water level recorder. Very little meltwater running off the glacier terminus and Lake Brownworth had frozen over.
3 January. Ice channel at site A gauged (approximately 15 m upstream of lake). Channel F (500 m east of site A) found, but it had been infilled with snow and there was no flow.
Greenwood Glacier channel (Fig. 40) found to be barely flowing below an ice cover.
Channel 8, seen on aerial photographs apparently now exists only as a series of ponds. This is close to the site where the cover photograph of this volume was taken. At that time, January 1971, there was significant meltwater discharge. Little to no meltwater flowing off the glacier downstream of site C.
6 January. Site C, flowing steadily and flow gaugings were made. Glacier margin melt streams were flowing and the new ice on Lake Brownworth was melting.
8 January. Most melt channels were flowing and flow gaugings were made at sites A and F. Limited flow in Greenwood Glacier stream was also measured. Sites A and F were revisited later in the day and flow gauging made at higher flows. Another search was made for channel B and it was found to be only a chain of frozen ponds with no flow across the glacier towards the Bay of Sails (ocean). Melt streams continued to flow off Lower Wright Glacier margin.
9 January. Site C (Fig. 43) visited and gauged in late afternoon. The lake upstream of ‘C’ had lowered considerably since December. A party reported a flow of 1 to 2 m3/s 1 flowing into Lake Fryxell from Canada Glacier.
From the above observations it appears that the greater part of the input into Lake Brownworth is from the adjacent margins of the Lower Wright Glacier rather than from glacier surface channels.
Onyx channel and tributaries
A portable surface follower’ recorder was used to obtain flow data on some of the tributaries between the two flow recording sites on the river. A six-day stage record with seven flow and suspended sediment measurements was obtained from the Clark stream. The stream was very turbid and carried considerable bed load.
On the streams from the Meserve and Bartley Glaciers (Fig. 4) seven and five-day stage records, respectively, were obtained. During this period, however, the temperatures were generally cooler and the flows were intermittent and low. It was difficult to find suitable flow-recording sites on the wide sandy channels of these tributary streams. The electric plumb-bob recorder used to measure stage on these streams is not ideally suited to measuring diurnal flows. After the channel becomes dry, the instrument sensor does not always reactivate immediately (and sometimes not at all) with the return of flow.
Lake Vanda
Continuous water level records were maintained on a surface-follower electric plumb-bob attached to a Stevens digital recorder installed on 23 November, but did not immediately sense correctly due to poor earthing through pure ice of high resistivity. On 30 November sufficient melt occurred to permit the instrument to earth and operate correctly, and records continued until the instrument was removed on 24 January. The lake rose approximately 310 mm over the summer. Although the Onyx began flowing into Lake Vanda on 5 December, the water level did not start rising until 12 December.
The 1980–1981 summer Chinn and Maze (Reference Chinn and Maze1983)
Personnel were I. Maze, T. Troupe, T. Chinn, C. Fink and Gary Neall.
Field programme
The programme was again operated by the MWD. The usual monitoring of flow at the two sites on the Onyx continued with water level recordings on Lake Vanda. Additional hydrological studies included installing an automatic water level recorder on Don Juan Pond (Fig.7), measurements of cross sections of the Onyx channel for hydraulic geometry, a study of the glacier-lake contact zone on Lake Brownworth and gauging the flow of the Clark Glacier stream. Field transport was by helicopter, toboggan and foot.
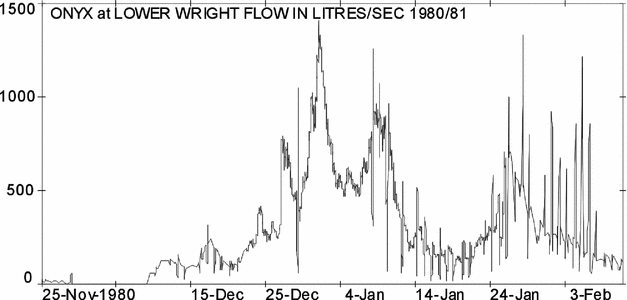
Onyx at Lower Wright (Fig. 44)
A rock and earth cut-off wall to deflect high flows through the flow measuring site, which had been worked on over previous seasons, was completed this summer. During this work, on 30 December, the permafrost active layer was found to have thawed to 30 cm depth and groundwater was moving in this layer up to 8 m from the river.
1980–1981. Onyx at Lower Wright instantaneous discharge record.
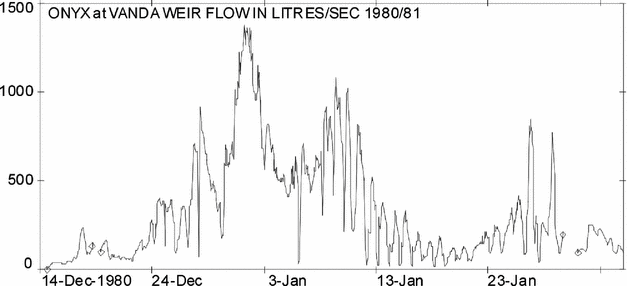
Onyx at weir (Fig. 45)
Flow at the weir began on 14 December, after taking 20 days for the water front to travel from the Lower Wright recorder. Seven flow gaugings were made, and seven suspended sediment samples taken. To record the end of season flow, the recorder was left operating when Vanda Station closed on 28 January. Water temperature readings from a thermistor installed in the river were made at 6-hourly intervals together with Vanda Station meteorological readings.
1980–1981. Onyx at weir instantaneous discharge record.
Tributaries
Most tributaries showed very little flow all summer. First tributary flows were seen on 30 December when the Bartley, Meserve and Clark streams (Fig 4) had all just reached the Onyx channel. No stage records of tributaries were made this season, although a discharge of 38 l s−1 was measured in the Clark Stream on 2 January.
Onyx river channel (Fig. 4)
A study of the Onyx channel was made at 10 sites distributed along the length of the river. At each site the cross-section of the stream channel was surveyed and a flow gauging made. Section 1, near the Lower Wright site, was measured on 2 January: sections 2 to 8 on 14 January; section 9 and section 10 (near Lake Vanda) on 10 January. Each section was marked by a cairn and flag (Figs. 46, 47, 48, 49, 50).
1980–1981. C. Troup on a ‘time–of–travel’ flow measurement for the length of the Onyx channel.
1980–1981. Onyx channel cross–section 2,– moraine.
1980–1981. Onyx channel cross–section 5, alluvial gravel.
1983–1984. Onyx channel cross-section 7. Erosion above Meserve exposing ground–ice characteristic of permafrost.
1980–1981, Onyx channel cross–section 9, rocky felsenmeer near Lake Vanda.
Lake Vanda
Water level records were again continuously recorded when useful records began on 5 December and continued until the instrument was removed on 28 January. The record shows considerable variation due to waves and sieching, the effects of both appear to increase towards the end of the season as the meltwater moat increased in width. At the recorder, the moat became a 30 m wide stretch of open water by the end of the season. The lake rose approximately 212 mm over the summer. Although the Onyx began flowing into the lake on 14 December, water level did not start rising until 25 December.
The 1981–1982 summer Chinn and Woods (Reference Chinn and Woods1984)
Personnel were A. Woods, D. Levick, N. Craddock, O. Druce, P. Tinnelly and G. Neale, Vanda Station staff.
Field programme
The field programme continued the hydrological monitoring work of continuous water-level recordings at two sites on the Onyx and at Lake Vanda and Don Juan Pond. The special project this year was a deep ice-core drill hole on the Heimdall Glacier. Field travel was by helicopter and foot, with limited use of the Vanda Station tractor.
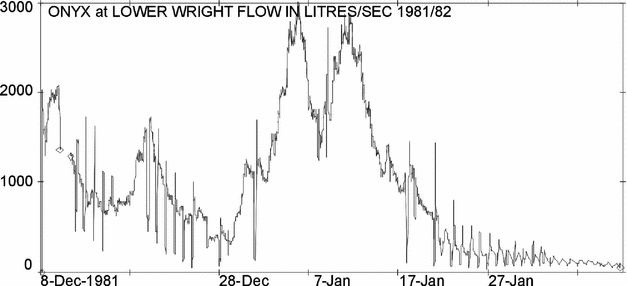
Onyx at Lower Wright (Fig. 51)
River flow began later than normal because of cool temperatures, and although melt water did not begin until 8 December, discharge increased rapidly, so that within 36 hours the river had reached the Vanda weir. Both a pressure-bulb recorder and an electric plumbob surface-follower digital water-level recorder were operated at this site. The surface follower probe movement was arrested by ice over 10 and 11 December, before the other Foxboro instrument had been repaired, and two days of record were lost. Air temperatures were recorded at a meteorological screen permanently installed at this site. At various times throughout the summer, earthworks were continued on a cutoff wall constructed to divert high flows through the flow recorder section of the river. On 27 January the surface-follower recorder was removed, while the Foxboro recorder remained to record the end-of-season flows. Fourteen flow gaugings were carried out during the season from which the existing stage/discharge rating was updated for greater accuracy.
1981–1982. Onyx at Lower Wright instantaneous discharge record.
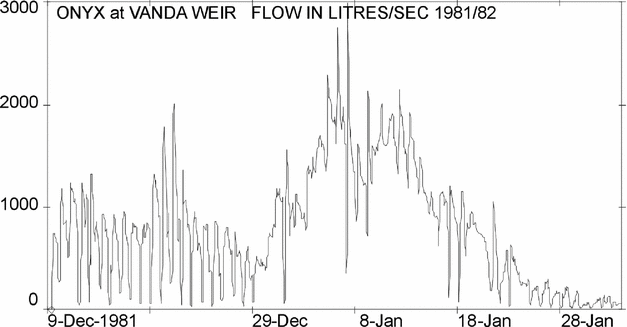
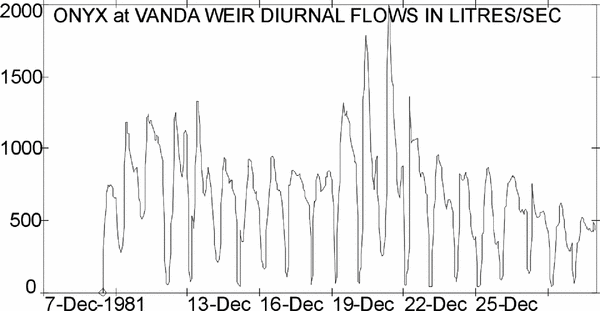
Onyx at weir (Fig. 52)
The benchmarks, staff gauge and weir were checked for levels at the beginning and midway through the season. The weir structure was also measured for deformation by permafrost movement. Sand and snow were cleared from around the v-notch and out of the recorder stilling well.
1981–1982. Onyx at weir instantaneous discharge record.
Flow at the weir began after taking less than 36 hours to flow from the Lower Wright site. A full flow record was obtained during the season. Ten flow gaugings were carried out to check the existing stage-discharge rating curve and the existing rating updated.
The Lea recorder was left to run after Vanda Station was closed on 29 January 1982 to record the end-of-season flows. It remained installed throughout the winter for the last chart to be retrieved in the next season.
Suspended sediment
Samples of water were taken at the weir for suspended sediment analysis. As the daily flood wave of meltwater is predictable, a number of samples were taken at both rising and falling stages to see if the results would give a loop rating. These samples gave no indication of a loop rating.
Lower Wright glacier meltwater sources
14 flow gaugings at the water-level recorder sites were made by wading gaugings using a current meter. On the north margin of Lower Wright Glacier, estimates of flow were made on 13 December to define the main sources of meltwater: 100 to 150 l s−1 was discharged from the ponded area.
Lake Vanda
A satisfactory record of continuous water-level records was taken on Lake Vanda with a Leupold and Stevens recorder interval, attached to a surface-follower electric plumbob sensor, except for four short periods when the record was lost because of freezing of the probe.
The lake level dropped approximately 30 mm from when the recorder was first installed to when the river began flowing into Lake Vanda on 9 December. From then until 28 January when the recorder was removed, the lake rose nearly 600 mm. The levels of lake and staff gauges were checked at both the beginning and at the end of the season at the time of the level surveys of other eight lakes in the Dry Valleys region.
The 1982–1983 summer Chinn and Dickson (Reference Chinn and Dickson1986)
Personnel were R. Dickson, T. Butler, T. Chinn, P. Tinnelly and G. Neale.
Field programme
Continuous water-level recordings at two sites on the Onyx, and at Lake Vanda. This year the special project was a study of the Lower Victoria Glacier.
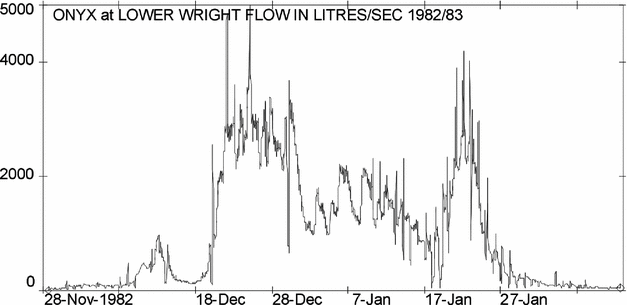
Onyx at Lower Wright (Fig. 53)
At this site two different types of water-level recorders were operated simultaneously for most of the season at this site and air temperatures were recorded at a meterorological screen permanently installed close by. A Foxboro pressure-bulb recorder gave a complete record for the season. Water surface draw-down between this recorder and the staff gauge made it difficult to reconcile their respective water level readings at high stages. A Leupold and Stevens digital water-level recorder operated by an electric plumb-bob surface-follower sensor was better sited than the Foxboro and, not having the problem of draw-down effects, should have given a more accurate record. However the probe was arrested by ice several times that, together with additional instrument failures, resulted in a poor record for the season. On 27 January it was removed. The Foxboro recorder continued to record the end-of-season flows after the departure of the field party. Eleven flow gaugings carried out at this site during the season updated the existing stage-discharge rating curve.
1982–1983. Onyx at Lower Wright instantaneous discharge record.
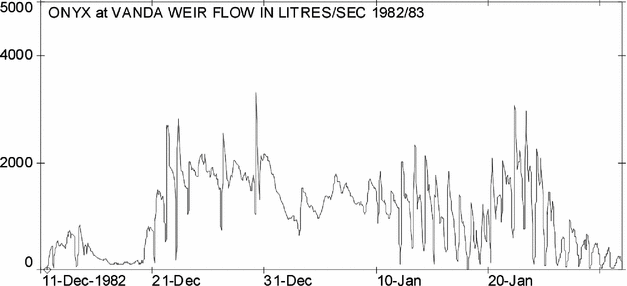
Onyx at weir (Fig. 54)
Continuous flow records were made at the Vanda v-notch weir. The benchmarks, staff gauge and weir were checked for levels at the beginning and end of the season and the weir structure measured for deformation by permafrost movement. General maintenance, carried out prior to flow, entailed clearing sand and snow from around the v notch and out of the recorder stilling well. A full flow record was obtained during the season and eight flow gaugings were carried out to check and update the existing stage-discharge rating curve. During the latter part of the season water was seen leaking under both wingwalls of the weir. The adjustment to the rating from the flow gaugings made corrects for this. The maximum leakage involved was 20 to 25 I s−1.
1982–1983. Onyx at weir instantaneous discharge record.
Channel and tributaries
Clark stream flume (Fig. 55)
A plywood flume was installed this season on the meltwater stream from the Clark Glacier as a study of these tributary streams would obviously yield a considerable amount of information on the regime of the Onyx system. In addition, tributary flow records, together with local air temperatures, would provide a more simplified data set on flow and temperature relationships than that gained so far from the more complex Onyx and the Lake Vanda meteorological records. The stream from Clark Glacier was selected because servicing was simplified by its location within 1 km of the Lower Wright site, where the required air temperatures were already being recorded at a meteorological screen. A prefabricated plywood flume was chosen in the hope that its structure would be best suited to pass the considerable amount of sand carried by the stream. The flume structure was installed at a site 20 m upstream of the confluence with the Onyx, and was equipped with a surface follower water-level recorder. The structure, designed as a temporary installation to be easily removed at some future time, was installed before flow began. The site gave a good flow record for the season, although, as anticipated, sediment accumulation in the structure destroyed the accuracy of a 6-day record in late December which was discarded. Further effects of sedimentation are also detectable on the record as an apparent increase in minimum-flow stage towards the end of the summer. The recorder was removed from the site on 27 January.
1982–1983. The contrasting flows at the confluence of the Clark and Onyx rivers showing the Clark Stream sediment input.
Seven samples were taken for suspended sediment concentration. The Clark stream is the principal sediment source (Fig. 56) for the Onyx, and a distinct sediment plume from the Clark is normally present at their confluence. The Clark stream passes through an area of sand dunes deposited during winter by westerly winds when the channel is partially infilled. Each summer the meltwater stream re-excavates the channel and discharges the sand into the Onyx. 80% of the Clark stream flow was observed to originate from the eastern glacier cliff where the margin ablation measurement stakes have been installed.
1982–1983. The sediment–loaded Clark stream flume with surface follower recording instrument.
First flow through the flume occurred on 8 December and a maximum discharge for the season of 140 Is−1 was recorded on 29 December. The stage record shows that this stream flows diurnally, with peak flows occurring in late afternoon close to 1700 and with low or zero flows between 0200 and 1000. Thirteen flow gaugings, using both volumetric and current meter methods, were carried out over a stage range of 0.034 m to 0.237 m, and a rating curve constructed.
Onyx channel
Ten cross-sections distributed along the length of the Onyx River channel were surveyed and discharges measured as part of a hydraulic-geometry study. The section positions were established and first measurements made during the 1980–1981 season. Sections 1 to 8 were measured over 21–22 December and sections 9 and 10 on 26 December.
Lake Vanda
Continuous water level records were made of Lake Vanda and although the Onyx River began flowing into Lake Vanda on 11 December, no apparent rise in lake level was detected until 21 December. From this date until the end of the record a rise of 532 mm was recorded and a surveyed rise of 654 mm was measured from 4 November to 31 January. With this season's rise, the lake level reached the threshold of a depression in the North Fork, a valley to the west of the lake. Overflow into this depression began about 12 January and was followed by a decrease in lake level as a channel was eroded. The lake levels fell by 33 mm between 13 and 20 January, while inflow from the Onyx remained high. Overflow continued until the depression was filled, adding an arm some 1000 m long to the lake.
The 1983–1984 summer Robertson (Reference Chinn and Dickson1994)
Personnel were J. Robertson and B. Mason.
Field programme
The work this season concentrated on the tributary stream hydrology with water level recorders installed a total of 7 sites.
Onyx at Lower Wright (Figs. 57, 58)
Water levels recorded on both a pressure bulb recorder and a surface follower digital instrument. This recorder had numerous periods of missing records due to icing at the sensor, low conductivity of the water, and air temperatures too cold for the batteries.
1983–1984. Onyx at Lower Wright instantaneous discharge record.
1983–1984. The renovated Lower Wright flow recording site.
Onyx at weir (Fig. 59)
After only clearing the stilling well of silt, the old Lea clockwork chart recorder performed perfectly for the season, apart from when it was removed from the inital flood flows (Fig. 60) which overtopped the stilling well and mount. Regular staff gauge readings were made during this gap in recording but have not been entered into the data archive. This flood caused some damage to the weir.
1983–1984. Onyx at weir instantaneous discharge record.
1983–1984. The 7 cumec flood experienced at the beginning of the summer.
Channel and tributaries (Fig. 4)
Clark stream
The flume installed here in 1982 is 20 m upstream of the Onyx confluence and was designed to cope with a bedload of dune sand (Fig. 61) which comes from sand dunes that form beside the Clark Glacier. Water levels were recorded digitally by electric plumbob sensor as used on the adjacent Lower Wright and other sites. Water from the Onyx flood at the beginning of the season backed up into this flume and hid the time of first flow of the Clark Stream.
1983–1984. Robertson attending to the Clark Flume surface follower recorder. Note the dirty water–the main source of sediment in the Onyx River.
Bartley and Meserve streams
Plywood flume structures and Stevenson climate screens were installed on streams flowing from each of the Meserve and Bartley Glaciers. Water levels were recorded by the digital surface-follower instuments as used at Lower Wright and Clark sites. The Meserve stream (Fig. 62) was installed about 60 m upstream of the Onyx confluence, on a single stream from the mid glacier. There was an insufficient range of discharges on these creeks to construct the necessary stage - discharge flow rating curves. The Bartley stream (Figs. 63, 64, 65, 66, 67) drains the eastern side of the glacier and the flume was installed about 20 m above the Onyx.
1983–1984. Meserve flume after first flow arrival.
1983–1984. Bartley flume recorder servicing.
1983–1984. Bartley flume is located just upstream of the confluence with the Onyx River.
1984–1985. Bartley flume damaged by an overtopping flow.
1984–1985. The Bartley east weir at near maximum capacity.
1983–1984. The weir on the Bartley west tributary.
Lake Vanda
Water level records were interrupted when the water level recorder had to be shifted above the rapidly rising lake level. Water levels rose 0.75 m from 15 December 1983 to 26 January 1984 and the staff gauge had to be extended (Fig. 68). The lake was discoloured by sediments carried in by the early season flood.
1983–1984. The Lake Vanda surface–follower recorder installation.
The 1984–1985 summer Smith (Reference Smith1985)
Personnel were L. Smith, P. Sole and V. Belgrave.
Field programme
This season emphasis was placed on the importance of the tributary flow hydrology, and water level recorders were installed at a total of 7 sites. In addition to the two main Lower Wright and weir sites, flow measurements were made on the Clark flume and new sites were set up on the Bartley East and West streams, together with air temperature records from screens erected at the glacier cliffs. The Meserve site was not used. This year there was considerable melt and the tributary streams were very active.
The levels of Lake Bull were also measured for a short time. In general, a full instrumental record was gained from all sites. When the team had to remove the instruments on 28 January for end of season departure, all streams were still flowing energetically.
Onyx at Lower Wright (Fig. 69)
A full record was gained from this site and a highest discharge of 6.13 cumecs was measured in the 14 flow gaugings made to construct the stage-discharge rating curve.
1984–1985. Onyx at Lower Wright instantaneous discharge record.
Onyx at weir (Fig. 70)
The weir overtopped on several occasions and remained flowing at 1cumec when the season ended on 28 January. and a highest discharge of 4 cumecs on 22 December was measured in the 17 flow gaugings made to construct the stage-discharge rating curve. No ice problems were encountered but the flood had left the weir now leaking seriously beneath the plywood wall.
1984–1985. Onyx at weir instantaneous discharge record.
Tributaries
A full season of flows was recorded at Clark flume and 10 flow gaugings made up to a maximum gauged flow of 172 l/s. The Meserve flume was removed and installed on the Bartley stream as one of the two plywood weirs installed close to the glacier at both Bartley East and Bartley West. Climate screens containing thermographs were also installed and operated close to the glacier cliffs. Discharges this season were considerably higher than anticipated and both of the weirs suffered some damage that caused lost records. Stage-discharge rating curves were constructed from a number of flow gaugings. Maximum gauged flow at Bartley West was 224 l/s and 266l/s at Bartley East on December 21. The streams were still flowing when instrumentation had to be removed on 25 January.
Weir notch icing (Fig. 71)
A severe case of icing of the Onyx weir notch took place in 1984–1985. The ice growth expanded to fill and close the entire v notch to produce an erroneous spike on the stage record.
1984–1985. A severe case of icing of the Onyx weir notch in 1984–1985. In this case the ice growth has expanded to fill and close the entire V–notch to produce an erroneous spike on the stage record.
The confetti-like platelets in supercooled water have some disturbing habits. In addition to adhering into wide terraces as an Asgaard Range shadow passes over, they also coagulate as they would under an applied flow pressure. Given favourable conditions the platelets accrete upwards into the falling water stream in a process similar to rime formation in a blizzard.
Commonly, the platelet ice builds up in a cone within the waterfall over the weir v notch until the notch is seriously obstructed. Such dams change the site stage-discharge relationship and render the stage measurements quite incorrect. Initially a ‘radiation hood’ was tried to deter this ice formation, but a more effective method was found to be black paint on the weir and wetted parts generously lubricated with a coating of slippery PTFE (polytetraflouroethylene).
The 1985–1986 summer Mason (Reference Mason1986), Dickson and Mosley (Reference Dickson and Mosley1986)
Personnel were P. Mason, W. Potter, R. Finlayson and P. Winters
Field programme
The main project work was to rebuild the flood-damaged weir at Vanda, and to carry out a basic hydrology programme of lake levelling and the glaciology work.
Onyx at Lower Wright (Figs. 72, 73)
A new external staff gauge was installed flow with the aid of a rock drill prior to the commencement of flow. The recorder operated satisfactorily over the season and was left operating to obtain the end of season flows.
1985–1986. Onyx at Lower Wright instantaneous discharge record.
1985–1986. Mason and Potter flow gauging at a high stage in the Lower Wright Reach.
Onyx at weir
During late November to early December, the old weir structure was demolished and a completely new structure built 3 m upstream of the old site (Figs. 74, 75). This most difficult and laborious task necessitated excavating deep into the boulders in permafrost to ensure that the base of the structure would be below the permafrost active layer (summer thaw depth) after being cemented by ice over the coming winter.
1985–1986. Mason excavating the new weir trench by jack–hammer.
1985–1986. The new weir excavation was assisted by explosives.
All that was required was a summer of little flow to wet the structure ready for freezing without any leaks or damage. Unfortunately, after the first flow arrived just as the structure was completed on 8 December, just eight days later on 16 December at 0730 a massive flood gauged at well over 8.75 cumecs arrived. Total flow would include the additional flow in side channels which by-passed the weir, and would be nearer 10 cumecs. The new weir stood the flood well and should continue for some considerable time in recording flows accurately (Fig. 76).
1985–1986. Onyx at weir instantaneous discharge record showing the 8 cumec flood that immediately set about destroying all of Mason's good work!
Wright lower glacier meltwater channels
An examination of the Onyx section where it was being held against the Doorly Range by an ice cliff demonstrated clearly that pond and dam formations were responsible for many of the perturbations of the Onyx discharge (Figs. 77, 78).
1985–1986. The Ice Cliff of the Lower Wright Glacier constraining the flow of the Onyx River against the slopes of the Doorly Ridge.
1985–1986. Downstream view of ponds formed in the Onyx River between the constraining glacier ice cliff and the slopes of the Doorly Range.
Onyx channel and tributaries
Recorders were placed on the Clark flume, and East and West Bartley weirs. A good record of the summer run-off from these glaciers was obtained and the recorders were removed at the end of season. Two thermograph instruments were placed, one each at the Bartley East and West sites, to examine the run off and air temperatures.
Lake Vanda
A continuous water level record was obtained at Lake Vanda during the summer although a punctured diaphragm lost several days of record. Summer rise was 750mm from 14 December 1985 to 31 January 1986.
Formal reports are not available for the following years, but river flows are tabled and plotted as for earlier years.
The 1986–1987 summer
Personnel were C. Lynch, D. Potter, J. Cowern and B. Anderson.
Field programme
Onyx at weir stages and glacier front position measurements were carried out.
Onyx at Lower Wright
Not visited
Onyx at weir (Figs. 79, 80, 81)
The largest flood yet on the Onyx. There was much leaking through and around the weir so that the weir recorded flows will include large errors. However season volume discharged may be calculated from the lake rise. The maximum discharges can only be guessed at as it estimated that only 1/3 of the flow went through the v notch channel, the remainder spread out to find alternative channels through the felsenmeer.
1986–1987. Onyx at weir instantaneous discharge record showing the massive 20 cumec January flood.
1986–1987. The weir and water level recorder during the January flood (Photo. C. Lynch).
1986–1987. Upstream view of the weir and water level recorder during the January flood. Note the stream in the background flowing in a separate channel (Photo. C. Lynch).
Channel and tributaries
No observations
Lake Vanda
Lake level measurements were continued and Lake Vanda was found to again rise over a significant 1.5m, to cause alarm for the future of Vanda Station.
The lake levels were surveyed from benchmarks:-

Annual change equates to an inflow of 6.78+ million cubic metres.
The 1987–1988 summer
Personnel were L. Grant, D. Paull, A. Quinn and G. Falloon.
Onyx at Lower Wright
As a result of the flood of the previous summer, no flow records were made at the Lower Wright site. After a visit to check the quality of the site, the state of the Onyx at Lower Wright was described in a letter (L. Grant, personal communication, March 1988)
There is no record from this site. The recorder has been’ damaged ‘by the flood with the instrument and mount tipped over, the box and Foxboro instrument broken and the chart gone. The recorder is still in its drum but is buried in gravel sediments.
Onyx at weir (Fig. 82)
Flow at the weir was recorded from 1 December for three weeks when a 5 cumec flood damaged hydrological recording gear. The weir and instrument mounting were repaired and records continued. The above is a full season record taken from the damaged weir. The most likely errors would be a questionable accuracy of the stage-discharge rating curve from loss of flow to copious leakage both beneath and around the ends of the weir structure. However we can calculate a season volume from the rise in Lake Vanda.
1987–1988. Onyx at Weir instantaneous discharge record.
Channel and tributaries
Both the weirs on the Bartley streams were still serviceable.
Lake Vanda
The lake levels were surveyed from benchmarks:-

Annual change = rise of 0.580 in survey report.
The 1988–1989 summer
Personnel were M. Doyle, G. Falloon, report by P. Sole
Onyx at Lower Wright (Figs. 83, 84)
The recording station was successfully replaced 80 m downstream of the old site using a gabion (rock mattress) control. Flow began on 4 December. The site flow-rating curve was constructed from the water levels and a number of flow gaugings were made.
1988–1989 The rebuilt control at the Onyx River at Lower Wright Gauging Station.
1988–1989. Onyx at Lower Wright instantaneous discharge record.
Onyx at weir (Fig. 85)
The leaks in the Onyx weir could not be repaired this season. However, flow gaugings done throughout the season enabled the weir to be re-rated with the leaks and a reliable record was obtained.
1988–1989. Onyx at weir instantaneous discharge record.
Sites beyond the Wright valley
According to recommendations of the 1985–1986 reassessment of Dry Valleys hydrology programme, P. Mosley had a new weir installed at the Upper Victoria Glacier stream and J. McConchie installed weirs in the Garwood valley to measure melt from the Garwood and Joyce Glaciers. Assistance was provided for the installation of weirs in the Miers Valley.
Channel and tributaries
No measurements were taken on the Wright Valley tributary streams.
Lake Vanda
The level of Lake Vanda was monitored once the moat opened in mid-December. A gradual rise of 35 mm was recorded. This had fallen back to 25 mm by 28 January, giving a surveyed net summer level change of 25 mm.
The lake levels were surveyed from benchmarks:-

The 1989–1990 summer
Personnel were G. de Rose, K. Taylor and the Vanda Station staff.
Field programme
The programme included the two Onyx sites and Lake Vanda levels, while beyond the Onxy work in the Wright Valley, Mosley continued a hydrological programme in Miers Valley.
Onyx at Lower Wright (Fig. 86)
Onyx at weir (Fig. 87)
Lake Vanda

1989–1990. Onyx at Lower Wright instantaneous discharge record.
1989–1990. Onyx at Weir instantaneous discharge record.
The 1990–1991 summer
A letter received from the Ross Dependency Research Committee to DSIR concluded the formal Onyx hydrology programme (J. Bradshaw, personal communication, 12 October 1990):
The Sub-committee looked at your proposal, particularly in the light of the interpretation of past results in your manuscript. It was felt that it was time for a change in direction and that further annual surveys could not provide a more accurate correlation with climate.
The committee suggested that the proposal be deferred and that you should re-design the research as a new project with new objectives. The lake level data-base could be kept going with periodic rather than annual surveys.
Personnel were L. Smith and B. George.
Field programme
Both of the Onyx River sites were operated and the Lake Vanda levels recorded. The second largest flood occurred during the period of observations which further damaged the rebuilt weir.
Onyx at Lower Wright (Fig. 88)
Onyx at weir (Fig. 89)
Channel and tributaries
No observations made
1990–1991. Onyx at Lower Wright instantaneous discharge record.
1990–1991. Onyx at weir instantaneous discharge record.
Lake Vanda
Daily staff gauge readings plus recorder chart are available. The surveyed levels measured were:-

The 1991–1992 summer
Lake Vanda
Continued to survey Lake Vanda levels from benchmarks:-

The 1992–1993 summer
Personnel K. Taylor.
Lake Vanda
The lake levels were surveyed twice from benchmarks with all of these levels in terms of 1990–1991 datum values;

The 1993–1994 summer
Personnel J. West,
Field programme
There was no hydrology but surveyors continued the lake levelling work.
Lake Vanda
The lake level records have not been found.
The 1994–1995 summer
Personnel were P. Mason, H. House (USGS) and P. Gilbert.
Field programme
In the 1994–1995 summer, one of the authors (P. Mason) was returned by NIWA to Lake Vanda from whence Vanda Station had been removed, to remove the damaged weir structure under the environmental ‘zero disturbance policy’. Under this policy all obsolete sites are to be returned as near as possible to their original state. This included the weir structure and river channel. Accordingly, everything possible was removed leaving only a small piece of the v notch solidly anchored into the permafrost, while the channel was then paved to its ‘original shape’ with hand placed rocks. This effectively regraded the weir site to its pre-1968 state with no controls at all for any hydrological measurements to be made.
The USARP LTER Project was starting hydrology work in the adjacent Taylor Valley and they installed a staff gauge to indicate water level at the original site. This site, now downgraded to only a wide paved channel with only a single staff gauge and no hydrologic control for sensitising the staff gauge stage (depth) readings, was handed over to the USGS to use the on the LTER monitoring programme.
Such an insensitive site cannot be considered to be adequate for flow measurements of any accuracy. Although a theoretical rating curve may be calculated for this site, flow discharge records of any reliability would require at least a dozen manual flow gaugings at all levels to generate an approximate stage-discharge rating curve. The staff gauge has been placed in the site as left as an indicator only of the seasonal trends of the Onyx for comparison with the Taylor Valley LTER readings.
II. Results and procedures from each summer season presented site by site in downstream sequence
The results of each season's work given chronologically in the previous chapters are arranged here by site and data type. Suspended sediment concentration data and water temperature data have not been entered onto the NIWA TIDEDA archive and are not included here, but are available in the annual reports.
Lower Wright glacier meltwater channels
Lower Wright ice
In a programme to determine the dominant source of the Onyx, aerial photographs and measurements were made of the major meltwater tributary channels, both on and from the Lower Wright Glacier. In total, 16 flow measurements were made on these streams to compare flows in the different streams (Fig. 43).
1981–1982 meltwater channels, Lower Wright Glacier
In the map (Fig. 40), flow measurements made at the meltwater channel sites found flows of; A = 100–150 l s−1, B = 200 l s−1 and C = 250–300 l s−1, and all discharged into Lake Brownworth through point ‘C’.
1982–1983, intermittent lakes and ponds: Lower Wright glacier
Recently the Lower Wright Glacier had apparently advanced marginally to abut against the toe of the slopes of Doorly Ridge. In this position, the ice cliffs pinched the channel of the Onyx, resulting in the intermittent formation of a large lake at the eastern extremity of the Doorly Ridge (Figs. 90, 91). In addition, icefalls from the glacier face dam the stream at infrequent intervals, causing local ponding. The filling and release of these ponds may have introduced significant non-climatic events into the flow regime of the Onyx (Fig. 92).
1978–1979. The large intermittent pond at the end of the Doorly Ridge.
1985–1986. Detail of a pond dammed by ice talus from an ice–cliff collapse, being slowly breached by the Onyx River.
1985–1986. Enigmatic pond ice. Ice that formed over a pond during the winter left stranded as the pond drained. However the slab that the person is standing on is only half of the thickness of the total lake ice covers that form over a full winter. How can the slab be thinner than the normal 3m in thickness?.
On 14 January 1983, when this area was photographed from the summit of the Doorly Ridge, the Doorly Lake was empty and in its place was an area of level ice incised by meandering meltwater channels. However, midway between a glacier cliff position site and the east end of Lake Brownworth, an icefall had blocked the Onyx channel, forming a pond some 400 by 200 m in area.
Ice dam floods
It became obvious that many of the high flows were from ice-dam failures rather than from spells of exceptionally high air temperatures. The margin of the Lower Wright Glacier impinged against the side of the Doorly Range and the glaciology measurements suggested that the frontal cliff currently might be moving into the Doorly Range (Fig. 91), constraining the flow of the river (Chinn Reference Chinn1985) (Figs. 77, 78) and had impounded meltwater ponds most summers. The largest of these was the lake at the end of the ridge, between Greenwood and Wilson piedmont ice (Fig. 90). The typical dam-failure hydrograph should have a very sudden rise to a single maximum followed by a typical hyperbolic flood depletion curve. The flood event of 1986–1987 has all the characteristics of a dam burst. There were a number of floods that also filled the criteria of a floodwave with a steep rise followed by an exponential flood recession curve of discharge over a number of days. An ice-dam flood release would also not affect the temperature-generated seasonal total. These probable dam-burst floods occurred in;
1971–1972 a small sudden flood of 6 cumec followed by a ‘normal’ recessional flow.
1984–1985 a sudden rise to over 6 cumecs particularly on the LWR trace.
1985–1986 a sudden uninterrupted rise to 9 cumecs, and again in;
1986–1987 when the flood doubled to 20 cumecs; and lastly in
1990–1991 when there was another modest but sudden flood of up to 6 cumecs.
This close grouping in years is consistent with a minor expansion of the Lower Wright Glacier impinging on the river channel at the foot of the Doorly Range.
Not all of the flood events are simple processes and the pond ice of Fig. 92 is one such enigma. This ice cover was left by a pond outburst apparently part way through the 1986 winter. However, if the meltwater had been stored over a full winter from the previous year, then the ice would be the standard 3 m thick. The thinner ice cover suggests either a dam release during winter, or alternatively the ponding occurred from some impossible winter melt source, unless it originated from a wet polythermal zone beneath the glacier.
Onyx at Lower Wright
Hydrographs
The synoptic weather changes are revealed by the major summer peaks and lows of each summer hydrograph. The timing of the intervals between high flows provides the timing of synoptic weather changes, with the biggest floods occurring when the warm katabatic wind is running and the peak daily mean discharges coincide with the maximum temperatures reached. The repeated daily phenomena of an early morning drop in discharge followed by a sudden rebound rise, that often represented the daily maximum, was a special characteristic for study.
1971–1972 daily patterns
The record shows daily maxima at about 05:30 and minima at about 18:00, indicating an average travel time between the Lower Wright and Vanda sites of about four hours for the peaks and about 11 hours for the minima. A recession in flow occurred from 13 January to the end of the season. Marked diurnal fluctuations are apparent in the record with daily maxima at about 14:00 and daily minima at about 05:00. These fluctuations show no correlation with those at the Lower Wright site. During 1972–1973 similar fluctuations were observed over a similar range of stream discharge.
1972–1973 daily patterns
The seasonal hydrograph again shows that marked diurnal fluctuations were characteristic. During late December the flow tended to peak about 12:00 and reached a minimum between 03:00 and 04:00. Rates of rise and fall in stage were particularly high just before and after the time of minimum flow. During mid-January the time of peak flow had shifted to between 10:00 and 20:00 local time, the reason is not known.
1972–1973 recommendations
The diurnal pattern of fluctuations of some of the major tributary streams to the Onyx River should be investigated, including the inflows to the Lower Wright lake from the northern edge of the glacier. Observations should be made of the outlet to the Lower Wright lake and the shallow lakes upstream from Lake Vanda to determine whether these lakes regulate streamflow by nocturnal freezing. A climate station should be installed on the Lower Wright Glacier to investigate the climatic parameters which control ablation in this environment. Most of these recommendations were carried out in the following seasons.
1980–1981 daily patterns
The site registers a daily early-morning water level rebound which has been observed and investigated on previous seasons. Observations of this phenomenon were again made on the morning of 14 January. At 04:30 after the area went into shadow, ice platelets in the supercooled water collected in accretions forming terracettes at the crest of a ponded area, some 100 m above the recorder sites. Between 04:45 and 05:00 the sun returned to the area and the terrace dams immediately began to disintegrate, releasing water ponded during freezing. Seven flow gaugings made over this period show the extent of the rebound, from a minimum of 43 to a maximum of 479 ls−1. This maximum is normally the maximum discharge for the day, and gave the highest recorded instantaneous discharge recorded this season.
1981–1982 daily patterns
This year the regular discharges were observed in detail. During normal to low flows, ice-dams or terraces form in the early morning east of the gauging site, causing marked variations in discharge (Fig. 93). This phenomenon was observed during the early morning of 15 December by noting river levels and conditions at 15 minute intervals. At the beginning of the observations, the river was in shadow, and carrying ice platelets which coalesced to form ice-dam ‘terraces’. Then from 0400, the sun began to return to the upstream section of the river permitting a release of water and a rise in stage. When these ice-dams disintegrated, they almost immediately released their water for what was often the highest flows for the day at near 05:00. The daily patterns were thus tracked down to the shadow of the Asgaard Range passing over the stream shallows at the Lake Brownworth outlet embayment, causing the supercooled stream to freeze the stream into constraining terracettes. The timing of the events shifted little under the low aspect of the summer sun.
1976. A trace of the recurring daily ice–dam low flow and thaw flood rebound at the Lower Wright site in January 1976. The initial high rebound was found to be from the release of water stored in local ice–terrace dams.
Annual discharge volume patterns
A full summary of the annual volume and flow parameters recorded at the Lower Wright site is provided below in Table 2.
Lower Wright; discharge (Q) summaries, 1972 to 1991. Q = discharge. DMD = Daily mean discharge
Onyx channel and tributaries
1970–1971 Tributary flows (Table 3)
1971–1972 Tributary flows
This season a much larger than average proportion of flow from the Asgaard Range alpine glaciers was observed. From visual observations on 27 and 28 December, it was estimated that approximately 25% of the Onyx flow was being contributed by the glaciers on the south side of the Wright valley. The daily-time of peak tributary flow was estimated occurring at approximately 16:00. With the sole exception of the Clark Glacier, no significant flow reached the Onyx from the glaciers in the Olympus Range.
Comparative flows of tributary streams in 1970–1971. See Fig. 16.
1971–1972 Channel evaporation loss
The Onyx River was gauged at a site immediately below the outlet of the Lower Wright Lake on 14 January 1972. There was no flow contribution from the glaciers below this point for a period of days over this date and the river remained in a steady state. The discharge during this time was measured at 0.491 m3 s−1.
This period of steady state showed in the weir hydrograph from 22:00 until the usual daily drop in flow occurred at 24:00. Interpretation of this data indicates a time of travel of approximately12 hours which agrees favourably with the previous season's time of travel measurements. The discharge at the weir was constant between these times at 0.443 m3 s−1. Therefore, evaporation and other losses for the 12 hour time of travel = (0.491–0.445) = 0.048 m3 s−1 representing a loss of 10%. Because of in-built gauging errors the accuracy of this figure can be expected to be within 5–6%.
1972–1973 Channel losses
Data from these two recorder sites show that significant water losses occur between Lower Wright and Lake Vanda. In addition to losses due to channel storage (measured above), evaporation losses must be considerable, particularly in the series of shallow lakes (including Lake Bull) upstream from Lake Vanda. Also, considerable amounts of water will be frozen in the channel at the end of summer and subsequently ablated during the winter. Water losses are greater than suggested by the data from the gauging sites because contributions from tributary streams are not considered.
1974–1975 Channel evaporation loss
Total summer discharge of the Onyx River at the Lower Wright site for 1974–1975 was 2.858 × 10⁶ m3. At Vanda weir the total summer discharge was 2.752 × 10⁶ m3. These values indicate a loss of some 0.086 × 10⁶ m3 between the two recording sites, suggesting that tributary stream contributions were well below evaporation losses from the river channel.
1977–1978 Channel storage
One unique aspect of the low flow for this season is that it enabled an approximate value for channel storage plus evaporation to be computed. The water of the Onyx almost reached Lake Vanda, stopping in an area of shallow ponds above Lake Bull, about 1.5 km upstream of Lake Vanda. Almost the whole of the storage capacity of the Onyx channel was filled. Thus the total volume for the season measured at the Lower Wright site approximately equals total channel storage plus total evaporation loss over a summer season for this river.
1979–1980 Tributary stream observations
4 December. Bartley Glacier was the only one found having flowing streams
24 December. A stream from Mt Peleus high and discoloured. An active mudflow was sighted in this area on 19 December.
26 December. Substantial flow from Bull Pass stream with a section flowing underground with sufficient flow to make moving boulders audible.
31 December. Most tributary streams now dry, but extensive ponding of water on the valley floor.
2 January. No significant flow in any of the tributary streams.
4 January. Clark Glacier stream flowing.
1979–1980 Clark stream
A temporary water level recorder and staff gauge use installed on Clark Stream on 5 January (see Table 4). Seven flow gaugings were made during the six day period that this recorder use in operation. The excellent stage record shows that this stream flows diurnally, with peak flows close to 1700, and flow normally drops and ceases between 0200 and 1000. The recorder was removed on 11 January. From the flow gaugings a provisional rating has been constructed for this site for 1982–1983 and subsequent years (Table 5; Figs. 94, 95, 96, 97, 98).
A summary of the tributary stream water level recorder sites.

Clark stream summary of flow measurements 1982–1983.

1983–1984. Making a flow gauging at the Clark flume.
1982–1983. Clark flume first discharge record, showing the nature of the intermittent flows.
1983–1984. Clark flume discharge record for 1983–1984, showing a comparison with daily mean air temperatures from the Lower Wright screen. The intermittent flow demonstrates again that the summer temperatures barely rise above the threshold for significant melt thus making the stream flow exceptionally sensitive to very small temperature variations.
1984–1985. Clark flume, showing the nature of the intermittent flows.
1985–1986. Clark flume discharge record for 1985–86, showing the flow interrupted by night freezing.
Meserve and Bartley tributaries
On the tributary measuring sites at both the Meserve and Bartley siltes, siltation, freezing combined with instrument failures fragmented the record. It was observed that the flows were dependent on the time of day as melt rates are dominantly governed by the angle at which the sunshine strikes the ice cliff margins of the glaciers.
1979–1980 Meserve stream
On 12 January a temporary water level recorder was installed on this stream approximately 30 m upstream of the confluence with the Onyx. This stream was seen to have peak flows in mid afternoon, but flows had depleted by the time the recorder was installed, and the stream was nearly dry on 13 January. Many flat sections of the hydrograph occurred when the stream was dry or frozen (see Fig. 62). The recorder was removed on 19 January.
1983–1984 Meserve stream
A flume control was installed this summer, but the combination of zero flow periods and freezing when there was some water meant this site was abandoned and the flume removed at the end of the season.
1979–1980 Bartley stream
A water level recorder was installed on one of the streams from the Bartley Glacier on 13 January and removed on 18 January. The record shows that the stream remained dry for most of the five day period. Later in 1983 a flume was installed which provided two seasons of useful records.
1983–1984Bartley stream flow record (Fig. 99)
1983–1984. The Bartley flume flow record for 1983–1984.
Bartley flume 1984–1985 flow record (Fig. 100)
1984–1985. The Bartley flume flow record for 1984–1985.
1984–1985 Bartley east weir flow record (Fig. 101)
1984–1985. The Bartley east weir and the discharge record for 1984–1985.
1984–1985 Bartley west weir flow record (Fig. 102)
1984–1985. The Bartley west weir and flow record for January of 1984–1985.
1985–1986 Bartley west weir flow record (Fig. 103)
1985–1986. The Bartley west weir and flow record for 1985–1986.
Onyx at weir: selected results by year
1970–1971. The peak instantaneous discharge of 9.91 m3 s−1, which occurred on 31.1.71, was considerably greater than the peak discharge of 1.08 m3 s−1 of the previous season and the weir designed peak of 2.0 m3 s−1. The step from this flow to an order of magnitude greater than predicted discharge has meant that the weir was overtopped on a number of occasions. The total volume discharged into Lake Vanda was just under 15 million m3, which is some 17.7 times greater than the volume for the previous season.
1971–1972. Daily flow patterns were similar to those recorded during the 1968–1969 and 1970–1971 summers. They showed a pattern of double peak discharge followed by an early morning period of low flow. One marked difference this season, however, was the more stable flow with smaller diurnal discharge variations. These stronger early morning flows, initial high discharge and cloudless skies during the commencement of flow, resulted in no build up of ice in the ‘V’ notch until the recession of flow at the end of the summer. This resulted in a very accurate stage-discharge relationship.
1972–1973. Short-period fluctuations with periods of less than 6 hours are superimposed on broader fluctuations with periods greater than 1 day. A sharp drop in stage occurs from about 12:00 to 04:00 local time and a sharp rise occurs from 04:00 to 06:00 to a level above normal followed by a rapid recession to normal flow.
The weir daily hydrograph
The daily hydrograph at the weir site has characteristics very similar to the Lower Wright hydrograph, with a corresponding minimum at about 05:00 followed by a rebound high stage occurring at about 06:00. This flow perturbation is caused simply by the shadow of the Asgaard Range passing over the supercooled water of the channel in initiating the formation of ice terracettes across all shallow water that pond part of the previous day's floodwave within the ice terrace series (Fig. 40). As at the Lower Wright site, this flood is frequently the daily maximum instantaneous flow (Fig. 104)
1981–1982. A trace of the daily flood rebound at the weir site in December 1981, showing a pattern similar to that at the Lower Wright. This similar daily dam and flood at the weir has the lows occurring at near 01:00 and the thawed discharge release peaks at 10:00.
Weir daily flow pattern characteristics
Throughout the records there is a pattern of double peak discharges occurring daily, followed by an early morning period of very low flow at very similar times as shown in the overlay plot of Fig. 105. This suggests that it may be possible to separate the flow into two sources, based on the time of travel in the river channel. Various other unusual flow patterns were also recorded. These traces show the long-term similarities and differences from the Lower Wright record (Table 6).
Onyx weir: discharge summaries, 1969–1991. Q = discharge. DMD = Daily mean discharge
Overplot of 11 years of record of the similar daily repetitive fluctuations for 20 January (to eliminate any effects of seasonal shift of the sun) at weir, showing the repetitive timing of the freeze and thaw of the supercooled water. Low flows occurred between 00:00 and 02:00 as a shadow from the Asgard Range passed over the river and ice terraces form in the supercooled water. A second shadow caused a second freezing between 05:00 and 07:00. From 07:00, rapid thaw released the ponded water and flows rose suddenly to the daily peak flows between 06:00 and 08:00.
Seasonal patterns
Theoretically the number of peak flows for each summer season should correspond with the spacing of synoptic changes of periods of highest temperatures and melt rates, and low flows with cool and cloudy weather. The pattern of high flow occurrences do indicate a comparatively stable weather system with synoptic changes taking 15 to 60 days to occur (Table 7).
Occurrence of synoptic warm and cool weather changes indicated by peak flows.

There is little modification to the seasonal flow on its way down the valley, so that the weir trace is only a slightly smoothed from the Lower Wright trace with small perturbations introduced by the tributary flows. The actual pattern each season holds much information both climatic temperature and non climatic, for example delayed and enhanced discharges from ice-dam failures.
Suspended sediment
Onyx river sediment originates mainly from a circular system in which winter westerly winds carry aeolian sediments westward, down valley towards the coast to form sand dunes in the vicinity of the Clark and Lower Wright Glaciers. In summer, glacier meltwater streams pick up these aeolian deposits as suspended and bedload sediments and carry the load into the Onyx where the sediments are carried back westward, towards but not into, Lake Vanda. Wind transport is the superior mechanism as, after the few million years that this system has been operating, bedload has yet to reach Lake Vanda. Bedload carried ceases in a felsenmeer of fractured bedrock upstream of Lake Bull. The seasons in which sediment samples were taken are noted with each year in the annual reports.
Suspended sediment concentrations are very low at the Lake Brownworth outlet, with concentrations of 0 to 10 ppm measured at the Lower Wright site. The water is commonly so pure that the electronic surface followers sometimes fail from insufficient conductivity to signal a contact. Below this site the Clark stream, passing through dune sand, carries sediment concentrations of of 500 to 1500 ppm. While down at the weir sediment concentrations for average flow years are 10 to 50 ppm. Suspended sediment discharge for the average season of 1971–1972 had a mean daily discharge of 1.06 tons/day that provided a total seasonal discharge into Lake Vanda of 75.66 tons.
Lake Vanda
The level of Lake Vanda falls on an average, 170 mm over winter, so that for equilibrium this sublimation loss (circa 1 mm per day) from the ice cover needs to be replaced by about 1.0×10⁶ m3 of inflow, plus another 0.4 x10⁶ m3 to compensate for the summer evaporation/sublimation loss of circa 2mm per day, a total input of 1.4 million cubic metres per summer is required to maintain equilibrium.
1972–1973. The level of Lake Vanda rose 0.055 m by the end of December and subsequently declined so that a net rise of only 0.02 m was recorded for the summer. Assuming that the present area of the lake is approximately 5.6 km2 (Chinn 1971) this corresponds to a storage increase of 0.112 × 10⁶m3. Neglecting inflows to the lake other than the Onyx flows the minimum evaporation loss during the summer would therefore be about 0.646 × 10⁶m3. With this small range of lake level change of only 0.055 m, the chart record, with a 0 to 1.5m scale, did not provide adequate resolution. Accurate lake level changes were determined by levelling.
1973–1974. The level of Lake Vanda dropped by 98 mm, from 10 November to 27 December, before significant inflows occurred. Average evaporation loss for this period was 2.15 mm/day, and total loss for the period was about 0.549 × 10⁶ m3 over an area of 5.6 km2. From 27 December to 1 February the lake level rose 404 mm, a gain of about 2.262 × 10⁶ m3 in volume. As total inflows from the Onyx river were 2.780 × 10⁶ m3 a minimum estimate of evaporation loss for the period (neglecting minor inflows from other melt streams on the north shore of the lake) is 0.518 × 10⁶ m3 or 1.92 mm/day. These estimates of summer evaporation rates are consistent with estimates from previous seasons except for 1970–1971 when stream discharge at Vanda weir was so high that errors in measuring the lake inflow were too large to permit a reasonable estimate of evaporation lose. Drilling for the DVDP programme has indicated that Lake Vanda also loses water to a local groundwater system (Cartwright and others 1974). The magnitude of this loss is not known at present.
1981–1982. During the season the level of the lake rose 589 mm with an approximate lake area of 5 km3, this corresponds to a net gain of 3 × 10⁶ m3 of water. The flow of the Onyx into the lake was 3.793 × 10⁶ m3. The computed ablation loss was therefore 0.793 × 10⁶ m3 over the period 8 December to 28 January. For a lake of 5 km3 area this corresponds to a depth loss of 159 mm. This figure corresponds favourably with the lake ice ablation losses of 172 and 135 mm measured at two sites over the same period.
1982–1983. This year the lake rose to overtop a threshold into the North Fork valley and formed a new arm to the lake. The first fall in lake level as the North Fork began to fill was recorded on 13 January, and the lake regained lost levels on 23 January. During this period of filling, the Onyx discharged 1.116 × 10⁶ m3 into Lake Vanda, which equates to the volume of the new arm of the lake (Fig. 106; Table 8).
Water balances: summer lake level changes and Onyx inflow volumes
*Lake data from Chinn Reference Chinn, Green and Friedmann1993: 20.
Comparative plot of seasonal water volumes measured at both of the Lower Wright (blue) and weir (orange) sites in cubic metres.
The level of Lake Vanda has been rising consistently since it was mapped in 1970, when the area of the lake was 5.31 km. (Chinn and McSaveney Reference Chinn and McSaveney1987). From an area-elevation curve constructed for the lake, the estimated area for the level at the beginning of the 1982–1983 summer was 5.37 km. The extent of the additional arm had a measured area of 0.16 km, giving an area for Lake Vanda at the end of the 1982–1983 summer of 5.53 km.
Water balances Onyx River and Lake Vanda (Table 8)
The consistency of the records and the close relationship between the LWR, weir and Lake Vanda data are demonstrated above in the histogram plot of results (Fig. 23), of the annual volumes discharged by the Onyx at the LWR and weir sites. The annual pattern of volumes vary on more of a cyclic than linear distribution, but overall there has been a significant warming that is neatly and indisputably recorded by the enclosed lake levels.
1972–1973. The total summer discharge of the Onyx for 1972–1973 at Vanda weir was approximately 0.750 × 10⁶m3 representing most of the inflow to Lake Vanda. The measured discharge of the Onyx at Lower Wright for the corresponding period (14 December to 5 February) was approximately 0.865 × 10⁶m3 allowing for a travel time of 12 hours, while the total measured discharge for the summer was 0.081 × 10⁶m3.
1973–1974. Total summer discharge of the Onyx at the Lower Wright site for 1973–1974 was 2.287 × 10⁶ m3. This quantity is consistent with a rough estimate of ablation for the same period from the tongue of the Lower Wright Glacier. At Vanda weir the total summer discharge was 2.780 × 10⁶ m3 compared to 2.180 × 10⁶ m3 at Lower Wright for the corresponding period. These values indicate that inflow from tributary streams contributed significantly to the flow of the Onyx.
During the period from 3 January to 19 January the flow at Vanda weir exceeded the corresponding flow at the Lower Wright by 0.630 × 10⁶ m3. Neglecting losses due to evaporation during this period of higher flows the measured excess is a reasonable estimate of the flow contribution from tributary streams and represents 26% of the total flow. For the remainder of the season flows at Lower Wright are similar to the flows at Vanda weir and the flow contribution from tributary streams is assumed to be similar to the evaporation loss.
1977–1978. This unique season in which the Onyx flow did not reach Lake Vanda but almost reached the weir. From these conditions, the volume measured at the Lower Wright become a close approximation to the channel storage of the river. Secondly the lowering of the level of Lake Vanda provides the value of summer sublimation and evaporation off the lake surface. Inflow from other surface streams was not observed and if any occurred, the volume would have been negligible.
1982–1983. During the season, the level of the lake rose 532 mm. With a mean summer lake area of 5.45 km2, this corresponds to a net gain of 2.889 106 m3 of water. Added to this is the volume of 1.116 × 10 6 m3 which did not contribute to a rise in level, but went into the new arm of the lake, giving a total increase to the volume of the lake of 4.01×10⁶m3. This compares favourably with the total measured input of 4.826 × 10 6m3 discharged by the Onyx. The difference of 0.816 × 10⁶ m3 represents an ablation loss of 150 mm over the mean area of the lake. This is close to the ablation losses of 184 mm and 135 mm measured at two sites on the lake over the period of inflow. The mean annual combined ablation and sublimation rate was 320 mm/a or 0.88 mm/day.
Discussion
Construction work
The 1969–1970 and 1987–1988 weir construction summers have demonstrated that any excavations and earthworks should be planned to be carried out towards the end of summer during the period of maximum thaw and not at the time of maximum permafrost ‘concrete’ at the beginning of the summer season. In the Wright valley, the depth of the ‘active layer’ or surface-thawed layer, was found to be 80 cm or less. Excavations at the end of summer can easily be made by hand and any structure cemented in by a few buckets of water. This gravel water mix becomes as firm as concrete after a winter of freezing, ready for the next summer flow, but it does need a protective layer of large rocks over the summer thawed active layer.
The rebuilt weir restructure of Mason in 1985–1986 had the potential to become a permanent installation cemented into the permafrost after it had been wetted by a normal flow. Most unfortunately it was immediately attacked and severely damaged by a 10 cumec flood before any ice cementing could take place. The experiences on this project show the need for any earthworks to follow the Antarctic seasons rather than the conveniences of available logistics and be done in the melted active layer at the end of summer, and then the winter freeze can be used to apply the cementing.
Ice terraces
Glacier terraces and ice cliffs are the dominant source of meltwater because of the interaction of solar radiation and ice topography (Chinn Reference Chinn1987; Lewis 1999). In addition, temporary terracettes in the stream channels from intermittent freezing of supercooled water have a similar strong influence on daily flow patterns. At the Lower Wright site, the daily flows are characterised by a persistent early morning low flows followed by a rebound wave which sometimes constitutes the maximum discharge for the day. This phenomenon was investigated (Fig. 93) and it was found that when the shadow of the Asgaard Range passes over the river, ice platelets in the supercooled water acrete into ice terracettes which dam a considerable amount of water across the shallow part of the stream. When the shadow moves from the area in the early morning, radiation immediately destroys the terraces to raise a floodwave that is frequently the highest discharge of the day. This wave is complimented by the later inclsion of the normal daily melt cycle and any additional contributions from the tributary streams, mainly from the Clark, Meserve and Bartley glaciers. However, before this complex daily flood cycle can be recorded at the weir site, the shadow of the Asgaard Range passes over the river channel, and another set of ice terraces form across a wide rocky area of the channel upstream of Lake Bull which creates another set of terracette ponding.
1972–1973 observations on climate relationships
Because the Onyx is fed primarily by meltwater from the Lower Wright Glacier stream discharge should be dependent on local climatic fluctuations at the seaward end of the Wright valley. (Meltwater from fresh snow away from glaciers is never seen in this dry environment). The data suggest that there is a correlation between daily mean discharge at the Lower Wright site and air temperature recorded at the Lower Wright hut. However, more comprehensive climate records from the Lower Wright, including measurements on the glacier itself would be needed to establish significant relationships between ice melt, glacier morphology and climatological parameters.
The seasonal flow patterns of the Onyx River at both Lower Wright and Vanda weir are very similar. Air temperatures at Vanda, which are consistently higher than at Lower Wright, also appear to show a correlation with streamflow. Incoming solar radiation at Vanda may show a lesser degree of correlation with streamflow.
1973–74 discussion
Because the Onyx River is fed primarily by meltwater from the Lower Wright Glacier, stream discharge is dependent on local climatic fluctuations at the seaward end of the Wright Valley. The data shows that there is a general correlation between daily mean discharge at both sites and daily maximum or minimum air temperature recorded at either Vanda station or Lower Wright. A linear regression analysis indicates that significant correlation exists between daily mean discharge at Lower Wright and daily maximum, minimum or mean temperature at Lower Wright. The best correlation is between discharge and mean temperature (r = 0.76 at 0.05 level). Temperature explains about 60% of the variance of discharge but further analysis is necessary including consideration of time lag and additional variables, particularly net radiation. Ideally, climatological records should be obtained from a site on the Lower Wright Glacier.
A significant time lag is apparent between the maximum air temperature recorded at Lower Wright hut and the peak meltwater discharge at Lower Wright site during the period of highest flows. Air temperature peaked at about 15:00 and discharge peaked eight hours later at about 23:00.
Although flow at Vanda weir shows a strong correlation with flow at Lower Wright during periods of high discharge, (the annual discharge plots) the diurnal flow pattern during periods of lower discharge is more closely correlated with air temperature fluctuations recorded at Vanda Station.
Meltwater production
Flows arise almost exclusively from ice melt in the summer when temperatures barely rise sufficiently to melt the lowest extremities of the glaciers. Thus the annual melt volumes are fundamentally a product of summer energy input and area of ice at low altitudes. Production of this melt runoff is modified to a large degree by the amount of terracing, both length of ice cliff and extent of glacier surface terracing. The changes in snow cover have a negative effect from the increased albedo lowering energy input that noticeably retards melt (see 1977–1978 zero flow). Seasonal snow cover has not been seen to ever generate meltwater
Floods
In contrast to the standard rainstorm generated floods, the changes in discharge of the Onyx are not necessarily always weather related. Non-climatic events caused by temporary ice dam events, both large and small. Daily changes result from temporary ice micro-terrace formation, while massive floods are occurring by failure of glacier ice-cliff dams. Although in these cases the river stage may not be indicative of temperature, the seasonal volume discharged does as it accurately measures the heat balance of the summer.
Accuracy of hydrological measurements
All of the fieldwork was carried using the current practices employed in hydrological monitoring in New Zealand Institutes. These methods employ the direct and most accurate method of deriving stream discharge from measured stage by using rating curves obtained by the use of current flow meters. At each site flow gauging methods used standard bucket current meters, checked for accuracy at the Christchurch rating tank, with water velocities measured at 0.2 and 0.6 depths (where possible) and spaced at the international standard of intervals to provide 20 verticals for each of the gauged sections. A minimum of about a dozen flow gaugings including near the highest and lowest stages were made for each rating curve. New rating curves were reconstructed for every control change or weir modification that occurred. The discharge plots presented here are the corrected versions of the Annual Report data standardised to NIWA protocol. The given plot traces are computer generated from the full set of 15-minute or equivalent recorded stage values, where plotted circles mark any breaks in the record caused by no or incorrect data.
The NIWA data record (http://www.niwa.co.nz/) on which the plots presented here were constructed have been checked to the NEMS (New Zealand Data Exchange Standard for Meteorology and Hydrology standards) while being loaded into the NIWA electronic archive.
Thus the main errors will be from site structural and equipment errors. Of the instrumental measurement errors the largest and most obvious will be from icing and the smallest and negligible from instrument calibration. The most obvious of the site structural errors are those from weir overtopping, which seriously dampens the sensitivity of the record, followed by change of shape of the structure and leakage through and around the structure. Where measured discharges could be greater than about 20%, the trace (if any existed) has not been used, or has been drawn as a line between two reliable measurements. The high quality of the hydrological work on this project may be judged by the available correlations of seasonal volumes measured at the three sites (Lower Wright, weir and Lake Vanda) given in Figs 108, 109, 110.
Cumulative level changes for all measured Dry Valleys lakes measured on annual surveys showing that Lake Vanda follows the warming rise trend common to all Dry Valleys lakes (Chinn Reference Chinn, Green and Friedmann1993).
Regression of the annual volume discharges of the weir and Lower Wright volumes.
Regression of the annual volume discharges of the weir and Lake Vanda volume change.
Detail of the volume discharged into Lake Vanda and lake level change.
Climate sensitivity range of the river; hourly to geological
This study provides very sensitive climate data over a very wide range of timespans:
Hourly data is provided by river discharge traces;
Daily data by stream daily mean discharges;
Weekly to monthly data by stream daily mean discharges;
Seasonal data by each summer record;
Annual data from the stream discharge amounts and lake level surveys;
Decadal changes may occur from changes in glacier surface nature (terracing, debris cover) and gradient of the very flat ice tongues where area altitude curves are very sensitive to threshold temperatures.
Long-term measurements from past and palaeo-lake levels;
Glacier fluctuations provide century to millenium changes, as meltwater production changes are related to glacier ice area-altitude distribution and to ice cliff length. These changes are so slow that they are more related to geology than hydrology(Chinn Reference Chinn1985), excepting in the special case where temporary ponding of meltwater occurs.
Glacial geology provides millenium to million year changes.
By far the most valuable part of the system is in the unique topography that holds many enclosed lakes. Each of these lakes captures its supply of meltwater runoff to provide a uniquely accurate measure of summer runoff and hence climate (Chinn Reference Chinn, Green and Friedmann1993; Fig. 107). Compared to the complexity of usual studies of rivers, these lakes provide a single figure, from their change in volume, that is a measure of the climate. In addition these lakes hold data on past high levels as fossil beaches, and contain internal layering recording past lowering. The hydrologic processes in the Dry Valleys constitute as accurate and precise measure of the polar climate as any other on the globe.
Conclusion
This relatively long record of the hydrology of an Antarctic valley represents a unique climate dataset. It is the combination of both location and sensitivity of the hydrological system to climate change that makes it particularly valuable at a time when climate change has assumed world wide prominence. During the times when the work was undertaken, attempts were made to make traditional correlations of stream discharge with temperatures similar to basic rainfall ~ discharge correlations. These correlations were not spectacular because the high sensitivity of processes operating so close to the threshold of melt was not appreciated. In addition to summer temperatures melt generation is more sensitive to glacier morphology (cliffs and terraces) rather than areas of snow and ice cover. It is the area-altitude curve of ice distribution together with lengths of north facing ice cliffs that are the significant melt sources (Chinn Reference Chinn1987; Lewis Reference Lewis, Fountain and Dana1999).
This paper demonstrates the necessity to step beyond the simple convention of applying volume against temperature or similar correlations when dealing with sensitive climatic systems. By this publication it is intended to make this relatively unique and detailed data-set readily available and catalogued in an international publication before the record, in part held only as annual reports, becomes irrevocably distributed and lost. By this publication it is intended to assist the next stage of climate studies to be continued on some of the world's most sensitive climate indicators situated in one of the most important locations for climate change studies. The inadequacy of simplistic correlations has been plainly demonstrated by numerous conflicting interpretations that have developed into arguments for example the discussions on the simple correlations of the Franz Josef Glacier length changes with temperature and precipitation in Hessell (Reference Hessell1983) and Salinger (Reference Salinger, Heine and Burrows1983). The correlations became significant some years later when a similar type of glacier data was correlated by the use of models of atmospheric circulation by Woo and Fitzharris Reference Woo and Fitzharris1992 and Clare and others (Reference Clare, Fitzharris, Chinn and Salinger2002). It is anticipated that an approach similar to this used on New Zealand glaciers where ice mass volume changes have been matched to the different climatic circulation systems for example Chinn and others (Reference Chinn, Salinger, Fitzharris and Willsman2012) when applied to the Dry Valleys climate and hydrology will produce significant and valuable results.
The work presented here provides a rare and valuable database for continuing climate circulation studies of the Antarctic. We cannot afford to ignore the opportunity to track our changing climate provided by the simple measurements provided by these rivers and lakes.