Introduction
The citrus weevil, Diaprepes abbreviates L. (Coleoptera: Curculionidae), is the most severe pest of citrus orchards in Florida (Nigg et al., Reference Nigg, Simpson, Ramos, Tomerlin, Harrison and Cuyler2001; McCoy et al., Reference McCoy, Rogers, Futch, Graham, Duncan and Nigg2008). It was first introduced into this state in 1964 (Beavers & Selhime, Reference Beavers and Selhime1975), and since then it has contributed greatly to the spread of disease and damage to citrus and other crops, at a cost of several million dollars annually (Weissling et al., Reference Weissling, Peña, Giblin-Davis and Knapp2002). The severity and extensive distribution of this pest prompted research on diverse control measures, including chemical and biological alternatives. In particular, entomopathogenic nematodes (EPN) have been one group of the most studied biocontrol organisms for the citrus weevil in Florida (Campos-Herrera et al., Reference Campos–Herrera, Pathak, El–Borai, Stuart, Gutiérrez, Rodríguez–Martín, Graham and Duncan2013; Duncan et al., Reference Duncan, Stuart, El-Borai, Campos-Herrera, Pathak, Giurcanu and Graham2013). Several Steinernema and Heterorhabditis spp. were tested in laboratory and field trials (McCoy et al., Reference McCoy, Shapiro, Duncan and Nguyen2000; Shapiro & McCoy, Reference Shapiro and McCoy2000; Duncan et al., Reference Duncan, Stuart, El-Borai, Campos-Herrera, Pathak, Giurcanu and Graham2013). For example, Steinernema carpocapsae (Weiser, 1955) and Heterorhabditis bacteriophora Poinar, 1976 were considered to control citrus weevil. Additionally, EPN formulations with S. riobrave Cabanillas, Poinar and Raulston, 1994 and Heterorhabditis indica Poinar, Karunakar and David, 1992 were also used for this purpose. More recently, Steinernema díaprepesi Nguyen and Duncan, 2002, a natural EPN species isolated from larvae of the citrus weevil, was shown to be highly effective in the control of this pest (El-Borai et al., Reference El-Borai, Zellers and Duncan2007a, Reference EL-Borai, Brentu and Duncanb; Stuart et al., Reference Stuart, El-Borai and Duncan2008)
During a field study conducted by El-Borai et al. (Reference EL-Borai, Bright, Graham, Stuart, Cubero and Duncan2009) a novel Steinernema population, SxArc, was recovered, originally identified as Steinernema glaseri (Steiner, 1929). Subsequent EPN surveys in citrus groves and natural areas in Florida re-isolated this species-type, as well as other species including S. diaprepesi, S. glaseri and Steinernema phyllophagae (Nguyen & Buss, 2011) (Campos-Herrera et al., Reference Campos–Herrera, Pathak, El–Borai, Stuart, Gutiérrez, Rodríguez–Martín, Graham and Duncan2013, Reference Campos-Herrera, El-Borai, Rodriguez Martin and Duncan2016). Molecular markers used to identify these species/populations confirmed that Steinernema population SxArc is an undescribed novel species (Campos-Herrera et al., Reference Campos–Herrera, Johnson, El–Borai, Stuart, Graham and Duncan2011). Therefore, in this study, we describe this nematode, considering a combination of differential interference contrast optics, DNA sequence analysis and cross-hybridization methods. We also provide information on the distribution and habitat range of this new species.
Materials and methods
Nematode isolation and rearing
Nematodes were isolated from soil samples collected beneath citrus trees using the insect-baiting method of Bedding & Akhurst (Reference Bedding and Akhurst1975). Cadavers with positive signs of nematode infection were placed individually in modified White traps (Kaya & Stock, Reference Kaya, Stock and Lacey1997) to recover infective juvenile (IJ) progeny. A 30% bleach solution was used to surface sterilize the nematodes for 15 min. Surface-sterilized nematodes were used to infect fifth instar Galleria mellonella L. (Lepidoptera: Pyralidae) larvae (100 IJs per insect) to confirm Koch's postulates for pathogenicity (Kaya & Stock, Reference Kaya, Stock and Lacey1997). Emerging IJ progeny were stored in 250-ml tissue-culture flasks for subsequent identification and establishment of cultures, following procedures described by Stock & Goodrich-Blair (Reference Stock, Goodrich-Blair and Lacey2012). Live cultures are currently maintained in Dr L. Duncan's laboratory (University of Florida, USA).
Differential interference contrast microscopy
Adult stages (first and second generation) and third-stage infective juveniles (IJs) were collected randomly from infected cadavers and modified White traps, respectively. Twenty-five randomly selected specimens of each nematode stage were heat killed and relaxed in M9 buffer (Stiernagle, Reference Stiernagle2006) in a water bath heated to 60°C for further morphological examination. Heat-killed specimens were fixed in formaldehyde–acetic acid solution (FA, 4:10) (Franklin & Goodey, Reference Franklin and Goodey1949), slowly dehydrated and processed to anhydrous glycerin (Seinhorst, Reference Seinhorst1959). Specimens were mounted on glass slides, using Pliobond® industrial contact cement to both seal and provide cover glass support (Lee et al., Reference Lee, Sicard, Skeie and Stock2009). An Olympus BX51 microscope equipped with differential interference contrast optics and Olympus Microsuite software (Soft Imaging System Corp., Center Valley, Pennsylvania, USA) was used to obtain morphometric data of each nematode specimen. Morphological characters measured were based on the recommendations of Hominick et al. (Reference Hominick, Briscoe and del Pino1997). The following abbreviations have been used in the text or tables: TBL, total body length; MBW, maximum body width; ES, distance from anterior end to base of pharynx; NR, distance from anterior end to nerve ring; EP, distance from anterior end to excretory pore; ABD, anal or cloacal body diameter; TL, tail length; GuL, gubernaculum length; SpL, spicule length (measured in situ, along the curvature in a line along the centre of the spicule); H, length of hyaline portion of tail; StL, stoma length; StD, stoma diameter; ML, mucron length; V, (distance from anterior end to vulva/TBL) × 100; and the following indexes: a = TBL/MBW; b = TBL/ES; c = TBL/TL, D% = (EP/ES) × 100; E% = (EP/TL) × 100; GS% = (GuL/SpL) × 100; H% = (H/TL) × 100 and SW% = (SpL/ABD) × 100. Line drawings were prepared from digitized camera lucida and/or from video images.
Scanning electron microscopy (SEM)
Infective juveniles and male specimens were heat-killed in M9 buffer and subsequently fixed in 8% glutaraldehyde in cacodylate buffer at pH 7.3 overnight. Fixed nematodes were rinsed in deionized distilled water three times, post-fixed in osmium tetroxide for 1 h and rinsed again in distilled water before being subjected to a serial dehydration process in ethanol (McClure & Stowell, Reference McClure and Stowell1978). Specimens were critical-point dried in liquid carbon dioxide, mounted on SEM stubs and coated twice with gold. Observations and image recordings were made at 5 kV accelerating voltage on a Hitachi S-4800 Type II series microscope equipped with a digital camera (Hitachi, Austin, Texas, USA).
Molecular characterization
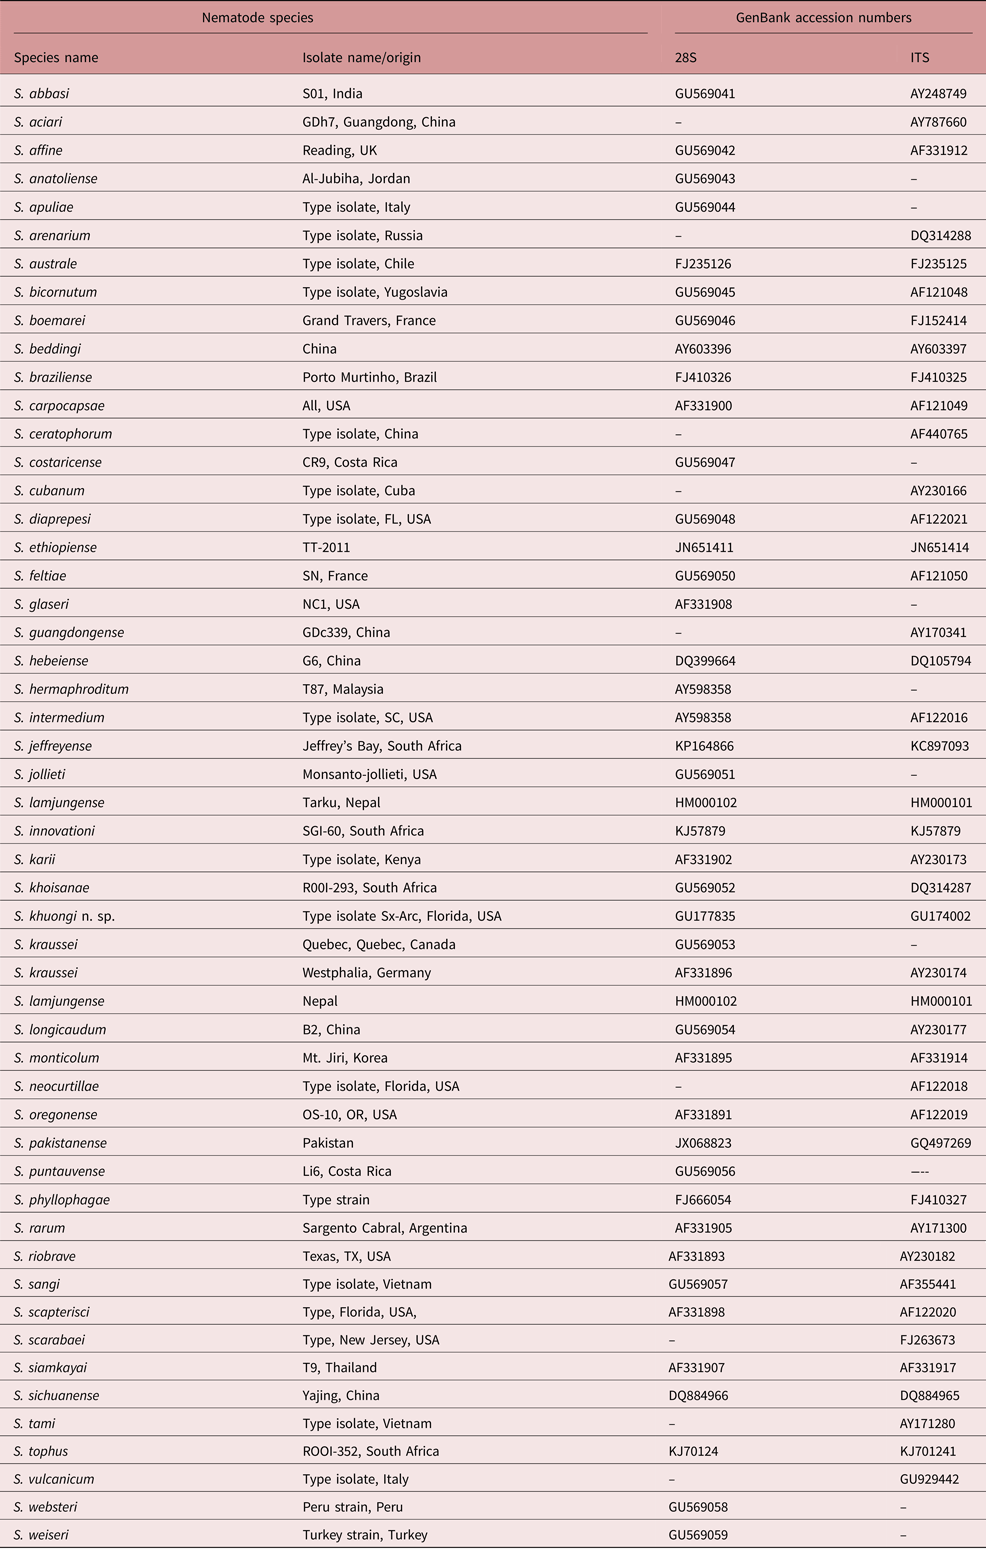
The nematodes were characterized molecularly using two rDNA molecular markers: the D2D3 section of the 28S and the internal transcribed spacer (ITS) region. Total genomic DNA isolation, polymerase chain reaction (PCR) amplification (reaction, cycling conditions and primers) followed protocols described by Hominick et al. (Reference Hominick, Briscoe and del Pino1997) and Nguyen et al. (Reference Nguyen, Maruniak and Adams2001). Reactive and cloning protocols were described in Campos-Herrera et al. (Reference Campos–Herrera, Johnson, El–Borai, Stuart, Graham and Duncan2011). Sequence data were compared with an existing library of more than 70 Steinernema spp. (P. Stock's Laboratory, University of Arizona, USA) and available sequences found in GenBank (table 1). Additionally, species-specific primers and probes were employed to identify and quantify S. khuongi n. sp. in field studies (Campos-Herrera et al., Reference Campos–Herrera, Johnson, El–Borai, Stuart, Graham and Duncan2011, Reference Campos–Herrera, Pathak, El–Borai, Stuart, Gutiérrez, Rodríguez–Martín, Graham and Duncan2013, Reference Campos-Herrera, El-Borai, Rodriguez Martin and Duncan2016). Primer information and details of real-time quantitative PCR (qPCR) protocols were described by Campos-Herrera et al. (Reference Campos–Herrera, Johnson, El–Borai, Stuart, Graham and Duncan2011).
List of Steinernema spp. and GenBank accession numbers considered for the phylogenetic studies.

Phylogenetic analysis
SeqEdit software (DNA Star Inc., Madison, Wisconsin, USA) was used to perform contig assembly and sequence ambiguity resolution. Sequences were aligned using Geneious software (http://www.geneious.com; Kearse et al., Reference Kearse, Moir and Wilson2012) under default alignment parameters, and alignment inconsistencies were corrected by hand in Mesquite v2.75 (Maddison & Maddison, Reference Maddison and Maddison2011). Following Nadler et al. (Reference Nadler, Bolotin and Stock2006), Caenorhabditis elegans Maupas 1900 (Nematoda: Rhabditidae) and Panagrellus redivvus (Linnaeus, 1767) (Nematoda: Panagrolaimidae) were used as the outgroup taxa for ITS and 28S phylogenetic analyses, respectively. Sequences for the new Steinernema species were deposited in GenBank (accession numbers are provided in table 1).
Each dataset was analysed by unweighted maximum parsimony (MP) and Bayesian criteria (Huelsenbeck & Ronquist, Reference Huelsenbeck and Ronquist2001). MP methods were performed in PAUP* v.4.0b10 (Swofford, Reference Swofford2002) following standards described by Stock et al. (Reference Stock, Campbell and Nadler2001a) and Nadler et al. (Reference Nadler, Bolotin and Stock2006).
Cross-hybridization
Reproductive compatibility of the new species was tested using the modified hanging-blood assay described by Kaya & Stock (Reference Kaya, Stock and Lacey1997). Two morphologically similar and close relatives of the new species, Steinernema cubanum Mráček, Hernandez and Boemare, 1994 and S. glaseri were considered for cross-hybridization assays to assess the reproductive compatibility of this new species. Controls consisted of crosses with male and single female nematodes of the same species, as well as single females only. There were ten replicates per cross and tests were repeated twice.
Results and discussion
Description of Steinernema khuongi n. sp.
First-generation male
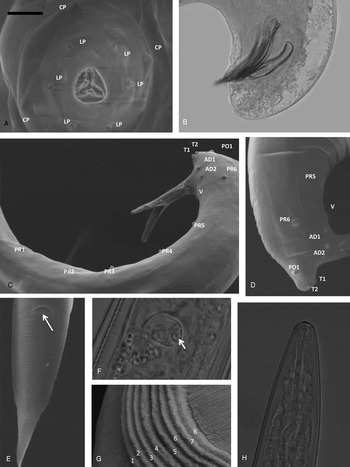
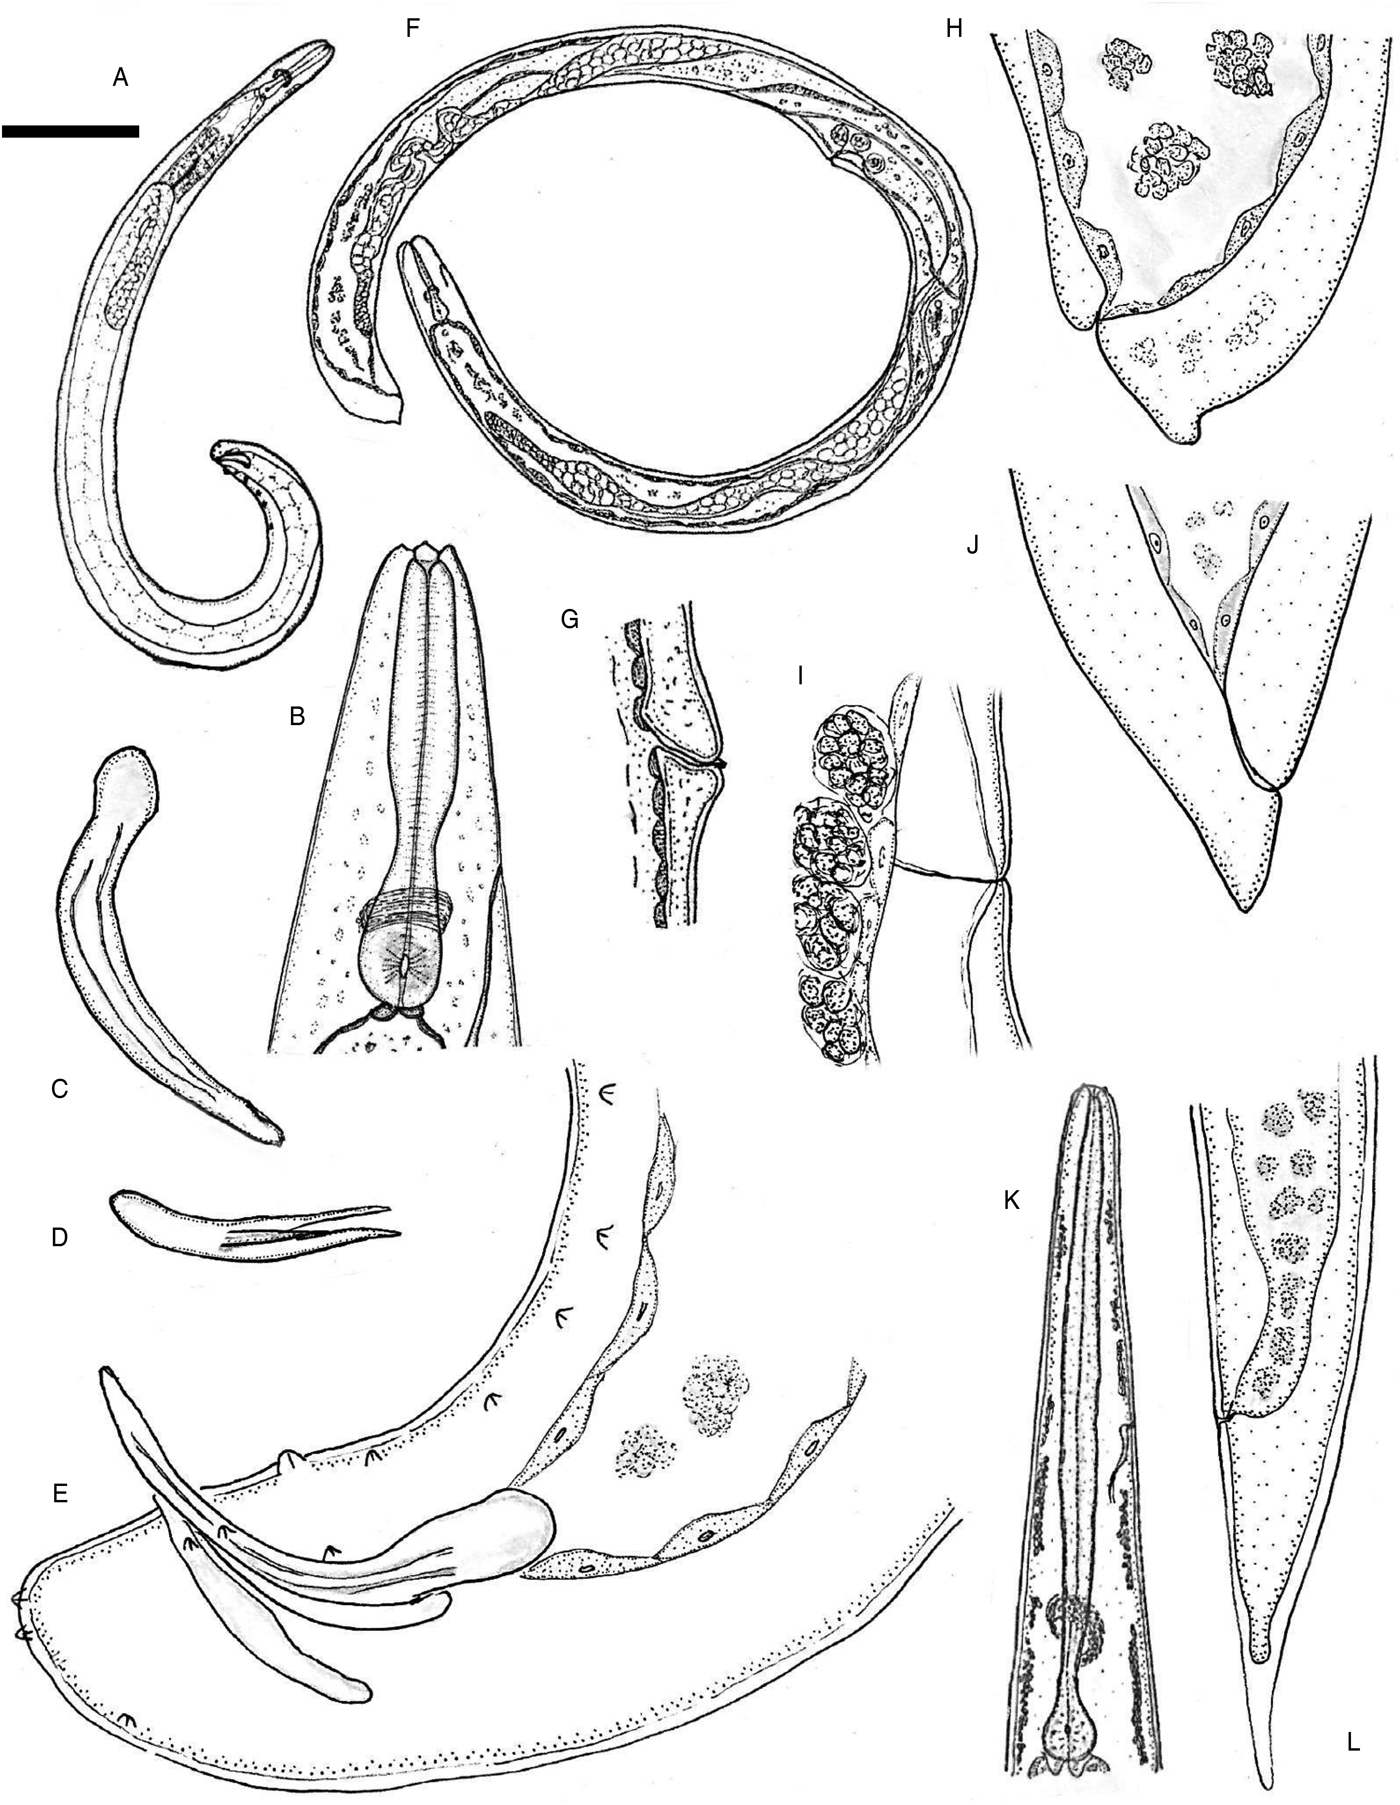
Body slender, ventrally curved posteriorly, J-shaped when heat killed (fig. 1A). First-generation male larger (average 1309 μm) than second-generation male (average 1200 μm). Cuticle smooth under light microscopy. Lateral field and phasmids inconspicuous under light microscopy. Head truncate to slightly round, continuous with body (fig. 1B). Six lips amalgamated but tips distinct, with one labial papilla each. Four conspicuous cephalic papillae (fig. 2A). Amphidial apertures small, located posterior to lateral labial papillae. Stoma reduced (cheilo-, gymno- and stegostom vestigial), short and wide, with inconspicuous sclerotized walls. Deirids inconspicuous. Pharynx muscular with a cylindrical procorpus and a metacorpus slightly swollen and non-valvate. Isthmus indistinct followed by pyriform basal bulb with reduced valve. Nerve-ring usually located about mid-isthmus level or on the anterior part of the basal bulb (fig. 1B). Excretory pore opening circular, located anterior to nerve ring at anterior third of metacorpus (fig. 1B). Testis monorchic, ventrally reflexed (fig. 1A). Spicules paired, symmetrical, curved, with ochre-brown coloration (figs 1C and 2B). Manubrium rhomboidal (fig. 1C). Shaft distinct. Blade without rostrum or retinaculum and two internal ribs. Velum absent (fig. 1C). Blade terminus blunt. Gubernaculum arcuate, about half the length of spicules. Manubrium of gubernaculum curved ventrally (figs 1D and 2B). Tail conoid and non-mucronate, with no bursa (figs 1E and 2B, D). There are 23 genital papillae (11 pairs and one single) arranged as follows: five pairs subventral precloacal, one pair lateral precloacal, one single ventral papilla, two pairs subventral adcloacal, one pair subdorsal postcloacal and two pairs of terminal papillae (figs 1E and 2C, D).
Steinernema khuongi n. sp., line drawings. First-generation male: (A) full body, lateral view; (B) anterior end (lateral view), showing stoma region; (C) spicule, lateral view; (D) gubernaculum, ventral view; (E) tail (lateral view), showing genital papillae, spicules and gubernaculum. First-generation female: (F) full body, lateral view; (G) vulva, lateral view; (H) tail, lateral view. Second-generation female: (I) vulva, lateral view; (J) tail, lateral view. Third-stage infective juvenile: (K) anterior end, lateral view, showing pharyngeal region, nerve ring and excretory canal; (L) tail, lateral view. Scale bars (see (A)): (A) 180 μm; (B, J) 42 μm; (C) 24 μm; (D, I) 50 μm; (E) 22 μm; (F) 270 μm; (G) 70 μm; (H) 36 μm; (K) 32 μm; (L) 34 μm.
Steinernema khuongi n. sp., light and scanning electron microscope (SEM) photographs. First-generation male: (A) anterior end, showing six labial papillae (LP) and three of the four cephalic papillae (CP) en face view; (B) tail, lateral view; (C) SEM of the tail, showing genital papillae, lateral view; (D) close-up of the tail end, showing distribution of papillae, lateral view. AD1, adanal papilla 1; AD2,adanal papilla 2; V, ventral papilla; T1, terminal papillae1; T2, terminal papillae 2; PO1, post-anal papillae 1; PO2, post-anal papillae 2; Pr1-6, pre-anal papillae1-6. Third-stage infective juvenile: (E) SEM of tail, showing anus position (arrow), ventral view; (F) intestinal bacterial receptacle (arrow), lateral view; (G) SEM of lateral field, showing ridges (1–8); (H) anterior end, lateral view. Scale bars (see (A)): (A) 5 μm; (B, D, H) 30 μm; (C) 40 μm; (E) 15 μm; (F) 25 μm; (G) 7.5 μm.

Second-generation male
General morphology similar to that of first-generation males, but smaller in size. Presence of deirids unknown. Tail without mucro. Spicules with manubrium morphology similar to those of first-generation male. Gubernaculum more slender and longer than that of first-generation male.
First-generation female
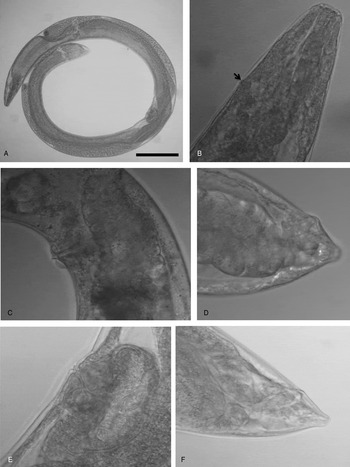
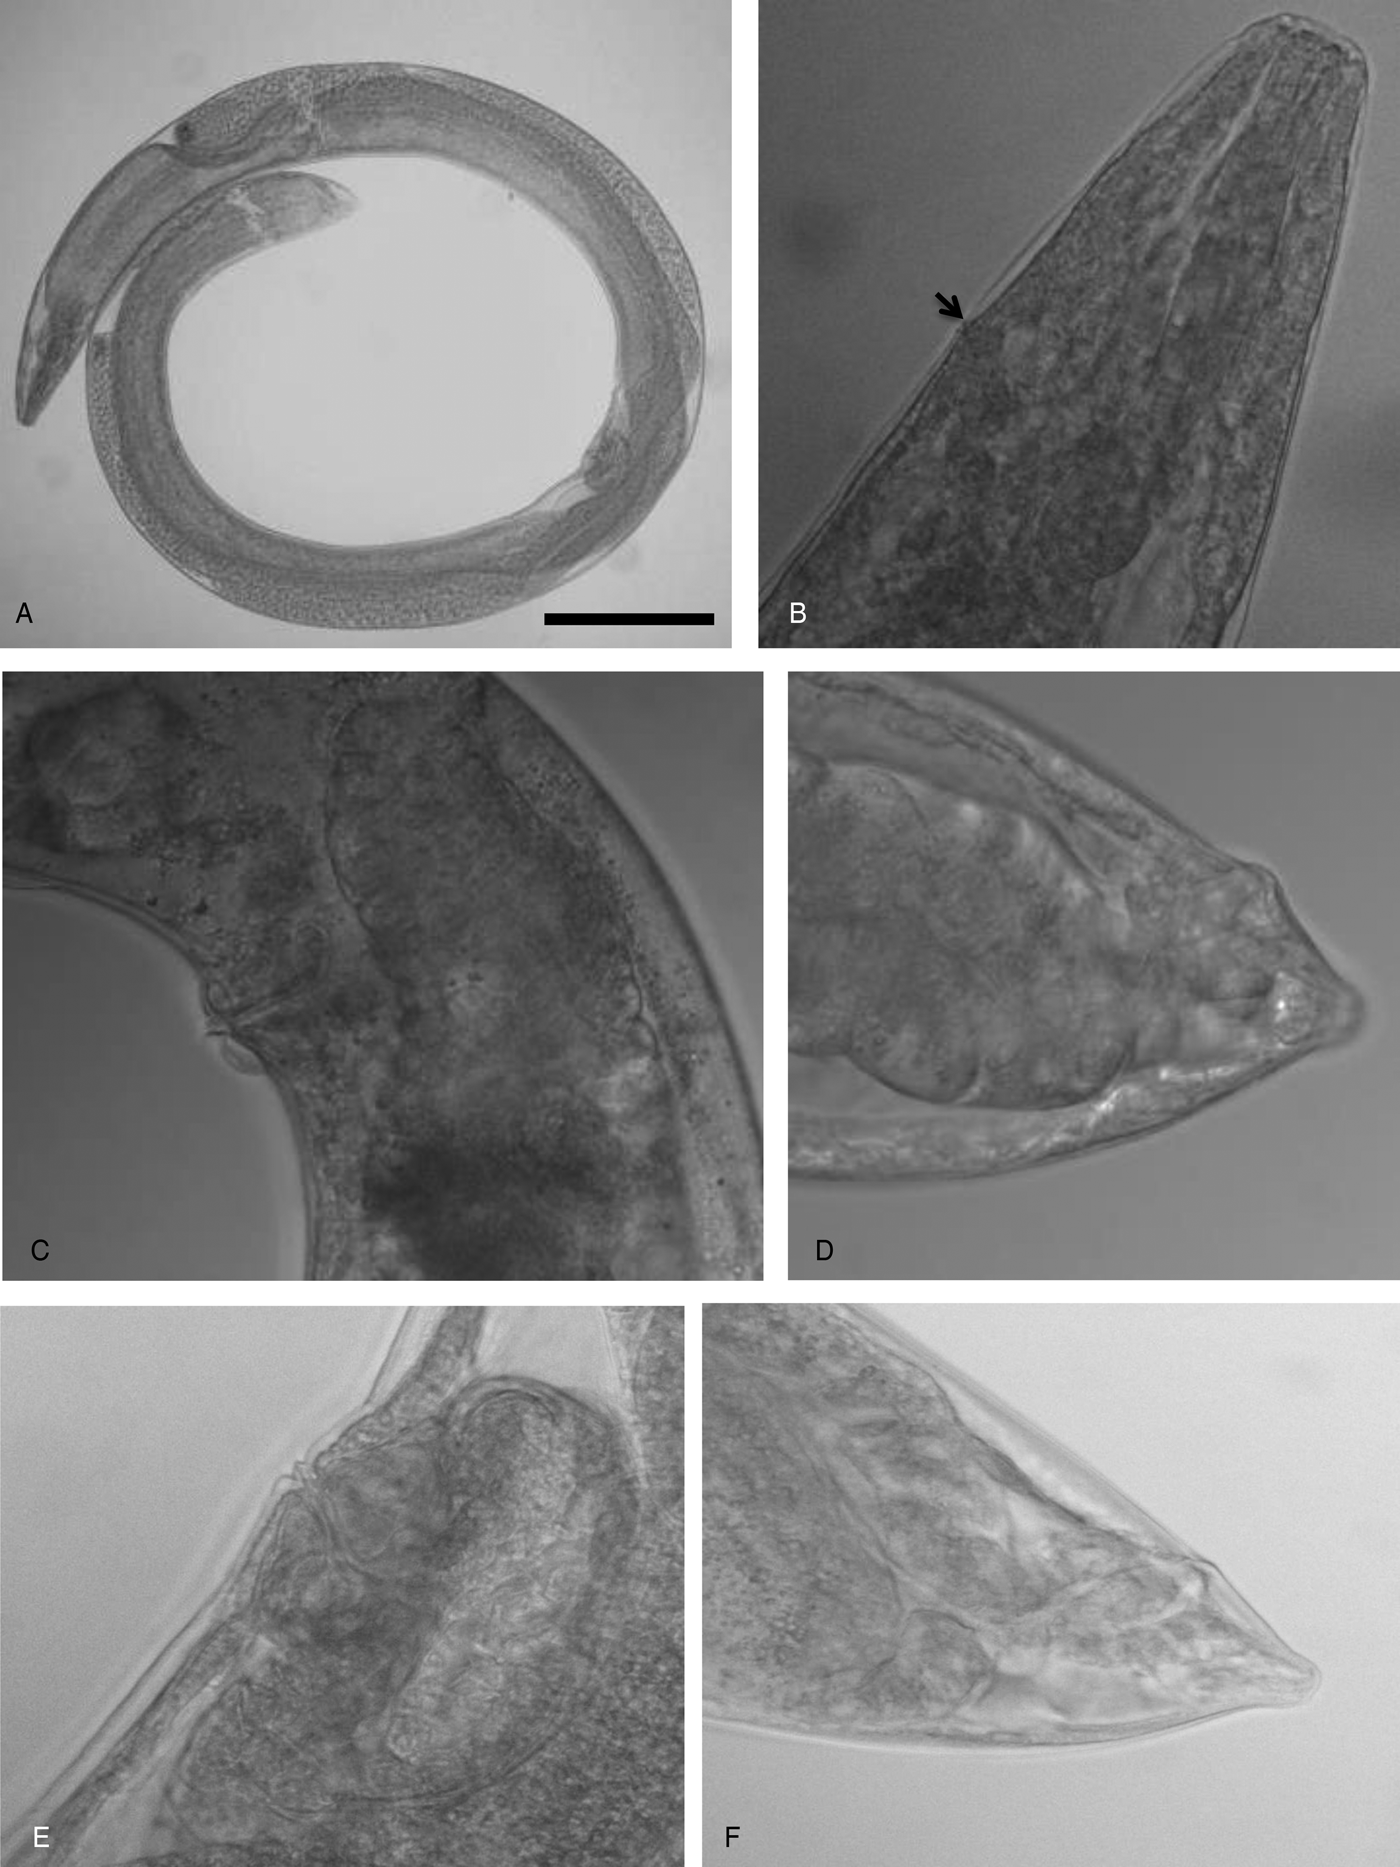
Lip region, stoma and pharyngeal region as in male (fig. 3B). Body C-shaped when heat relaxed. Cuticle smooth under light microscope, with slight annulations under SEM. First-generation females larger (average 4590 μm) than second-generation females (average 2450 μm). Excretory pore located about mid-procorpus level or surrounding isthmus (figs 1F and 3B). Genital system didelphic, amphidelphic. Ovaries opposed, reflexed in dorsal position; oviduct well developed; glandular spermatheca and uterus in ventral position. Vagina short, with muscular walls. Vulva located near middle of body with slightly protruding lips and mostly symmetrical, with small epiptygma (figs 1G and 3C). Tail blunt, conoid (figs 1H and 3D). Post-anal lips non-protruding or slightly protruding (figs 1H and 3D).
Steinernema khuongi n. sp., light microscopy photographs. First-generation female: (A) in toto, lateral view; (B) anterior end showing location of excretory pore (arrow), lateral view; (C) vulva, lateral view; (D) tail, lateral view. Second-generation female: (E) vulva, lateral view; (F) tail, lateral view. Scale bars (see (A)): (A) 290 μm; (B, F) 50 μm; (C) 90 μm; (D) 43 μm; (E) 36 μm.
Second-generation female
Body open C-shaped when heat killed. Similar to first-generation female but smaller. Vulva shape and lips similar to that of first-generation female (figs 1I and 3E). Tail conoid, without post-anal swelling (figs 1J and 3F).
Third-stage infective juvenile
Body of heat-relaxed specimens almost straight, slender and gradually tapering posteriorly. Head region continuous with body, slightly truncate (figs 1K and 2H). Arrested third-stage IJ has a closed stoma with a second-stage sheath. Lip region smooth, continuous; stoma closed (figs 1K and 2H). Amphidial apertures pore-like. Lateral field pattern of exsheathed juvenile with eight distinct ridges, evenly spaced in mid-body region (fig. 2G). Lateral field formula: 2, 4, 6, 8, 7, 6, 2. Pharynx long, narrow, with slightly expanded procorpus, narrower isthmus and pyriform basal bulb with valve (fig. 1K). Nerve-ring located at isthmus level (fig. 1K). Excretory pore located about mid-corpus (fig. 1K). Hemizonid present. Deirids not observed. Anterior portion of intestine with small bacterial receptacle (fig. 2F) similar to that observed in S. glaseri (Kim et al., Reference Kim, Flores-Lara and Stock2012). Intestine filled with numerous fat globules, lumen of intestine narrow. Rectum long, straight; anus distinct (fig. 1L). Genital primordium evident. Tail conoid with pointed terminus (figs 1L, 2E). Hyaline portion occupying c. 47% of tail length (fig. 1L).
Taxonomic summary
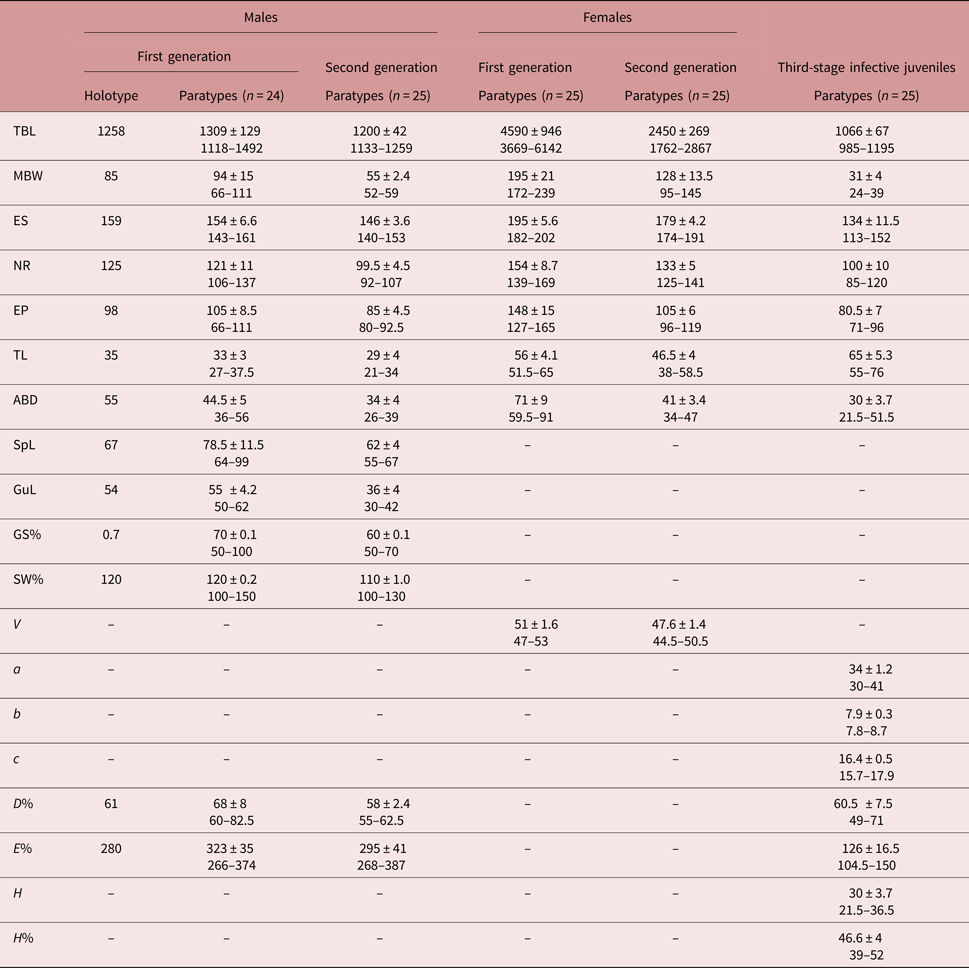
Type material. Holotype male, first generation; five paratype males, first generation; five paratype females, first generation; five paratype third-stage infective juveniles deposited in the USDA Nematode Collection, Beltsville, Maryland, USA. Five paratype males, first generation; five paratype females, first generation; five paratype third-stage infective juveniles deposited at the University of California Davis Nematode Collection, Davis, California, USA. Dimensions of holotype and paratype specimens are provided in table 2.
Type host. The natural host of this novel species is unknown.
Table 2.Morphometrics of Steinernema khuongi n. sp. All measurements are in micrometres. Ranges, means and standard deviation are also provided.

Type locality. Steinernema khuongi sp. n. was isolated from soil samples collected 11 km due west of Arcadia (Florida, USA, 27.2273N, 81.9649W).
Etymology. This species is named after Dr Khuong Nguyen, in recognition of his numerous contributions to the taxonomy and biology of entomopathogenic nematodes during his tenure at the University of Florida, USA.

Cross-hybridization results
Cross-hybridization assays between males and females of S. khuongi n. sp. with S. cubanum and S. glaseri yielded no progeny. In the controls, offspring were produced in all self-crossed species. No progeny were observed in the single-female control plates.
Diagnosis and relationships
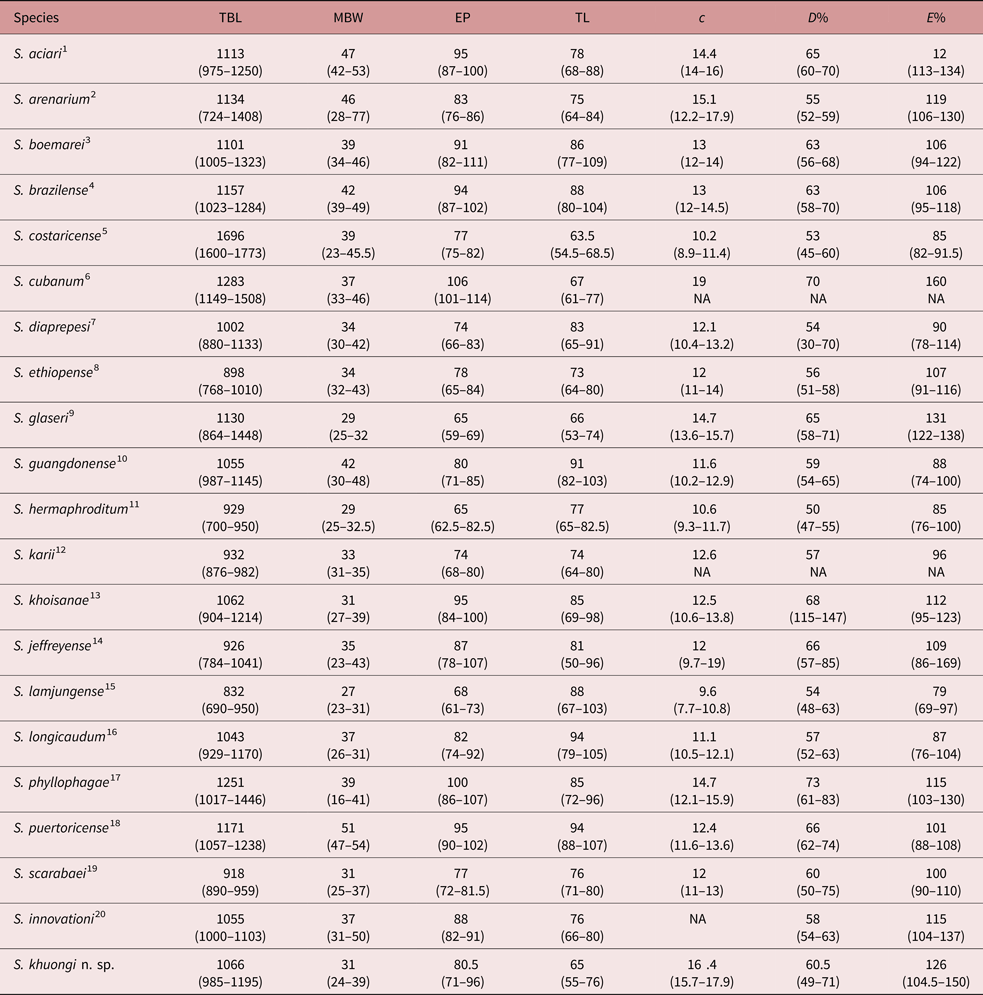
Based on morphological and morphometric traits, the new species is considered to be a member of the ‘glaseri-group’. Nematodes in this group are characterized by having the largest third-stage infective juveniles (average TBL ≥ 1000 μm) and by the presence of conspicuous deirids generally situated in the region of the pharyngeal bulb, or slightly behind in some members of this group. The lateral field of IJs in the glaseri-group is characterized by nine equally developed lines (= eight ridges) arranged evenly in the mid-body region. Steinernema khuongi n. sp., a member of the glaseri-group, presents several traits common to this group. For example, the third-stage infective juveniles have a large body size (range: 985–1195, average: 1066 μm), and they have nine lines in the mid-body region of the lateral field. Several of the morphometric traits of the IJs overlap with those of other species in the glaseri-group (table 3). Phylogenetic analyses also placed S. khuongi n. sp. in clade V (as depicted by Spiridonov et al., Reference Spiridonov, Reid, Podrucka, Subbotin and Moens2004). Within this clade, the new species is more closely related to S. cubanum, with which it shares some morphological traits. However, the new species can be differentiated from the above-mentioned taxa by several morphological and morphometric differences of the IJ and first-generation male (see tables 3 and 4). For example, IJs of the novel species are much shorter (average: 1066 μm vs. 1283 μm) and thinner than S. cubanum (average: 31 μm vs. 37 μm). The excretory pore of S. khuongi n. sp. is more anteriorly located than that of S. cubanum (average: 80 μm average vs. 106 μm). They also differ in the values of c (average: 16.4 vs. 19), D% (average: 60.5 vs. 70) and E% (average: 126 vs. 160). Third-stage infective juveniles of the novel species can also be separated from S. glaseri by the location of the excretory pore (average: 80 μm vs. 65 μm). They can also be discerned from S. glaseri by the values of c (average: 16.4 vs. 14.7), D% (60.5 vs. 65), and E% (average: 126 vs. 131).
Comparison of morphometric traits (mean and range) of infective juveniles of Steinernema khuongi n. sp. with other members of clade V. All measurements are in micrometres and in the form: mean (range).

1Qiu et al., Reference Qiu, Yan, Zhou, Nguyen and Pang2005; 2after Artyukhovsky et al., Reference Artyukhovsky, Kozodoi, Reid and Spiridonov1997; 3after Lee et al., Reference Lee, Sicard, Skeie and Stock2009; 4Nguyen et al., Reference Nguyen, Ginarte, Leite, dos Santos and Harakava2010; 5after Uribe-Lorío et al., Reference Uribe-Lorío, Mora and Stock2007; 6after Mráček et al., Reference Mráček, Hernandez and Boemare1994; 7after Nguyen & Duncan, Reference Nguyen and Duncan2002; 8Tamiru et al., Reference Tamiru, Waeyenberge, Hailu, Ehlers, Půža and Mráček2012; 9after Poinar, Reference Poinar and Poinar1990; 10 after Qiu et al., Reference Qiu, Fang, Zhou, Pang and Nguyen2004; 11after Stock et al., Reference Stock, Griffin and Chaenari2004; 12after Waturu et al., Reference Waturu, Hunt and Reid1997; 13after Nguyen et al., Reference Nguyen, Malan and Gozel2006; 14Malan et al., Reference Malan, Knoetze and Tiedt2016; 15Khatri-Chhetri et al., Reference Khatri-Chhetri, Waeyenberge, Spiridonov, Manandhar and Moens2011; 16after Stock et al., Reference Stock, Heng, Hunt, Reid, Shen and Choo2001b; 17Nguyen & Buss, Reference Nguyen and Buss2011; 18after Román & Figueroa, Reference Román and Figueroa1994; 19after Stock & Koppenhöfer, Reference Stock and Koppenhöfer2003; 20after Çimen et al., Reference Çimen, Lee, Hatting, Hazir and Stock2015.
NA, not applicable.
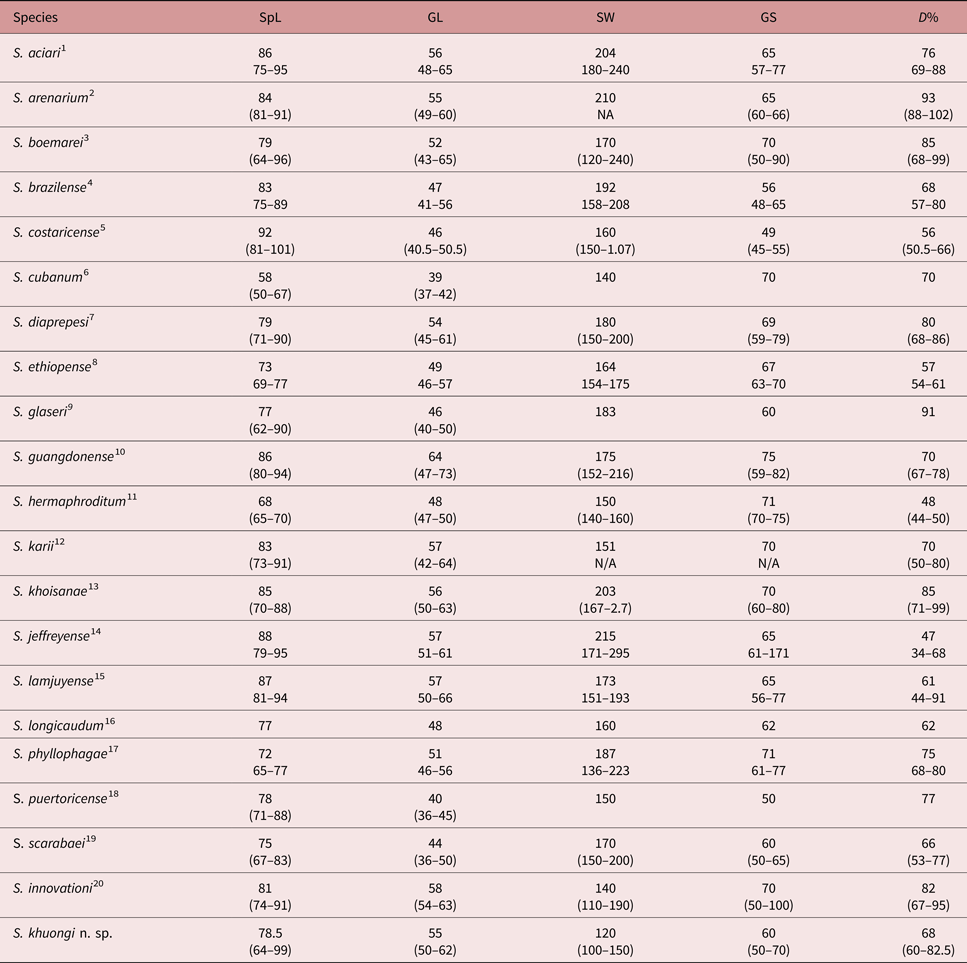
Comparison of morphometric traits (mean and range) of males of Steinernema khuongi n. sp. with other members of clade V. All measurements are in micrometres and in the form: mean (range).

1Qiu et al., Reference Qiu, Yan, Zhou, Nguyen and Pang2005; 2after Artyukhovsky et al., Reference Artyukhovsky, Kozodoi, Reid and Spiridonov1997; 3after Lee et al., Reference Lee, Sicard, Skeie and Stock2009; 4Nguyen et al., Reference Nguyen, Ginarte, Leite, dos Santos and Harakava2010; 5after Uribe-Lorío et al., Reference Uribe-Lorío, Mora and Stock2007; 6after Mráček et al., Reference Mráček, Hernandez and Boemare1994; 7after Nguyen & Duncan, Reference Nguyen and Duncan2002; 8Tamiru et al., Reference Tamiru, Waeyenberge, Hailu, Ehlers, Půža and Mráček2012; 9after Poinar, Reference Poinar and Poinar1990; 10 after Qiu et al., Reference Qiu, Fang, Zhou, Pang and Nguyen2004; 11after Stock et al., Reference Stock, Griffin and Chaenari2004; 12after Waturu et al., Reference Waturu, Hunt and Reid1997; 13after Nguyen et al., Reference Nguyen, Malan and Gozel2006; 14Malan et al., Reference Malan, Knoetze and Tiedt2016; 15Khatri-Chhetri et al., Reference Khatri-Chhetri, Waeyenberge, Spiridonov, Manandhar and Moens2011; 16after Stock et al., Reference Stock, Heng, Hunt, Reid, Shen and Choo2001b; 17Nguyen & Buss, Reference Nguyen and Buss2011; 18after Román & Figueroa, Reference Román and Figueroa1994; 19after Stock & Koppenhöfer, Reference Stock and Koppenhöfer2003; 20after Çimen et al., Reference Çimen, Lee, Hatting, Hazir and Stock2015.
NA, not applicable.
Additionally, first-generation males of the new species can be distinguished from S. cubanum by the length of the spicules (average: 78.5 μm vs. 58 μm) and gubernaculum (average: 55 μm vs. 39 μm) and the values of SW% (average: 120 vs. 140) and GS% (60 vs. 70). First-generation males of S. khuongi n. sp. can be separated from those of S. glaseri by having a larger gubernaculum (average: 55 μm vs. 46 μm), and by the values of SW% (average: 120 vs. 183) and D% (average: 68 vs. 91).
First-generation males of S. khuongi n. sp. can also be distinguished from those of S. longicaudum Shen and Wang 1991 by the size of the gubernaculum (average: 55 μm vs. 48 μm), the values of D% (average: 68 vs. 62) and SW% (average: 120 vs. 160). Additionally, IJs of the novel species differ from those of S. longicaudum by having a shorter tail (average: 65 μm vs. 94 μm) and the values of D% (average: 60.5 vs. 57), and E% (average: 126 vs. 87).
Molecular characterization and phylogenetic analysis
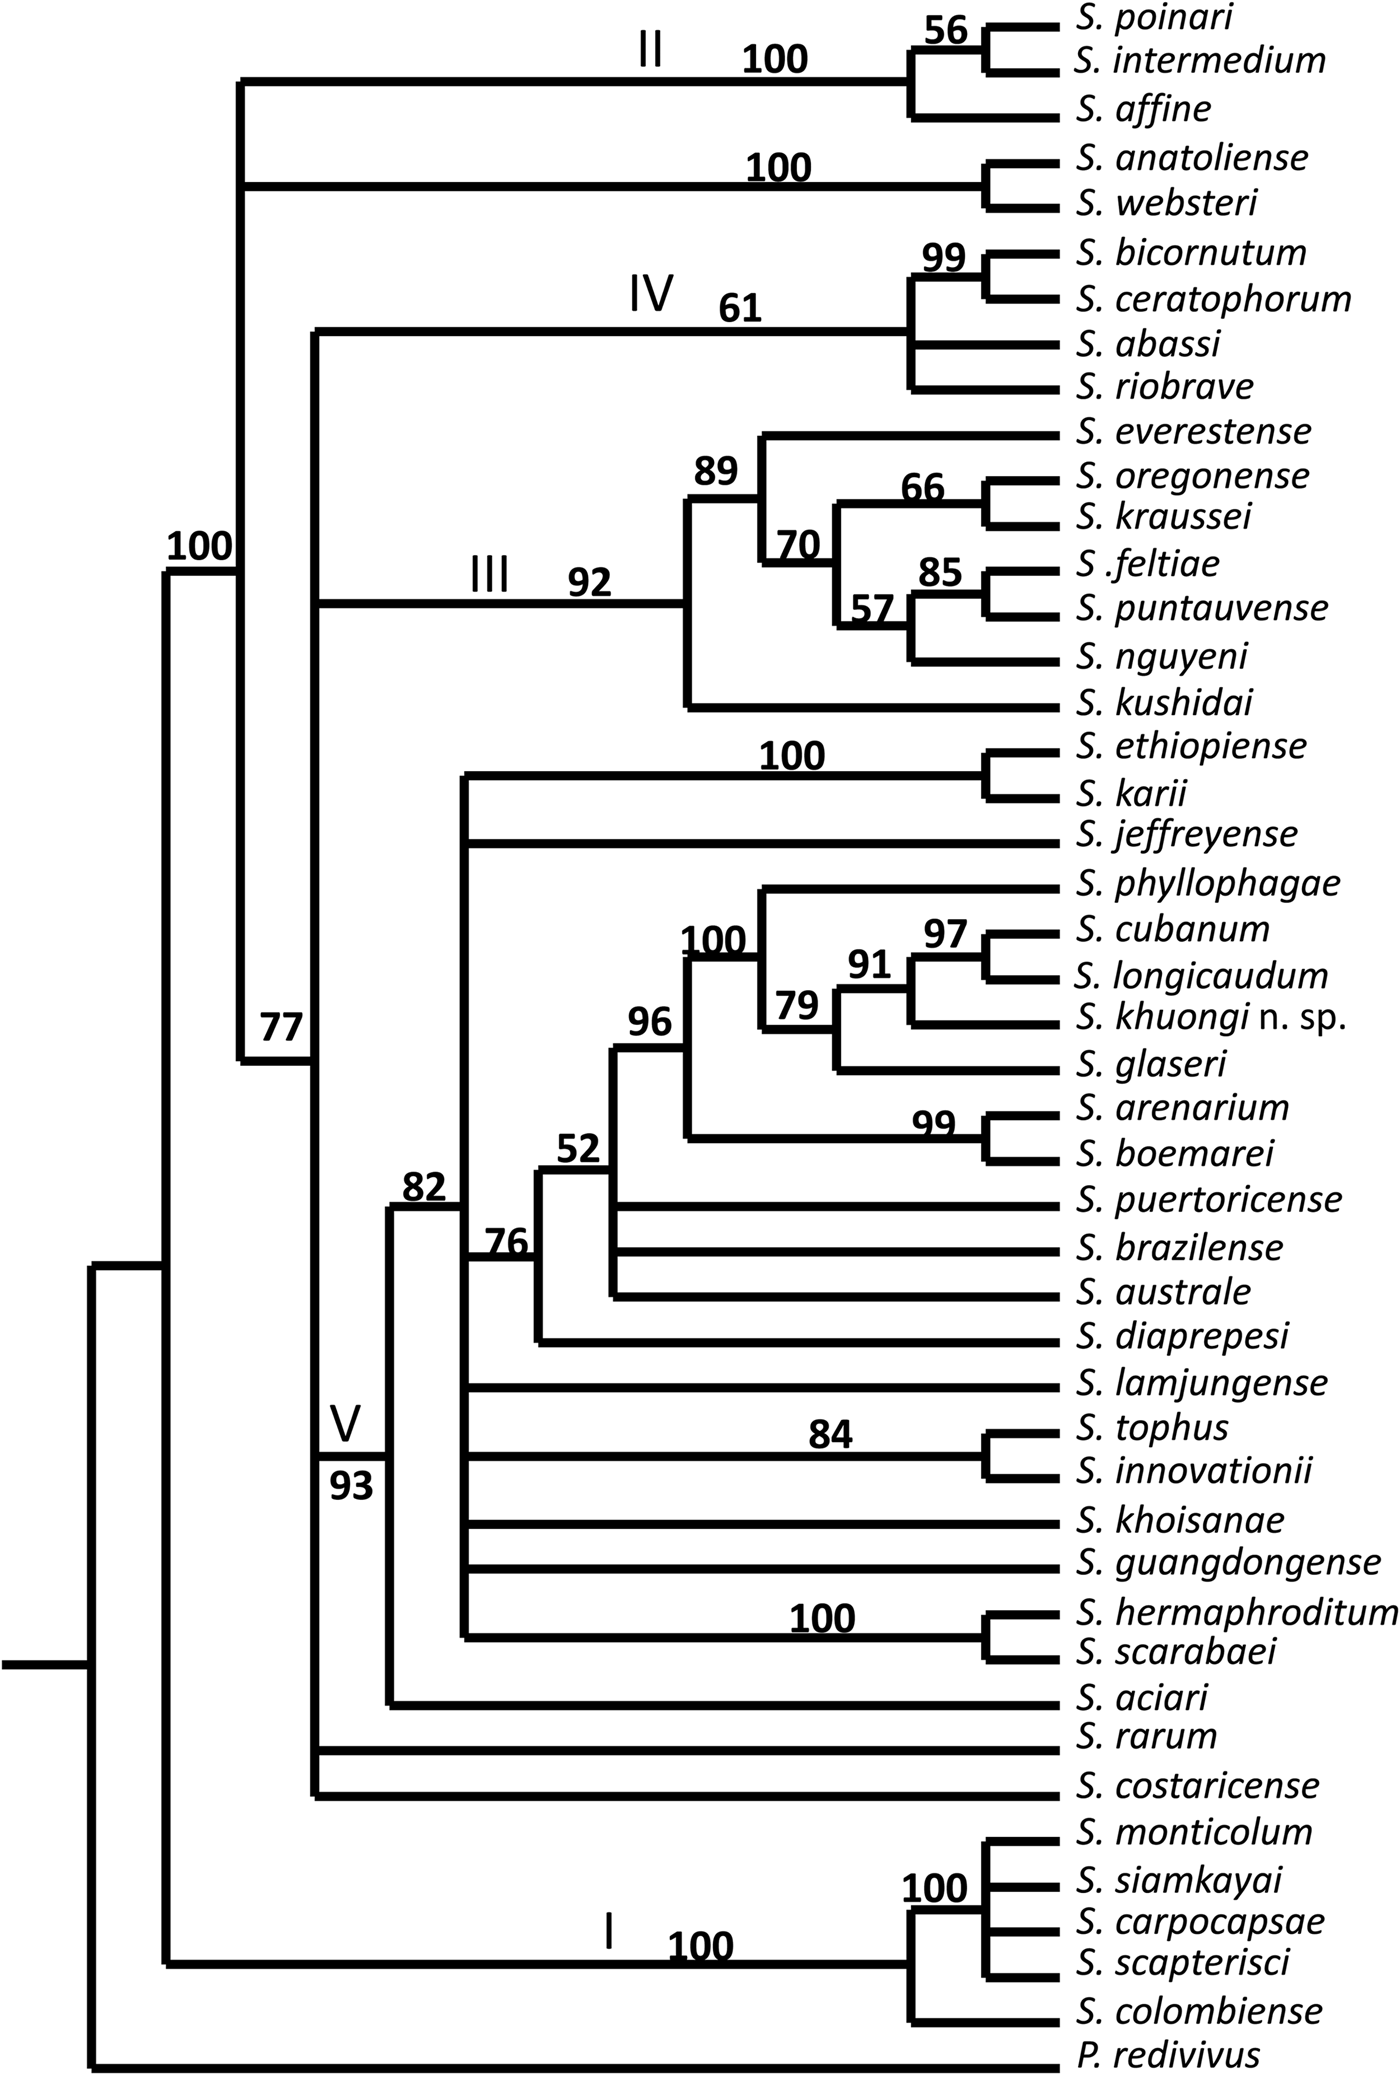
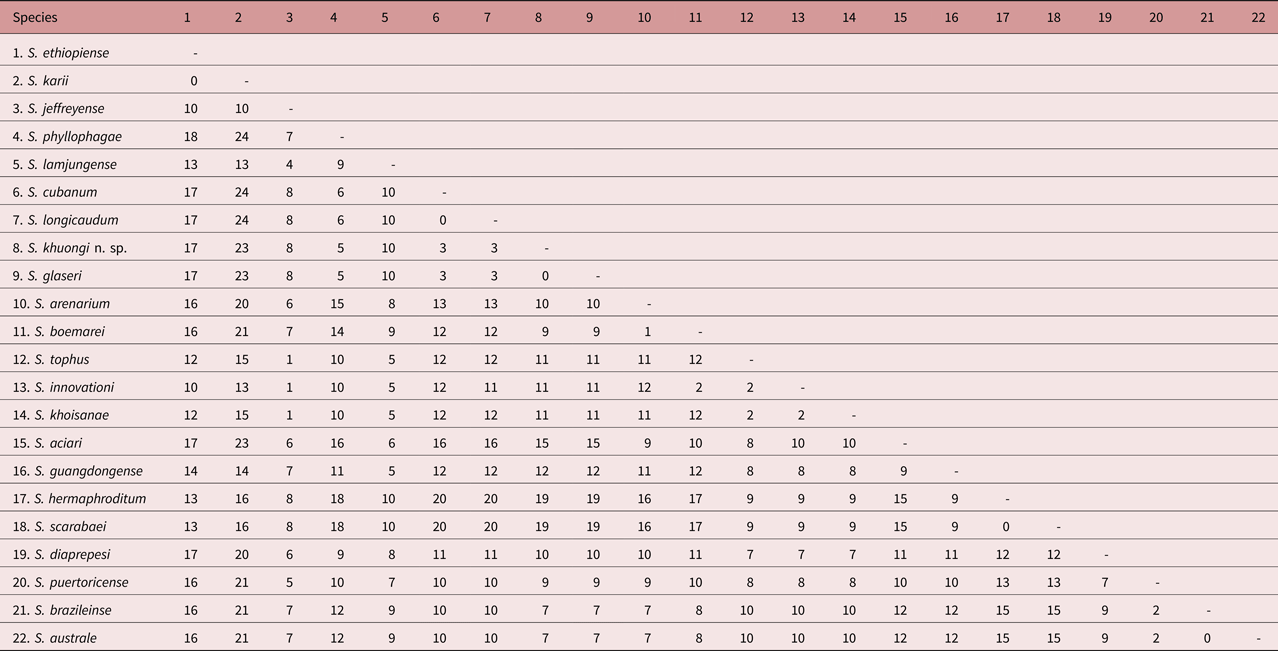
Sequences obtained from the D2/D3 domain of the 28S (GU177835) and ITS rDNA genes (GU174002) were deposited in GenBank. Maximum parsimony (MP) analysis of the 28S rDNA gene dataset yielded 389 parsimony informative characters out of 1020 characters. An initial heuristic search of random addition replicates produced 42 equally parsimonious trees with a tree length of 1215 steps. Bootstrap MP analysis placed S. khuongi n. sp. as a member of clade V, and sister to a clade that encompasses S. cubanum and S. longicaudum (fig. 4). Patristic distance matrix depicts the novel species as clade V, comprising Steinernema spp. known to have infective juveniles with exceptionally large body size (average ≥ 1000 μm). Placement of the new species within this clade was supported by bootstrap resampling (91%), for which a 50% majority rule consensus tree is given (fig. 4). Bayesian analysis of the concatenated dataset yielded a similar topology, placing S. khuongi n. sp. firmly in clade V, with a very high posterior probability (100%) that it is sister to a clade that groups S. cubanum and S. longicaudum
Evidence of large subunit region (28S) or ribosomal DNA tree lineage independence for S. khuongi n. sp. based on maximum parsimony analysis. Clades are in roman numbers. Numbers in bold indicate bootstrap values.

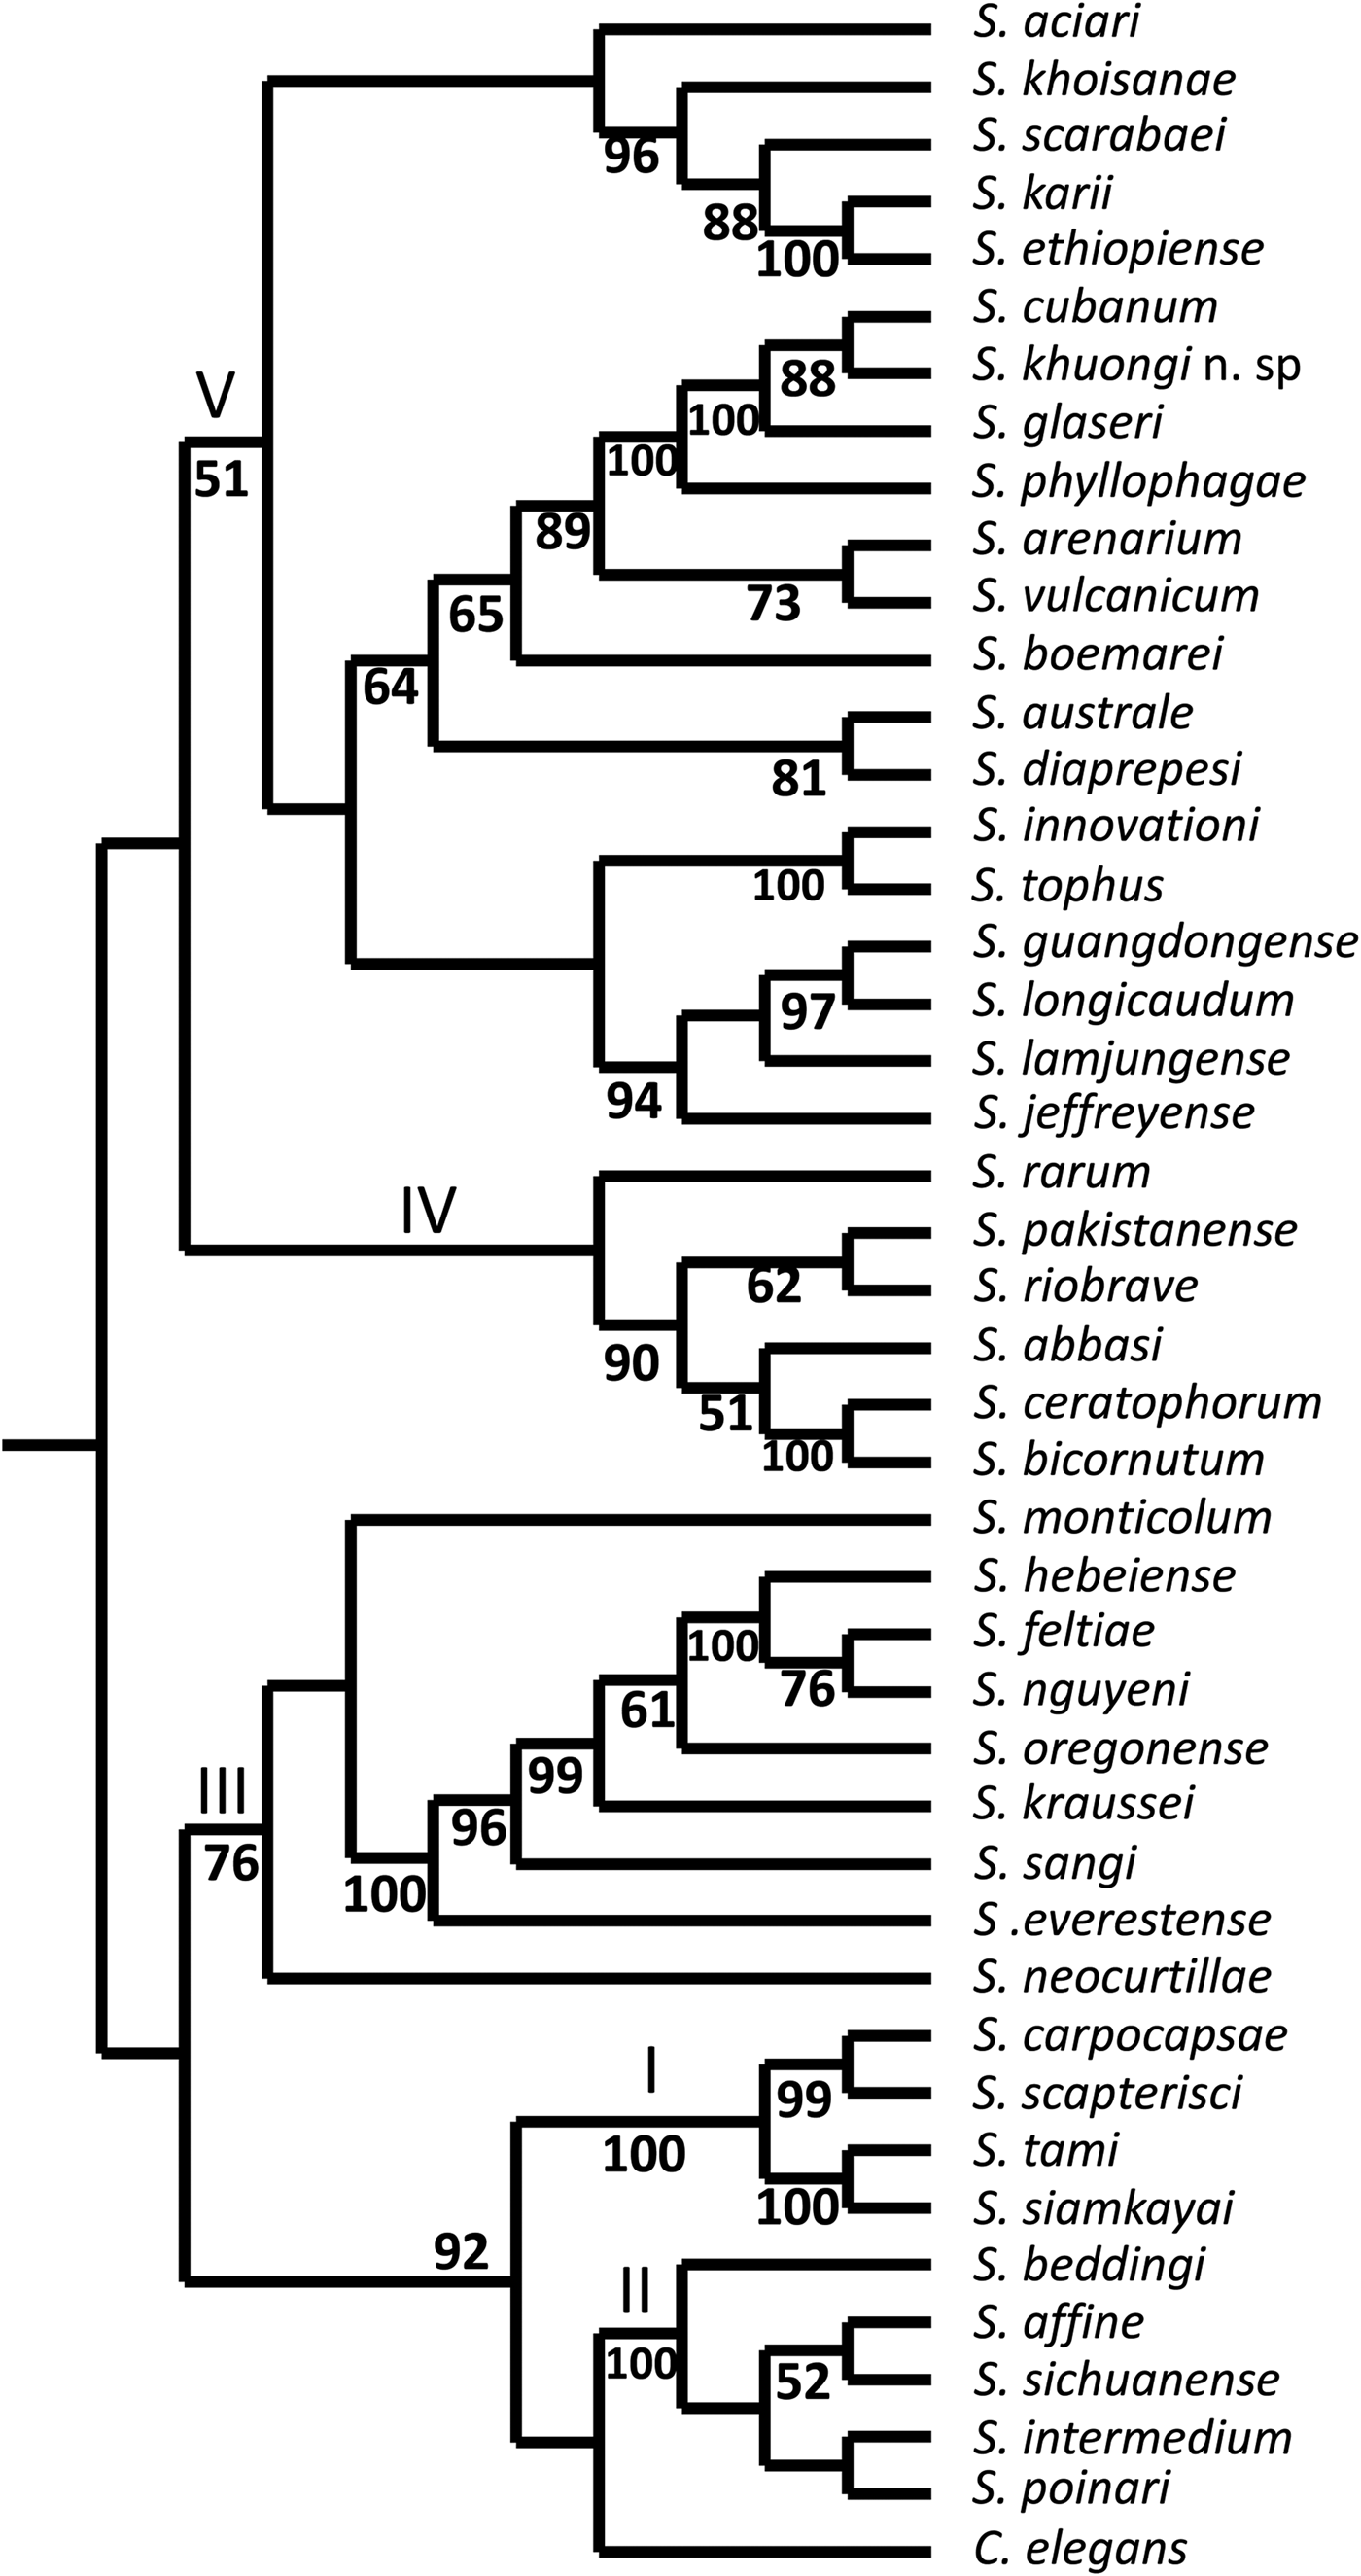
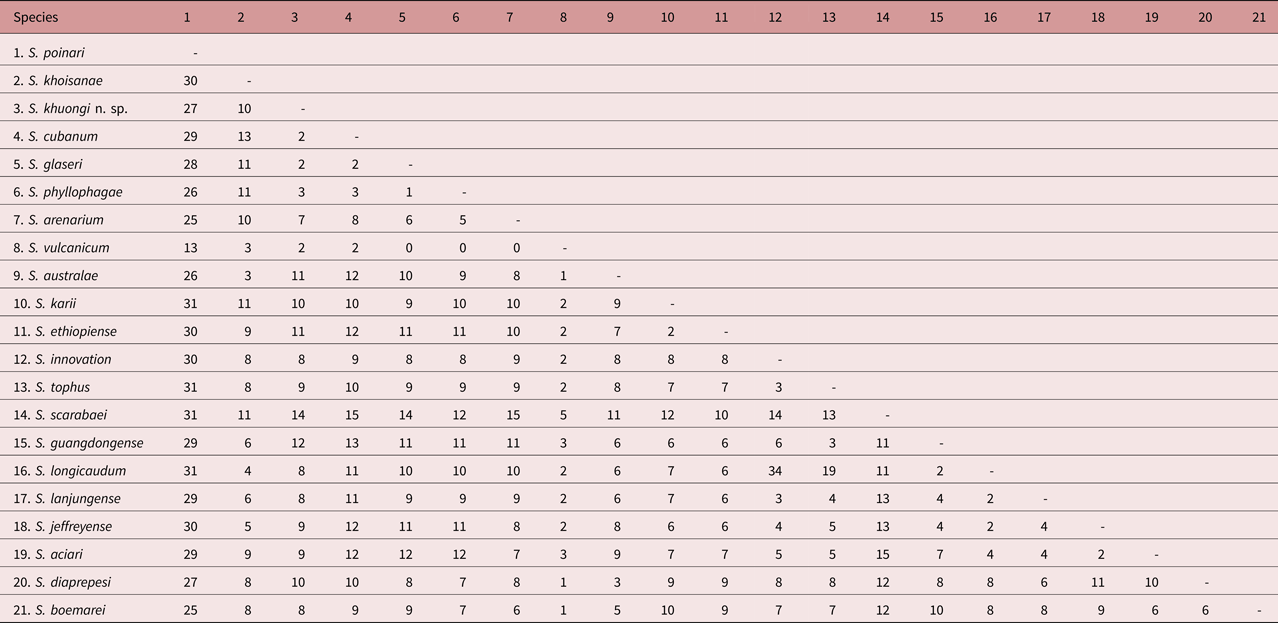
A heuristic search of the ITS rDNA sequences yielded two most parsimonious tree with a tree length of 3511 steps. Of 849 characters, 556 were parsimony informative. The MP bootstrap analysis of ITS data also placed S. khuongi n. sp. as a member of clade V and sister to S. cubanum (fig. 5). Bootstrap resampling provided moderate-high (82%) support for this topology, as seen in the 50% majority rule consensus tree (fig. 5). The Bayesian analysis for this dataset also yielded placement of the new species in clade V with a posterior probability of 69%. Results of these two analyses provide further evidence for the distinctiveness of this species. Finally, distance measures of the 28S and ITS datasets produced distinct base-pair differences between S. khuongi n. sp. and members of the clade V glaseri-group (tables 5 and 6).
Evidence of internal transcribed spacer region (ITS) of ribosomal DNA lineage independence for S. khuongi n. sp. based on maximum parsimony analysis. Clades are in roman numbers. Numbers in bold indicate bootstrap values.

Genetic distance matrix of 28S rDNA (including the D2/D3 domain) for S. khuongi n. sp. and members of the ‘glaseri-group’. Above diagonal: adjusted character distances; below diagonal: Jukes–Cantor corrected distances.

Genetic distance matrix of internal transcribed spacer region (ITS) for S. khuongi n. sp. and members of the ‘glaseri-group’. Above diagonal: adjusted character distances; below diagonal: Jukes–Cantor corrected distances.

Distribution and ecology
Steinernema khuongi n. sp. was detected, using species-specific primers and probes, in 10% of the natural areas surveyed (n = 91) and 19% of citrus orchards (n = 53). Soils where the novel species was found were usually poorly drained with shallow water tables (flatwoods ecoregions), as opposed to coarse, sandy soils with deep water tables (central ridge ecoregion) (Campos-Herrera et al., Reference Campos–Herrera, Pathak, El–Borai, Stuart, Gutiérrez, Rodríguez–Martín, Graham and Duncan2013, Reference Campos-Herrera, El-Borai, Rodriguez Martin and Duncan2016). Laboratory experiments confirmed that S. khuongi n. sp. is better adapted to saturated soils than S. diaprepesi, another species native to Florida and also a member of clade V (El-Borai et al., Reference El-Borai, Killiny and Duncan2016).
In Florida, five EPN species from the glaseri-group have been reported thus far, S. díaprepesi, S. glaseri, S. phyllophagae, S. cubanum and S. khuongi n. sp. The new species was found co-occurring with S. diaprepesi and with H. indica (Campos-Herrera et al., Reference Campos–Herrera, Pathak, El–Borai, Stuart, Gutiérrez, Rodríguez–Martín, Graham and Duncan2013, Reference Campos-Herrera, El-Borai, Rodriguez Martin and Duncan2016).
Acknowledgements
We thank Yolanda Flores-Lara for generating the scanning electron microscopy images.
Financial support
R.C.-H. was funded by the Marie Curie International Outgoing Fellowship within the 7th European Community Framework Programme (FP7-PEOPLE-2009-IOF-252980). Nema-Sym Research Coordination Network also supported the collaboration between the University of Arizona and the University of Florida through travel exchange funds to R.C.-H. (award NSF-IOS-0840932 to S.P.S.).
Conflict of interest
None.