1. Introduction
An outstanding problem for any non-Newtonian liquid is in the formulation of a constitutive equation for the stress tensor valid in a broad class of kinematic conditions, not necessarily those encountered in rheological experiments (like shear flow, steady or oscillatory). Knowledge of such an equation would allow the solution of boundary-value problems of non-Newtonian hydrodynamics in complex geometries of technological interest. Obviously, rheological experiments alone, for all their value, are not sufficient to formulate a constitutive equation. The importance of microstructural analysis for general constitutive modelling was emphasized by Hinch & Leal (Reference Hinch and Leal1975). Emulsions, i.e. dispersions of one immiscible liquid in another liquid, represent an important class of non-Newtonian liquids encountered in many applications, including the food and pharmaceutical industries, oil recovery and transportation. Early analytical theories (Schowalter, Chaffey & Brenner Reference Schowalter, Chaffey and Brenner1968; Frankel & Acrivos Reference Frankel and Acrivos1970; Barthés-Biesel & Acrivos Reference Barthés-Biesel and Acrivos1973a
,Reference Barthés-Biesel and Acrivos
b
) were able to produce general constitutive models for dilute emulsions of non-interacting drops limited by small deformations. Along these lines, Vlahovska, Loewenberg & Bławzdziewicz (Reference Vlahovska, Loewenberg and Bławzdziewicz2005) and Vlahovska, Bławzdziewicz & Loewenberg (Reference Vlahovska, Bławzdziewicz and Loewenberg2009) completed the
 $O({\it\varepsilon}^{3})$
theory for small deformations (where
 ${\it\varepsilon}$
is the shape deviation from spherical relative to the drop size). However, the complexity of the analysis has restricted rheological applications so far, and no constitutive equation has resulted yet from the complete
 $O({\it\varepsilon}^{3})$
theory.
Outside this regime, numerical simulations for particular cases provide valuable insights into the emulsion rheology, although they have not led so far to a general constitutive model. Kennedy, Pozrikidis & Skalak (Reference Kennedy, Pozrikidis and Skalak1994) calculated the deformation and rheological response of a single drop in a simple shear at finite drop deformations. Loewenberg & Hinch (Reference Loewenberg and Hinch1996) offered the first shear-flow dynamical simulations for random non-dilute monodisperse emulsions, with up to
 $N=12$
drops (in a periodic cell) and up to 30 % drop volume fractions. Their direct boundary-integral (BI) code had an
 $O(N^{2}N_{\triangle }^{2})$
scaling in the system size
 $N$
and in the number
 $N_{\triangle }$
of triangular boundary elements per drop (
 $N_{\triangle }=320$
in their work). Obviously, larger simulations (see below) require alternative approaches. Using the same implementation, Loewenberg (Reference Loewenberg1998) presented additional calculations at 30 % concentration and offered a mean-field criterion for drop breakup. This criterion was mostly confirmed in experiments with emulsion concentrations
 $c\leqslant 0.7$
and moderate drop-to-medium viscosity ratios
 ${\it\lambda}$
(Jansen, Agterof & Mellema Reference Jansen, Agterof and Mellema2001), although not for higher concentrations and much smaller
 ${\it\lambda}$
(Golemanov et al.
Reference Golemanov, Tcholakova, Denkov, Ananthapadmanabhan and Lips2008). This subject is reviewed at some length in Derkach (Reference Derkach2009). For single drops in shear flow, breakup simulations are reported in several studies (e.g. Cristini et al.
Reference Cristini, Guido, Alfani, Bławzdziewicz and Loewenberg2003).
Zinchenko & Davis (Reference Zinchenko and Davis2002, hereafter referred to as paper I), offered the first large-scale dynamical simulations of monodisperse emulsions in shear flow by a multipole-accelerated BI algorithm (a development from the multidrop sedimentation code of Zinchenko & Davis Reference Zinchenko and Davis2000). It was possible to handle both matching (
 ${\it\lambda}=1$
) and contrast (
 ${\it\lambda}=3$
) viscosities, up to
 $c=0.55$
,
 $N=100{-}200$
,
 $N_{\triangle }=1000{-}1500$
and up to
 ${\sim}10^{4}$
time steps to systematically study the steady-state viscometric functions (emulsion viscosity and normal stress differences). An increased system size (
 $N\sim 100$
) was particularly important to accurately describe the first normal stress difference at high concentrations, while high surface resolutions are paramount to accurately reach the limit of small capillary numbers
 $\mathit{Ca}$
. This limit
 $\mathit{Ca}\ll 1$
is arguably the most difficult case in emulsion flow simulations at high
 $c$
, due to geometrical blockages between nearly non-deformed drops. In retrospect, we have found all the results of paper I to be accurate, except for
 ${\it\lambda}=1$
with
 $c\geqslant 0.45$
and small
 $\mathit{Ca}\leqslant 0.05$
, where they somewhat overestimate the emulsion viscosity and the first normal stress difference, due to still insufficient surface resolutions and shorter than necessary simulation times. As a consequence of this accuracy deterioration at small
 $\mathit{Ca}$
, too sharp shear thinning was predicted (compared with the results of the present study which are far more accurate in this range). Using the same code as in paper I, Zinchenko & Davis (Reference Zinchenko, Davis and Petsev2004) even increased resolutions to
 $N_{\triangle }=6000{-}9000$
for
 ${\it\lambda}=1$
and
 $c=0.45{-}0.5$
to refine the results at
 $\mathit{Ca}\leqslant 0.05$
. However, the simulated strains were still limited to 25–45, thus leaving some of the small-
 $\mathit{Ca}$
viscosity values in Zinchenko & Davis (Reference Zinchenko, Davis and Petsev2004) on the metastable level and, hence, slightly overestimated. Much larger strains are required to elucidate the difficult phenomenon of flow-induced ‘phase transition’ to a partially ordered emulsion in simple shear. Neither study (paper I or Zinchenko & Davis Reference Zinchenko, Davis and Petsev2004) included interesting extreme viscosity ratios (
 ${\it\lambda}\ll 1$
or
 ${\it\lambda}\gg 1$
).
Regarding potential applications to non-Newtonian hydrodynamics of emulsions, there appears to have been too much emphasis in the literature on simple shear. Neither steady nor oscillatory shear flow can mimic the history of deformation of a material element in realistic large-strain flows through complex geometries. ‘Any reasonably abrupt change in geometry…will generate a flow with an extensional component and, in particular, flows through a sudden contraction or out of an orifice often lead to flow characteristics which cannot be predicted on the basis of shear viscosity alone … . The historical convention of matching only shear flow data with theoretical predictions in constitutive modelling may have to be rethought’ (Barnes, Hutton & Walters Reference Barnes, Hutton and Walters1989). In recent experiments (Rózanska et al. Reference Rózanska, Rózanski, Ochowiak and Mitkowski2014), the Trouton ratio of the extensional and shear viscosities was variable and reported to reach 11 at 70 % emulsion concentrations (versus 3 for Newtonian liquids). Successful simulations of complex microstructures in extensional flows to large strains necessarily require that the lattice of periodic cells (each containing many drops, etc.) repeats itself after some strain period, so that cells could be rebuilt to continue simulation indefinitely. Such lattice self-reproducibility is obvious for shear (and has been heavily exploited) but not for extensional flows. Kraynik & Reinelt (Reference Kraynik and Reinelt1992) discovered that no lattice is reproducible in general extensional flows. An exception is planar extension (PE), where an infinite number of reproducible lattices exist, the ‘critical’ lattice being most convenient with minimum skewage during the flow. The Kraynik–Reinelt lattice geometry gained much popularity in molecular dynamics simulations. More recently, Hunt, Bernardi & Todd (Reference Hunt, Bernardi and Todd2010) showed how to combine this geometry with simple matrix transformations to also provide periodic boundary conditions for mixed-flow simulations. In fluid mechanics, we are only aware of Ahamadi & Harlen’s (Reference Ahamadi and Harlen2008) extensional flow simulations for 2D suspensions using the Kraynik–Reinelt lattice geometry. To the best of our knowledge, there are no extensional or mixed-flow simulations for emulsions.
Of course, in real complex flows the history of deformation of a material element is neither simple shear nor pure extension (uniaxial or PE). A recent novel approach (Martin, Zinchenko & Davis Reference Martin, Zinchenko and Davis2014) shows how to build a general constitutive model for a non-Newtonian liquid incorporating the results from both simple shear and PE. Namely, a generalized five-parameter traceless Oldroyd equation is assumed, with variable coefficients postulated to depend on one instantaneous flow invariant. In principle, these five coefficients can be found by simultaneously fitting the equation to three viscometric and two extensiometric (in PE) functions at arbitrary flow intensities. This general approach to constitutive modelling was tested in Martin et al. (Reference Martin, Zinchenko and Davis2014) against exact BI results for dilute emulsions of non-interacting drops with small to large deformations, and found to be rather accurate in a broad class of kinematics, both Lagrangian-steady and unsteady.
The present paper seeks to explore in detail the steady-state rheological functions for concentrated emulsions in the two base flows – simple shear and PE – by large-scale dynamical simulations, and then use them simultaneously, in the manner of Martin et al. (Reference Martin, Zinchenko and Davis2014) for a general constitutive model. Precise simulation results are also generated for mixed flows and used to validate this constitutive model. In § 2, the problem formulation and the general solution scheme for all three types of flow are discussed, including the implementation of periodic boundaries and the BI equations. The version of multipole acceleration, more flexible and efficient than in paper I, is outlined in § 3. Miscellaneous features of the algorithm, discussed in § 4, include control of surface overlapping and much more robust, compared with paper I, control of surface triangulations. These features have allowed for unlimited long-time simulations and accurate time averaging. In § 5, the whole code is validated and tested for efficiency in the cases of PE and mixed flows. In § 6, the steady-state extensiometric functions for PE (the effective viscosity and stress cross-difference) are calculated for
 $c=0.45{-}0.55$
, a broad range of viscosity ratios
 ${\it\lambda}=0.25{-}10$
and up to drop breakup. The analysis of the viscometric functions for
 $c=0.45{-}0.55$
in § 7 is a major extension of the work performed in paper I. Not only have two new viscosity ratios
 ${\it\lambda}=0.25$
and 10 been added, but we have also increased the simulated strains by 1.5–2 orders of magnitude (to hundreds for
 ${\it\lambda}\neq 1$
and thousands for
 ${\it\lambda}=1$
), the maximum system size to
 $N=400$
and roughly doubled typical resolutions. These improvements are critical to shed light on the phenomenon of flow-induced partial ordering and related anomalous kinked behaviour of the viscometric functions, and evaluate the onset of phase transition for each value of
 $c$
and
 ${\it\lambda}$
. Still, some severe ergodic difficulties remain in the transition range, as discussed in § 7. We also comment on the deep distinction between simple shear and PE simulations. In § 8, the constitutive modelling scheme of Martin et al. (Reference Martin, Zinchenko and Davis2014) is applied (with some improvements) to concentrated emulsions, based on the extensiometric and viscometric functions from §§ 6 and 7. In § 9, the constructed constitutive model is validated against precise simulations for mixed flows, both rheologically ‘strong’ and ‘weak’; an example of a time-dependent PE flow is also included in the validation. In the conclusions (§ 10), we comment on possible ways to overcome the phase transition and drop breakup limitations on constitutive modelling.
All calculations have been performed as single core on several multicore PCs, with an i7 4960X 3.6 GHz CPU being the fastest. The full multiparameter study reported in this work required a large number (
 ${\approx}250$
) of independent runs. We view, therefore, the lack of code parallelization not as a drawback, since it was beneficial to simply run many calculations concurrently with 100 % efficiency, avoiding communication bottlenecks typical of parallel computations.
2. Problem formulation and the general solution scheme
Consider an infinite set of three-dimensional deformable Newtonian drops of viscosity
 ${\it\mu}^{\prime }$
freely suspended in a Newtonian medium of viscosity
 ${\it\mu}_{e}={\it\mu}^{\prime }/{\it\lambda}$
and subject to a steady macroscopic flow
 $\boldsymbol{u}_{\infty }(\boldsymbol{x})=\boldsymbol{{\rm\nabla}}\boldsymbol{u}_{\infty }\boldsymbol{\cdot }\boldsymbol{x}$
with a constant velocity gradient matrix
 $\boldsymbol{{\rm\nabla}}\boldsymbol{u}_{\infty }$
. The inertial effects are assumed to be negligible on the microscale, and the Stokes equations apply to the fluid motion inside and outside the drops. An equivalent radius of non-deformed drops (assumed to be the same for all drops) is
 $a_{o}$
, and the capillary number is defined as
 $\mathit{Ca}={\it\mu}_{e}(2I_{2})^{1/2}a_{o}/{\it\sigma}$
through the second invariant
 $I_{2}=\text{tr}(\unicode[STIX]{x1D640}_{\infty }^{2})$
of the rate-of-strain tensor
 $\unicode[STIX]{x1D640}_{\infty }$
for the macroscopic flow
 $\boldsymbol{u}_{\infty }$
. The system is surfactant-free with a constant interfacial tension
 ${\it\sigma}$
. At each time
 $t\geqslant 0$
, the infinite drop system is obtained from the basic configuration of
 $N\gg 1$
drops with surface centroids
 $\boldsymbol{x}_{1}^{c},\ldots ,\boldsymbol{x}_{N}^{c}$
in the basic cell
 $V$
by triply periodic continuation into the whole space with periods
 $\boldsymbol{e}_{1}$
,
 $\boldsymbol{e}_{2}$
,
 $\boldsymbol{e}_{3}$
; the cell
 $V=\{{\it\xi}^{i}\boldsymbol{e}_{i},~0\leqslant {\it\xi}^{i}<1\}$
is the span of
 $\boldsymbol{e}_{1}$
,
 $\boldsymbol{e}_{2}$
and
 $\boldsymbol{e}_{3}$
. Initially, at
 $t=0$
the basis vectors
 $\boldsymbol{e}_{1}$
,
 $\boldsymbol{e}_{2}$
,
 $\boldsymbol{e}_{3}$
are
 $\boldsymbol{e}_{1}^{o}$
,
 $\boldsymbol{e}_{2}^{o}$
,
 $\boldsymbol{e}_{3}^{o}$
. As time proceeds, the drop shapes and positions evolve, and so do the lattice vectors
 $\boldsymbol{e}_{1}(t)$
,
 $\boldsymbol{e}_{2}(t)$
,
 $\boldsymbol{e}_{3}(t)$
. However, for proper long-time averaging of the results, it is imperative that the system remains spatially periodic for all times
 $t\geqslant 0$
, and with limited skewage of
 $V$
. The latter is achieved, when necessary, by systematic periodic cell restructuring, but is only possible for three types of flow:
 $$\begin{eqnarray}\displaystyle & & \displaystyle \text{simple shear: }\boldsymbol{u}_{\infty }(\boldsymbol{x})=(\dot{{\it\gamma}}x_{2},0,0),\quad \mathit{Ca}={\it\mu}_{e}\dot{{\it\gamma}}a_{o}/{\it\sigma};\end{eqnarray}$$
 $$\begin{eqnarray}\displaystyle & & \displaystyle \text{planar extension (PE): }\boldsymbol{u}_{\infty }(\boldsymbol{x})=(\dot{{\it\Gamma}}x_{1},-\dot{{\it\Gamma}}x_{2},0),\quad \mathit{Ca}=2{\it\mu}_{e}\dot{{\it\Gamma}}a_{o}/{\it\sigma};\end{eqnarray}$$
 $$\begin{eqnarray}\displaystyle & & \displaystyle \text{mixed flow: }\boldsymbol{u}_{\infty }(\boldsymbol{x})=(\dot{{\it\gamma}}_{m}x_{2},\dot{{\it\gamma}}_{m}{\it\chi}x_{1},0),\quad \mathit{Ca}=(1+{\it\chi}){\it\mu}_{e}\dot{{\it\gamma}}_{m}a_{o}/{\it\sigma}.\end{eqnarray}$$
 $\dot{{\it\gamma}}$
,
 $\dot{{\it\Gamma}}$
,
 $\dot{{\it\gamma}}_{m}>0$
and
 $-1<{\it\chi}\leqslant 1$
; the capillary number expressions are listed for future reference. We use the notation
 $\dot{{\it\gamma}}_{m}$
for mixed flow to distinguish it from the simple shear rate;
 ${\it\chi}=1$
gives a flow equivalent to PE (Rallison Reference Rallison1981, Reference Rallison1984; Bentley & Leal Reference Bentley and Leal1986).
The main goal of the present work is to study the steady-state emulsion rheology in these three types of flow (2.1a–c
), and use it for general constitutive modelling. The relevant non-dimensional rheological functions are defined through the emulsion stress tensor
 ${\it\bf\Sigma}$
and its deviatoric part
 $\unicode[STIX]{x1D64F}={\it\bf\Sigma}-(1/3)\text{tr}({\it\bf\Sigma})\unicode[STIX]{x1D644}$
as
 $$\begin{eqnarray}\displaystyle & \displaystyle \text{simple shear}:~{\it\mu}_{sh}=\frac{{\it\Sigma}_{12}}{{\it\mu}_{e}\dot{{\it\gamma}}},\quad N_{1}^{sh}=\frac{{\it\Sigma}_{11}-{\it\Sigma}_{22}}{{\it\mu}_{e}\dot{{\it\gamma}}},\quad N_{2}^{sh}=\frac{{\it\Sigma}_{22}-{\it\Sigma}_{33}}{{\it\mu}_{e}\dot{{\it\gamma}}}; & \displaystyle\end{eqnarray}$$
 $$\begin{eqnarray}\displaystyle & \displaystyle \text{PE}:~{\it\mu}_{pe}=\frac{{\it\Sigma}_{11}-{\it\Sigma}_{22}}{4{\it\mu}_{e}\dot{{\it\Gamma}}},\quad N_{pe}=\frac{{\it\Sigma}_{11}+{\it\Sigma}_{22}-2{\it\Sigma}_{33}}{4{\it\mu}_{e}\dot{{\it\Gamma}}}; & \displaystyle\end{eqnarray}$$
 $$\begin{eqnarray}\displaystyle & \displaystyle \text{mixed flow}:~{\it\nu}_{ij}=\frac{\unicode[STIX]{x1D61B}_{ij}}{{\it\mu}_{e}\dot{{\it\gamma}}_{m}({\it\chi}+1)}. & \displaystyle\end{eqnarray}$$
 ${\it\nu}_{12}$
is interpreted as the non-dimensional mixed-flow viscosity, in addition to the similar quantities
 ${\it\mu}_{sh}$
and
 ${\it\mu}_{pe}$
.
2.1. Implementation of periodic boundaries
Simple shear. The reproducible lattice of points
 $\{m^{i}\boldsymbol{e}_{i}\}$
, where
 $m^{i}$
are arbitrary integers, has long been known for shear flow (2.1a
), and is extensively used in molecular dynamics and suspension flow simulations. It has also received applications in emulsion rheology studies (Loewenberg & Hinch Reference Loewenberg and Hinch1996, paper I). At
 $t=0$
, the basic cell
 $V$
is a cube
 $[0,L)^{3}$
, with the side
 $L$
, which we use as the length scale. For
 $t>0$
the basis vectors
 $\boldsymbol{e}_{1}=(1,0,0)$
and
 $\boldsymbol{e}_{3}=(0,0,1)$
are unchanged. Once the strain
 $\dot{{\it\gamma}}t$
crosses a half-integer value, the lattice is restructured by taking
 $\boldsymbol{e}_{2}-\boldsymbol{e}_{1}$
as the new
 $\boldsymbol{e}_{2}$
-vector, to make, in general,
 $\boldsymbol{e}_{2}=({\it\gamma},1,0)$
, where
 ${\it\gamma}=\dot{{\it\gamma}}t-[\dot{{\it\gamma}}t+1/2]\in [-1/2,1/2)$
and the brackets denote the integer part. Figure 1(a) (two-dimensional slice) shows the simple mapping to translate the drop centres from the old cell
 $V$
to the new cell to continue the simulation. Such restructuring ensures the minimal possible skewage at all
 $t>0$
.
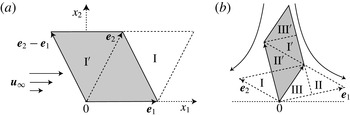
Mapping between the old and new (shaded) periodic cells at the restructuring moments for (a) simple shear and (b) planar extension. Region
 $\text{I}$
is translated to
 $\text{I}^{\prime }$
, region
 $\text{II}$
to
 $\text{II}^{\prime }$
, etc. The third dimension
 $x_{3}$
is not shown.

Planar extension. Far less obvious is the existence of reproducible lattices in PE found by Kraynik & Reinelt (Reference Kraynik and Reinelt1992). Following their results for a ‘critical lattice’ (with minimal skewage), we choose a square with side
 $L$
inclined at angle
 ${\it\theta}_{o}=\tan ^{-1}[(\sqrt{5}-1)/2]\approx 31.7^{\circ }$
to the
 $x_{1}$
-axis as the two-dimensional slice of the initial cubic periodic cell
 $V$
(figure 2
a). Again,
 $L$
is used as the length scale. The initial lattice vectors then become
 $\boldsymbol{e}_{1}^{o}=(\cos {\it\theta}_{o},\sin {\it\theta}_{o},~0)$
and
 $\boldsymbol{e}_{2}^{o}=(-\text{sin}\,{\it\theta}_{o},\cos {\it\theta}_{o},~0)$
. Figure 2 shows how the lattice reproducibility is achieved in the Hencky strain interval of
 $\dot{{\it\Gamma}}t={\it\varepsilon}_{p}$
, with
 ${\it\varepsilon}_{p}=\ln [(3+\sqrt{5})/2]\approx 0.9624$
. By
 $\dot{{\it\Gamma}}t={\it\varepsilon}_{p}/2$
, the lattice dynamics
 $\text{d}\boldsymbol{e}_{i}/\text{d}t=\text{diag}(\dot{{\it\Gamma}},-\dot{{\it\Gamma}},0)\boldsymbol{e}_{i}$
brings the basic periodic cell
 $V$
to a shape shown as the dashed-line parallelogram in figure 2(c). At this time moment, switching to
 $\boldsymbol{e}_{1}+\boldsymbol{e}_{2}$
and
 $\boldsymbol{e}_{1}+2\boldsymbol{e}_{2}$
as the new lattice vectors and integrating the lattice dynamics further to
 $\dot{{\it\Gamma}}t={\it\varepsilon}_{p}$
reproduces the initial cell shown in figure 2(a), due to the choice of
 ${\it\theta}_{o}$
and
 ${\it\varepsilon}_{p}$
. In simulations, such a lattice restructuring must be carried out at all half-integer values of
 $\dot{{\it\Gamma}}t/{\it\varepsilon}_{p}=n+1/2$
, but there is no need to match
 $(n+1/2)$
precisely. The vectors
 $\boldsymbol{e}_{1}$
and
 $\boldsymbol{e}_{2}$
are replaced with
 $\boldsymbol{e}_{1}+\boldsymbol{e}_{2}$
and
 $\boldsymbol{e}_{1}+2\boldsymbol{e}_{2}$
once
 $\dot{{\it\Gamma}}t$
crosses a half-integer value, to make, in general,
 $$\begin{eqnarray}\boldsymbol{e}_{1}=(\cos {\it\theta}_{o}\text{e}^{{\it\Gamma}},\sin {\it\theta}_{o}\text{e}^{-{\it\Gamma}},0),\quad \boldsymbol{e}_{2}=(-\text{sin}\,{\it\theta}_{o}\text{e}^{{\it\Gamma}},\cos {\it\theta}_{o}\text{e}^{-{\it\Gamma}},0),\end{eqnarray}$$
where
 $$\begin{eqnarray}{\it\Gamma}=\dot{{\it\Gamma}}t-{\it\varepsilon}_{p}\left[\frac{1}{2}+\frac{\dot{{\it\Gamma}}t}{{\it\varepsilon}_{p}}\right]\in \left[-\frac{{\it\varepsilon}_{p}}{2},\frac{{\it\varepsilon}_{p}}{2}\right).\end{eqnarray}$$
Dynamics of the computational cell in PE. At the Hencky strain of
 $\dot{{\it\Gamma}}t={\it\varepsilon}_{p}/2$
, the cell is restructured (the shaded area is the new cell) to continue the simulation. The third dimension is not shown; (a)
 $\dot{{\it\Gamma}}t=0$
, (b)
 $\dot{{\it\Gamma}}t={\it\varepsilon}_{p}/4$
, (c)
 $\dot{{\it\Gamma}}t={\it\varepsilon}_{p}/2$
, (d)
 $\dot{{\it\Gamma}}t=3{\it\varepsilon}_{p}/4$
.

Prior to a jump in
 $\boldsymbol{e}_{1}$
and
 $\boldsymbol{e}_{2}$
, mapping between the old and new periodic cells (figure 1
b) is used to recalculate the new drop positions after the cell restructuring. Namely, drops with centroids in region I are translated by
 $\boldsymbol{e}_{1}+\boldsymbol{e}_{2}$
to region
 $\text{I}^{\prime }$
of the new cell. Region II is translated by
 $\boldsymbol{e}_{2}$
to
 $\text{II}^{\prime }$
, region III – by
 $\boldsymbol{e}_{1}+2\boldsymbol{e}_{2}$
to
 $\text{III}^{\prime }$
.
Strong mixed flows. Kraynik & Reinelt (Reference Kraynik and Reinelt1992) noted that their reproducible lattice dynamics for PE can be generalized to other macroscopic flows with a constant velocity gradient matrix
 $\boldsymbol{{\rm\nabla}}\boldsymbol{u}_{\infty }$
, if a diagonalizing transformation
 $$\begin{eqnarray}\boldsymbol{{\rm\nabla}}\boldsymbol{u}_{\infty }=\unicode[STIX]{x1D64E}~\text{diag}(\dot{{\it\Gamma}},-\dot{{\it\Gamma}},0)\unicode[STIX]{x1D64E}^{-1}\end{eqnarray}$$
exists between
 $\boldsymbol{{\rm\nabla}}\boldsymbol{u}_{\infty }$
and the velocity gradient matrix for PE, with a real-valued matrix
 $\unicode[STIX]{x1D64E}$
. Indeed, the required lattice vector dynamics
 $\text{d}\boldsymbol{e}_{i}/\text{d}t=\boldsymbol{{\rm\nabla}}\boldsymbol{u}_{\infty }\boldsymbol{\cdot }\boldsymbol{x}$
is reduced to the PE flow dynamics
 $\text{d}\widetilde{\boldsymbol{e}}_{i}/\text{d}t=\text{diag}(\dot{{\it\Gamma}},-\dot{{\it\Gamma}},0)\widetilde{\boldsymbol{e}}_{i}$
for auxiliary vectors
 $\widetilde{\boldsymbol{e}}_{i}=\unicode[STIX]{x1D64E}^{-1}\boldsymbol{e}_{i}$
. The restructuring transformation
 $(\,\widetilde{\boldsymbol{e}}_{1},~\widetilde{\boldsymbol{e}}_{2})\rightarrow (\,\widetilde{\boldsymbol{e}}_{1}+\widetilde{\boldsymbol{e}}_{2},~\widetilde{\boldsymbol{e}}_{1}+2\widetilde{\boldsymbol{e}}_{2})$
to the new basis vectors in the PE flow space at half-integer values of
 $\dot{{\it\Gamma}}t/{\it\varepsilon}_{p}$
begets the same transformation of the lattice vectors
 $\boldsymbol{e}_{i}=\unicode[STIX]{x1D64E}\widetilde{\boldsymbol{e}}_{i}$
.
For a strong mixed flow, the transformation (2.5) was found by Hunt et al. (Reference Hunt, Bernardi and Todd2010) and used in sample molecular dynamics simulations. Their definition of mixed flows, though, differs from our (2.1c
) in the choice of the coordinate axes (rotated by
 $45^{\circ }$
). For our definition (2.1c
) and
 ${\it\chi}>0$
(characterizing ‘strong’ flows), the relation between
 $\dot{{\it\Gamma}}$
in (2.5) and
 $\dot{{\it\gamma}}_{m}$
is
 $\dot{{\it\Gamma}}=\dot{{\it\gamma}}_{m}\sqrt{{\it\chi}}$
; the matrix
 $\unicode[STIX]{x1D64E}$
and its inverse take the forms
 $$\begin{eqnarray}\unicode[STIX]{x1D64E}=\left(\begin{array}{@{}ccc@{}}(4{\it\chi})^{-1/4} & -(4{\it\chi})^{-1/4} & 0\\ ({\it\chi}/4)^{1/4} & ({\it\chi}/4)^{1/4} & 0\\ 0 & 0 & 1\end{array}\right),\quad \unicode[STIX]{x1D64E}^{-1}=\left(\begin{array}{@{}ccc@{}}({\it\chi}/4)^{1/4} & (4{\it\chi})^{-1/4} & 0\\ -({\it\chi}/4)^{1/4} & (4{\it\chi})^{-1/4} & 0\\ 0 & 0 & 1\end{array}\right).\end{eqnarray}$$
An arbitrary factor in
 $\unicode[STIX]{x1D64E}$
is chosen to make
 $\det (\unicode[STIX]{x1D64E})=1$
, which preserves the cell volume in transformations between
 $\widetilde{\boldsymbol{e}}_{i}$
and
 $\boldsymbol{e}_{i}$
. The side of the initial cubic box span on
 $\widetilde{\boldsymbol{e}}_{1}^{\,o}$
,
 $\widetilde{\boldsymbol{e}}_{2}^{\,o}$
and
 $\widetilde{\boldsymbol{e}}_{3}^{\,o}$
(see figure 2
a) is used as the length scale in our mixed-flow algorithm for
 ${\it\chi}>0$
. It can be derived from (2.3)–(2.6) that
 $\boldsymbol{e}_{1}^{2}+\boldsymbol{e}_{2}^{2}=(1/2)({\it\chi}^{1/2}+{\it\chi}^{-1/2})$
 $(\,\widetilde{\boldsymbol{e}}_{1}^{2}+\widetilde{\boldsymbol{e}}_{2}^{2})$
, indicating only a modest additional skewage of the periodic cell in mixed-flow simulations compared with PE simulations (except for very small
 ${\it\chi}$
with a stronger effect). For
 ${\it\chi}=0.25$
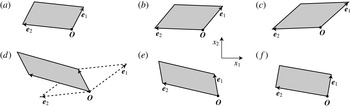
, the dynamics of the periodic cell
 $V$
in the interval
 $0\leqslant \dot{{\it\gamma}}_{m}t<2{\it\varepsilon}_{p}$
is shown in figure 3; at
 $\dot{{\it\gamma}}_{m}t=2{\it\varepsilon}_{p}$
, the cell
 $V$
returns to its initial shape. It can be noted that the formal mapping (2.6) between PE and mixed flow is only used to implement the periodic boundary conditions for the latter; of course, mixed-flow rheological simulations are irreducible to PE simulations.
The geometry of the computational cell in a strong mixed flow (
 ${\it\chi}=0.25$
) at
 $\dot{{\it\gamma}}_{m}t/{\it\varepsilon}_{p}=0$
(a), 1∕2 (b), 2∕3 (c), 1 (d), 4∕3 (e) and 5∕3 (f). In (d), the cell is restructured (the shaded area is the new cell) to continue the simulation.

Weak mixed flows. For
 ${\it\chi}<0$
(when the transformation (2.5) does not exist), implementation of periodic boundaries is much simpler and does not require the computational cell restructuring. As for simple shear, we choose the cube
 $[0,L)^{3}$
as the initial periodic cell and use
 $L$
as the length scale. In contrast to simple shear and PE, though, the lattice vector dynamics
 $\text{d}\boldsymbol{e}_{i}/\text{d}t=\boldsymbol{{\rm\nabla}}\boldsymbol{u}_{\infty }$
.
 $\boldsymbol{e}_{i}$
does not lead to indefinite stretching/contraction (which would require cell restructuring), but gives the periodic solution instead:
 $$\begin{eqnarray}\boldsymbol{e}_{1}=(\cos {\it\omega}t,-|{\it\chi}|^{1/2}\sin {\it\omega}t,0),\quad \boldsymbol{e}_{2}=(|{\it\chi}|^{-1/2}\sin {\it\omega}t,\cos {\it\omega}t,0),\end{eqnarray}$$
with
 ${\it\omega}=|{\it\chi}|^{1/2}\dot{{\it\gamma}}_{m}$
. Figure 4 illustrates the degree of compactness of the periodic cell for
 ${\it\chi}=-0.25$
; the selected shapes at
 ${\it\omega}t=0$
,
 ${\rm\pi}/4$
,
 ${\rm\pi}/2$
and
 $3{\rm\pi}/4$
also give the periodic cells at
 ${\it\omega}t={\rm\pi}$
,
 $5{\rm\pi}/4$
,
 $3{\rm\pi}/2$
and
 $7{\rm\pi}/4$
respectively, through central symmetry about the origin
 $\boldsymbol{O}$
. Difficulties with bad aspect ratios would appear for much smaller
 $|{\it\chi}|$
(not considered herein); for the shear-flow limit
 ${\it\chi}=0$
, an alternative standard implementation of periodic boundaries (see above) is used instead.
The geometry of the computational cell in a weak mixed flow (
 ${\it\chi}=-0.25$
). The directions of the
 $x_{1}$
and
 $x_{2}$
coordinate axes are the same as in figure 3; (a)
 ${\it\omega}t=0$
, (b)
 ${\rm\pi}/4$
, (c)
 ${\rm\pi}/2$
, (d)
 $3{\rm\pi}4$
.

2.2. Boundary-integral formulation
For all three flows (2.1), the time scale is defined as
 $(2I_{2})^{-1/2}$
, the velocity scale is
 $(2I_{2})^{1/2}L$
. The non-dimensional system of BI equations for the interfacial fluid velocity
 $\boldsymbol{u}(\boldsymbol{y})$
on drop surfaces
 $S_{{\it\alpha}}~({\it\alpha}=1,\ldots ,N)$
, to be solved iteratively at each time step, is used in the form of paper I:
 $$\begin{eqnarray}\displaystyle \boldsymbol{u}(\boldsymbol{y}) & = & \displaystyle \frac{({\it\lambda}-1)}{({\it\lambda}+1)}\left[2\mathop{\sum }_{{\it\beta}=1}^{N}\int _{S_{{\it\beta}}}\boldsymbol{Q}(\boldsymbol{x})\boldsymbol{\cdot }\widetilde{{\bf\tau}}(\boldsymbol{x}-\boldsymbol{y})\boldsymbol{\cdot }\boldsymbol{n}(\boldsymbol{x})\,\text{d}S_{x}+\langle \boldsymbol{u}\rangle _{{\it\alpha}}\right.\nonumber\\ \displaystyle & & \displaystyle \left.+\,2\mathop{\sum }_{{\it\beta}=1}^{N}\int _{S_{{\it\beta}}}(\boldsymbol{Q}\boldsymbol{\cdot }\boldsymbol{n})(\boldsymbol{x}-\boldsymbol{x}_{{\it\beta}}^{c})\,\text{d}S_{x}\right]+\boldsymbol{F}(\boldsymbol{y}),\quad \boldsymbol{y}\in S_{{\it\alpha}}.\end{eqnarray}$$
Here, the inhomogeneous term is
 $$\begin{eqnarray}\boldsymbol{F}(\boldsymbol{y})=\frac{2}{{\it\lambda}+1}\left[\boldsymbol{u}_{\infty }(\boldsymbol{y})+\frac{2a}{\mathit{Ca}}\mathop{\sum }_{{\it\beta}=1}^{N}\int _{S_{{\it\beta}}}(k(\boldsymbol{x})-\langle k\rangle _{{\it\beta}})\boldsymbol{n}(\boldsymbol{x})\boldsymbol{\cdot }\unicode[STIX]{x1D642}(\boldsymbol{x}-\boldsymbol{y})\,\text{d}S_{x}\right],\end{eqnarray}$$
where
 $a=a_{o}/L$
is the non-dimensional non-deformed drop radius,
 $k(\boldsymbol{x})$
is the local mean of the principal surface curvatures,
 $\langle k_{{\it\beta}}\rangle$
is the average of
 $k$
over
 $S_{{\it\beta}}$
,
 $\boldsymbol{n}(\boldsymbol{x})$
is the outward unit normal at
 $\boldsymbol{x}\in S_{{\it\beta}}$
and
 $\unicode[STIX]{x1D642}(\boldsymbol{x})$
is the triply periodic symmetric second-rank Green tensor. This tensor satisfies
 $$\begin{eqnarray}{\rm\nabla}^{2}\unicode[STIX]{x1D642}(\boldsymbol{x})-\boldsymbol{{\rm\nabla}}\boldsymbol{q}(\boldsymbol{x})=\boldsymbol{{\rm\nabla}}\boldsymbol{\cdot }{\bf\tau}(\boldsymbol{x})=\mathop{\sum }_{\boldsymbol{m}}{\it\delta}(\boldsymbol{x}-\boldsymbol{P}(\boldsymbol{m}))\unicode[STIX]{x1D644},\end{eqnarray}$$
where
 $\boldsymbol{q}(\boldsymbol{x})$
is the vector of pressures for
 $\unicode[STIX]{x1D642}(\boldsymbol{x})$
and the summation is over all lattice points
 $\boldsymbol{P}(\boldsymbol{m})=m^{1}\boldsymbol{e}_{1}+m^{2}\boldsymbol{e}_{2}+m^{3}\boldsymbol{e}_{3}$
with integer
 $m^{1}$
,
 $m^{2}$
,
 $m^{3}$
. The Ewald-like form for
 $\unicode[STIX]{x1D642}(\boldsymbol{x})$
for a lattice with arbitrary periods
 $\boldsymbol{e}_{1}$
,
 $\boldsymbol{e}_{2}$
,
 $\boldsymbol{e}_{3}$
follows from Hasimoto (Reference Hasimoto1959) and is given in appendix B of paper I. It is inconvenient, though, that the associated third-rank stress tensor
 ${\bf\tau}(\boldsymbol{x})$
is not periodic (and not symmetric), since it contains a linearly growing part from the pressure
 $\boldsymbol{q}(\boldsymbol{x})$
. Following Zinchenko & Davis (Reference Zinchenko and Davis2000) and paper I, we work instead with the periodic and fully symmetric tensor
 $\widetilde{{\bf\tau}}(\boldsymbol{r})={\bf\tau}(\boldsymbol{r})-\boldsymbol{r}\unicode[STIX]{x1D644}$
in the double-layer integrals (2.8). Additionally, velocity fluctuations
 $\boldsymbol{Q}(\boldsymbol{x})=\boldsymbol{u}(\boldsymbol{x})-\langle \boldsymbol{u}\rangle _{{\it\beta}}$
from the surface-averaged values
 $\langle \boldsymbol{u}\rangle _{{\it\beta}}$
are used on
 $S_{{\it\beta}}$
instead of
 $\boldsymbol{u}(\boldsymbol{x})$
to significantly reduce the integrand variations and thereby accelerate convergence in the most difficult multipole part (§ 3) of the algorithm. For the same reason, we work with
 $k(\boldsymbol{x})-\langle k\rangle _{{\it\beta}}$
instead of
 $k(\boldsymbol{x})$
in the single-layer integrals (2.9). It is also convenient that
 $\boldsymbol{Q}(\boldsymbol{x})$
(unlike
 $\boldsymbol{u}(\boldsymbol{x})$
) is the same for all periodic images of
 $S_{{\it\beta}}$
.
Once the interfacial velocity is found, the instantaneous volume-averaged stress tensor
 ${\it\bf\Sigma}$
in the emulsion can be expressed via surface integrals (e.g. Batchelor Reference Batchelor1970; Kennedy et al.
Reference Kennedy, Pozrikidis and Skalak1994). With
 ${\it\mu}_{e}(2I_{2})^{1/2}$
as the stress scale, our non-dimensional stress for all three flows (2.1) is calculated as
 $$\begin{eqnarray}\displaystyle {\it\Sigma}_{ij} & = & \displaystyle \text{I.T.}+\boldsymbol{{\rm\nabla}}_{i}(u_{\infty })_{j}+\boldsymbol{{\rm\nabla}}_{j}(u_{\infty })_{i}\nonumber\\ \displaystyle & & \displaystyle +\,\mathop{\sum }_{{\it\alpha}=1}^{N}\int _{S_{{\it\alpha}}}\left\{\frac{2a}{\mathit{Ca}}[k(\boldsymbol{x})-\langle k\rangle _{{\it\alpha}}]n_{i}(x-x_{{\it\alpha}}^{c})_{j}+({\it\lambda}-1)(u_{i}n_{j}+u_{j}n_{i})\!\right\}\,\text{d}S,\qquad\end{eqnarray}$$
where I.T. is an insignificant isotropic term; in deriving (2.11), the unit volume of the periodic cell has been taken into account. The tensor
 ${\it\bf\Sigma}$
is symmetric upon accurate surface discretization. From (2.11), all the rheological functions (2.2) are calculated.
3. Fast calculation of the boundary integrals
The present multipole-accelerated scheme for calculating the boundary integrals in (2.8) and (2.9) largely follows the logic of paper I, but it is more flexible and more efficient for the present set of problems, where considerable skewage of the periodic cell may occur, and some drops may become extremely elongated. This scheme, briefly outlined below, additionally incorporates some elements from our more recent codes (Zinchenko & Davis Reference Zinchenko and Davis2003, Reference Zinchenko and Davis2008, Reference Zinchenko and Davis2013) for multidrop–multiparticle systems.
3.1. Surface discretization and BI desingularizations
An unstructured mesh of
 $N_{\triangle }\gg 1$
flat triangles with
 $N_{\triangle }/2+2$
vertices (called nodes) is used to represent each drop surface, including the choices
 $N_{\triangle }=2160$
, 2880, 3840 and 6000 (in one simulation) used in the present calculations. Initial nearly uniform triangulations were prepared in a standard way from sphere tesselations with mesh refinements. As the drops move and deform, the quality of triangulations is maintained as described in § 4 (quite differently from paper I). Surface normals and curvatures are calculated by the best paraboloid-spline method of Zinchenko & Davis (Reference Zinchenko and Davis2000). Surface integrations were performed by a standard trapezoidal rule, with reassignment of triangle contributions to vertices for efficiency; the latter procedure follows Rallison (Reference Rallison1981) and was used in much of our prior work.
The double- and single-layer kernels in (2.8) and (2.9) are singular at all lattice points
 $\boldsymbol{x}-\boldsymbol{y}=\boldsymbol{P}(\boldsymbol{m})$
due to free-space contributions:
 $$\begin{eqnarray}\unicode[STIX]{x1D642}(\boldsymbol{r})\simeq \unicode[STIX]{x1D642}_{o}(\boldsymbol{r}-\boldsymbol{P}(\boldsymbol{m})),\quad \widetilde{{\bf\tau}}(\boldsymbol{r})\simeq {\bf\tau}_{o}(\boldsymbol{r}-\boldsymbol{P}(\boldsymbol{m})),\end{eqnarray}$$
where
 $$\begin{eqnarray}\unicode[STIX]{x1D642}_{o}(\boldsymbol{r})=-\frac{1}{8{\rm\pi}}\left(\frac{\unicode[STIX]{x1D644}}{r}+\frac{A\boldsymbol{A}}{r^{3}}\right),\quad {\bf\tau}_{o}(\boldsymbol{r})=\frac{3}{4{\rm\pi}}~\frac{rA\boldsymbol{A}}{r^{5}}.\end{eqnarray}$$
This behaviour necessitates efficient desingularizations of the boundary integrals prior to numerical solution. For a mesh node
 $\boldsymbol{y}\in S_{{\it\alpha}}$
on a drop surface different from an integration surface
 $S_{{\it\beta}}$
, the double-layer contribution from
 $S_{{\it\beta}}$
is written as (paper I)
 $$\begin{eqnarray}\displaystyle \int _{S_{{\it\beta}}}\boldsymbol{Q}(\boldsymbol{x})\boldsymbol{\cdot }\widetilde{{\bf\tau}}(\boldsymbol{x}-\boldsymbol{y})\boldsymbol{\cdot }\boldsymbol{n}(\boldsymbol{x})\,\text{d}S_{x} & {\approx} & \displaystyle \mathop{\sum }_{\boldsymbol{x}_{j}\in S_{{\it\beta}}}\boldsymbol{Q}(\boldsymbol{x}_{j})\boldsymbol{\cdot }\widetilde{{\bf\tau}}(\boldsymbol{x}-\boldsymbol{y})\boldsymbol{\cdot }\boldsymbol{n}(\boldsymbol{x}_{j}){\rm\Delta}S_{j}-\mathop{\sum }_{\boldsymbol{m}}{\it\Theta}(\boldsymbol{m},\boldsymbol{y})\nonumber\\ \displaystyle & & \displaystyle \times \,\boldsymbol{Q}^{\ast }\mathop{\sum }_{\boldsymbol{x}_{j}\in S_{{\it\beta}}}{\bf\tau}_{o}(\boldsymbol{x}_{j}+\boldsymbol{P}(\boldsymbol{m})-\boldsymbol{y})\boldsymbol{\cdot }\boldsymbol{n}(\boldsymbol{x}_{j}){\rm\Delta}S_{j}.\end{eqnarray}$$
Here, the summation is over all mesh nodes
 $\boldsymbol{x}_{j}\in S_{{\it\beta}}$
and all integer vectors
 $\boldsymbol{m}$
, and
 ${\rm\Delta}S_{j}$
is the surface area associated with node
 $\boldsymbol{x}_{j}$
. The barrier function
 ${\it\Theta}$
is designed to act only when
 $\boldsymbol{y}$
is close to a periodic image
 $S_{{\it\beta}}+\boldsymbol{P}(\boldsymbol{m})$
of
 $S_{{\it\beta}}$
. Namely,
 ${\it\Theta}$
is close to unity when the distance from
 $\boldsymbol{y}$
to the nearest node
 $\boldsymbol{x}^{\ast }+\boldsymbol{P}(\boldsymbol{m})$
on
 $S_{{\it\beta}}+\boldsymbol{P}(\boldsymbol{m})$
is much less than a threshold
 $h_{o}$
, and
 ${\it\Theta}$
gradually falls to zero as this distance approaches
 $h_{o}$
. For the precise definition of
 ${\it\Theta}$
, see paper I;
 $h_{o}$
is set to
 $0.3a$
in the present calculations. The choice of
 $\boldsymbol{Q}^{\ast }$
is crucial for successful large-strain simulations at high drop volume fractions and significant viscosity contrast
 ${\it\lambda}$
. The simplest near-singularity subtraction
 $\boldsymbol{Q}^{\ast }=\boldsymbol{Q}(\boldsymbol{x}^{\ast })$
is insufficient to overcome divergence of BI iterations even for moderate
 ${\it\lambda}\neq 1$
. The more robust (yet more complex) variational technique of paper I, which we follow herein, requires the subtracted quantity
 $\boldsymbol{Q}^{\ast }$
to minimize the Euclidean norm of the discrete free-space double-layer contribution from
 $S_{{\it\beta}}+\boldsymbol{P}(\boldsymbol{m})$
to
 $\boldsymbol{y}$
after subtraction. When
 ${\it\Theta}\approx 1$
, the subtracted term in (3.3) effectively alleviates the near-singular behaviour of the double-layer integrand (although it does not eliminate it completely). Of course, this subtracted term, helping calculations at finite triangulations, disappears in the limit
 $N_{\triangle }\rightarrow \infty$
. The optimized way of calculating the subtracted term (Zinchenko & Davis Reference Zinchenko and Davis2006, Reference Zinchenko and Davis2008) had a relatively small cost in the present simulations.
The single-layer contribution in (2.9) from a surface
 $S_{{\it\beta}}\not\ni \boldsymbol{y}$
is calculated as
 $$\begin{eqnarray}\displaystyle \int _{S_{{\it\beta}}}f(\boldsymbol{x})\unicode[STIX]{x1D642}(\boldsymbol{x}-\boldsymbol{y})\boldsymbol{\cdot }\boldsymbol{n}(\boldsymbol{x})\,\text{d}S_{x} & {\approx} & \displaystyle \mathop{\sum }_{\boldsymbol{x}_{j}\in S_{{\it\beta}}}f(\boldsymbol{x}_{j})\unicode[STIX]{x1D642}(\boldsymbol{x}_{j}-\boldsymbol{y})\boldsymbol{\cdot }\boldsymbol{n}(\boldsymbol{x}_{j}){\rm\Delta}S_{j}-\mathop{\sum }_{\boldsymbol{m}}{\it\Theta}(\boldsymbol{m},\boldsymbol{y})\nonumber\\ \displaystyle & & \displaystyle \times ~f^{\ast }\mathop{\sum }_{\boldsymbol{x}_{j}\in S_{{\it\beta}}}\unicode[STIX]{x1D642}_{o}(\boldsymbol{x}_{j}+\boldsymbol{P}(\boldsymbol{m})-\boldsymbol{y})\boldsymbol{\cdot }\boldsymbol{n}(\boldsymbol{x}_{j}){\rm\Delta}S_{j},\end{eqnarray}$$
with the same barrier
 ${\it\Theta}$
as in (3.3), and
 $f(\boldsymbol{x})=k(\boldsymbol{x})-\langle k_{{\it\beta}}\rangle$
for brevity. We found the simplest choice of
 $f^{\ast }=f(\boldsymbol{x}^{\ast })$
to be sufficient in the present calculations, although a more complex scheme was offered in paper I. The subtracted term in (3.4) completely eliminates near-singular behaviour of the integrand (thus helping calculations at finite triangulations), but, again, disappears in the limit
 $N_{\triangle }\rightarrow \infty$
. Due to the barrier
 ${\it\Theta}$
, typically, only one periodic image of
 $S_{{\it\beta}}$
contributes to the subtracted terms in (3.3) and (3.4), and so it was inexpensive to calculate these terms by direct summations.
For self-interactions
 $(\boldsymbol{y}\in S_{{\it\alpha}}=S_{{\it\beta}})$
, the contributions of
 $S_{{\it\beta}}$
to the BIs in (2.8) and (2.9) are computed as
 $$\begin{eqnarray}\displaystyle & & \displaystyle \int _{S_{{\it\alpha}}}\boldsymbol{Q}(\boldsymbol{x})\widetilde{{\bf\tau}}(\boldsymbol{x}-\boldsymbol{y})\boldsymbol{\cdot }\boldsymbol{n}(\boldsymbol{x})\,\text{d}S_{x}\nonumber\\ \displaystyle & & \displaystyle \quad \approx \frac{1}{2}\boldsymbol{Q}(\boldsymbol{y})+\mathop{\sum }_{\boldsymbol{x}_{j}\in S_{{\it\alpha}}}\boldsymbol{Q}(\boldsymbol{x}_{j})\boldsymbol{\cdot }[\widetilde{{\bf\tau}}(\boldsymbol{x}_{j}-\boldsymbol{y})-{\bf\tau}_{o}(\boldsymbol{x}_{j}-\boldsymbol{y})]\boldsymbol{\cdot }\boldsymbol{n}(\boldsymbol{x}_{j}){\rm\Delta}S_{j}\nonumber\\ \displaystyle & & \displaystyle \qquad +\mathop{\sum }_{\boldsymbol{x}_{j}\in S_{{\it\alpha}}}[\boldsymbol{Q}(\boldsymbol{x}_{j})-\boldsymbol{Q}(\boldsymbol{y})]\boldsymbol{\cdot }{\bf\tau}_{o}(\boldsymbol{x}_{j}-\boldsymbol{y})\boldsymbol{\cdot }\boldsymbol{n}(\boldsymbol{x}_{j}){\rm\Delta}S_{j}\end{eqnarray}$$
and
 $$\begin{eqnarray}\displaystyle \int _{S_{{\it\alpha}}}f(\boldsymbol{x})\boldsymbol{n}(\boldsymbol{x})\boldsymbol{\cdot }\unicode[STIX]{x1D642}(\boldsymbol{x}-\boldsymbol{y})\,\text{d}S_{x} & {\approx} & \displaystyle \mathop{\sum }_{\boldsymbol{x}_{j}\in S_{{\it\alpha}}}f(\boldsymbol{x}_{j})\boldsymbol{n}(\boldsymbol{x}_{j})\boldsymbol{\cdot }[\unicode[STIX]{x1D642}(\boldsymbol{x}_{j}-\boldsymbol{y})-\unicode[STIX]{x1D642}_{o}(\boldsymbol{x}_{j}-\boldsymbol{y})]{\rm\Delta}S_{j}\nonumber\\ \displaystyle & & \displaystyle +\,\mathop{\sum }_{\boldsymbol{x}_{j}\in S_{{\it\alpha}}}[f(\boldsymbol{x}_{j})-f(\boldsymbol{y})]\boldsymbol{n}(\boldsymbol{x}_{j})\boldsymbol{\cdot }\unicode[STIX]{x1D642}_{o}(\boldsymbol{x}_{j}-\boldsymbol{y}){\rm\Delta}S_{j}.\end{eqnarray}$$
For the second lines in (3.5) and (3.6) (with
 $\boldsymbol{x}_{j}=\boldsymbol{y}$
excluded), direct summations are always used. Unlike in (3.3), complete desingularization is achieved in (3.5).
3.2. Multipole-accelerated scheme
For the first lines in (3.3) and (3.4), it would be, of course, prohibitively expensive to use direct summations in dynamical simulations, with a cost of
 $O(N^{2}N_{\triangle }^{2})$
per time step and a large coefficient, due to iterations and the complex nature of
 $\widetilde{{\bf\tau}}$
and
 $\unicode[STIX]{x1D642}$
. A highly efficient multipole-accelerated scheme is used instead. Each drop, when elongated, is divided into a few (not more than three) compact blocks; see paper I for the procedure and figure 2 therein. A compact drop coincides with its only block. As a result, all mesh nodes on all drops are partitioned into compact blocks
 $\mathscr{B}_{1},\ldots ,\mathscr{B}_{N_{B}}~(N_{B}\geqslant N)$
. A minimal spherical shell
 $\mathscr{D}_{{\it\gamma}}$
with a centre
 $\boldsymbol{x}_{{\it\gamma}}^{o}$
and radius
 $d_{{\it\gamma}}^{o}$
is constructed around each block
 $\mathscr{B}_{{\it\gamma}}$
with sufficient accuracy.
The next step is to partition the periodic kernels
 $\unicode[STIX]{x1D642}(\boldsymbol{r})$
and
 $\widetilde{{\bf\tau}}(\boldsymbol{r})$
into the ‘near-field’ and ‘far-field’ parts. In paper I, only the
 $\unicode[STIX]{x1D642}_{o}(\boldsymbol{r})$
and
 ${\bf\tau}_{o}(\boldsymbol{r})$
parts of
 $\unicode[STIX]{x1D642}(\boldsymbol{r})$
and
 $\widetilde{{\bf\tau}}(\boldsymbol{r})$
were qualified as near-field. Such partition causes difficulties and/or performance degradation when
 $N$
is not too large (
 ${\sim}100$
), periodic cells are significantly more stretched than in shear flow (see figures 2–4) and some drops are strongly deformed. A more flexible and robust scheme herein is to assign free-space contributions from lattice points to near-field, if their distance from the origin is within a given threshold
 $R_{sub}$
:
 $$\begin{eqnarray}\unicode[STIX]{x1D642}(\boldsymbol{r})=\mathop{\sum }_{|\boldsymbol{P}(\boldsymbol{m})|\leqslant R_{sub}}\!\!\!\!\unicode[STIX]{x1D642}_{o}(\boldsymbol{r}+\boldsymbol{P}(\boldsymbol{m}))+\unicode[STIX]{x1D642}_{1}(\boldsymbol{r}),\quad \widetilde{{\bf\tau}}(\boldsymbol{r})=\mathop{\sum }_{|\boldsymbol{P}(\boldsymbol{m})|\leqslant R_{sub}}\!\!\!\!{\bf\tau}_{o}(\boldsymbol{r}+\boldsymbol{P}(\boldsymbol{m}))+{\bf\tau}_{1}(\boldsymbol{r}).\end{eqnarray}$$
The number of free-space contributions to be subtracted from
 $(\unicode[STIX]{x1D642},\widetilde{{\bf\tau}})$
to form the far-field
 $(\unicode[STIX]{x1D642}_{1},{\bf\tau}_{1})$
depends, therefore, on both
 $R_{sub}$
and the instantaneous lattice geometry. For
 $R_{sub}=1.4$
, which we found to be in the optimal range in the present simulations with
 $N=100{-}400$
drops, there are 7–9, 7–13 and 9–13 subtractions for simple shear, PE and mixed-flow (
 ${\it\chi}=0.25$
) lattices respectively. The partition (3.7) with
 $R_{sub}=1.4$
moves the singularities of
 $\unicode[STIX]{x1D642}_{1}(\boldsymbol{r})$
and
 ${\bf\tau}_{1}(\boldsymbol{r})$
farther away from the origin, compared with the
 $R_{sub}=0$
choice in paper I.
The free-space contributions of each block
 $\mathscr{B}_{{\it\gamma}}~({\it\gamma}=1,\ldots ,N_{B})$
to the summations in the first lines of (3.3) and (3.4) (i.e. with
 $\unicode[STIX]{x1D642}_{o}(\boldsymbol{x}_{j}-\boldsymbol{y})$
and
 ${\bf\tau}_{o}(\boldsymbol{x}_{j}-\boldsymbol{y})$
in place of
 $\unicode[STIX]{x1D642}(\boldsymbol{x}_{j}-\boldsymbol{y})$
and
 $\widetilde{{\bf\tau}}(\boldsymbol{x}_{j}-\boldsymbol{y})$
) are expanded in Lamb’s singular series about the block centre
 $\boldsymbol{x}_{{\it\gamma}}^{o}$
. These expansions are generated to a sufficient order by the alternative algorithm of Zinchenko & Davis (Reference Zinchenko and Davis2008, § 4.2 therein), which is
 ${\approx}2.5$
times faster for double-layer expansions than the original algorithm of Zinchenko & Davis (Reference Zinchenko and Davis2000) used in paper I for this purpose.
Now, to calculate the sums in the first lines of (3.3) and (3.4) for
 $\boldsymbol{y}\in \mathscr{B}_{{\it\delta}}\subset S_{{\it\alpha}}$
, we consider, for each block
 $\mathscr{B}_{{\it\gamma}}\not\subset S_{{\it\alpha}}$
, a periodically shifted block
 $\mathscr{B}_{{\it\gamma}}^{min}=\mathscr{B}_{{\it\gamma}}+\boldsymbol{P}(\boldsymbol{m}_{{\it\delta}{\it\gamma}})$
, which minimizes the centre-to-centre distance
 $|\boldsymbol{x}_{{\it\gamma}}^{o,min}-\boldsymbol{x}_{{\it\delta}}^{o}|$
(with
 $\boldsymbol{x}_{{\it\gamma}}^{o,min}=\boldsymbol{x}_{{\it\gamma}}^{o}+\boldsymbol{P}(\boldsymbol{m}_{{\it\delta}{\it\gamma}})$
). In what follows, the index min will supplement quantities related to
 $\mathscr{B}_{{\it\gamma}}^{min}$
. According to (3.7) and periodicity of the kernels
 $\unicode[STIX]{x1D642}$
and
 $\widetilde{{\bf\tau}}$
, the contribution of
 $\mathscr{B}_{{\it\gamma}}$
to either (3.3) or (3.4) can be written as the sum of free-space contributions from
 $\mathscr{B}_{{\it\gamma}}^{min}+\boldsymbol{P}(\boldsymbol{m})$
(with
 $|\boldsymbol{P}(\boldsymbol{m})|\leqslant R_{sub}$
) plus the far-field contribution from
 $\mathscr{B}_{{\it\gamma}}^{min}$
using
 ${\bf\tau}_{1}$
and
 $\unicode[STIX]{x1D642}_{1}$
. The latter is calculated by a special form of Taylor double series for
 ${\bf\tau}_{1}(\boldsymbol{x}-\boldsymbol{y})$
and
 $\unicode[STIX]{x1D642}_{1}(\boldsymbol{x}-\boldsymbol{y})$
in powers of
 $\boldsymbol{x}-\boldsymbol{x}_{{\it\gamma}}^{o,min}$
and
 $\boldsymbol{y}-\boldsymbol{x}_{{\it\delta}}^{o}$
(Zinchenko & Davis Reference Zinchenko and Davis2000), which only requires knowledge of
 $\unicode[STIX]{x1D642}_{1}(\boldsymbol{r})$
, the associated vector of pressures
 $\boldsymbol{q}_{1}(\boldsymbol{r})$
and their high-order derivatives at
 $\boldsymbol{r}=\boldsymbol{R}_{{\it\gamma}{\it\delta}}=\boldsymbol{x}_{{\it\delta}}^{o}-\boldsymbol{x}_{{\it\gamma}}^{o,min}$
(appendix B of paper I). The optimized form of far-field expansions (appendix A of Zinchenko & Davis Reference Zinchenko and Davis2003) valid for any lattice geometry (with a unit cell volume) is used herein in favour of the algorithm from paper I. The necessary functions
 $\unicode[STIX]{x1D642}_{1}(\boldsymbol{r}),\boldsymbol{q}_{1}(\boldsymbol{r})$
and their derivatives are pretabulated (prior to iterations of (2.8)) to a sufficient order
 $n_{tab}(n_{1},n_{2},n_{3})$
on a skewed uniform mesh
 $\boldsymbol{x}=hn_{1}\boldsymbol{e}_{1}+hn_{2}\boldsymbol{e}_{2}+hn_{3}\boldsymbol{e}_{3}$
, with
 $h=0.5/N_{T}$
and the integers
 $n_{i}$
in the range
 $|n_{1}|\leqslant N_{T}$
,
 $0\leqslant n_{2}$
,
 $n_{3}\leqslant N_{T}$
. Extension to negative
 $n_{2}$
or
 $n_{3}$
simply follows from the symmetry properties of
 $\unicode[STIX]{x1D642}_{1}(\boldsymbol{r})$
and
 $\boldsymbol{q}_{1}(\boldsymbol{r})$
. Since the singularities of
 $\unicode[STIX]{x1D642}_{1}(\boldsymbol{r})$
and
 $\boldsymbol{q}_{1}(\boldsymbol{r})$
are far away from the origin, these functions are very smooth in the tabulation range
 $V_{tab}=\{{\it\xi}^{i}\boldsymbol{e}_{i},|{\it\xi}^{i}|\leqslant 1/2\}$
, so only a small value of
 $N_{T}$
(typically 7) and a small order
 $n_{tab}$
of derivatives suffice. Still, due to the lattice time dependence, the tabulation is required at each time step. The most efficient Ewald-like forms for
 $\unicode[STIX]{x1D642}_{1}$
and
 $\boldsymbol{q}_{1}$
follow from Hasimoto (Reference Hasimoto1959), like in paper I. These forms, together with fast high-order differentiation techniques (appendix C of paper I), allow dynamical tabulation of
 $\unicode[STIX]{x1D642}_{1},\boldsymbol{q}_{1}$
and their high-order derivatives at a negligible cost. For a skewed lattice, the minimal vector
 $\boldsymbol{R}_{{\it\gamma}{\it\delta}}$
is not always in the tabulation range
 $V_{tab}$
. In general, the periodic shift
 $\boldsymbol{P}(\boldsymbol{m}^{\ast })$
is found to map
 $\boldsymbol{R}_{{\it\gamma}{\it\delta}}$
on
 $V_{tab}$
. The necessary values of
 $\unicode[STIX]{x1D642}(\boldsymbol{r})$
,
 $\boldsymbol{q}_{1}(\boldsymbol{r})$
and their high-order derivatives at
 $\boldsymbol{r}=\boldsymbol{R}_{{\it\gamma}{\it\delta}}$
are easily linked to those at
 $\boldsymbol{r}=\boldsymbol{R}_{{\it\gamma}{\it\delta}}^{\ast }=\boldsymbol{R}_{{\it\gamma}{\it\delta}}+\boldsymbol{P}(\boldsymbol{m})\in V_{tab}$
, by adding/subtracting a few free-space contributions in an efficient manner (appendix D of paper I). In turn, the values of
 $\unicode[STIX]{x1D642}_{1},\boldsymbol{q}_{1}$
and their derivatives at
 $\boldsymbol{r}=\boldsymbol{R}_{{\it\gamma}{\it\delta}}^{\ast }$
are obtained from the nearest table node by Taylor expansions (typically of second or third order). Again, due to the smoothness of
 ${\bf\tau}_{1}(\boldsymbol{r})$
and
 $\unicode[STIX]{x1D642}_{1}(\boldsymbol{r})$
near
 $\boldsymbol{r}=\boldsymbol{R}_{{\it\gamma}{\it\delta}}$
, the far-field double series in powers of
 $\boldsymbol{x}-\boldsymbol{x}_{{\it\gamma}}^{min}$
and
 $\boldsymbol{y}-\boldsymbol{x}_{{\it\delta}}^{o}$
for the (
 ${\bf\tau}_{1},\unicode[STIX]{x1D642}_{1}$
) contribution to (3.3) and (3.4) are rapidly convergent, and just a few terms suffice.
If the shell
 $\mathscr{D}_{{\it\gamma}}^{min}+\boldsymbol{P}(\boldsymbol{m})$
around
 $\mathscr{B}_{{\it\gamma}}^{min}+\boldsymbol{P}(\boldsymbol{m})$
and the shell
 $\mathscr{D}_{{\it\delta}}$
have ‘enough clearance’ (see below), the free-space contributions from
 $\mathscr{B}_{{\it\gamma}}^{min}+\boldsymbol{P}(\boldsymbol{m})$
to (3.3) and (3.4) are evaluated at
 $\boldsymbol{y}\in \mathscr{B}_{{\it\delta}}$
by first re-expanding Lamb’s singular series for
 $\mathscr{B}_{{\it\gamma}}^{min}+\boldsymbol{P}(\boldsymbol{m})$
as Lamb’s regular series near
 $\boldsymbol{x}_{{\it\delta}}^{o}$
. All such re-expansions are greatly accelerated (Zinchenko 1994, Zinchenko & Davis Reference Zinchenko and Davis2000) by rotational transformations of spherical harmonics with Wigner functions, and the cumulative Lamb’s regular series from all blocks ‘sufficiently separated’ from
 $\mathscr{B}_{{\it\delta}}$
are then efficiently evaluated at all mesh nodes
 $\boldsymbol{y}\in \mathscr{B}_{{\it\delta}}$
.
If the block
 $\mathscr{B}_{{\it\gamma}}^{min}+\boldsymbol{P}(\boldsymbol{m})$
is not ‘sufficiently separated’ from
 $\mathscr{B}_{{\it\delta}}$
, but node
 $\boldsymbol{y}\in \mathscr{B}_{{\it\delta}}$
is ‘well outside’ the shell
 $\mathscr{D}_{{\it\gamma}}^{min}+\boldsymbol{P}(\boldsymbol{m})$
(as defined below), Lamb’s singular series for
 $\mathscr{B}_{{\it\gamma}}^{min}+\boldsymbol{P}(\boldsymbol{m})$
are used directly to compute the contributions of
 $\mathscr{B}_{{\it\gamma}}^{min}+\boldsymbol{P}(\boldsymbol{m})$
to (3.3) and (3.4). Only in rare cases, when
 $\boldsymbol{y}$
is too close to
 $\mathscr{D}_{{\it\gamma}}^{min}+\boldsymbol{P}(\boldsymbol{m})$
from outside, or is inside
 $\mathscr{D}_{{\it\gamma}}^{min}+\boldsymbol{P}(\boldsymbol{m})$
, should we use direct summations for these contributions.
A separate scheme (also different from the one in paper I) is used for self-interactions, i.e. to calculate the sums in the first lines of (3.5) and (3.6). It was observed in our PE and strong mixed-flow simulations in near-critical conditions that one (or a few) drop(s) can acquire extreme elongation (even comparable with the size of the periodic cell), still without necking, while all the other drops remain compact. To handle such cases in a simple and efficient manner, we replace, for self-interactions only, the uniform partition (3.7) by a variable partition with the parameter
 $R_{sub}^{{\it\alpha}}$
(instead of
 $R_{sub}$
) now dependent on the drop elongation. Drop partitioning into blocks is not used in the self-interactions (3.5) and (3.6); we work with entire drops instead. Let
 ${\it\zeta}_{o}$
be the minimum distance from the origin to the lattice points
 $\boldsymbol{P}(\boldsymbol{m}),\boldsymbol{m}\neq \mathbf{0}$
, and
 $d_{{\it\alpha}}$
be the radius of the minimal spherical shell around
 $S_{{\it\alpha}}$
centred at
 $\boldsymbol{x}_{{\it\alpha}}^{c}$
. The convergence rate of the far-field expansion (with
 ${\bf\tau}_{1}$
and
 $\unicode[STIX]{x1D642}_{1}$
in place of
 $\widetilde{{\bf\tau}}$
and
 $\unicode[STIX]{x1D642}$
in (3.5) and (3.6)) is conservatively measured by the progression exponent
 $2d_{{\it\alpha}}/\max (R_{sub}^{{\it\alpha}},{\it\zeta}_{o})$
. We require this quantity to stay within
 $(1+2a/{\it\zeta}_{o})/2$
, which determines
 $R_{sub}^{{\it\alpha}}$
. Upon the partition of
 $\unicode[STIX]{x1D642}$
and
 $\widetilde{{\bf\tau}}$
, the remaining free-space contributions from surfaces
 $S_{{\it\alpha}}+\boldsymbol{P}(\boldsymbol{m})$
(with
 $0<\boldsymbol{P}(\boldsymbol{m})\leqslant R_{sub}^{{\it\alpha}}$
) to (3.5) and (3.6) are handled by direct summations. For an extremely deformed drop, a fairly large number of free-space contributions need to be handled in this manner; still, the procedure remains fast compared with the rest of the code, since it is used for self-interactions only.
In BI simulations of emulsion flow through a packed bed (Zinchenko & Davis Reference Zinchenko and Davis2008, Reference Zinchenko and Davis2013) with ultrahigh surface resolution
 $(N_{\triangle }>10\,000)$
on solid boundaries, it was found to be useful to additionally divide each surface into a large number of ‘patches’ for multipole acceleration. This second level of mesh-node decomposition would not be beneficial in the present simulations with typically
 $N_{\triangle }\leqslant 3840$
.
Economical truncation bounds. As in paper I, the vital feature of the present multipole-accelerated scheme is the ‘economical truncation’ of multipole expansions/re-expansions to greatly boost the performance. It is taken into account, in nearly optimal fashion, that the rate of convergence of Lamb’s free-space singular series for block
 $\mathscr{B}_{{\it\gamma}}^{min}+\boldsymbol{P}(\boldsymbol{m})$
is a strong function of the clearance from the surrounding minimal spherical shell
 $\mathscr{D}_{{\it\gamma}}^{min}+\boldsymbol{P}(\boldsymbol{m})$
. Likewise, the rate of convergence of singular-to-regular free-space re-expansion between
 $\mathscr{B}_{{\it\gamma}}^{min}+\boldsymbol{P}(\boldsymbol{m})$
and
 $\mathscr{B}_{{\it\delta}}$
strongly depends on the clearance between the surrounding shells
 $\mathscr{D}_{{\it\gamma}}^{min}+\boldsymbol{P}(\boldsymbol{m})$
and
 $\mathscr{D}_{{\it\delta}}$
. In constructing the economical truncation bounds, we follow the technique of paper I, based, in part, on plausible estimations for the rate of decay of multipole coefficients. The only difference is that, according to the partition (3.7), there are now more free-space interactions qualified as ‘near-field’. Accordingly, for blocks
 $\mathscr{B}_{{\it\gamma}}^{min}$
and
 $\mathscr{B}_{{\it\delta}}$
separated (centre-to-centre) by
 $\boldsymbol{R}_{{\it\gamma}{\it\delta}}$
, the appropriate distance to affect the rate of convergence of far-field series contributions
 $\mathscr{B}_{{\it\gamma}}^{min}\rightarrow \mathscr{B}_{{\it\delta}}$
is now
 ${\it\zeta}_{{\it\alpha}{\it\beta}}=\min |\boldsymbol{R}_{{\it\gamma}{\it\delta}}+\boldsymbol{P}(\boldsymbol{m})|$
(over
 $|\boldsymbol{P}(\boldsymbol{m})|>R_{sub}$
). Our truncation scheme, inevitably semi-intuitive, contains a single heuristic ‘precision parameter’
 ${\it\varepsilon}$
. Most importantly, as
 ${\it\varepsilon}\rightarrow 0$
, all multipoles in near-field expansions/re-expansions and all terms in the far-field Taylor series are eventually included. However, for optimal performance, a threshold order
 $k_{o}$
is set to limit the use of multipoles in near-field operations. For a given
 ${\it\varepsilon}$
, blocks
 $\mathscr{B}_{{\it\gamma}}^{min}+\boldsymbol{P}(\boldsymbol{m})$
and
 $\mathscr{B}_{{\it\delta}}$
are qualified as ‘sufficiently separated’ if the multipole truncation order required for the block-to-block re-expansion is within
 $k_{o}$
. Likewise, the node
 $\boldsymbol{y}$
is considered to be ‘well outside’ the shell
 $\mathscr{D}_{{\it\gamma}}^{min}+\boldsymbol{P}(\boldsymbol{m})$
if the necessary truncation order for Lamb’s singular series for
 $\mathscr{B}_{{\it\gamma}}^{min}+\boldsymbol{P}(\boldsymbol{m})\rightarrow \boldsymbol{y}$
free-space contribution does not exceed
 $k_{o}$
. The value of
 $k_{o}=25$
was about optimal in the present calculations. In the limit
 ${\it\varepsilon}\rightarrow 0$
, though, the same non-multipole solution is reached regardless of
 $k_{o}$
and other artificial parameters
 $R_{sub},R_{sub}^{{\it\alpha}}$
. The correctness and high efficiency of our multipole-accelerated code are demonstrated in § 5.
4. Miscellaneous details of the algorithm
The generalized minimal residual method GMRES(
 $k$
), with
 $k=5$
, is used to iterate the BI equations (2.8) at each time step; additional remarks in Zinchenko & Davis (Reference Zinchenko and Davis2013) may be useful in this respect. The initial approximation to
 $\boldsymbol{u}(\boldsymbol{y})$
was constructed from the two preceding time steps to reduce the number of iterations. A version of ‘passive mesh stabilization’ (a family of techniques originated in Zinchenko, Rother & Davis Reference Zinchenko, Rother and Davis1997) is used to maintain the mesh quality in dynamical simulations. Namely, the mesh-node velocities
 $\boldsymbol{V}_{i}=\text{d}\boldsymbol{x}_{i}/\text{d}t$
to be used in the drop shape update are required to minimize a ‘kinetic energy’ function (separately on each surface), under the constraints on the normal velocity
 $\boldsymbol{V}_{i}\boldsymbol{\cdot }\boldsymbol{n}(\boldsymbol{x}_{i})=\boldsymbol{u}(\boldsymbol{x}_{i})\boldsymbol{\cdot }\boldsymbol{n}(\boldsymbol{x}_{\boldsymbol{i}})$
from the BI solution. We use the newest (and most successful) form of this function ((3.1)–(3.4) of Zinchenko & Davis Reference Zinchenko and Davis2013), which both resists mesh triangle collapse and is moderately adaptive to surface curvature. In the runs with modest drop deformation, this technique alone, which maintains fixed mesh topology, has soft stability limitations on the time step and avoids any surface interpolations, was sufficient to maintain mesh quality for an indefinite time. Only for larger deformations did we have to use, still very rarely, two additional tools for the mesh control – (i) active mesh restructuring through minimization of the ‘potential energy’ function
 $E$
and (ii) node reconnection (edge swapping). Our curvature-adaptive form of
 $E$
((3.5) of Zinchenko & Davis Reference Zinchenko and Davis2013) is more complex than the simplest physically motivated ‘spring-like’ form of Cristini, Bławzdziewicz & Loewenberg (Reference Cristini, Bławzdziewicz and Loewenberg2001); in particular, our form better helps us to prevent mesh-node crowding and mesh triangle collapse. Every 50–100 time steps, for each drop that has mesh triangles with compactness
 $C_{\triangle }<0.09$
,
 $E$
-minimization iterations (Zinchenko & Davis Reference Zinchenko and Davis2013) are combined with recursive node reconnections. The resulting mesh changes are only accepted (and completed), though, if mesh improvement is observed after the first 200 iterations. The criterion for mesh improvement is the same as in Zinchenko & Davis (Reference Zinchenko and Davis2013); the criterion for edge swapping mostly follows Cristini et al. (Reference Cristini, Bławzdziewicz and Loewenberg2001). It is the power of ‘passive mesh stabilization’, with the new kinetic energy function
 $F$
, that makes the actual use of two other tools (i) and (ii) very infrequent, thus reducing the number of BI iterations – the main contributor to the computational cost. Only for an extremely deformed drop did we have to use (i) and (ii) more often (every 10 time steps). It should be noted also that our mesh strategy avoids more complex topological changes (node addition/subtraction) altogether.
Control of surface overlapping. As in paper I, van der Waals attractive forces between the drops are neglected compared with the hydrodynamical forces (which is justified, except for very small drops of colloidal size). In principle, under these conditions, lubrication layers between neighbouring drops would prevent surface contacts, if the problem could be solved exactly. In practice, though, elimination of all surface overlaps at high emulsion concentrations would require exorbitant resolution and make the present simulations impossible. In paper I, small drop–drop overlaps were ignored altogether. This approach was mostly justified in the calculations of paper I, but is not in the present work with systematic runs in a much wider (1.5–2 orders of magnitude) time range; accumulation and growth of overlaps, however slow, would eventually destroy the solution. The control of surface overlapping was added to the present code as a major improvement over paper I; the principle is the same as in emulsion flow simulations through a packed bed (Zinchenko & Davis Reference Zinchenko and Davis2013). Let
 $\mathscr{R}(\boldsymbol{y})$
be the ray emanating from the mesh node
 $\boldsymbol{y}\in S_{{\it\alpha}}$
in the direction of the outward normal to
 $S_{{\it\alpha}}$
, and
 ${\it\delta}(\boldsymbol{y})$
be the distance from
 $\boldsymbol{y}$
along
 $\mathscr{R}(\boldsymbol{y})$
to the nearest intersection with other drop surfaces (including periodic images). On each time step, all mesh nodes
 $\boldsymbol{y}$
entering the zone
 ${\it\delta}(\boldsymbol{y})<{\it\delta}_{min}$
are pushed back along
 $-\boldsymbol{n}(\boldsymbol{y})$
to make
 ${\it\delta}(\boldsymbol{y})={\it\delta}_{min}$
; the default threshold
 ${\it\delta}_{min}$
is set to
 $0.001a$
. This ad hoc procedure is justified, because lubrication is ‘almost resolved’ due to high triangulations, so the above geometrical correction is required only for a very small portion (within 0.5–1 %) of the total number of mesh nodes, and was not observed to compromise the overall accuracy (§ 6). To calculate
 ${\it\delta}(\boldsymbol{y})$
, the nearest intersection of
 $\mathscr{R}(\boldsymbol{y})$
with flat mesh triangles is first found, which selects a triangle and the corresponding surface. Finally, the intersection of
 $\mathscr{R}(\boldsymbol{y})$
with the best paraboloid locally fitting the selected surface near the selected triangle is used to determine
 ${\it\delta}(\boldsymbol{y})$
. A plausible reason why it would be extremely difficult to eliminate all the remaining rare overlaps through the increase in the surface resolution is in the highly non-uniform thin film profile between nearly touching drops. It is well known from semianalytical studies of axisymmetrical thin film drainage between two drops under the action of a driving force that the surface clearance in the narrow transition zone from the film to the meniscus is much smaller than in the rest of the film.
The drop configuration is advanced by the simplest Euler scheme, with a variable non-dimensional time step
 $$\begin{eqnarray}{\rm\Delta}t=K_{{\rm\Delta}t}\mathit{Ca}\,\min ({\rm\Delta}x,0.7{\rm\Delta}x^{\ast })/a,\end{eqnarray}$$
where
 $K_{{\rm\Delta}t}$
is a numerical constant. The presence of
 ${\rm\Delta}x$
(the minimum spacing between directly connected mesh nodes) in (4.1) is in line with the usual Courant stability condition. The second term in (4.1) accounts for close drop interactions. Namely,
 ${\rm\Delta}x^{\ast }$
is the minimum distance between nodes
 $\boldsymbol{x}_{i}\in S_{{\it\alpha}}$
and
 $\boldsymbol{x}_{j}\in S_{{\it\beta}}$
on different surfaces (or their periodic images), but excluding pairs for which
 $\boldsymbol{x}_{j}$
is the node on
 $S_{{\it\beta}}$
closest to
 $\boldsymbol{x}_{i}$
, or vice versa. This exclusion is allowed by near-singularity subtraction in the boundary integrals and prevents
 ${\rm\Delta}t$
from becoming prohibitively small. The criterion (4.1) was first used by Zinchenko & Davis (Reference Zinchenko and Davis2005) in the two-drop problem, but with different factors
 $K_{{\rm\Delta}t}$
. In the present calculations for highly concentrated emulsions,
 $K_{{\rm\Delta}t}\approx 2$
was universally applicable when
 ${\it\lambda}=1$
and 3; for more extreme viscosity ratios
 ${\it\lambda}=0.25$
and 10, smaller
 $K_{{\rm\Delta}t}$
had to be used (
 ${\approx}1$
and 0.65–1 respectively). With the rule (4.1) and
 $c=0.55$
drop volume fraction, each time step required roughly 5–8 BI iterations for
 ${\it\lambda}=0.25$
and 3, and
 ${\approx}7{-}11$
iterations when
 ${\it\lambda}=10$
. The effect of time integration errors on the steady-state rheological functions (2.2) was generally well within statistical discrepancies, and so more expensive higher-order time-marching schemes were unjustified. As the only exception, time integration errors were observed to exceed statistical errors for a few weak mixed-flow runs (
 ${\it\chi}=-0.25$
) at the highest
 $\mathit{Ca}$
; these were simply recalculated by the Euler scheme with much smaller
 $K_{{\rm\Delta}t}$
.
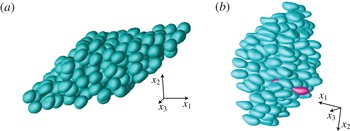
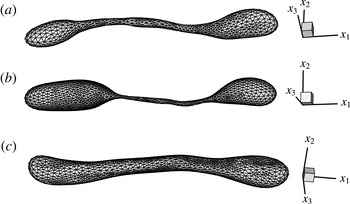
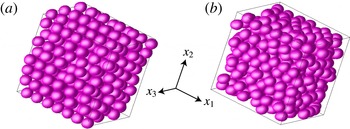
Snapshots of the dynamical simulations with
 $c=0.55$
,
 ${\it\lambda}=3$
,
 $N=200$
,
 $N_{\triangle }=2160$
for (a) strong mixed flow (
 ${\it\chi}=0.25$
,
 $\mathit{Ca}=0.0375$
) and (b) PE (
 $\mathit{Ca}=0.088$
). Only
 $N$
independent drops with centres in the periodic box
 $V$
are shown. In (b), one drop develops an extreme elongation, while all other drops remain relatively compact; (a)
 $t=44.33$
, (b)
 $t=34.13$
.

In some long-time simulations, a development of abnormal high curvature in a single node on just one drop was observed, with local corrugation of the otherwise smooth and compact drop shape. These events were extremely rare (not more often than every
 $O(10^{4})$
time steps, even less frequently than in paper I due to improvements herein), but they still required treatment to continue the simulation to large times for averaging. Swelling techniques (Zinchenko & Davis Reference Zinchenko and Davis2008, Reference Zinchenko and Davis2013) provide a suitable and very accurate remedy. A spherical drop of maximum possible volume is first inserted inside the problematic (‘parent’) drop. The new drop is then expanded with deformation, until it very closely fits the parent drop (except in the very vicinity of the problematic node, of no significance). The new smooth shape replaces the parent drop to continue the simulation. This approach is superior to the ellipsoid fitting used in paper I for the same purpose. The swelling technique is also a flexible tool to change the surface resolution on demand for any chosen drop, since the new drop resolution (unrelated to that for the parent drop) can be set arbitrarily. Such remeshing was used in a few runs of §§ 5 and 6 to probe the evolution to drop breakup in emulsion flow.
The initial drop configuration for each run was a random arrangement of non-overlapping spheres (and their periodic images) well mixed by the Metropolis algorithm (with millions of Monte Carlo random displacements).
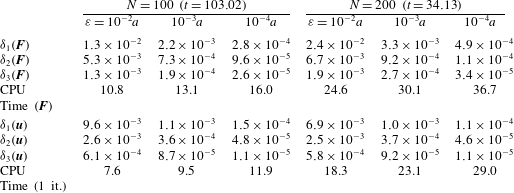
5. Algorithm testing and efficiency
Comprehensive validations of the multipole-accelerated BI code for shear-flow simulations were performed in paper I. However, since the algorithm has undergone many changes/improvements to be used in new applications herein, we have retested the new code and re-evaluated its efficiency. Figure 5 presents snapshots of our dynamical simulations with
 $c=0.55$
,
 ${\it\lambda}=3$
,
 $N=200$
,
 $N_{\triangle }=2160$
and a default ‘precision parameter’
 ${\it\varepsilon}=10^{-3}a$
for (a) strong mixed flow (
 ${\it\chi}=0.25$
,
 $\mathit{Ca}=0.0375$
) and (b) PE (
 $\mathit{Ca}=0.088$
). For the non-dimensional times shown, the systems are at statistical steady state, as far as the rheology (2.2) is of interest (see below). As an alternative to our (fairly complex) multipole-accelerated code, much simpler (but very inefficient) direct summations were used to compute the first lines in (3.3)–(3.6) for the instantaneous configurations from figure 5. To this end, the smooth functions
 $\unicode[STIX]{x1D642}({\bf\xi})-\unicode[STIX]{x1D642}_{o}({\bf\xi})$
and
 $\widetilde{{\bf\tau}}({\bf\xi})-{\bf\tau}_{o}({\bf\xi})$
are tabulated on a
 $215^{3}$
mesh in
 $V_{tab}=\{{\it\xi}^{i}\boldsymbol{e}_{i},|{\it\xi}^{i}|\leqslant 1/2\}$
to second derivatives. Mapping of
 $\boldsymbol{x}_{j}-\boldsymbol{y}$
on
 $V_{tab}$
and using periodicity of
 $\unicode[STIX]{x1D642}$
and
 $\widetilde{{\bf\tau}}$
allows us then to calculate
 $\unicode[STIX]{x1D642}(\boldsymbol{x}_{j}-\boldsymbol{y})$
and
 $\widetilde{{\bf\tau}}(\boldsymbol{x}_{j}-\boldsymbol{y})$
for every pair of nodes
 $\boldsymbol{x}_{j},\boldsymbol{y}$
using quadratic Taylor expansions from the table nodes and adding the free-space parts
 $\unicode[STIX]{x1D642}_{o}$
and
 ${\bf\tau}_{o}$
. The fine table size is chosen to exclude any appreciable numerical errors in this simple non-multipole calculation. The results obtained in this way are viewed as exact (for given discretizations (3.3)–(3.6)) and are supplemented with index ex. For the inhomogeneous term (2.9), only
 ${\rm\Delta}\boldsymbol{F}(\boldsymbol{y})=\boldsymbol{F}(\boldsymbol{y})-2\boldsymbol{u}_{\infty }(\boldsymbol{y})/({\it\lambda}+1)$
is interesting to compare between the two methods, in order to exclude the macroscopic contribution from
 $\boldsymbol{u}_{\infty }$
. Likewise, for the velocity field, the excess
 ${\rm\Delta}\boldsymbol{u}(\boldsymbol{y})=\boldsymbol{u}(\boldsymbol{y})-\boldsymbol{u}_{\infty }(\boldsymbol{y})$
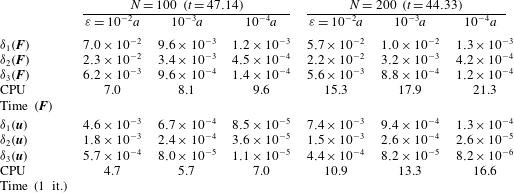
must be compared between the two methods. For the single-layer test of the integrals (2.9), three measures are used to quantify the deviation between
 ${\rm\Delta}\boldsymbol{F}$
(for the multipole-accelerated scheme) and
 ${\rm\Delta}\boldsymbol{F}_{ex}$
(cf. paper I):
 $$\begin{eqnarray}\displaystyle & \displaystyle {\it\delta}_{1}(\boldsymbol{F})=\frac{1}{\langle {\rm\Delta}\boldsymbol{F}_{ex}^{2}\rangle ^{1/2}}~\max _{\boldsymbol{x}_{i}}|{\rm\Delta}\boldsymbol{F}(\boldsymbol{x}_{i})-{\rm\Delta}\boldsymbol{F}_{ex}(\boldsymbol{x}_{i})|, & \displaystyle\end{eqnarray}$$
 $$\begin{eqnarray}\displaystyle & \displaystyle {\it\delta}_{2}(\boldsymbol{F})=\frac{1}{N}\mathop{\sum }_{{\it\alpha}=1}^{N}\frac{1}{\langle {\rm\Delta}\boldsymbol{F}_{ex}^{2}\rangle _{{\it\alpha}}^{1/2}}~\max _{\boldsymbol{x}_{i}\in S_{{\it\alpha}}}|{\rm\Delta}\boldsymbol{F}(\boldsymbol{x}_{i})-{\rm\Delta}\boldsymbol{F}_{ex}(\boldsymbol{x}_{i})|, & \displaystyle\end{eqnarray}$$
 $$\begin{eqnarray}\displaystyle & {\it\delta}_{3}(\boldsymbol{F})=\langle ({\rm\Delta}\boldsymbol{F}-{\rm\Delta}\boldsymbol{F}_{ex})^{2}\rangle ^{1/2}/\langle {\rm\Delta}\boldsymbol{F}_{ex}^{2}\rangle ^{1/2}. & \displaystyle\end{eqnarray}$$
Here,
 $\langle \cdots \!\,\rangle _{{\it\alpha}}$
and
 $\langle \cdots \!\,\rangle$
denote averaging over
 $S_{{\it\alpha}}$
and all surfaces respectively; in the conservative measure (5.1a
), the maximum is taken over all nodes on all drops. In the double-layer test for the integrals (2.8), both the multipole-accelerated and the non-multipole solutions use the same
 $\boldsymbol{F}$
and the same initial approximation to
 $\boldsymbol{u}$
(both taken from our dynamical simulation with
 ${\it\varepsilon}=10^{-3}a$
), and one iteration of (2.8) is performed by both methods to compare
 ${\rm\Delta}\boldsymbol{u}$
for the multipole-accelerated scheme with
 ${\rm\Delta}\boldsymbol{u}_{ex}$
. The deviation between the two is quantified in the same way as in (5.1), with
 $\boldsymbol{u}$
in place of
 $\boldsymbol{F}$
everywhere. The mixed-flow and PE runs were also repeated with
 $N=100$
drops and interrupted at
 $t=37.71$
and 51.51 respectively, for a similar accuracy analysis.
The results are summarized in tables 1 and 2. In addition to
 ${\it\delta}_{i}(\boldsymbol{F})$
and
 ${\it\delta}_{i}(\boldsymbol{u})$
, the CPU times (in seconds on a single 3.6 GHz PC core) to compute
 $\boldsymbol{F}$
(with all overheads including curvature/normal calculations, drop partitioning into blocks, singularity subtractions, etc.) and for one BI iteration of (2.8) are also given. In the PE test for
 $N=200$
, it was slightly better to limit the partition of each drop by two blocks (with 395 total), versus three blocks for
 $N=100$
(and 243 total). For much larger systems, it would be optimal to disable partitioning altogether. In the mixed-flow test with smaller drop deformation, partitioning was almost inactive even at
 $N=100$
. In tables 1 and 2, all deviations
 ${\it\delta}_{i}(\boldsymbol{F})$
and
 ${\it\delta}_{i}(\boldsymbol{u})$
strongly correlate with the intuitive parameter
 ${\it\varepsilon}$
and tend to zero as
 ${\it\varepsilon}\rightarrow 0$
, which demonstrates convergence of our multipole-accelerated code to the direct summations code. The computational cost is weakly sensitive to
 ${\it\varepsilon}$
. The code is particularly fast for small-to-moderate drop deformations (table 1 with the average drop length
 $\langle L_{d}\rangle =(2.35{-}2.37)a$
), and degrades only modestly for larger deformations (table 2 with
 $\langle L_{d}\rangle /a=3.01{-}3.19$
). For comparison, the standard summation algorithm required 26–27 min for
 $\boldsymbol{F}$
, and
 ${\approx}35~\text{min}$
for one BI iteration, even at
 $N=100$
. Compared with the shear-flow algorithm from paper I, the present code is more flexible but also more efficient in less favourable conditions (more skewed periodic cells and larger drop deformations). For example, in the PE test with
 $N=100~(\langle L_{d}\rangle =3.19a)$
and
 ${\it\varepsilon}=10^{-3}a$
, our CPU time of 9.5 s per BI iteration (table 2) is 140 times faster than by direct summations, even when the simplest linear interpolation is used in the latter for
 $\widetilde{{\bf\tau}}-{\bf\tau}_{o}$
(and not including substantial tabulation time for the direct code). In the shear-flow test of paper I with
 $\mathit{Ca}=0.1$
,
 $c=0.55$
,
 ${\it\lambda}=3$
,
 $N=100$
,
 $N_{\triangle }=1500$
and smaller deformations (
 $\langle L_{d}\rangle =2.80a$
), the corresponding gain was 106-fold. The CPU time scaling in tables 1 and 2 is roughly linear in the number of drops
 $N$
.
Convergence of the multipole-accelerated solution to the standard
 $O(N^{2}N_{\triangle }^{2})$
solution as
 ${\it\varepsilon}\rightarrow 0$
in the mixed-flow tests (
 ${\it\chi}=0.25$
,
 $\mathit{Ca}=0.0375$
,
 $c=0.55$
,
 ${\it\lambda}=3$
,
 $N_{\triangle }=2160$
).
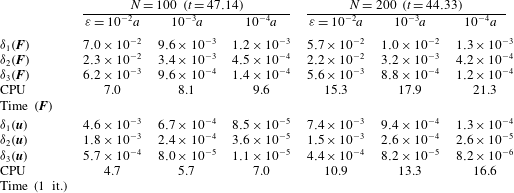
Convergence of the multipole-accelerated solution to the standard
 $O(N^{2}N_{\triangle }^{2})$
solution as
 ${\it\varepsilon}\rightarrow 0$
in the planar-extension tests (
 $\mathit{Ca}=0.088$
,
 $c=0.55$
,
 ${\it\lambda}=3$
,
 $N_{\triangle }=2160$
).
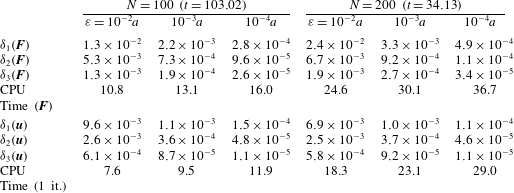
The default value
 $10^{-3}a$
of the intuitive parameter
 ${\it\varepsilon}$
in our dynamical simulations provides good accuracy for instantaneous configurations (tables 1 and 2), but is also tight enough to not affect time averaging of the rheological functions. In figure 6(a), the thin lines show the trajectories of the non-dimensional stresses (2.2c
)
 ${\it\nu}_{ij}$
for the
 $N=100$
mixed-flow simulation from table 1 continued to larger times
 $t\sim 250$
(outside the range in the figure). Instead of
 ${\it\nu}_{12}(={\it\mu}^{\ast })$
, we plot
 ${\it\mu}^{\ast }-1$
to exclude the continuous-phase contribution; very small values of
 ${\it\nu}_{33}=-({\it\nu}_{11}+{\it\nu}_{22})$
are not included. For comparison, the run was repeated with
 ${\it\varepsilon}=10^{-4}a$
(thick blue lines) to
 $t\sim 260$
. The two simulations are indistinguishable for small times
 $t\leqslant 8$
, but then quickly randomize. However, the long-time averages
 $$\begin{eqnarray}\langle {\it\mu}^{\ast }-1\rangle =3.544\pm 0.01,\quad \langle {\it\nu}_{11}\rangle =0.628\pm 0.01,\quad \langle {\it\nu}_{22}\rangle =-0.592\pm 0.01~({\it\varepsilon}=10^{-3}a),\end{eqnarray}$$
 $$\begin{eqnarray}\langle {\it\mu}^{\ast }-1\rangle =3.537\pm 0.01,\quad \langle {\it\nu}_{11}\rangle =0.612\pm 0.01,\quad \langle {\it\nu}_{22}\rangle =-0.572\pm 0.01~({\it\varepsilon}=10^{-4}a),\end{eqnarray}$$
obtained by excluding short transient parts
 $(t\leqslant t_{cut}\approx 4)$
of the trajectories and shown in figure 6(a) by horizontal lines (red thin and blue thick respectively), are in excellent agreement between the two simulations, within 0.6 % of
 ${\it\mu}^{\ast }-1$
(the main drop-phase contribution to the stress).
The effects of the precision parameter
 ${\it\varepsilon}$
and the system size
 $N$
on the rheological functions in the mixed-flow simulations with
 $c=0.55$
,
 ${\it\lambda}=3$
,
 ${\it\chi}=0.25$
and
 $\mathit{Ca}=0.0375$
. In (a), the thin lines are for
 ${\it\varepsilon}=10^{-3}a$
and the thick lines are for
 ${\it\varepsilon}=10^{-4}a$
, all for
 $N=100$
. In (b),
 ${\it\varepsilon}=10^{-3}a$
and
 $N=200$
. The horizontal lines represent long-time averages.

Figure 6(b) presents the trajectories of
 ${\it\mu}^{\ast }-1$
and
 ${\it\nu}_{ij}$
for a larger system
 $N=200~({\it\varepsilon}=10^{-3}a)$
from table 1 and figure 5(a). The long-time averages
 $3.534\pm 0.01$
,
 $0.628\pm 0.01$
and
 $0.597\pm 0.01$
for
 ${\it\mu}^{\ast }-1$
,
 ${\it\nu}_{11}$
and
 ${\it\nu}_{22}$
respectively (obtained with
 $t_{cut}\approx 8$
and shown by horizontal lines) are in excellent agreement with those for
 $N=100$
,
 ${\it\varepsilon}=10^{-3}a$
.
A similar accuracy analysis for PE flows with
 $\mathit{Ca}=0.088$
,
 $c=0.55$
,
 ${\it\lambda}=3$
and
 $N_{\triangle }=2160$
is shown in figure 7, including the trajectories of extensiometric functions (2.2b
)
 ${\it\mu}_{pe}-1$
,
 $N_{pe}$
and their long-time averages. The
 $N=100$
,
 ${\it\varepsilon}=10^{-3}a$
simulation (thin red lines in figure 7
a) had to be terminated at
 $t=105.6$
due to extreme elongation of one drop (figure 8
a) still without clear signs of breakup. For the same reason, the
 $N=100$
,
 ${\it\varepsilon}=10^{-4}a$
simulation (thick blue lines in figure 7
a) was stopped at
 $t=99.6$
. In both cases, though, most drops remain compact at the end of the simulation (the average drop length
 $\langle L_{d}\rangle$
being
 $(3{-}3.15)a$
, versus
 $L=11a$
in figure 8
a). Therefore, extreme elongation of individual drops still did not preclude the rheology (2.2b
) from reaching a statistical steady state. The long-time averages
 $$\begin{eqnarray}\langle {\it\mu}^{\ast }-1\rangle =4.44\pm 0.02,\quad \langle N_{pe}\rangle =0.72\pm 0.02\quad ({\it\varepsilon}=10^{-3}a),\end{eqnarray}$$
 $$\begin{eqnarray}\langle {\it\mu}^{\ast }-1\rangle =4.43\pm 0.01,\quad \langle N_{pe}\rangle =0.73\pm 0.01\quad ({\it\varepsilon}=10^{-4}a)\end{eqnarray}$$
for the two simulations (obtained using
 $t_{cut}\approx 12$
) agree very well within statistical errors.
The effects of the precision parameter
 ${\it\varepsilon}$
and the system size
 $N$
on the rheological functions in the PE simulations with
 $c=0.55$
,
 ${\it\lambda}=3$
and
 $\mathit{Ca}=0.088$
. In (a), the thin lines are for
 ${\it\varepsilon}=10^{-3}a$
and the thick lines are for
 ${\it\varepsilon}=10^{-4}a$
, all for
 $N=100$
. In (b),
 ${\it\varepsilon}=10^{-3}a$
and
 $N=200$
. The horizontal lines represent long-time averages.

The final shape of the most deformed drop in the PE simulations with (a)
 $\mathit{Ca}=0.088$
,
 $N=100$
, (b)
 $\mathit{Ca}=0.088$
,
 $N=200$
and (c)
 $\mathit{Ca}=0.1$
,
 $N=200$
, all for
 ${\it\lambda}=3$
and
 $c=0.55$
. In (b) and (c), the initial resolution
 $N_{\triangle }=2160$
has been refined to
 $N_{\triangle }=3840$
for the chosen drop, shortly prior to its extreme deformation.

Steady-state extensiometric functions at
 $c=0.45$
and
 $N=100$
for
 ${\it\lambda}=10$
(a), 3 (b), 1 (c) and 0.25 (d). Squares,
 $N_{\triangle }=2160$
; circles,
 $N_{\triangle }=3840$
. Lines connect the data deemed most accurate.

The
 $N=200$
,
 ${\it\varepsilon}=10^{-3}a$
PE simulation from figure 5(b) was only continued to
 $t=35.3$
due, again, to extreme elongation of one drop (figure 8
b). Here, the incipient breakup is more pronounced. The average drop length at
 $t=35.3$
is only
 $3.03a$
, and the rheology is still at statistical steady state with the averages
 $\langle {\it\mu}^{\ast }-1\rangle =4.46\pm 0.02$
,
 $\langle N_{pe}\rangle =0.76\pm 0.02$
(using
 $t_{cut}=8$
). These results are close to those for
 $N=100$
. With
 $\mathit{Ca}$
just slightly above 0.088, a major portion of the drops experience extreme elongation, so
 $\mathit{Ca}=0.088$
is near-critical. It would be essential to extend rheological simulations to supercritical conditions, when multiple breakups eventually make the system polydisperse. Unfortunately, we currently do not see a prospect of such simulations, at least in PE and strong mixed flows. Emulsion flow through a packed bed was simulated by Zinchenko & Davis (Reference Zinchenko and Davis2013), with up to
 ${\sim}60$
primary and secondary breakups in an individual run, to observe the drop size evolution and the approach of the statistical steady state for macroscopic properties (phase permeabilities). In those simulations, solid obstacles acted as geometrical constraints limiting drop elongation, which greatly alleviated the numerical analysis of multiple breakups. No such constraints act strongly on drops in pure emulsion flows. The near-critical case in figure 8(b) is not representative of supercritical conditions. More typical is the scenario (at least for PE and strong mixed flows) when emulsion drops attain very large deformations still without any signs of incipient breakup (figure 8
c). Each such case would need to be extended much further to approach pinch-off and fragment the drop, which is difficult to do repeatedly in a multidrop system. For this reason, the present simulations are only for subcritical conditions.
The above examples are for the ‘normal’ case, with fast relaxation to the statistical steady state and system-size independence of the results. Far more complex cases are discussed in § 7.
6. Extensiometric functions
In figures 9–11, our systematic calculations are summarized for the steady-state rheological functions
 ${\it\mu}_{pe}-1$
and
 $N_{pe}$
in PE. Figures 9(a–d) and 10(a–d) cover a broad range of viscosity ratios
 ${\it\lambda}=10$
, 3, 1 and 0.25 for both 45 % and 55 % drop volume fractions. These results are complemented by figure 11 for the intermediate case
 $c=0.5$
(with
 ${\it\lambda}=1$
only). Resolutions
 $N_{\triangle }=2160{-}3840$
and system sizes
 $N=100{-}200$
were used. The rightmost value of
 $\mathit{Ca}$
on each graph is very close to critical for massive breakup to occur. Except for one shorter run (figure 7
b), these near-critical simulations reached
 $t\sim 85{-}120$
, with enough statistical accuracy to assess the steady-state
 $\langle {\it\mu}_{pe}-1\rangle$
and
 $\langle N_{pe}\rangle$
. For other
 $\mathit{Ca}$
, the runs were terminated at
 $t$
from 120 to several hundred, to make the absolute statistical uncertainties in
 $\langle {\it\mu}_{pe}-1\rangle$
and
 $\langle N_{pe}\rangle$
as small as 0.005 (with 95 % confidence) and distil the effects of the surface resolution and the system size.
Steady-state extensiometric functions at
 $c=0.55$
for
 ${\it\lambda}=10$
(a), 3 (b), 1 (c) and 0.25 (d). Squares,
 $N_{\triangle }=2160$
; diamonds,
 $N_{\triangle }=2880$
; circles,
 $N_{\triangle }=3840$
. Solid symbols are for
 $N=100$
, open symbols (distinct from
 $N=100$
results for only one data point in (b)) are for
 $N=200$
. Lines connect the data deemed most accurate.

Steady-state extensiometric functions for
 $c=0.5$
and
 ${\it\lambda}=1$
; system size
 $N=100$
. Squares,
 $N_{\triangle }=2160$
; circles,
 $N_{\triangle }=3840$
.

An essential characteristic feature of all of our PE simulations (as opposed to the shear-flow runs discussed in § 7) is a short relaxation time to the statistical steady state, regardless of
 $\mathit{Ca}$
,
 ${\it\lambda}$
or
 $c$
, so that cut-out values of
 $t_{cut}=4{-}14$
were always enough for averaging. As an example, figure 12(a–d) gives the trajectories of
 ${\it\mu}_{pe}-1$
for
 $c=0.55$
,
 ${\it\lambda}=1$
and different capillary numbers. As
 $\mathit{Ca}$
is progressively reduced from 0.065 to 0.02 for a fixed
 $N=100$
, the fluctuations grow significantly due to configurational blockages of less deformed drops, but relaxation to the statistical steady state remains fast. The smaller cross-difference
 $N_{pe}$
(not shown in figure 12) has the same trends.
Trajectories of the excess viscosity
 ${\it\mu}_{pe}-1$
in PE simulations for
 $c=0.55$
and
 ${\it\lambda}=1$
with (a)
 $\mathit{Ca}=0.065$
,
 $N=100$
, (b)
 $\mathit{Ca}=0.05$
,
 $N=200$
, (c)
 $\mathit{Ca}=0.035$
,
 $N=100$
and (d)
 $\mathit{Ca}=0.02$
,
 $N=100$
.

Increasing the surface resolution is most important at high emulsion concentrations, large viscosity ratio
 ${\it\lambda}$
and small
 $\mathit{Ca}$
, due to the increased role of lubrication effects. In the least favourable case
 $c=0.55$
,
 ${\it\lambda}=10$
,
 $\mathit{Ca}=0.02$
, the effect of
 $N_{\triangle }$
(2160 versus 3840) on
 $\langle {\it\mu}_{pe}-1\rangle$
is 3 %; for
 $\langle N_{pe}\rangle$
, this difference is 2 % of the main stress
 $\langle {\it\mu}_{pe}-1\rangle$
(cf. the circles and squares in figure 10
a). At the same
 $c$
,
 $\mathit{Ca}$
and
 ${\it\lambda}=3$
, these differences are only 1.3 % and 1 % respectively. At
 ${\it\lambda}=3$
, even smaller triangulation effects are observed for (i)
 $c=0.55$
,
 $\mathit{Ca}=0.04$
and (ii)
 $c=0.45$
,
 $\mathit{Ca}=0.02{-}0.04$
(cf. the solid squares and circles in figures 9
b and 10
b).
The slight difference between the results for
 $N=100$
(solid squares) and those for
 $N=200$
(open squares) at the near-critical
 $\mathit{Ca}=0.088$
in figure 10(b) may be mostly statistical, due to the short averaging interval in the
 $N=200$
run (see § 5 and figure 7
b). In two other tests, for
 $c=0.55$
,
 ${\it\lambda}=1$
, and
 $\mathit{Ca}=0.05$
and 0.1, carried out to
 $t\sim 500$
to greatly reduce the statistical errors, the effect of
 $N$
(100 versus 200) on
 $\langle {\it\mu}_{pe}-1\rangle$
and
 $\langle N_{pe}\rangle$
did not exceed 0.2 % of
 $\langle {\it\mu}_{pe}-1\rangle$
. As a result of this analysis, the lines connecting the most reliable data in figures 9–11 are believed to accurately describe the extensiometric functions, resolution- and system-size-independent. Several physical trends in
 $\langle {\it\mu}_{pe}-1\rangle$
and
 $\langle N_{pe}\rangle$
(without the angular brackets in what follows) are interesting to discuss. The cross-difference
 $N_{pe}$
is generally small compared with the excess viscosity
 ${\it\mu}_{pe}-1$
, but can reach 24 % at the critical
 $\mathit{Ca}$
. For small enough
 $\mathit{Ca}$
, this cross-difference is negative (which is not a numerical artefact), and definitely remains negative in the limit
 $\mathit{Ca}\rightarrow 0$
. The excess viscosity
 ${\it\mu}_{pe}-1$
, as a function of
 $\mathit{Ca}$
, has a shallow minimum, so that the initial sharp tension thinning is followed by mild tension thickening (in contrast, a dilute emulsion only tension thickens in PE, Martin et al.
Reference Martin, Zinchenko and Davis2014). In the phenomenological theory of non-Newtonian ‘simple liquids’ (e.g. Astarita & Marucci Reference Astarita and Marucci1974), certain smoothness hypotheses are assumed and, as a result, the constitutive equation in the limit of slow flows is shown to be of Rivlin & Ericksen (Reference Rivlin and Ericksen1955) type. This general form was indeed confirmed by a small-deformation analysis for a single drop in linear flows (Schowalter et al.
Reference Schowalter, Chaffey and Brenner1968; Frankel & Acrivos Reference Frankel and Acrivos1970; Barthés-Biesel & Acrivos Reference Barthés-Biesel and Acrivos1973b
). If the Rivlin–Ericksen theory were applicable to our concentrated emulsions of deformable drops, then, in particular, the viscosity
 ${\it\mu}_{pe}$
would approach its limiting value at
 $\mathit{Ca}=0$
with an error of
 $O(\mathit{Ca}^{2})$
, and
 $N_{pe}$
would vanish as
 $O(\mathit{Ca})$
. Both phenomenological predictions, though, contradict our numerical results in figures 9–11, so a concentrated emulsion (of non-Brownian drops) is not a Rivlin–Ericksen fluid (in support of the views from paper I). This stark difference finds an easy explanation. In a flowing concentrated emulsion at
 $\mathit{Ca}\ll 1$
, drops are nearly in contact, and a small-deformation analysis of such close interactions (hardly feasible in practice because of its extreme complexity) would be a problem of singular perturbations. Therefore, unlike for single drops, a regular shape expansion in
 $\mathit{Ca}$
would no longer be possible, which should affect the behaviour of the rheological functions in the limit
 $\mathit{Ca}\ll 1$
. However, it would be prohibitively expensive to extend the convergent results in figures 9–11 to even smaller
 $\mathit{Ca}$
to further elucidate this issue.
7. Viscometric functions
A far more complex picture emerges in shear-flow simulations for concentrated emulsions, requiring a more difficult analysis.
7.1. Results for
 $c=0.45$

Figure 13(a–d) summarizes our calculations for the non-dimensional steady state viscometric functions – the excess shear viscosity
 $\langle {\it\mu}_{sh}-1\rangle$
and normal stress differences
 $\langle N_{1}^{sh}\rangle$
and
 $\langle N_{2}^{sh}\rangle$
(defined in (2.2a
)) at 45 % drop volume fractions and different viscosity ratios
 ${\it\lambda}$
. Resolutions
 $N_{\triangle }=2160{-}3840$
and system sizes
 $N=100{-}200$
were used, as specified in the caption. For
 ${\it\lambda}=10$
(figure 13
a) and
 $\mathit{Ca}=0.06{-}0.02$
, the runs were stopped at non-dimensional times (i.e. strains)
 $t=60{-}66$
, to average
 ${\it\mu}_{sh}-1$
,
 $N_{1}^{sh}$
and
 $N_{2}^{sh}$
with estimated absolute errors of 0.01–0.02. As an example of the difficulties of such
 ${\it\lambda}=10$
simulations, the run
 $N=100$
,
 $N_{\triangle }=3840$
for the smallest
 $\mathit{Ca}=0.02$
in figure 13(a) took 160 000 time steps with
 ${\approx}10$
BI iterations per time step. For the same
 ${\it\lambda}$
and higher
 $\mathit{Ca}=0.08$
, 0.10 and 0.16, the runs could not be continued beyond
 $t=46$
, 42 and 27 respectively, due to divergence of the BI iterations. Obviously, our variational technique (§ 3.1) of the double-layer near-singularity subtraction, although highly beneficial, may be not powerful enough for concentrated emulsions at extreme viscosity ratios and large deformations. These shorter runs still gave the averaging errors likely within 0.01–0.02, since the increase of
 $\mathit{Ca}$
reduces the statistical fluctuations. For all
 $\mathit{Ca}$
in figure 13(a), relaxation to the statistical steady state is fast, and cut-out times
 $t_{cut}=2{-}12$
sufficed. The results in figure 13(a) show significant shear thinning at the smallest
 $\mathit{Ca}$
. The first normal stress difference
 $\langle N_{1}^{sh}\rangle$
, smaller but comparable with
 $\langle {\it\mu}_{sh}-1\rangle$
, is also a strong function of
 $\mathit{Ca}$
when
 $\mathit{Ca}\ll 1$
, but it levels off at larger drop deformations. The negative second normal stress difference is small compared with
 $\langle {\it\mu}_{sh}-1\rangle$
.
Steady-state viscometric functions at
 $c=0.45$
for
 ${\it\lambda}=10$
(a), 3 (b), 1 (c) and 0.25 (d). Squares,
 $N_{\triangle }=2160$
; diamonds,
 $N_{\triangle }=2880$
; circles,
 $N_{\triangle }=3840$
. Solid symbols are for
 $N=100$
, open symbols are for
 $N=200$
. Small-size symbols are used for
 $N_{1}^{sh}$
to distinguish them from
 ${\it\mu}_{sh}-1$
values. Lines connect the data points selected for constitutive modelling in §§ 8 and 9.

When
 ${\it\lambda}=3$
(figure 13
b), relaxation to the statistical steady state remains fast for all capillary numbers considered. We used
 $t_{cut}=2.5{-}5$
to exclude the transient regimes and integrated to
 $t\sim 100{-}300$
in each run to reduce likely statistical errors in
 $\langle {\it\mu}_{sh}-1\rangle$
,
 $\langle N_{1}^{sh}\rangle$
and
 $\langle N_{2}^{sh}\rangle$
to
 $\pm 0.005{-}0.01$
. Divergence of BI iterations was never encountered at this
 ${\it\lambda}$
. At the smallest
 $\mathit{Ca}=0.02$
(with the strongest surface resolution effect), the results were obtained for both
 $N_{\triangle }=2160$
and 3840:
 $$\begin{eqnarray}\langle {\it\mu}_{sh}-1\rangle =2.539,\quad \langle N_{1}^{sh}\rangle =0.540,\quad \langle N_{2}^{sh}\rangle =-0.446\quad (N_{\triangle }=2160),\end{eqnarray}$$
 $$\begin{eqnarray}\langle {\it\mu}_{sh}-1\rangle =2.594,\quad \langle N_{1}^{sh}\rangle =0.534,\quad \langle N_{2}^{sh}\rangle =-0.449\quad (N_{\triangle }=3840).\end{eqnarray}$$
The deviations between
 $\langle {\it\mu}_{sh}-1\rangle$
are only 2 % and are negligible for
 $\langle N_{1}^{sh}\rangle$
and
 $\langle N_{2}^{sh}\rangle$
. The triangulation effects should be much smaller for the other
 $\mathit{Ca}$
values in figure 13(b). The qualitative trends of the viscometric functions are roughly the same as for
 ${\it\lambda}=10$
.
For
 ${\it\lambda}=1$
(figure 13
c), relaxation to the statistical steady state is fast (
 $t_{cut}=3{-}4$
) in all cases considered, except for
 $\mathit{Ca}=0.025$
,
 $N=200$
when
 $t_{cut}=45$
had to be excluded from the averaging. Even with fast relaxation in other runs, the statistical fluctuations grow dramatically as
 $\mathit{Ca}=0.025$
is approached. These are signs of configurational ‘phase transition’ to a partially ordered state. The final simulation times were
 $T\sim 100$
for all
 $\mathit{Ca}\geqslant 0.11$
, but 400–900 for all
 $\mathit{Ca}\leqslant 0.065$
. For the most difficult case
 $\mathit{Ca}=0.025$
, the resolution and system-size effects on the steady-state viscometric functions were explored:
 $$\begin{eqnarray}\displaystyle & \langle {\it\mu}_{sh}-1,N_{1}^{sh},N_{2}^{sh}\rangle =1.591,0.462,-0.269\quad (N=100,N_{\triangle }=2160), & \displaystyle\end{eqnarray}$$
 $$\begin{eqnarray}\displaystyle & \langle {\it\mu}_{sh}-1,N_{1}^{sh},N_{2}^{sh}\rangle =1.549,0.477,-0.226\quad (N=100,N_{\triangle }=3840), & \displaystyle\end{eqnarray}$$
 $$\begin{eqnarray}\displaystyle & \langle {\it\mu}_{sh}-1,N_{1}^{sh},N_{2}^{sh}\rangle =1.502,0.488,-0.233\quad (N=200,N_{\triangle }=3840). & \displaystyle\end{eqnarray}$$
 $\langle {\it\mu}_{sh}-1\rangle$
to the stress. The increased system-size sensitivity (cf. the extensiometric functions in § 6) is another sign of (incipient) phase transition, when a partially ordered emulsion finds it easier to flow with lower viscosity. This picture of eventual partial ordering is confirmed by the graphical analysis of drop configurations at
 $\mathit{Ca}=0.025$
,
 $N=200$
and large times, with visible layers of drops sliding past each other along
 $x_{1}$
, and an approximately hexagonal structure in the
 $x_{2}$
,
 $x_{3}$
plane. No signs of order were detected for
 $\mathit{Ca}\geqslant 0.0375$
.
The case of low viscosity ratio
 ${\it\lambda}=0.25$
(figure 13
d) stands out, by far, as the most difficult, since anomalies are observed in a wide range of capillary numbers. The simulation times were
 $T\sim 60{-}80$
for
 $\mathit{Ca}\geqslant 0.24$
, but much larger (
 $T=200{-}800$
) for all smaller
 $\mathit{Ca}$
. Rather fast relaxation (
 $t_{cut}\sim 10$
) to the statistical steady state for
 $\mathit{Ca}\geqslant 0.24$
dramatically slows down with
 $\mathit{Ca}$
reduced to 0.16, and it remains slow (
 $t_{cut}\sim 100{-}200$
) for all smaller
 $\mathit{Ca}$
. To illustrate this point, figure 14 presents the trajectories of
 ${\it\mu}_{sh}-1$
,
 $N_{1}^{sh}$
and
 $N_{2}^{sh}$
for (a)
 $\mathit{Ca}=0.16$
, (b)
 $\mathit{Ca}=0.12$
and (c,d)
 $\mathit{Ca}=0.1$
, all at
 $N=100$
and
 $N_{\triangle }=2160$
. For (c,d), two different well-mixed initial configurations of spherical drops were used; to avoid overlapping of data, the trajectories of
 ${\it\mu}_{sh}-1$
are shown as insets. By excluding the transient parts (
 $t_{cut}=125$
, 150, 230 and 100 for (a–d) respectively), excellent averaging quality is achieved, with the absolute errors in
 $\langle {\it\mu}_{sh}-1\rangle$
,
 $\langle N_{1}^{sh}\rangle$
and
 $\langle N_{2}^{sh}\rangle$
within 0.004 for (a), and within 0.002 for (b–d). However, the two
 $\mathit{Ca}=0.1$
runs clearly belong to two different ergodic classes. While the effect of the initial configuration on
 $\langle {\it\mu}_{sh}-1\rangle$
is small (0.675 in c versus 0.694 in d), it is more noticeable for
 $\langle N_{2}^{sh}\rangle$
(
 $-0.202$
versus
 $-0.253$
) and particularly large for
 $\langle N_{1}^{sh}\rangle$
(0.594 versus 0.747). In contrast, we did not find any appreciable effects of the initial drop configuration on the time averaging for
 $\mathit{Ca}=0.12$
and 0.16 at
 $N=100$
. Ergodic difficulties akin to those at
 $\mathit{Ca}=0.1$
are familiar in phase transition simulations for molecular systems by molecular dynamics or Monte Carlo methods. In principle, increasing the system size should merge separate ergodic classes inaccessible to each other, and make average results independent of the initial conditions. In practice, though, such system-size increase can make the averaging task much harder, if not insurmountable, since the system must now transition with enough frequency between metastable quasiergodic classes for good statistics. For
 $N=200$
, we successfully obtained steady-state viscometric functions at
 $\mathit{Ca}=0.04$
, 0.08, 0.1, 0.12, 0.14, 0.16 and 0.2 (although with larger statistical uncertainties of
 $\pm 0.01{-}0.02$
in
 $\langle N_{1}^{sh}\rangle$
and
 $\langle N_{2}^{sh}\rangle$
) to compare with those for
 $N=100$
. The only large differences were found for
 $\langle N_{1}^{sh}\rangle$
at
 $\mathit{Ca}=0.1$
and 0.12. From this analysis,
 $\mathit{Ca}\approx 0.1{-}0.12$
is believed to be the left end of the phase transition interval (while the right end is estimated as
 $\mathit{Ca}\approx 0.18$
). The excess viscosity
 $\langle {\it\mu}_{sh}-1\rangle$
in figure 13(d) is the least sensitive to
 $N$
and ergodic difficulties, and is reasonably accurate in the whole range of
 $0.04\leqslant \mathit{Ca}\leqslant 0.34$
considered. In particular, the kink of the viscosity curve near
 $\mathit{Ca}=0.18$
is not a numerical artefact.
Trajectories of the viscometric functions for
 $c=0.45$
,
 ${\it\lambda}=0.25$
,
 $N=100$
,
 $N_{\triangle }=2160$
at (a)
 $\mathit{Ca}=0.16$
, (b)
 $\mathit{Ca}=0.12$
and (c,d)
 $\mathit{Ca}=0.1$
.

Our results in figure 13 confirm the hypothesis (suggested in paper I, although with little support therein) that increasing
 ${\it\lambda}$
shifts the phase transition in the emulsion shear flow to smaller capillary numbers. Indeed, the related ergodic difficulties, so pronounced at
 ${\it\lambda}=0.25$
, are not felt at
 ${\it\lambda}=1$
until
 $\mathit{Ca}$
is reduced to 0.025, and these difficulties are absent altogether for
 ${\it\lambda}=3$
and 10 in the whole range of
 $\mathit{Ca}$
considered. One reason for this shift is the increase in the drop deformation in the flow with higher
 ${\it\lambda}$
(in the dilute limit, the trend would be the opposite for
 ${\it\lambda}>1$
). This larger deformation helps to eliminate geometrical blockages and merge different ergodic classes. Another reason is, presumably, more efficient mixing in the flow with higher
 ${\it\lambda}$
acting the same way.
Steady-state viscometric functions at
 $c=0.55$
for
 ${\it\lambda}=10$
(a), 3 (b), 1 (c) and 0.25 (d). Squares,
 $N_{\triangle }=2160$
; diamonds,
 $N_{\triangle }=2880$
; circles,
 $N_{\triangle }=3840$
. Solid symbols are for
 $N=100$
, open symbols are for
 $N=200$
. Plus symbols are for
 $N=400$
with
 $N_{\triangle }=2160$
. In (c),
 ${\it\mu}_{sh}-2$
is presented (instead of
 ${\it\mu}_{sh}-1$
) to avoid data overlapping. Small-size symbols are used for
 $N_{1}^{sh}$
to distinguish them from the viscosity values. Lines connect the data points selected for constitutive modelling in §§ 8 and 9.

The classical model of a liquid of molecules interacting as hard spheres is known to exhibit phase transition to the solid state in the interval
 $0.494\leqslant c\leqslant 0.545$
of volume fractions
 $c$
(e.g. Hoover & Ree Reference Hoover and Ree1968; Hansen & McDonald Reference Hansen and McDonald1976), with discontinuities of the first derivatives of pressure versus
 $c$
at the end points. The present case of dynamical phase transition in emulsion shear flow is certainly different. Still, it is unexpected that we observe phase-transitional behaviour at significantly smaller volume fraction
 $c=0.45$
without non-hydrodynamical attractive forces between the drops.
7.2. Results for
$c=0.55$

Our calculations of the steady-state non-dimensional viscometric functions
 $\langle {\it\mu}_{sh}\!-\!1\rangle$
,
 $\langle N_{1}^{sh}\rangle$
and
 $\langle N_{2}^{sh}\rangle$
at
 $c=0.55$
are summarized in figure 15(a–d). Again, at
 ${\it\lambda}=10$
(figure 15
a), proceeding to large simulation times is most prohibitive due to smaller time steps and a larger number of BI iterations. For this
 ${\it\lambda}$
, the runs
 $\mathit{Ca}=0.02$
and 0.04 were stopped at
 $t=63$
and 74 respectively. At larger
 $\mathit{Ca}=0.06$
and 0.08, though, eventual divergence of the BI iterations did not allow us to proceed beyond
 $t=35$
and 45 respectively, even with the resolution
 $N_{\triangle }=2880$
. Still, the absolute statistical errors for all the data in figure 15(a) are expected to be within
 $\pm 0.02$
. Relaxation to the statistical steady state was fast for all capillary numbers considered, and
 $t_{cut}=2{-}5$
was sufficient to exclude the transient stages from averaging. As well as for
 $c=0.45$
(figure 13
a), the
 ${\it\lambda}=10$
emulsion shows most pronounced shear thinning, but is also significantly more viscous with the drop volume fraction increased to 55 %.
Two trajectories of the excess shear viscosity
 ${\it\mu}_{sh}-1$
for
 $c=0.55$
,
 ${\it\lambda}=3$
,
 $\mathit{Ca}=0.02$
and
 $N=100$
, starting from the same random configuration of spherical drops. Thin line,
 $N_{\triangle }=2160$
; thick line, higher resolution
 $N_{\triangle }=3840$
.

For
 ${\it\lambda}=3$
(figure 15
b), the steady-state results could not be extended to
 $\mathit{Ca}=0.02$
for an unexpected reason. In figure 16, the trajectories of the excess viscosity
 ${\it\mu}_{sh}-1$
are shown for two simulations with
 $\mathit{Ca}=0.02$
and
 $N=100$
. Both simulations start from the same random configuration of spherical drops, the thin (blue) line being for
 $N_{\triangle }=2160$
, the thick (red) line for
 $N_{\triangle }=3840$
. The two runs appear to quickly reach statistical steady states and closely agree, on average, up to
 $t\sim 65$
. After
 $t\sim 70$
, though, the lower-resolution run
 $N_{\triangle }=2160$
abruptly settles to a different state with much lower viscosity, while the run
 $N_{\triangle }=3840$
remains at the higher viscosity. We believe that the only explanation for this erratic behaviour and the unusually strong effect of the resolution is that the conditions are on the verge of phase transition, and a small numerical perturbation (change in
 $N_{\triangle }$
) brings the system to a different quasiergodic class after a long time. Graphical analysis of drop configurations confirms that the
 $N_{\triangle }=2160$
run settles to a partially ordered state, unlike the other run. To make sure that such difficulties (compromising time averaging) do not appear for larger
 $\mathit{Ca}$
in figure 15(b), we performed detailed testing of the effects of the initial conditions and programme parameters on the steady-state functions
 $\langle {\it\mu}_{sh}-1\rangle$
,
 $\langle N_{1}^{sh}\rangle$
,
 $\langle N_{2}^{sh}\rangle$
at
 $\mathit{Ca}=0.04$
. Two-level behaviour (akin to that in figure 16 for
 $N_{\triangle }=2160$
) was never observed in these test runs; the simulated times were
 $T=230{-}470$
, with always fast relaxation (
 $t_{cut}=4$
) to the statistical steady state. For one initial drop configuration, the
 $N_{\triangle }=2160$
results (solid squares in figure 15
b at
 $\mathit{Ca}=0.04$
) are (3.254, 1.745,
 $-0.817$
). Repeating the run with
 $N_{\triangle }=3840$
gave (3.307, 1.793,
 $-0.879$
) (solid circles in figure 15
b). Tightening the ‘precision’
 ${\it\varepsilon}$
to
 $10^{-4}a$
in the
 $N_{\triangle }=2160$
run yielded (3.267, 1.733,
 $-0.852$
). Coarsening the barrier
 ${\it\delta}_{min}$
(which controls drop overlap, see § 4) to
 $0.003a$
resulted in (3.271, 1.743,
 $-0.846$
). Finally, replacing the initial drop configuration in the
 $N_{\triangle }=2160$
run gave (3.269, 1.770,
 $-0.832$
). The deviations from the base results (shown by solid squares in figure 15
b) are within 1.8 % of
 $\langle {\it\mu}_{sh}-1\rangle$
, the main drop-phase contribution to the stress, and often much less. Therefore (unlike for
 $\mathit{Ca}=0.02$
), the steady-state results for
 $\mathit{Ca}\geqslant 0.04$
are stable to the programme parameters and do not suffer from ergodic difficulties. For
 $\mathit{Ca}\geqslant 0.06$
, shorter simulation times
 $T\sim 110{-}160$
were sufficient (with
 $t_{cut}=4{-}5$
). Although the results in figure 15(b) (and 15
a) are for
 $N=100$
only, any significant
 $N$
dependence is not suspect; the latter could only result from phase transition and related ergodic difficulties.
The trajectories of the viscometric functions
 ${\it\mu}_{sh}$
,
 $N_{1}^{sh}$
and
 $-N_{2}^{sh}$
(top to bottom on each graph) for
 $c=0.55$
,
 ${\it\lambda}=1$
,
 $N=200$
and
 $N_{\triangle }=2160$
; (a)
 $\mathit{Ca}=0.075$
, (b)
 $\mathit{Ca}=0.07$
, (c)
 $\mathit{Ca}=0.06$
, (d)
 $\mathit{Ca}=0.05$
.

When
 ${\it\lambda}$
is decreased to 1 (figure 15
c), the phase transition is shifted to much higher
 $\mathit{Ca}$
; the ergodic difficulties in the transition range are severe and appear to be insurmountable, even when using
 $N=400$
drops. Figure 17(a–d) shows the trajectories of
 ${\it\mu}_{sh}(t)$
,
 $N_{1}^{sh}(t)$
and
 $-N_{2}^{sh}(t)$
at
 $N=200$
and
 $N_{\triangle }=2160$
, when
 $\mathit{Ca}$
is progressively decreased from (a) 0.075 to (d) 0.05. Here, we plot the full viscosity (instead of
 ${\it\mu}_{sh}-1$
) to avoid data overlapping. Fast approach to the statistical steady state at
 $\mathit{Ca}=0.075~(t_{cut}=4)$
changes to very slow relaxation (
 $t_{cut}\sim 1000{-}1200$
) at
 $\mathit{Ca}=0.06$
and 0.07. Relaxation is still slow (
 $t_{cut}=160$
), although not as slow, at
 $\mathit{Ca}=0.05$
. The interval
 $\mathit{Ca}\approx 0.06{-}0.07$
is therefore believed to be phase-transitional. For
 $\mathit{Ca}\geqslant 0.075$
, very good averaging quality is achieved with simulation times
 $T\sim 200{-}600$
. The results are well convergent with the number of drops
 $N=100{-}200$
when
 $\mathit{Ca}\geqslant 0.08$
(as tested for
 $\mathit{Ca}=0.08{-}0.11$
), but the system size has to be increased to
 $N=200{-}400$
at
 $\mathit{Ca}=0.075$
for convergence. For
 $\mathit{Ca}\leqslant 0.07$
, all the runs were extended to much larger times for adequate averaging, but the results still show a strong dependence on the initial drop configuration (as tested for
 $N=100$
, cf. solid squares in figure 15
c) and on the system size
 $N=100{-}400$
. Therefore, only the
 $\mathit{Ca}\geqslant 0.075$
portion of the results in figure 15(c) is trusted as unambiguous and is used for constitutive modelling in §§ 8 and 9.
It is very instructive to compare the transition from fast to slow relaxation in figure 17 with figure 12 for PE at the same
 $c=0.55$
and
 ${\it\lambda}=1$
. For shear flow (figure 17), we observe this transition to occur when the average drop length
 $\langle L_{d}\rangle$
in the steady state (correlating with the drop deformation and the degree of configurational arrest) decreases from
 $2.42a$
at
 $\mathit{Ca}=0.075$
to
 $2.36a$
at
 $\mathit{Ca}=0.07$
. In contrast, in the PE simulations (figure 12),
 $\langle L_{d}\rangle$
progressively decreases from
 $2.42a$
at
 $\mathit{Ca}=0.06a$
to much smaller,
 $2.15a$
, at
 $\mathit{Ca}=0.02$
, but the relaxation remains fast. This comparison reveals a profound difference between the two types of flow: in PE, phase transition does not occur regardless of how small
 $\mathit{Ca}$
is, at least for drop volume fractions
 $c\leqslant 0.55$
. The same is true for other viscosity ratios
 ${\it\lambda}$
.
The small viscosity ratio
 ${\it\lambda}=0.25$
at
 $c=0.55$
(figure 15
d) is another very challenging case in the shear-flow simulations. The transition from fast (
 $t_{cut}\sim 10$
) to slow (
 $t_{cut}\sim 100$
) relaxation is observed when
 $\mathit{Ca}\approx 0.19{-}0.22$
, which estimates the right end of the phase transition interval. The simulations for figure 15(d) were performed to
 $T=72{-}75$
at
 $\mathit{Ca}\geqslant 0.25$
, and to
 $T\sim 200{-}400$
at each smaller
 $\mathit{Ca}\leqslant 0.22$
. There is no doubt in the accuracy of all steady-state viscometric functions for
 $\mathit{Ca}>0.22$
. In the transition range, though, strong effects of the initial drop configuration and/or the system size
 $N=100{-}200$
on the average normal stress differences (especially
 $\langle N_{1}^{sh}\rangle$
) are observed. In contrast, the excess viscosity
 $\langle {\it\mu}_{sh}-1\rangle$
is almost insensitive to these difficulties and is well convergent even in the transition range, at least for
 $\mathit{Ca}\geqslant 0.07$
. Again, the viscosity curve has a kink at
 $\mathit{Ca}\approx 0.19$
, near the upper end of the transition range.
Since the flow-induced partially ordered drop arrangement has an approximately hexagonal structure in the (
 $x_{2}$
,
 $x_{3}$
) plane, it would seem advantageous to adapt the shape of the periodic cell to this structure. Such algorithm modification, though, was not attempted in the present work for two reasons. The present version of the code heavily exploits the symmetry properties of the periodic Green function
 $\unicode[STIX]{x1D642}(\boldsymbol{r})$
about the plane
 $r_{3}=0$
, so an extension to an arbitrary geometry, with
 $\boldsymbol{e}_{2}(t)$
non-orthogonal to
 $\boldsymbol{e}_{3}$
, would not be straightforward. More importantly, while such an algorithm adaptation can alleviate ergodic and convergence difficulties in the simulations well below the transition point to order, it would not help near the transition with the coexistence of ordered and disordered states. Nor would such an adaptation help to identify the onset of transition. As an example, figure 18(a) shows a well-ordered flow achieved at a large strain
 $t=837$
in the simulation with
 $c=0.55$
,
 ${\it\lambda}=1$
,
 $N=400$
and
 $\mathit{Ca}=0.05$
. For
 $\mathit{Ca}=0.06$
, still below the right end of the transition interval, the emulsion is not nearly as ordered (figure 18
b).
Snapshots from the shear-flow simulations at
 $c=0.55$
,
 ${\it\lambda}=1$
,
 $N=400$
and
 $N_{\triangle }=2160$
with (a)
 $\mathit{Ca}=0.05$
,
 $t=837$
and (b)
 $\mathit{Ca}=0.06$
,
 $t=1155$
. The centres of
 $N$
independent drops have been mapped into the cube
 $(0,1)^{3}$
; the same view is shown in (a) and (b).

7.3. The intermediate case
$c=0.5$

At the intermediate volume fraction of
 $c=0.5$
, we have studied the steady-state viscometric functions for
 ${\it\lambda}=1$
only (figure 19). For moderate
 $\mathit{Ca}\geqslant 0.1$
, simulation times
 $T=80{-}190$
were sufficient to provide high averaging accuracy. As
 $\mathit{Ca}$
is decreased to 0.06–0.07, the statistical fluctuations sharply grow, necessitating much larger simulation times (up to
 $T\sim 3000$
), but there is still no clear transient regime, so we used
 $t_{cut}=3{-}5$
for all
 $0.06\leqslant \mathit{Ca}\leqslant 0.18$
. For all
 $\mathit{Ca}\geqslant 0.07$
, the results are proven to be practically system-size-independent (compare the solid squares at
 $N=100$
with the open squares at
 $N=200$
at
 $\mathit{Ca}=0.07$
, 0.075 and 0.1; indistinguishable for
 $\langle N_{2}^{sh}\rangle$
). At
 $\mathit{Ca}=0.06$
, the agreement between the
 $N=100$
and
 $N=200$
results is less favourable for
 $\langle N_{1}^{sh}\rangle$
and
 $\langle N_{2}^{sh}\rangle$
. At this
 $\mathit{Ca}$
, there is also a comparable and modest resolution effect when
 $N_{\triangle }$
is increased from 2160 (solid squares) to 3840 (solid circles). Pronounced slow relaxation to the statistical steady state is first observed when
 $\mathit{Ca}$
is decreased to 0.05. In the four runs for this
 $\mathit{Ca}$
, the simulation times were
 $T=800{-}1900$
with cutoffs
 $t_{cut}=160{-}400$
. Starting the
 $N=100$
,
 $N_{\triangle }=2160$
runs from two different initial configurations of spherical drops gave practically indistinguishable results. Increasing the resolution to
 $N_{\triangle }=3840$
(solid circles) increases the excess viscosity (from 2.55 to 2.58) and the magnitude of
 $\langle N_{2}^{sh}\rangle$
(from 0.32 to 0.36), but reduces
 $\langle N_{1}^{sh}\rangle$
(from 1.10 to 1.03). Increasing the system size to
 $N=200$
(open squares) has the opposite effect of slightly reducing the viscosity (which we associate with the phase-transitional behaviour) and further reducing
 $\langle N_{1}^{sh}\rangle$
; the second normal stress difference is not affected.
Steady-state viscometric functions at
 $c=0.5$
and
 ${\it\lambda}=1$
. Squares,
 $N_{\triangle }=2160$
; circles,
 $N_{\triangle }=3840$
. Solid symbols are for
 $N=100$
, open symbols are for
 $N=200$
. Plus symbols are for
 $N=100$
with
 $N_{\triangle }=6000$
. Small-size symbols are used for
 $N_{1}^{sh}$
. Lines connect the data selected for constitutive modelling in §§ 8 and 9.

In the three most difficult runs at
 $\mathit{Ca}=0.025$
, (i)
 $N=100$
,
 $N_{\triangle }=3840$
, (ii)
 $N=200$
,
 $N_{\triangle }=3840$
and (iii)
 $N=100$
,
 $N_{\triangle }=6000$
, our simulation times were limited to
 $T=900$
, 500 and 400 respectively, with still acceptable quality of averaging. There are only modest variations, if any, in the excess viscosity
 $\langle {\it\mu}_{sh}-1\rangle$
between the runs, but serious misconvergence in the normal stress differences.
Overall, the accuracy of our viscosity calculations in figure 19 is sufficient to state the existence of a shallow local minimum of
 $\langle {\it\mu}_{sh}-1\rangle$
versus
 $\mathit{Ca}$
near
 $\mathit{Ca}\approx 0.05{-}0.06$
due to phase transition, followed by increase in the viscosity as the capillary number is further reduced. It is more difficult to argue about the behaviour of
 $\langle N_{1}^{sh}\rangle$
in the transition region due to larger uncertainties. Only the
 $\mathit{Ca}\geqslant 0.07$
part of the results from figure 19 is used in the constitutive modelling of §§ 8 and 9.
7.4. Comparison with paper I and other work
Paper I was the first to present large-scale shear-flow simulations and steady-state viscometric functions for concentrated emulsions. In addition to the results for
 $c\leqslant 0.4$
(not relevant to the present work),
 $\langle {\it\mu}_{sh}\rangle$
,
 $\langle N_{1}^{sh}\rangle$
and
 $\langle N_{2}^{sh}\rangle$
were reported versus
 $\mathit{Ca}$
for (i)
 $c=0.45$
and 0.5 at
 ${\it\lambda}=1$
and (ii)
 $c=0.45$
at
 ${\it\lambda}=3$
. The viscosity values were also reported versus
 $\mathit{Ca}$
for
 $c=0.55$
at
 ${\it\lambda}=1$
and 3, but it was not possible to even estimate the steady-state normal stress differences in either case due to the short simulation times and large statistical fluctuations.
In addition to substantially new calculations for the difficult viscosity ratios of
 ${\it\lambda}=0.25$
and 10 at
 $c=0.45$
and 0.55, the present results for
 ${\it\lambda}=1$
and 3 stem from a far more systematic analysis, with much larger simulated strains for averaging, finer surface triangulations and (often) larger system size. In paper I with
 $N\sim 100$
, the strains were limited to 25–45 for
 ${\it\lambda}=1$
and only
 ${\sim}15{-}25$
for
 ${\it\lambda}=3$
, while they are at least of the order of hundreds for all
 ${\it\lambda}$
(and even thousands for
 ${\it\lambda}=1$
) in the present work. For
 ${\it\lambda}=3$
, the surface resolutions in paper I were limited to
 $N_{\triangle }\leqslant 1500$
, compared with 2160–3840 used herein for all
 ${\it\lambda}\neq 1$
. Finally, in the present work the maximum system size was extended to
 $N=400$
for matching, and to
 $N=200$
for contrast viscosities, twice as large as in paper I.
For moderate
 $\mathit{Ca}$
(roughly when the average drop length
 $\langle L_{d}\rangle$
exceeds
 $2.6a$
), the present results for
 ${\it\lambda}=1$
and 3 are fully consistent with those of paper I, within the statistical errors therein. In the most difficult range of small
 $\mathit{Ca}$
(and
 $c\geqslant 0.45$
), the results of paper I somewhat overpredict the first normal stress difference and (when
 ${\it\lambda}=1$
) the shear viscosity. The reason is twofold. First, Zinchenko & Davis (Reference Zinchenko, Davis and Petsev2004) used the same code as in paper I and in the same limited strain range, but with ultrahigh resolutions
 $N_{\triangle }=6000{-}8640$
to recalculate the
 ${\it\lambda}=1$
shear-flow results for
 $c=0.45{-}0.5$
at
 $\mathit{Ca}=0.025$
and 0.05. This change results, indeed, in noticeably smaller
 $\langle {\it\mu}_{sh}\rangle$
and
 $\langle N_{1}^{sh}\rangle$
. Presumably, tiny surface overlaps (allowed by the code of paper I) favour some drop clustering (especially at small
 $\mathit{Ca}$
and
 ${\it\lambda}=1$
versus
 ${\it\lambda}=3$
), leading to higher emulsion viscosity and
 $\langle N_{1}^{sh}\rangle$
, unless this artefact is eliminated by ultrahigh surface resolution. The present code, with explicit surface overlap control, achieves much faster convergence for the viscometric functions with respect to surface triangulations at small
 $\mathit{Ca}$
. Second, the corrected viscosity values from Zinchenko & Davis (Reference Zinchenko, Davis and Petsev2004) are still slightly higher than the more accurate results herein (most noticeably, at
 $c=0.5$
,
 ${\it\lambda}=1$
and
 $\mathit{Ca}=0.025$
, their work gives
 $\langle {\it\mu}_{sh}\rangle =3.07$
versus the narrow range of 2.69–2.77 from our figure 19). This remaining discrepancy is obviously due to the relatively short simulation times in paper I and in Zinchenko & Davis (Reference Zinchenko, Davis and Petsev2004), so that averaging was, in fact, performed over metastable levels, well before the emulsion viscosity settles down to the true statistical steady state. Accordingly, the phase-transitional behaviour at
 $c=0.5$
and
 ${\it\lambda}=1$
could not be detected in those studies.
At
 $c=0.55$
and
 ${\it\lambda}=1$
, the viscosity calculations of paper I are indicative of phase transition, but the results for
 $\mathit{Ca}\leqslant 0.05$
suffer again from limited triangulations and statistical errors due to short simulation times. For
 $\mathit{Ca}\geqslant 0.1$
, good agreement with the present work is observed in the viscosity values, but paper I does not give the normal stress differences to compare with.
All of our shear-flow simulations in this section are for essentially subcritical conditions, away from drop breakup. When combining the extensiometric and viscometric functions for general constitutive modelling (as suggested in the next section), early breakup in planar-extensional flow is the limiting factor (except for small
 ${\it\lambda}$
), which was the main reason not to try extending the present shear-flow simulations to breakup. Incidentally, the results of paper I for
 ${\it\lambda}=1$
and 3 come closer to breakup conditions, and they do not suffer in that range from limited triangulations or short simulation times.
8. A generalized Oldroyd model for constitutive modelling
A principal question is whether the rheological functions obtained for steady simple shear and PE can help in general constitutive modelling; that is to predict, with some accuracy, the stress tensor in (large-strain) flows with an arbitrary history of deformation of a material element. Knowing such a constitutive equation would allow the solution of boundary-value problems of non-Newtonian hydrodynamics in complex geometries of technological interest. Obviously, the information from shear flows only (steady or oscillatory) would not suffice for this purpose. In Martin et al. (Reference Martin, Zinchenko and Davis2014), we suggested using a generalized Oldroyd model with five variable material parameters, found from simultaneously fitting the model to viscometric (in steady simple shear) and extensiometric (in PE) functions at arbitrary flow intensities. These parameters are postulated to depend on one carefully chosen instantaneous flow invariant. The approach was validated in a broad class of kinematics for a dilute emulsion of single deformable drops. For this particular system, the BI method was used to both prepare the viscometric and extensiometric functions at arbitrary
 $\mathit{Ca}$
and provide exact results for the drop rheological response in a flow with arbitrary kinematics. Although drop breakup is a limitation, this approach was found to give, for finite drop deformation, far more accurate results than small-
 $\mathit{Ca}$
expansions.
Below, we are trying to explore (although not as comprehensively) this new method of constitutive modelling in application to flowing concentrated emulsions. It is convenient, until otherwise stated, to return to dimensional variables. The macroscopic instantaneous deviatoric stress
 $\unicode[STIX]{x1D64F}$
for a material element of an emulsion can be written as
 $\unicode[STIX]{x1D64F}=2{\it\mu}_{e}\unicode[STIX]{x1D640}+{\bf\tau}^{d}$
to single out the Newtonian continuous-phase contribution. Unlike the intrinsic stress
 ${\bf\tau}^{d}$
in Martin et al. (Reference Martin, Zinchenko and Davis2014), our excess stress (drop-phase contribution)
 ${\bf\tau}^{d}$
is not normalized by the drop-phase volume fraction. Instead of
 $\boldsymbol{u}_{\infty }$
and
 $\unicode[STIX]{x1D640}_{\infty }$
(cf. § 2), we use here simpler notations
 $\boldsymbol{v}$
and
 $\unicode[STIX]{x1D640}=(\boldsymbol{{\rm\nabla}}\boldsymbol{v}+\boldsymbol{{\rm\nabla}}^{\text{T}}\boldsymbol{v})/2$
for the local macroscopic emulsion velocity
 $\boldsymbol{v}$
and the corresponding rate-of-strain tensor. The Oldroyd model can be formulated either for the full stress
 $\unicode[STIX]{x1D64F}$
or, equivalently, for the excess part:
 $$\begin{eqnarray}\displaystyle & & \displaystyle \displaystyle \left(\unicode[STIX]{x1D644}+{\it\lambda}_{1}\frac{\mathscr{D}}{\mathscr{D}t}\right){\bf\tau}^{d}-{\it\mu}_{1}({\bf\tau}^{d}\boldsymbol{\cdot }\unicode[STIX]{x1D640}+\unicode[STIX]{x1D640}\boldsymbol{\cdot }{\bf\tau}^{d})+\frac{2}{3}{\it\mu}_{1}({\bf\tau}^{d}\boldsymbol{ : }\unicode[STIX]{x1D640})\unicode[STIX]{x1D644}\nonumber\\ \displaystyle & & \displaystyle \quad =2{\it\eta}\left[\unicode[STIX]{x1D640}+{\it\lambda}_{2}\frac{\mathscr{D}\unicode[STIX]{x1D640}}{\mathscr{D}t}-2{\it\mu}_{2}\unicode[STIX]{x1D640}^{2}+\frac{2}{3}{\it\mu}_{2}(\unicode[STIX]{x1D640}\boldsymbol{ : }\unicode[STIX]{x1D640})\unicode[STIX]{x1D644}\right].\end{eqnarray}$$
The Jaumann or corotational derivative
 $\mathscr{D}/\mathscr{D}t$
can be calculated in fixed Cartesian axes for any tensor
 $\unicode[STIX]{x1D63C}$
as
 $$\begin{eqnarray}\left(\frac{\mathscr{D}\unicode[STIX]{x1D63C}}{\mathscr{D}t}\right)_{ij}=\left(\frac{\text{D}\unicode[STIX]{x1D63C}}{\text{D}t}\right)_{ij}+\frac{1}{2}(\boldsymbol{{\rm\nabla}}_{i}v_{k}-\boldsymbol{{\rm\nabla}}_{k}v_{i})A_{kj}+\frac{1}{2}(\boldsymbol{{\rm\nabla}}_{j}v_{k}-\boldsymbol{{\rm\nabla}}_{k}v_{j})A_{ik},\end{eqnarray}$$
where
 $\text{D}/\text{D}t$
is the material derivative. Equation (8.1) can be derived from a very general multiparameter phenomenological model of Hand (Reference Hand1962), if his coefficients
 ${\it\beta}_{i}$
for
 $i\geqslant 3$
,
 ${\it\alpha}_{j}$
for
 $j\geqslant 6$
and
 ${\it\alpha}_{3}$
are all set to zero. With these restrictions, the structural tensor
 $\unicode[STIX]{x1D656}$
in Hand’s model is linearly connected to
 $\unicode[STIX]{x1D640}$
and
 $\unicode[STIX]{x1D64F}$
, and Hand’s evolution equation for
 $\unicode[STIX]{x1D656}$
results in (8.1). Oldroyd (Reference Oldroyd1958) originally postulated an eight-parameter model (with constant coefficients), which reduces to (8.1) if formulated for the deviatoric excess stress
 ${\bf\tau}^{d}$
(i.e. with
 $\unicode[STIX]{x1D644}\boldsymbol{ : }{\bf\tau}^{d}=0$
). However, to match the model (8.1), precisely and unambiguously, to the calculated viscometric and extensiometric functions at arbitrary flow intensities, the material parameters
 ${\it\lambda}_{1}$
,
 ${\it\mu}_{1}$
,
 ${\it\lambda}_{2}$
,
 ${\it\mu}_{2}$
and
 ${\it\eta}$
must be allowed to be functions of one instantaneous flow invariant. In the dilute case, Martin et al. (Reference Martin, Zinchenko and Davis2014) explored two choices for this invariant: (i) the second invariant
 $\unicode[STIX]{x1D640}\boldsymbol{ : }\unicode[STIX]{x1D640}$
of the rate-of-strain tensor and (ii) the excess energy dissipation rate
 ${\bf\tau}^{d}\boldsymbol{ : }\unicode[STIX]{x1D640}$
. Both versions, of course, satisfy the objectivity principle (and do not contradict Hand’s model), but the less obvious choice (ii) was found to give a significantly more accurate and less restrictive model. Accordingly, here we follow the choice (ii) (which makes the model (8.1) implicit and only quasilinear in
 ${\bf\tau}^{d}$
).
In the notations of § 2, the dimensional Oldroyd coefficients
 ${\it\lambda}_{i}$
and
 ${\it\mu}_{i}$
are scaled with
 ${\it\mu}_{e}a_{o}/{\it\sigma}$
, while
 ${\it\eta}$
is scaled with
 ${\it\mu}_{e}$
; the non-dimensional argument of all of these functions is
 ${\it\zeta}=a_{o}({\it\mu}_{e}{\bf\tau}^{d}\boldsymbol{ : }\unicode[STIX]{x1D640})^{1/2}/{\it\sigma}$
. Applying the model (8.1) to the shear flow (2.1a
) and using the definitions (2.2a
) of the viscometric functions, three non-dimensional equations are obtained:
 $$\begin{eqnarray}\displaystyle & \displaystyle {\it\mu}_{sh}-1=\frac{\displaystyle {\it\eta}\left[1+\mathit{Ca}_{sh}^{2}\left({\it\lambda}_{1}{\it\lambda}_{2}-{\textstyle \frac{1}{3}}{\it\mu}_{1}{\it\mu}_{2}\right)\right]}{\displaystyle 1+\mathit{Ca}_{sh}^{2}\left({\it\lambda}_{1}^{2}-{\textstyle \frac{1}{3}}{\it\mu}_{1}^{2}\right)}, & \displaystyle\end{eqnarray}$$
 $$\begin{eqnarray}\displaystyle & \displaystyle N_{1}^{sh}=\frac{\displaystyle {\it\eta}\mathit{Ca}_{sh}\left[2({\it\lambda}_{1}-{\it\lambda}_{2})+{\textstyle \frac{2}{3}}{\it\mu}_{1}\mathit{Ca}_{sh}^{2}({\it\mu}_{1}{\it\lambda}_{2}-{\it\mu}_{2}{\it\lambda}_{1})\right]}{\displaystyle 1+\mathit{Ca}_{sh}^{2}\left({\it\lambda}_{1}^{2}-{\textstyle \frac{1}{3}}{\it\mu}_{1}^{2}\right)}, & \displaystyle\end{eqnarray}$$
 $$\begin{eqnarray}\displaystyle & \displaystyle N_{2}^{sh}=\frac{\displaystyle {\it\eta}\mathit{Ca}_{sh}\left[{\it\mu}_{1}-{\it\mu}_{2}+{\it\lambda}_{2}-{\it\lambda}_{1}+{\textstyle \frac{1}{3}}\mathit{Ca}_{sh}^{2}(3{\it\lambda}_{1}-{\it\mu}_{1})({\it\mu}_{1}{\it\lambda}_{2}-{\it\mu}_{2}{\it\lambda}_{1})\right]}{\displaystyle 1+\mathit{Ca}_{sh}^{2}\left({\it\lambda}_{1}^{2}-{\textstyle \frac{1}{3}}{\it\mu}_{1}^{2}\right)}. & \displaystyle\end{eqnarray}$$
 $\mathit{Ca}_{sh}=\mathit{Ca}$
is defined by (2.1a
), but we add the subscript
 $sh$
to stress its connection to the shear flow. Without confusion,
 ${\it\mu}_{sh}-1$
,
 $N_{1}^{sh}$
and
 $N_{2}^{sh}$
are used here and below for the steady-state macroscopic quantities (instead of
 $\langle {\it\mu}_{sh}-1\rangle$
, etc.). In principle, for any given
 $c$
and the viscosity ratio
 ${\it\lambda}$
, the left-hand sides of (8.3a
)–(8.3c
) are known functions of
 $\mathit{Ca}_{sh}$
through shear-flow simulations (§ 7). The non-dimensional Oldroyd coefficients
 ${\it\lambda}_{i}$
,
 ${\it\mu}_{i}$
and
 ${\it\eta}$
on the right-hand sides also depend on
 $\mathit{Ca}_{sh}$
through
 ${\it\zeta}=\mathit{Ca}_{sh}\sqrt{{\it\mu}_{sh}-1}$
.
Likewise, by applying (8.1) to PE (2.1b ) and using the definitions (2.2b ) of the extensiometric functions we obtain two more non-dimensional equations:
 $$\begin{eqnarray}\displaystyle & \displaystyle {\it\mu}_{pe}-1=\frac{\displaystyle {\it\eta}\left(1-{\textstyle \frac{1}{3}}{\it\mu}_{1}{\it\mu}_{2}\mathit{Ca}_{pe}^{2}\right)}{\displaystyle 1-{\textstyle \frac{1}{3}}{\it\mu}_{1}^{2}\mathit{Ca}_{pe}^{2}}, & \displaystyle\end{eqnarray}$$
 $$\begin{eqnarray}\displaystyle & \displaystyle N_{pe}=\frac{{\it\eta}\mathit{Ca}_{pe}({\it\mu}_{1}-{\it\mu}_{2})}{\displaystyle 1-{\textstyle \frac{1}{3}}{\it\mu}_{1}^{2}\mathit{Ca}_{pe}^{2}}. & \displaystyle\end{eqnarray}$$
 $\mathit{Ca}_{pe}$
is given by (2.1b
). The left-hand sides of (8.4a,b
) are provided versus
 $\mathit{Ca}_{pe}$
by the PE simulations (§ 6), while the Oldroyd coefficients on the right-hand sides depend on
 $\mathit{Ca}_{pe}$
through
 ${\it\zeta}=\mathit{Ca}_{pe}\sqrt{{\it\mu}_{pe}-1}$
. The algebra (8.3)–(8.4) is the same as in the dilute case (Martin et al.
Reference Martin, Zinchenko and Davis2014), except that we use
 ${\it\mu}_{sh}-1$
and
 ${\it\mu}_{pe}-1$
for the excess (instead of intrinsic) viscosities, and our definition (2.2b
) of the cross-difference
 $N_{pe}$
has an additional factor of four in the denominator.
To be able to use (8.3a–c
) and (8.4a,b
) simultaneously, the argument
 ${\it\zeta}$
must be the same for both flows, which gives the mapping between
 $\mathit{Ca}_{sh}$
and
 $\mathit{Ca}_{pe}$
:
 $$\begin{eqnarray}\mathit{Ca}_{sh}\sqrt{{\it\mu}_{sh}-1}=\mathit{Ca}_{pe}\sqrt{{\it\mu}_{pe}-1}={\it\zeta}.\end{eqnarray}$$
Our numerical procedure for determining the Oldroyd coefficients works as follows. For every
 ${\it\zeta}\in [{\it\zeta}_{min},{\it\zeta}_{max}]$
(see below for the choices of
 ${\it\zeta}_{min}$
and
 ${\it\zeta}_{max}$
), the corresponding values of
 $\mathit{Ca}_{sh}$
and
 $\mathit{Ca}_{pe}$
are found from (8.5) using local quadratic interpolations/splines for
 $\mathit{Ca}_{sh}\sqrt{{\it\mu}_{sh}-1}$
and
 $\mathit{Ca}_{pe}\sqrt{{\it\mu}_{pe}-1}$
versus
 $\mathit{Ca}_{sh}$
and
 $\mathit{Ca}_{pe}$
respectively. After that, the system (8.3) and (8.4), with the left-hand sides interpolated from our data for the viscometric and extensiometric functions (§§ 6 and 7), may be regarded as five nonlinear equations for five unknowns,
 ${\it\lambda}_{1}$
,
 ${\it\mu}_{1}$
,
 ${\it\lambda}_{2}$
,
 ${\it\mu}_{2}$
and
 ${\it\eta}$
. It was easy to use a large number
 $({\sim}10^{3}{-}10^{4})$
of steepest descent iterations to localize the solution, followed by just a few necessary Newton–Raphson iterations. In the order of descending
 ${\it\zeta}$
, the initial guess is taken from the preceding converged solution (and arbitrary at
 ${\it\zeta}={\it\zeta}_{max}$
). Importantly, whenever iterations of (8.3) and (8.4) converge, the solution was found to be independent of an initial guess. To capture the complex behaviour of the Oldroyd coefficients and successfully reach small
 ${\it\zeta}$
(when appropriate, see below), the step in
 ${\it\zeta}$
must be very small, notwithstanding our scarce data in figures 9–11, 13, 15 and 19.
The values of
 ${\it\zeta}$
are naturally limited by our tabulated ranges for
 $\mathit{Ca}_{sh}\sqrt{{\it\mu}_{sh}-1}$
and
 $\mathit{Ca}_{pe}\sqrt{{\it\mu}_{pe}-1}$
. An additional limitation on
 ${\it\zeta}_{min}$
is that the corresponding
 $\mathit{Ca}_{sh}$
must exceed the phase transition range (if any). Precise calculations of viscometric functions (especially
 $N_{1}^{sh}$
) are extremely difficult, if not impossible, in that range (§ 7). Moreover, the exact shear-flow results would still exhibit the inherent non-smooth kinked behaviour due to phase transition. It may be questionable to combine such data with smooth extensiometric functions (not suffering from phase transition) for a general constitutive modelling.
As in the dilute case (Martin et al.
Reference Martin, Zinchenko and Davis2014), for
 ${\it\lambda}=0.25$
, an additional unfavourable factor limiting
 ${\it\zeta}_{max}$
is the non-monotonic behaviour of
 ${\it\zeta}(\mathit{Ca}_{sh})$
due to steep shear thinning at large
 $\mathit{Ca}_{sh}$
. Namely,
 ${\it\zeta}(\mathit{Ca}_{sh})$
reaches a maximum while the corresponding
 $\mathit{Ca}_{pe}$
is still subcritical. We did not include
 ${\it\lambda}=0.25$
in the constitutive modelling discussed below. For all other
 ${\it\lambda}\geqslant 1$
,
 ${\it\zeta}_{max}$
corresponds to the critical breakup condition in PE. We note finally that, even in the absence of the phase transition limitation, it was not always possible to reach the
 ${\it\zeta}_{min}$
prescribed by our tables for
 ${\it\zeta}(\mathit{Ca}_{pe})$
and
 ${\it\zeta}(\mathit{Ca}_{sh})$
. In some cases, we had to stop at a slightly larger (but still small) value of
 ${\it\zeta}$
, when either the Newton iterations diverged or the solution became unacceptable
 $({\it\lambda}_{1}<0)$
.
Figures 20–22 present the Oldroyd parameters for
 $c=0.45{-}0.55$
and
 ${\it\lambda}$
from 1 to 10. The
 ${\it\eta}$
-parameter is almost constant. The non-smoothness and small-scale wiggles of the
 ${\it\lambda}_{i}$
and
 ${\it\mu}_{i}$
curves are due to the scarcity of our tables for
 ${\it\mu}_{sh}$
, etc. and the chosen manner of interpolation from them. However, the predictions of the Oldroyd model (8.1) with these coefficients (discussed in the next section) were found to be very insensitive to such details, obviously because the whole combination of five Oldroyd parameters matters. The sharp rise of some coefficients at small
 $\mathit{Ca}$
(outside the range shown in figure 20
a,b) is not quite as surprising. Even in the absence of the phase transition limitation, a well-defined limit
 ${\it\zeta}\rightarrow 0$
with finite
 ${\it\lambda}_{i}$
and
 ${\it\mu}_{i}$
is not expected, because a flowing concentrated emulsion is not a Rivlin–Ericksen fluid.
Generalized Oldroyd coefficients for concentrated emulsions with
 $c=0.45$
and (a)
 ${\it\lambda}=10$
, (b)
 ${\it\lambda}=3$
and (c)
 ${\it\lambda}=1$
. Lines 1–5 are for
 ${\it\lambda}_{1}$
,
 ${\it\mu}_{1}$
,
 ${\it\lambda}_{2}$
,
 ${\it\mu}_{2}$
and
 ${\it\eta}$
respectively. Some lines are labelled twice for clarity.

Generalized Oldroyd coefficients for
 $c=0.55$
with (a)
 ${\it\lambda}=10$
, (b)
 ${\it\lambda}=3$
and (c)
 ${\it\lambda}=1$
. Lines 1–5 are for
 ${\it\lambda}_{1}$
,
 ${\it\mu}_{1}$
,
 ${\it\lambda}_{2}$
,
 ${\it\mu}_{2}$
and
 ${\it\eta}$
respectively. Some lines are labelled twice for clarity.

Generalized Oldroyd coefficients for
 $c=0.5$
and
 ${\it\lambda}=1$
. Lines 1–5 are for
 ${\it\lambda}_{1}$
,
 ${\it\mu}_{1}$
,
 ${\it\lambda}_{2}$
,
 ${\it\mu}_{2}$
and
 ${\it\eta}$
respectively.

9. Validation of constitutive modelling
For a given history of deformation of a material element, integration of the Oldroyd equation (8.1) requires an initial condition for
 ${\bf\tau}^{d}$
at
 $t=t_{0}$
. Obviously, knowledge of
 ${\bf\tau}^{d}$
(or, equivalently, of a single microstructural tensor
 $\unicode[STIX]{x1D656}$
in Hand’s theory) does not completely characterize the instantaneous emulsion microstructure. For
 ${\it\lambda}=1$
, in particular,
 ${\bf\tau}^{d}=\mathbf{0}$
can be obtained with an infinite number of statistically different initial configurations of non-deformed drops. In principle, more general constitutive equations could be attempted, with additional structural variables/tensors and possibly higher-order time derivatives of
 ${\bf\tau}^{d}$
and/or
 $\unicode[STIX]{x1D640}$
. Such models, though, do not necessarily represent a viable alternative to our constitutive modelling scheme, since these models would contain many more parameters/material functions problematic to determine from a finite set of flows. As usual, an acceptable behaviour of a multiparameter model in a broad range of conditions may be more difficult to achieve. It is not even clear to us how such more complex models would incorporate the details of the initial microstructure at
 $t=t_{0}$
. Instead, the present work explores the idea of using only two steady canonic flows – PE and simple shear – for a robust and general constitutive modelling with only five material functions. An initial condition for
 ${\bf\tau}^{d}$
is clearly artificial (as for all first-order constitutive equations of differential type, Astarita & Marucci Reference Astarita and Marucci1974), and cannot replace the whole prehistory of the material element deformation prior to
 $t=t_{0}$
. However, there are many potential applications of the generalized Oldroyd model (8.1) to non-Newtonian hydrodynamics, where the fading memory of the material makes the initial state insignificant. For example, in the problem of unbounded steady laminar flow of a non-Newtonian liquid past a body, there are two types of trajectories of a material element: (i) open trajectories arriving from infinity and (ii) closed trajectories in the recirculating zone(s). In both cases, an initial condition for integrating (8.1) is imposed at
 $t=-\infty$
and does not affect the established regime at finite
 $t$
(i.e. near the body) of only interest. In case (ii), the history of deformation of a material element and established rheological response are Lagrangian time-periodic. In case (i), they are aperiodic but still Lagrangian-unsteady. Obviously, dependence on the initial state would introduce much uncertainty, requiring details about the material preparation prior to simulation/experiments. Accordingly, we are only interested in validation tests for (8.1) where the initial state is sufficiently far in the past to not affect the results.
For dilute emulsions of single drops, the validation of the constitutive model (8.1), with the coefficients fitted to shear flow and PE, was performed (Martin et al.
Reference Martin, Zinchenko and Davis2014) in a broad class of kinematic conditions, both Lagrangian-steady and unsteady. For concentrated emulsions, though, the only exact results that can be obtained for comparison with the model (8.1) are for steady mixed flows (2.1c
), or their straightforward time-dependent generalizations (including particular cases of simple shear,
 ${\it\chi}=0$
, or PE,
 ${\it\chi}=1$
). These types of flow appear to be the only ones allowing for implementation of periodic boundaries (§ 2.1), and, hence, credible long-time simulations. Both steady and unsteady test flows are considered below.
Steady-state rheological functions in the strong mixed flow with
 ${\it\chi}=0.25$
and (a)
 ${\it\lambda}=1$
, (b)
 ${\it\lambda}=3$
, (c)
 ${\it\lambda}=10$
. Lines are from constitutive modelling, and symbols are exact BI simulation results. Diamonds and solid lines are for
 $c=0.45$
. Circles and long-dashed lines are for
 $c=0.5$
. Squares and short-dashed lines are for
 $c=0.55$
. In each graph, every three vertically aligned symbols of the same shape, and every three lines of the same pattern, represent
 ${\it\mu}^{\ast }-1$
,
 ${\it\nu}_{11}$
and
 ${\it\nu}_{22}$
from top to bottom.

9.1. General steady mixed flows
In contrast to shear flow, our mixed-flow simulations performed for
 $0.25\leqslant {\it\lambda}\leqslant 3$
and
 $c\leqslant 0.55$
have never exhibited phase transition, so simulation times
 $T\sim 100$
and the system size
 $N=100$
suffice, combined with the moderate resolution
 $N_{\triangle }=2160$
for
 $\mathit{Ca}\geqslant 0.0375$
.
The model (8.1), with our variable Oldroyd coefficients (figures 20–22), is numerically integrated for the mixed-flow kinematics (2.1c
) until the steady state. At the transient stage, the argument
 ${\it\zeta}$
is allowed to be somewhat outside the tabulated range
 $[{\it\zeta}_{min},{\it\zeta}_{max}]$
of the Oldroyd coefficients (with the extrapolation used), but we require it to be within
 $[{\it\zeta}_{min},~{\it\zeta}_{max}]$
at the steady state. This requirement limits the range of simulated mixed-flow capillary numbers accordingly. The initial condition for (8.1) is either
 ${\bf\tau}^{d}=\mathbf{0}$
or the converged solution at the nearest available
 $\mathit{Ca}$
.
Strong mixed flows. For a strong mixed flow,
 ${\it\chi}=0.25$
, the model predictions (lines) are compared with exact simulation results (symbols) in figure 23(a,b). In addition to the excess mixed-flow viscosity
 ${\it\mu}^{\ast }-1$
, only the components
 ${\it\nu}_{11}$
and
 ${\it\nu}_{22}$
of the non-dimensional stress (2.2c
) are shown, since
 ${\it\nu}_{33}=-({\it\nu}_{11}+{\it\nu}_{22})$
is not independent and is generally small. Apart from
 $c=0.55$
(with the rightmost data points slightly subcritical), the other mixed-flow simulations (diamonds and circles) cover the whole range from small drop deformations to breakup. The corresponding model predictions (solid and long-dashed lines respectively) terminate at slightly smaller
 $\mathit{Ca}$
due to the technical limitation of PE breakup on the argument
 ${\it\zeta}$
.
Another technical limitation – shear-flow phase transition – does not allow our model predictions for mixed flow to approach small
 $\mathit{Ca}$
, namely when
 ${\it\lambda}=1$
,
 $c\geqslant 0.5$
and
 ${\it\lambda}=3$
,
 $c=0.55$
(figure 23
a,b). Despite these limitations, a very good agreement between the exact results and the model predictions suggests the success of the generalized Oldroyd model (8.1), with the variable coefficients fitted to simple shear and PE, for constitutive modelling of general flows. In the absence of the exact results at
 ${\it\lambda}=10$
, figure 23(c) provides our model predictions for mixed flow. In the conclusions, we discuss possible ways to remove/relax the current limitations on our constitutive modelling.
Weak mixed flows
 $({\it\chi}<0)$
. In the dilute limit, the above constitutive modelling scheme was also found to be very accurate for weak mixed flows,
 ${\it\chi}=-0.2$
(Martin et al.
Reference Martin, Zinchenko and Davis2014). This is not quite the case for concentrated emulsions. In figure 24, for
 ${\it\chi}=-0.25$
,
 $c=0.45$
with (a)
 ${\it\lambda}=1$
and (b)
 ${\it\lambda}=3$
, the agreement between the exact results and the model predictions is only approximate (except for the excess viscosity
 ${\it\mu}^{\ast }-1$
in (a) with less discrepancy). For the exact results in the entire range of figure 24(a,b), the drop deformation remains small. Since a concentrated emulsion is not a Rivlin–Ericksen fluid and does not possess a well-defined limit of slow flows (with small drop deformations), it would be, indeed, difficult to expect accuracy of the model predictions for
 ${\it\chi}=-0.25$
based on the results for
 ${\it\chi}=0$
(simple shear) and
 ${\it\chi}=1$
(PE).
Steady-state rheological functions for a weak mixed flow
 ${\it\chi}=-0.25$
,
 $c=0.45$
at (a)
 ${\it\lambda}=1$
and (b)
 ${\it\lambda}=3$
. Lines are from constitutive modelling and symbols are exact BI results:
 ${\it\mu}^{\ast }-1$
(solid lines and diamonds),
 ${\it\nu}_{11}$
(long-dashed lines and squares),
 ${\it\nu}_{22}$
(short-dashed lines and circles).

This moderate loss of accuracy for
 ${\it\chi}<0$
is not perceived as a major drawback of our constitutive modelling scheme, since weak mixed flows are apparently less relevant to realistic non-Newtonian hydrodynamics in complex geometries. The trajectory of the displacement
 ${\bf\xi}$
between two close points of a continuum with velocity gradient
 $\boldsymbol{{\rm\nabla}}\boldsymbol{v}$
is described by
 $\text{d}{\bf\xi}/\text{d}t=\boldsymbol{{\rm\nabla}}\boldsymbol{v}\boldsymbol{\cdot }{\bf\xi}$
. Such trajectories are open (of hyperbolic shape) for strong mixed flows
 ${\it\chi}>0$
, and periodic (of elliptical shape) for
 ${\it\chi}<0$
. As a qualitative example of possible more general kinematics, consider a stationary flow past a macroscopic sphere at finite Reynolds number
 $\mathit{Re}$
. Using, for simplicity, the Newtonian flow solution, the structure of the fluid trajectories past the sphere can be analysed up to
 $\mathit{Re}=60$
, at least qualitatively, by the two-term small-
 $\mathit{Re}$
inner expansion for the stream function (Proudman & Pearson Reference Proudman and Pearson1957; Van Dyke Reference Van Dyke1967). Figure 25(a) shows one closed trajectory in the eddy zone obtained in this manner for
 $\mathit{Re}=50$
. Along this pathline,
 $\boldsymbol{{\rm\nabla}}\boldsymbol{v}$
is Lagrangian time-periodic. However, according to the Floquet theory for linear systems with periodic coefficients, periodicity of
 ${\bf\xi}(t)$
is not expected. Indeed, numerical integration of
 $\text{d}{\bf\xi}/\text{d}t=\boldsymbol{{\rm\nabla}}\boldsymbol{v}(t){\bf\xi}$
along this pathline gives the open trajectory of
 ${\bf\xi}(t)$
shown in figure 25(b). Therefore, even in the eddy zone, the history of deformation of material elements is qualitatively different from that for weak mixed flows.
(a) Stationary Newtonian flow past a solid sphere at a finite Reynolds number
 $\mathit{Re}=UR/{\it\nu}=50$
; (b) a typical trajectory in the
 ${\it\xi}_{3}=0$
plane of the
 ${\bf\xi}$
-vector for a material element moving along the pathline shown in (a). The plane (
 ${\it\xi}_{1}$
,
 ${\it\xi}_{2}$
) is parallel to the meridian plane in (a), with
 ${\it\xi}_{1}$
along the ambient velocity
 $\boldsymbol{U}$
. The aspect ratio
 ${\it\xi}_{1}\!:\!{\it\xi}_{2}$
of the axes in (b) is 6.

9.2. Time-dependent PE flow
Our multidrop BI algorithm can be easily adapted to handle time-dependent simple shear, PE and mixed-flow simulations, if the time dependence is only in the scalar prefactor
 ${\it\varphi}(t)$
before the constant velocity gradient tensor for either of the three flows. Returning to dimensional variables, consider an example of a time-dependent PE flow with the velocity gradient
 $\text{diag}(\dot{{\it\Gamma}},-\dot{{\it\Gamma}},0)$
and the deformation rate
 $\dot{{\it\Gamma}}(t)=\langle \dot{{\it\Gamma}}\rangle {\it\varphi}(t)$
, where
 $\langle \dot{{\it\Gamma}}\rangle >0$
is constant. Assuming
 ${\it\varphi}(t)>0$
for all
 $t$
, a new monotonic variable
 $\hat{t}$
is introduced through the integration of
 ${\it\varphi}(t)\,\text{d}t=\text{d}\hat{t}$
. Then, the dynamics of the lattice vectors takes the usual form
 $\text{d}\boldsymbol{e}_{i}/\text{d}\hat{t}=\text{diag}(\langle \dot{{\it\Gamma}}\rangle ,-\langle \dot{{\it\Gamma}}\rangle ,0)\boldsymbol{e}_{i}$
for steady PE, which enables the Kraynik–Reinelt scheme of periodic boundary implementation (§ 2.1); lattice restructuring is now made at all half-integer values of
 $\langle \dot{{\it\Gamma}}\rangle \hat{t}/{\it\varepsilon}_{p}$
. Of course, the artificial variable
 $\hat{t}$
is only used in the lattice dynamics and restructuring; in all the rest of the algorithm, the real time
 $t$
is employed. A flow was considered with
 $c=0.45,{\it\lambda}=1$
and strong sevenfold non-harmonic oscillations in the deformation rate
 $\dot{{\it\Gamma}}(t)$
, provided by
 ${\it\varphi}(t)=\text{const.}/(1+0.75\sin 2{\rm\pi}{\it\omega}t)$
, with a numerical constant of order one (see below) to make the average of
 ${\it\varphi}(t)$
equal to one. Pure harmonic oscillations are avoided for the sake of generality. In order for this test to be relevant to real flow kinematics in complex geometries, the oscillation period
 $1/{\it\omega}$
should not be much smaller than
 $\langle \dot{{\it\Gamma}}\rangle ^{-1}$
, at least in the laminar regime. For example, the period of orbiting along the closed trajectory in figure 25 is
 ${\sim}R/U$
, comparable with the inverse deformation rate; accordingly, we set
 ${\it\omega}=\langle \dot{{\it\Gamma}}\rangle$
. With this choice, the above numerical constant in
 ${\it\varphi}(t)$
is found to be 0.6614. The capillary number
 $\overline{\mathit{Ca}}=2{\it\mu}_{e}\langle \dot{{\it\Gamma}}\rangle a_{o}/{\it\sigma}$
, based on the average deformation rate
 $\langle \dot{{\it\Gamma}}\rangle$
, was set to 0.074.
Two non-dimensional rheological functions are defined for this flow through the drop-phase stress contribution
 ${\bf\tau}^{d}$
and the average deformation rate,
 $$\begin{eqnarray}{\rm\Delta}{\it\mu}_{pe}^{{\it\omega}}(t)=\frac{{\it\tau}_{11}^{d}-{\it\tau}_{22}^{d}}{4{\it\mu}_{e}\langle \dot{{\it\Gamma}}\rangle },\quad N_{pe}^{{\it\omega}}(t)=\frac{{\it\tau}_{11}^{d}+{\it\tau}_{22}^{d}-2{\it\tau}_{33}^{d}}{4{\it\mu}_{e}\langle \dot{{\it\Gamma}}\rangle }.\end{eqnarray}$$
These quantities quickly reach a periodic regime in our BI simulations, but small stochastic fluctuations around this regime remain, due to a finite number of drops; to reduce these additional fluctuations, a large system size
 $N=400$
was used. Unlike for the steady-state results in §§ 5–7, time averaging would be irrelevant in this essentially unsteady flow test.
The initial evolution of
 ${\rm\Delta}{\it\mu}_{pe}^{{\it\omega}}(t)$
in the
 $N=400$
BI simulation to a periodic regime is shown in figure 26 by a solid line; as in the rest of the paper, the initial state was a well-mixed configuration of spherical drops. The results of the integration of the generalized Oldroyd model (8.1) are also shown by a dashed line using our variable coefficients from figure 20(c) and the initial condition
 ${\bf\tau}^{d}=\mathbf{0}$
. The BI simulation and the model start to agree well before the periodic regime is reached, and the initial discrepancy at small times is not of much concern. At small times the initial drop configuration has an effect on simulations, and the BI results would first need to be ensemble-averaged over many initial conditions for a meaningful comparison. In view of the discussion at the beginning of this section, such averaging was not pursued since we are only interested in the long-time regime independent of the initial state; one initial drop configuration is sufficient to explore the long-time behaviour.
Evolution of the excess viscosity function to a periodic regime for time-dependent PE flow at
 $c=0.45$
and
 ${\it\lambda}=1$
. The solid line is the exact result from the
 $N=400$
BI simulation. The dashed line is from the generalized Oldroyd model (8.1).

The long-time comparisons between the
 $N=400$
BI simulation and various models are presented in figure 27, for both rheological functions (9.1). The two solid lines are from BI (top,
 ${\rm\Delta}{\it\mu}_{pe}^{{\it\omega}}(t)$
; bottom,
 $N_{pe}^{{\it\omega}}(t)$
). The dashed lines are from the generalized Oldroyd equation (8.1) (top,
 ${\rm\Delta}{\it\mu}_{pe}^{{\it\omega}}(t)$
; bottom,
 $N_{pe}^{{\it\omega}}(t)$
). The simplest alternative model is the quasisteady approximation using the steady-state PE results at the instantaneous deformation rate
 $\dot{{\it\Gamma}}(t)=\langle \dot{{\it\Gamma}}\rangle {\it\varphi}(t)$
. Accordingly, the rheological functions (9.1) are approximated as
 $\langle {\it\mu}_{pe}-1\rangle {\it\varphi}(t)$
and
 $\langle N_{pe}\rangle {\it\varphi}(t)$
, where the steady-state extensiometric quantities
 $\langle {\it\mu}_{pe}-1\rangle$
and
 $\langle N_{pe}\rangle$
, as functions of the instantaneous capillary number (2.1b
)
 $\mathit{Ca}=\overline{\mathit{Ca}}{\it\varphi}(t)$
, are interpolated from figure 9(c). This approximation is shown in figure 27 by two dotted lines (top,
 ${\rm\Delta}{\it\mu}_{pe}^{{\it\omega}}(t)$
; bottom,
 $N_{pe}^{{\it\omega}}(t)$
). For some values of
 ${\it\omega}t$
, the quasisteady results could not be computed when
 $\mathit{Ca}$
was outside the data range of figure 9(c). Regardless, the quasisteady approximation is seen to be very poor compared with the BI simulation, especially for
 $N_{pe}^{{\it\omega}}(t)$
. The generalized Oldroyd model (8.1) behaves much better. For
 ${\rm\Delta}{\it\mu}_{pe}^{{\it\omega}}(t)$
, this model is practically indistinguishable from the BI results in broad ranges around maxima, and has very small phase errors near minima; only amplitude errors at minima are appreciable. For
 $N_{pe}^{{\it\omega}}(t)$
, the Oldroyd model prediction is still acceptable, considering the small values of this cross-difference compared with
 ${\rm\Delta}{\it\mu}_{pe}^{{\it\omega}}(t)$
. Thus, remarkably, combining the steady-state results for PE with those for simple shear in our constitutive modelling scheme works to dramatically improve the predictions for time-dependent PE. This conclusion was confirmed by another test for a purely harmonic deformation rate
 $\dot{{\it\Gamma}}(t)=\langle \dot{{\it\Gamma}}\rangle (1+0.75\sin 2{\rm\pi}{\it\omega}t)$
at
 $\overline{\mathit{Ca}}=0.1$
.
Rheological functions for time-dependent PE flow at
 $c=0.45$
and
 ${\it\lambda}=1$
. The solid lines are exact results from the
 $N=400$
BI simulation (top line,
 ${\rm\Delta}{\it\mu}_{pe}^{{\it\omega}}$
; bottom,
 $N_{pe}^{{\it\omega}}$
). The dashed lines are from the generalized Oldroyd model (8.1) (top,
 ${\rm\Delta}{\it\mu}_{pe}^{{\it\omega}}$
; bottom,
 $N_{pe}^{{\it\omega}}$
). The dotted lines are from the quasisteady PE flow approximation (top,
 ${\rm\Delta}{\it\mu}_{pe}^{{\it\omega}}$
;bottom,
 $N_{pe}^{{\it\omega}}$
).

10. Conclusions
We have studied the rheology of highly concentrated monodispersed emulsions of deformable drops by multidrop dynamical simulations for three types of steady macroscopic flows: (i) simple shear
 $\boldsymbol{v}=(\dot{{\it\gamma}}x_{2},0,0)$
, (ii) planar extension (PE)
 $\boldsymbol{v}=(\dot{{\it\Gamma}}x_{1},-\dot{{\it\Gamma}}x_{2},0)$
and (iii) mixed flow
 $\boldsymbol{v}=(\dot{{\it\gamma}}x_{2},\dot{{\it\gamma}}{\it\chi}x_{1},0)$
. The results for these flows are further used as a database to construct and validate the general constitutive model for concentrated emulsion flows with arbitrary kinematics. The algorithm is a further development of the original multidrop multipole-accelerated boundary-integral code for shear-flow simulations (Zinchenko & Davis Reference Zinchenko and Davis2002). Among the major improvements/additions, the present code incorporates periodic boundary conditions for PE and mixed flows (based on the reproducible lattice dynamics of Kraynik & Reinelt (Reference Kraynik and Reinelt1992) and matrix transformations of Hunt et al. (Reference Hunt, Bernardi and Todd2010)), control of drop surface overlapping and much more robust (than in Zinchenko & Davis Reference Zinchenko and Davis2002) control of surface triangulations. These features allow for unlimited long-time simulations and accurate time averaging. The present version of the multipole acceleration is also more efficient and flexible, allowing for considerable skewage of the periodic cells and extreme drop elongation.
For shear flow, the steady-state viscometric functions (emulsion shear viscosity and normal stress differences) were studied for drop volume fractions
 $c=0.45{-}0.55$
, drop-to-medium viscosity ratios
 ${\it\lambda}=0.25$
, 1, 3 and 10, and different subcritical capillary numbers
 $\mathit{Ca}={\it\mu}_{e}\dot{{\it\gamma}}a_{0}/{\it\sigma}$
, based on the ambient viscosity
 ${\it\mu}_{e}$
, non-deformed drop radius
 $a_{0}$
and surface tension
 ${\it\sigma}$
. Compared with the initial effort (Zinchenko & Davis Reference Zinchenko and Davis2002), the present work includes two new more extreme viscosity ratios
 ${\it\lambda}=0.25$
and 10. We have also extended the range of surface triangulations to typically
 $N_{\triangle }=2000{-}4000$
boundary elements per drop (important for small
 $\mathit{Ca}$
), and the system size to
 $N=200$
(for
 ${\it\lambda}\neq 1$
) and 400 (for
 ${\it\lambda}=1$
) drops in a periodic cell. Moreover, the simulated strains
 $\dot{{\it\gamma}}t$
were increased by 1.5–2 orders of magnitude (to hundreds for
 ${\it\lambda}\neq 1$
and thousands for
 ${\it\lambda}=1$
) to address the challenging phenomenon of dynamical phase transition (to a partially ordered state) in emulsion shear flows. The onset of this transition is quantified by a sharp increase in the relaxation time to the statistical equilibrium as
 $\mathit{Ca}$
is reduced. In the simulated ranges
 $c\leqslant 0.55$
and
 $\mathit{Ca}\geqslant 0.02$
, the
 ${\it\lambda}=10$
emulsion does not show any phase transition. The
 ${\it\lambda}=3$
emulsion flows in a disordered manner at
 $c=0.45$
, but starts to transition to ordered flow at the higher concentration
 $c=0.55$
for
 $\mathit{Ca}$
between 0.02 and 0.04. The
 ${\it\lambda}=1$
emulsion can even transition at
 $c=0.45$
, but not until
 $\mathit{Ca}$
approaches 0.025; at
 $c=0.55$
, the transition capillary number for such an emulsion is
 $\mathit{Ca}\approx 0.07$
. Finally, the
 ${\it\lambda}=0.25$
emulsion flows in a partially ordered manner in a wide range of
 $\mathit{Ca}\leqslant 0.18{-}0.22$
for
 $c=0.45{-}0.55$
. The shift of the phase transition to smaller capillary numbers, as
 ${\it\lambda}$
is increased, is due to larger drop deformation and more efficient mixing. It is unexpected that our emulsions are found to transition even at
 $c=0.45$
in shear flow; for comparison, molecular dynamics and Monte Carlo simulations for a classical liquid of hard spheres give higher transition values
 $c\geqslant 0.494$
(e.g. Hoover & Ree Reference Hoover and Ree1968; Hansen & McDonald Reference Hansen and McDonald1976).
In the transition range, ergodic difficulties are severe, with noticeable effects of the system size
 $N$
and the initial conditions on the steady-state viscometric functions, especially
 $N_{1}$
. Nevertheless, the accuracy of the calculations is sufficient to state the existence of the local minimum of the shear viscosity versus
 $\mathit{Ca}$
; this non-smooth kinked behaviour is most pronounced for
 ${\it\lambda}=1$
and
 $c=0.55$
. For the
 ${\it\lambda}=0.25$
emulsion, the shear viscosity is almost insensitive to ergodic difficulties and is accurately calculated in a wide range, from large to small drop deformations. For such emulsions, though, the first normal stress difference can greatly exceed the drop-phase contribution to the shear stress, making them ‘more elastic than viscous’.
The PE simulations behave very differently. The steady-state extensiometric functions (the effective viscosity
 ${\it\mu}_{pe}$
and cross-difference
 $N_{pe}$
) were accurately computed in the same ranges of
 $c=0.45{-}0.55$
and
 ${\it\lambda}=0.25{-}10$
up to critical
 $\mathit{Ca}=2{\it\mu}_{e}\dot{{\it\Gamma}}a_{o}/{\it\sigma}$
for drop breakup. High surface resolution
 $N_{\triangle }\sim 4000$
is paramount to accurately describe the range of
 $\mathit{Ca}\ll 1$
. In the limit
 $\mathit{Ca}\rightarrow 0$
, a concentrated emulsion is not a phenomenological Rivlin–Ericksen fluid, since close interaction of slightly deformed drops is a problem of singular perturbations. Our viscosity
 ${\it\mu}_{pe}$
versus
 $\mathit{Ca}$
shows sharp tension thinning in this range, which then levels off for larger
 $\mathit{Ca}$
with a shallow minimum. The cross-difference
 $N_{pe}$
becomes significant for near-critical
 $\mathit{Ca}$
. Most importantly, phase transition is never observed in our PE simulations. Relaxation to statistical equilibrium is always fast, with
 $N=100$
sufficient to eliminate finite-size effects.
A natural question is whether the results obtained for steady simple shear and PE can help in general constitutive modelling for large-strain emulsion flows with arbitrary kinematics. Martin et al. (Reference Martin, Zinchenko and Davis2014) offered a new general approach to constitutive modelling for non-Newtonian liquids, based on the traceless five-parameter Oldroyd model with variable coefficients. These five coefficients, depending on one instantaneous flow invariant
 ${\it\zeta}$
, must be found by simultaneously fitting the model to viscometric and extensiometric (in PE) functions at arbitrary flow intensities. Here, we applied this approach (already validated in Martin et al.
Reference Martin, Zinchenko and Davis2014 for dilute emulsions of single drops) to concentrated emulsions. The Oldroyd model is written for the drop-phase contribution
 ${\bf\tau}^{d}$
to the stress, and the chosen argument
 ${\it\zeta}=a_{o}({\it\mu}_{e}{\bf\tau}^{d}\boldsymbol{ : }\unicode[STIX]{x1D640})^{1/2}/{\it\sigma}$
of the Oldroyd functions is related to the excess energy dissipation rate. The resulting constitutive model was validated for
 ${\it\lambda}=1$
and 3 versus the exact simulation results in mixed flows at various flow intensities. For a strong flow
 ${\it\chi}=0.25$
, excellent agreement is observed. A modest loss of accuracy of the model for
 ${\it\chi}=-0.25$
is not a major drawback, since weak mixed flows
 $({\it\chi}<0)$
are less relevant to non-Newtonian hydrodynamics in complex geometries, even in the eddy zones.
It is straightforward to extend the present multidrop BI algorithm with periodic boundaries to time-dependent large-strain flows of either simple shear, PE or mixed type, if this time dependence is only in the scalar prefactor before the constant velocity gradient. An example of PE flow with large periodic but non-harmonic oscillations in the deformation rate was considered for a concentrated emulsion
 $c=0.45,\,{\it\lambda}=1$
to further validate our approach to constitutive modelling. Of most interest was to find the long-time periodic stress behaviour independent of the initial conditions. Here, the steady-state PE results alone cannot adequately predict the rheological response. In contrast, combination of these results with those for simple shear in our constitutive modelling scheme works to dramatically improve the model predictions for this time-dependent PE flow.
Still, our constitutive modelling for concentrated emulsions has limitations yet to be overcome. The range of capillary numbers below the phase transition point had to be excluded from the viscometric functions database. We found it virtually impossible to eliminate all the numerical uncertainties and accurately cover the whole range of
 $\mathit{Ca}$
below the phase transition point for all three viscometric functions. Moreover, even in the absence of numerical errors, it may be questionable to combine such kinked data with smooth extensiometric functions (not suffering from phase transition) for a general constitutive modelling. This phase transition limitation restricts from below, sometimes very substantially, the range of flow intensities that can be simulated by our constitutive modelling. We anticipate the following approach to resolve this issue in future work. The fact that emulsions transition in shear flows but not in other flows (e.g. PE and mixed, as shown in this work) puts the relevance of simple shear, as a building block for general computational rheology of concentrated emulsions, into question. For future applications to non-Newtonian hydrodynamics in complex geometries, it would be much better to replace simple shear in the database by a mixed flow with a small
 ${\it\chi}>0$
(say, 0.1–0.2). Such a modification would leave the basics of our constitutive modelling scheme intact, since mixed flow also has three rheological functions to match, and can still be accurately simulated for
 ${\it\chi}\sim 0.1{-}0.2$
, with not too much skewage of the periodic cells. The absence of phase transition in the database should largely eliminate the lower limitation on flow intensities in our constitutive modelling. Such a modification is also a way to overcome mapping difficulties (discussed in § 8) and extend constitutive modelling to small viscosity ratios
 ${\it\lambda}$
in future work. Of course, the modified constitutive modelling scheme would no longer be exact for pure simple shear, but this drawback is mostly irrelevant to non-Newtonian hydrodynamics in complex geometries. Interestingly, in the entirely different context of dilute suspensions of Brownian particles, Hinch & Leal (Reference Hinch and Leal1976) also found simple shear to fall out from their modelling scheme, due to the lack of flow-induced particle orientation.
The upper limitation
 ${\it\zeta}\leqslant {\it\zeta}_{max}$
on our constitutive modelling is due to early drop breakup in steady PE. In a general flow with
 ${\it\zeta}>{\it\zeta}_{max}$
, Lagrangian-steady or unsteady, drops will or will not break. Unfortunately, it is unclear, even in principle, how to extend this constitutive modelling to
 ${\it\zeta}>{\it\zeta}_{max}$
or even formulate the concept of the rheology of concentrated emulsions experiencing drop breakup. In some cases, it may work to simply extrapolate our computed Oldroyd coefficients beyond
 ${\it\zeta}_{max}$
. For example, at
 $c=0.45$
and
 ${\it\lambda}=1$
, our Oldroyd coefficients (figure 20
c) show large variations at small
 ${\it\zeta}$
(this variability is essential for the success of constitutive modelling in figure 23
a). At larger
 ${\it\zeta}$
, though, these coefficients almost do not change, and it may be tempting to continue them as constants beyond
 ${\it\zeta}_{max}$
as an approximate constitutive modelling in the breakup range, at least for moderately supercritical conditions. We hope to probe this approach in future work. The concepts and techniques of the present work can be extended to the rheology of concentrated emulsions with an insoluble surfactant, the subject of our current research. Finally, our general constitutive modelling scheme should be applicable to other non-Newtonian liquids (suspensions, polymeric solutions, etc.).
Acknowledgements
This work was supported by NSF grant no. CBET 1064132. We also thank the reviewer for the suggestion to consider a time-dependent flow for further validation of our constitutive modelling.