Introduction
Nigella sativa L. (2n= 2x= 12) commonly known as black cumin, black seed or curative black cumin is a promising medicinal plant belonging to the Ranunculaceae family (Salem, Reference Salem2005). It is an annual herbaceous, self-pollinating plant with white or pale to dark blue flowers, with 5–10 petals, and forms a capsule composed of several united follicles, each containing numerous seeds. N. sativa is found wild in southern Europe, northern Africa and Asia Minor (Kamal et al., Reference Kamal, Arif and Ahmad2010). It is also planted in most parts of Iran (Ghamarnia and Jalili, Reference Ghamarnia and Jalili2013). Thymoquinone, the active constituent of N. sativa seeds, is a pharmacologically active quinone, which possesses several properties including anti-histaminic, anti-tumour, anti-inflammatory, anti-oxidant properties and anti-microbial actions (Salem, Reference Salem2005).
Extensive investigations about N. sativa have been restricted to its ingredient and therapeutic properties and little research has been done for assessment of its genetic diversity. Analysis of genetic diversity provides useful baseline information of N. sativa genetic resources, extremely essential for its breeding and improvement (Hamilton, Reference Hamilton2004). Preliminary survey for assessment of N. sativa genetic resources started by analysis of morphological traits between different samples collected from Pakistan, where yield potential cultivation and morpho-physiological traits diversity were explored (Iqbal et al., Reference Iqbal, Qureshi and Ghafoor2010; Iqbal et al., Reference Iqbal, Ghafoor, Ahmad and Inamullah2013). Recently, the molecular diversity study of N. sativa from Ethiopia has been conducted using inter-simple sequence repeat markers (Kapital et al., Reference Kapital, Feyissa, Petros, Mohammed, Oumer, Yohannes, Kassahun, Abel and Endashaw2015). Although N. sativa is an important medicinal plant in Iran with a long historical background, no information is yet available on its genetic variability and population structure.
In recent years, many new marker techniques have been emerged, which between those, Start Codon Targeted (SCoT) markers (Collard and Mackill, Reference Collard and Mackill2009), on account of higher polymorphism and better marker resolvability is gaining popularity (Guo et al., Reference Guo, Zhang and Liu2012; Bhattacharyya et al., Reference Bhattacharyya, Kumaria, Kumar and Tandon2013; Satya et al., Reference Satya, Karan, Jana, Mitra, Sharma, Karmakar and Ray2015). SCoT was developed based on the conserved regions of plant genes surrounding the ATG translation start codon (Collard and Mackill, Reference Collard and Mackill2009).
In this study, SCoT markers were used for genetic diversity analysis of Iranian landraces of Black cumin. Simpson's diversity index was offered as a discriminatory index (D) to adjust the PIC of the markers. The proposed adjusted PIC (PICD= PIC × D) has the potential to display both the polymorphism information content (PIC) and the rate of band dispersion across population.
Materials and methods
Plant materials and SCoT amplification
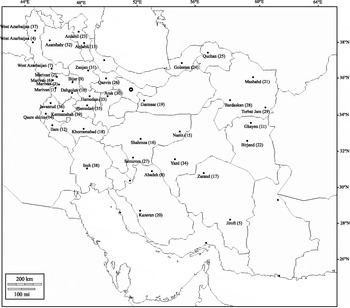
A total of 39 Iranian landraces of N. sativa were collected in different villages of Iran (Fig. 1). Twenty SCoT primers, which were highly polymorphic in previous studies (Collard and Mackill, Reference Collard and Mackill2009; Luo et al., Reference Luo, He, Chen, Hu and Ou2012), were selected (Table 1) for study of the genetic diversity of N. sativa L. landraces. DNA was extracted from the young leaves using the CTAB method (Doyle and Doyle, Reference Doyle and Doyle1990). DNA concentration and purity were estimated by electrophoresis on 1% agarose gel and spectrophotometry at 260 and 280 nm. The final concentration of DNA samples was adjusted to 50 ng/μl.
Map of Iran indicating the villages where the landraces of Nigella sativa were collected.

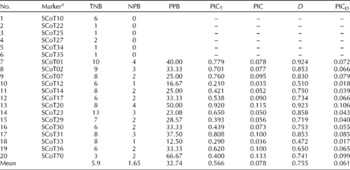
SCoT primers used in this study and their resultant data including the total number of bands (TNB), number of polymorphic bands (NPB), percentage of polymorphic bands (PPB), sum of polymorphic information content across all loci of each marker (PICT), polymorphic information content (PIC), Simpson's diversity index (D) and PICD

a The SCoT70 Primer was designed by Luo et al. (Reference Luo, He, Chen, Hu and Ou2012) and the other primers by Collard and Mackill (Reference Collard and Mackill2009).
The 10 μl PCR mixture contained 50 ng genomic DNA, 1 μl of 10 × buffer, 0.3 mM dNTPs, 1.5 mM MgCl2, 1.0 U Taq Polymerase and 5 pM primer. The PCR program consisted of a 5 min denaturation step at 94°C, followed by 35 cycles of 60 s at 94°C, 60 s at 50°C and 120 s at 72°C followed by storage at 4°C. The PCR products were electrophoresed on 1.5% agarose gels buffered with 0.5 × TBE buffer at 70 V for 1.5 h. The gels were then stained with ethidium bromide and observed and photographed under ultraviolet light.
Statistical analysis
Bands of PCR products were scored for presence (1) or absence (0) to form a 0/1 matrix. q i and p i (frequency of the null and dominant alleles, respectively) were calculated using the following equations assuming Hardy–Weinberg equilibrium in population:
 $${\begin{array}{ccc} q _{ i } = \sqrt {Proportion\ of\ individuals\ without\ the\ band} \\ p _{ i } = 1 - q _{ i } \\ \end{array} } $$
Expected heterozygosity or genotypic gene diversity (H
e), which assumes that the population is under Hardy–Weinberg equilibrium (Liu, Reference Liu1998), was calculated using the equation
 $$1 - { \sum _{ i = 1}^{ n } }\, p _{ i }^{2}, $$
where
 $${ \sum _{ i = 1}^{ n } }\, p _{ i }^{2} $$
is the homozygosity. If the frequencies of band presence and absence are used in the H
e formula instead of allele frequencies, then phenotypic gene diversity (H
p) will be estimated (Mariette et al., Reference Mariette, Le Corre, Austerlitz and Kremer2002). The average observed heterozygosity (H
o) cannot be estimated for dominant markers because they cannot distinguish heterozygous from dominant homozygous individuals.
PIC was measured using the following equation, where n is the number of alleles of the marker and p i and p j are the population frequencies of the ith and jth alleles (Botstein et al., Reference Botstein, White, Skolnick and Davis1980).
 $$PIC = 1 - { \sum _{ i = 1}^{ n } }\, p _{ i }^{2} - 2{ \sum _{ i = 1}^{ n - 1} }\,{ \sum _{ j = i + 1}^{ n } }\, p _{ i }^{2} p _{ j }^{2} = 1 - { \sum _{ i = 1}^{ n } }\, p _{ i }^{2} - \left ({ \sum _{ i = 1}^{ n } }\, p _{ i }^{2}\right )^{2} + { \sum _{ i = 1}^{ n } }\, p _{ i }^{4} $$
PIC was calculated for each locus (PICL). PICT is the sum of PICL values of all the loci produced by the same marker. The mean PICL value over all loci was used as the overall estimate of PIC for that marker. For a co-dominant marker, PIC values can range from 0 to 1. The marker has only one allele at a PIC value of 0, while the marker would have an infinite number of alleles at a PIC value of 1. A locus that has only two alleles with equal frequencies of 0.5 has a maximum PIC value of 0.375; therefore, as a dominant marker has only two alleles at each locus, its PIC value cannot exceed 0.375.
Simpson's index of discrimination (D) was estimated using the following equation for each marker (Simpson, Reference Simpson1949):
 $$D = 1 - \frac {{ \sum _{ j = 1}^{ k } }\, n _{ j }( n _{ j } - 1)}{ N ( N - 1)}, $$
where N is the total number of individuals in the population and k is the number of groups. Each group is composed of genotypes that exactly have the same banding pattern (Table 2). n j is the number of individuals belonging to the jth group. PICD was calculated for each primer using the equation PICD= PIC × D.
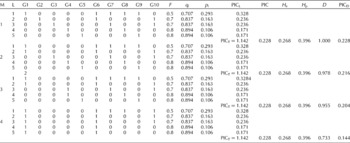
PICD was calculated for four different hypothetical dominant markers (M: marker; L: locus; G1 to G10: genotypes 1 to 10; F: frequency of ‘0’ scores; q i : frequency of null allele in the i th locus; p i : frequency of the dominant allele; PICL: PIC of each marker locus; PICT: sum of PICL for each marker; PIC: mean of PIC values of all the loci of a marker); H e : genotypic gene diversity or expected heterozygosity; H p: phenotypic gene diversity. D: Simpson's diversity index, PICD: PIC×Da

a From the genotypes G1 to G10, bands are scored as 1 when present or 0 when absent for each marker.
Pair-wise genetic similarities (S ij) between landraces i and j were estimated using Jaccard's similarity coefficient (Jaccard, Reference Jaccard1912) as S ij= N ij/(N i+N j− N ij), where N ij is the number of common bands in landraces i and j, and N i and N j are the total numbers of bands in landraces i and j, respectively. A dendrogram was constructed using UPGMA based on Jaccard's similarity coefficients in NTSYS-PC software package (Rohlf, Reference Rohlf1993).
Results
Polymorphism detected by SCoT markers
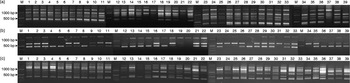
SCoT polymorphism technique was used to study genetic diversity and relatedness among 39 landraces of black cumin from Iran. A total of 14 primers that exhibited reproducible, distinct and reliable band patterns were utilized for band scoring, genetic similarity analysis and cluster analysis. A representative fingerprinting pattern generated by primers SCoT01 (a), SCoT11 (b) and SCoT15 (c) is presented in Fig. 2. For 14 primers used, 106 bands were observed with a mean of 7.57 ranging from 3 (SCoT70) to 13 (SCoT23) per primer (Table 1). Of 106 generated bands, 33 (31.13%) were polymorphic. One to Four polymorphic bands were amplified per primer, with 2.36 polymorphic bands on average. Polymorphism per primer among the studied landraces ranged from 12.5% (SCoT33) to 66.67% (SCoT70). PIC per primer ranged from 0.035 (SCoT12) to 0.133 (SCoT70), with an average of 0.078. Simpson's diversity index (D) ranged from 0.472 (SCoT33) to 0.924 (SCoT01) with an average of 0.755, and adjusted PIC (PICD) per primer ranged from 0.017 (SCoT33) to 0.106 (SCoT20), with an average of 0.061 (Table 1).
SCoT fingerprinting of Iranian Nigella sativa landraces based on primers based on primers SCoT01 (a), SCoT11 (b), and SCoT15 (c), respectively (Numbers of N. sativa landraces are the same as those in Fig. 1 inside parenthesis).

Genetic diversity and cluster analysis among the Nigella sativa genotypes
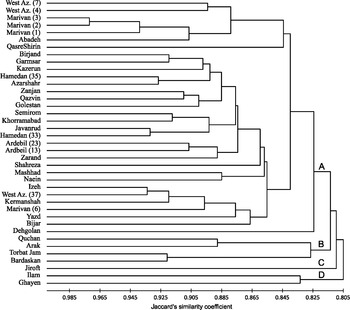
Estimated Jaccard's similarity coefficient varied from 0.79 (for Ilam and West.A2) to 0.97 (for Marivan1 and Marivan4) with an average of 0.875 among different pairs of landraces.
Considering the threshold value of 0.83, the 39 landraces of N. sativa were grouped into four clusters of A, B, C and D (Fig. 3). Among the four clusters, cluster A is the largest, consisting of 32 landraces, which mostly originated from northwest of Iran. Cluster B consisted of four landraces, ‘Quchan’ was collected from west of Iran, ‘Arak’ was from northwest of Iran, and the last two landraces ‘Torbat Jam’ and ‘Bardaskan’ were from northeast of Iran. Cluster C consisted of only one landrace, ‘Jiroft’, which was collected from the southernmost region of Iran. Cluster D consisted of two landraces of ‘Ilam’ and ‘Ghayen’.
Dendrogram showing phylogenetic relationships among 39 Iranian landraces of Nigella sativa revealed by SCoT markers.

Discussion
Accurate identification and characterization of the genetic diversity of different germplasm resources are important for resource protection and cultivar development (Rao and Hodgkin, Reference Rao and Hodgkin2002; Hamilton, Reference Hamilton2004). In spite of the immense medicinal importance such as anti-microbial and anti-tumour activity of N. sativa (Ali and Blunden, Reference Ali and Blunden2003; Salem, Reference Salem2005), the available information on the genetic diversity of N. sativa is very limited and it has not been characterized in Iran, although many landraces of N. sativa are planted in this country. Hence, in this study, the molecular genetic diversity of 39 Iranian N. sativa genotypes was studied using SCoT primers.
The percentage of polymorphic bands (PPB) detected by 14 SCoT primers reached 32.74%, which was lower than PPB of the ISSR markers (100%) reported by Kapital et al. in N. sativa, which was collected in Ethiopia (Kapital et al., Reference Kapital, Feyissa, Petros, Mohammed, Oumer, Yohannes, Kassahun, Abel and Endashaw2015). PPB of the SCoT markers in the present study was also lower than that of the results from other studies such as in Elymus sibiricus (Zhang et al., Reference Zhang, Xie, Wang and Zhao2015), ramie (Satya et al., Reference Satya, Karan, Jana, Mitra, Sharma, Karmakar and Ray2015), Dendrobium nobile (Bhattacharyya et al., Reference Bhattacharyya, Kumaria, Kumar and Tandon2013) and Mangifera indica L. (Luo et al., Reference Luo, He, Chen, Hu and Ou2012).
Genetic diversity of plant populations is largely influenced by factors such as reproduction system, evolutionary and life history. Outcrossing species generally have higher levels of genetic variability than self-pollinated and clonal plants (Charlesworth, Reference Charlesworth2003). Since N. sativa have a self-pollinated system, plant genetic variability in this plant is expected to be lower than cross-pollinated species.
A high genetic similarity was detected among the studied N. sativa landraces based on genetic distance and cluster analysis. The observed high genetic similarity may be due to the fact that N. sativa is not originated from Iran. It is believed to be indigenous to the Mediterranean region but has been cultivated in other parts of the world including Asia and Africa (Weiss, Reference Weiss2002).
The SCoT markers proved to be useful and showed a medium level of polymorphism in evaluation of N. sativa landraces. Based on the generated dendrogram (Fig. 3), we found most of the landraces of N. sativa clustered together, which were collected from the same place, such as, ‘Marivan 1’, ‘Marivan 2’ and ‘Marivan 4’ grouped together. Others include ‘Bardaskan’ and ‘Torbat Jam’, ‘Ardabil 1’ and ‘Ardabil 2’, etc. However, it was found that the landraces of N. sativa collected from different places also can group into one cluster, such as cluster ‘D’. The four accessions were collected from three places and have different altitudes. This result indicted that these landraces of N. sativa may originate from the same ancestor and plant in different places.
The number of observed alleles and their frequency distribution also depend on the sample size and the genetic marker system used. Small sample sizes often lead to significant errors in determining the marker informativeness, which is one of the most important and commonly used estimators of genetic diversity in populations. Thus, a practical method for reliable estimation of PIC in populations is needed for genetic diversity studies.
Different parameters such as PIC, H e (heterozygosity) or H p have been used in the literature for evaluating informativeness of a dominant marker and care must be exerted when making comparisons across studies. All these methods use the band frequency of different loci of a marker to calculate informativeness of the marker. PIC, which originally was proposed for co-dominant markers (Botstein et al., Reference Botstein, White, Skolnick and Davis1980), is a modification of the heterozygosity that subtracts from the H e value an additional probability that an individual in a linkage analysis does not contribute information to the study (Speer, Reference Speer and Albers1999). PIC value is often used to measure the informativeness of a genetic marker in genetic diversity or linkage studies. It refers to the value of a marker for detecting polymorphism within a population, depending on the number of detectable alleles and the distribution of their frequency; thus, it provides an estimate of the discriminating power of a marker (De Riek et al., Reference De Riek, Calsyn, Everaert, Van Bockstaele and De Loose2001; Hajmansoor et al., Reference Hajmansoor, Bihamta and Alisoltani2013). In calculation of both H e and PIC, the dispersion rate of bands across population that determines an aspect of the power of a marker in discriminating individuals has not been considered. Here, we used Simpson's index as a value of band dispersion rate and adjusted the PIC values. The usefulness of Simpson's index to adjust the PIC of dominant markers is illustrated by a hypothetical example. This example compares four different markers with different band distribution patterns but each with five loci and two alleles in each locus (Table 2). As all markers have the same number of loci and equal null allele frequencies, they all obtained an equal PIC value of 0.228. In this example, D index represents the power of a marker in discriminating individuals ranging from 0.733 (for marker 4) to 1.000 (for marker 1). Marker 1 has maximum possible discrimination and divided the hypothetical population into ten different groups, i.e. it discriminated all ten different individuals while marker 4 has divided the population into four different groups. Hence, D index can be considered as a discriminatory index and can be used to adjust the PIC of the dominant markers. The proposed adjusted PIC (PICD= PIC × D) displays the rate of band dispersion and has the ability to show the discriminatory power of individual markers. Markers with a higher PICD value would be more useful for finding QTL as well.
In the analysis of N. sativa landraces, although a significant correlation was observed between PIC and PICD (r= 0.955; P-value = 0.000) and between D and PICD (r= 0.711; P-value = 0.004), there was no significant correlation between PIC and discriminatory power (D) of each marker (r= 0.505; P-value = 0.065). SCoT70 produced the highest PIC value while SCoT20 and SCoT01 had higher D values and may be considered as informative markers as well. So a plot of PIC against D can retain these two separate parameters (PIC and D) and thus would be capable to show polymorphic information content appropriately.
Acknowledgements
This research was financially supported by the University of Kurdistan, Sanandaj, Iran.