Implications
The productivity of cattle grazing rangelands with phosphorus deficient (Pdefic) soils may be severely reduced by dietary deficiencies of phosphorus. As the phosphorus in the skeleton provides a large reserve, which may be mobilized when the diet is deficient in phosphorus, the measurement of bone minerals is important to evaluate P status. Bone mineral reserves of cattle are usually evaluated from rib bone biopsies but differing procedures and measurements often cause uncertainty when comparing studies. The present study compared procedures and measurements, and developed an improved index of bone reserves, to facilitate interpretation of results and evaluation of P status.
Introduction
Nutritional deficiencies of phosphorus (P) often occur in cattle grazing rangelands with P-deficient (Pdefic) soils and may also occur in intensive production systems particularly where there are high diet P requirements for late pregnancy, lactation and rapid growth. Although the P requirements of ruminants in various physiological states have been established (Agricultural and Food Research Council, Reference Anderson, Kidd, Benvenutti, Fletcher and Dixon1991; CSIRO, 2007), it is also known that the skeleton contains large amounts of P and calcium (Ca) which provide a substantial reserve of these minerals (Duncan, Reference Duncan1958; Hill, Reference Hill1962). Mobilization of skeletal P and Ca can alleviate for at least some months a diet deficiency of P or Ca in beef cattle (Hoey et al., Reference Hoey, Murphy and Gartner1982; Dixon et al., Reference Dixon, Kidd, Coates, Anderson, Benvenutti, Fletcher and McNeill2017; Coates et al., Reference Coates, Dixon, Murray, Mayer and Miller2018) and dairy cattle (Knowlton and Herbein, Reference Knowlton and Herbein2002; Valk et al., Reference Valk, Sebek and Beynen2002; Ferris et al., Reference Ferris, McCoy, Patterson and Kilpatrick2010). The changes in skeletal mineral reserves are thus important for understanding and managing the P and Ca nutrition of ruminants.
Skeletal reserves of P and Ca have often been measured at slaughter (e.g. Benzie et al., Reference Benzie, Boyne, Dalgarno, Duckworth and Hill1955; Duncan, Reference Duncan1958; Ferris et al., Reference Ferris, McCoy, Patterson and Kilpatrick2010) or estimated in vivo by the changes in the mineral content of bone measured by absorption of radiation (Schotz et al., Reference Schotz, Bunger, Kongsro, Baulain and Mitchell2015; Coates et al., Reference Coates, Dixon, Mayer and Murray2016). However, the most common in vivo approach in cattle, particularly in field experiments, has been to measure changes in biopsy samples of rib bone comprising a disc of external cortical bone (CBext) from the 11th or 12th rib (Little, Reference Little1972 and Reference Little1984). A variation has been to sample a complete cross-section of rib bone to include the CBext, trabecular bone (Trab), and internal cortical bone (CBint) (Read et al., Reference Read, Engels and Smith1986). This latter biopsy is designated herein as full-core (FC) as opposed to the external cortical bone sample. An unfortunate consequence is that it is difficult to compare results from experiments which have used different rib bone biopsy procedures. This has been exacabated by the variety of measurements and units (e.g. P per g fresh bone, dry bone or fat-free dry bone, or P per unit volume of bone) reported. In the present study FC samples were obtained from cattle in P-adequate (Padeq) or Pdefic status and measurements were made on the FC, and on the CBext, CBint and Trab fractions, to relate the two approaches.
Material and methods
Overview
The study evaluated measurements on rib bone samples obtained from three experiments with cattle that ranged widely in P status as a consequence of consuming diets adequate or deficient in P for ~12 months. Biopsy samples obtained surgically from the 12th rib as described by Read et al. (Reference Read, Engels and Smith1986) were termed full-core (FC) samples and included CBext, CBint and Trab bone. Measurements made on these three fractions were compared with those on the FC samples. As the FC samples comprised bone representing the rib cross-section it was presumed they provided more reliable estimates of rib bone P and were considered as the reference measurement. Surgical and other experimental procedures were carried out according to the code of practice for the care and use of animals for scientific purposes and with the approval of the relevant Animal Ethics Committees operating at the time the experiments were conducted. The cattle were in good health throughout each of the experiments.
Experiment 1
The design and some results have been reported by Coates and Murray (Reference Coates and Murray1994). Two age groups, initially ~8 months and ~20 months old (each n=16), of tropically adapted Bos indicus×Bos taurus Droughtmaster genotype steers grazed pastures on the CSIRO Lansdown Research Station near Townsville, Australia, were allocated to Pdefic or Padeq diet treatments. In July 1992, the steers were allocated to 16 3.8 ha paddocks of native grasses and stylo legumes (Stylosanthes hamata cv. Verano and S. scabra cv. Seca) pasture growing on acutely Pdefic soil. One steer of each age group was allocated to each paddock. The Pdefic treatment steers were given only salt blocks as a supplement whereas the Padeq treatment steers were also given 5 to 7 g P/day as sodium orthophosphate in the drinking water. The steers were weighed and jugular blood samples obtained at intervals for analysis of plasma inorganic P (PIP). Rib bone biopsies were obtained in June 1993 when the steers were ~1.5 or ~2.5 years of age.
Experiment 2
The design and some results have been reported by Coates et al. (Reference Coates, Dixon, Mayer and Murray2016 and Reference Coates, Dixon, Murray, Mayer and Miller2018). It comprised a second draft of Experiment 1 with two age groups of similar steers (each n=20) and the same experimental design, treatments and sampling procedures except that it included an additional four paddocks. Grazing commenced in July 1994 and continued to July 1995 when the rib biopsy samples were obtained from steers in five paddocks of each rreatment.
Experiment 3
The design and some results have been reported by Coates et al. (Reference Coates, Dixon, Murray, Mayer and Miller2018). At Springmount Station near Mareeba, Queensland, six paddock groups of tropically adapted Bos indicus× Bos taurus (~5/8 and 3/8, respectably, F n ) breeder cows (initially 4 to 5 years of age, each paddock group n=8) grazed pastures which provided a range of P concentrations and P intakes from June 1994 to July 1995. Pastures comprised native grasses oversown with Stylosanthes spp. (stylo) with previous application of P fertilizer except for one paddock where soil P was very low and negligible stylo was present. In one other paddock, additional P fertilizer was applied to provide pasture of higher P concentration. Three paddock groups were given supplements containing non-protein N and/or P from September 1994. Pregnant cows entered the experiment in June 1994, calved in November/December 1994, were weaned in May 1995, and the rib bone was sampled in July 1995. The cows were weighed at regular intervals and jugular blood samples obtained in September 1994, February 1995 and May 1995. As soil P concentrations, P supplementation of some herds and PIP concentrations indicated that cows in three of the paddocks were in Pdefic status while the cows in the other three paddocks were in Padeq status the experiment was considered as a comparison of three replicates of these two treatments. Rib bone biopsy samples were obtained 6 weeks after weaning from four cows selected at random from each paddock group.
Laboratory procedures and analyses
The volume and specific gravity (SG) of the fresh FC biopsy samples were determined by weighing in and out of water. Samples were then divided into CBext, CBint and Trab bone, the latter being carefully scraped from the discs of cortical bone. The volume and SG of the hydrated discs of cortical bone were then determined. Cortical bone thickness (CBT) along the line of maximum bone thickness was measured with vernier callipers; the terms CBText and CBTint refer to the thickness of the external and internal discs, respectively. Ash and P concentration of bone samples were calculated as the weight per volume (mg/cc).
Calculations and statistical analysis
An index of P in the external cortical bone was calculated as: (P concentration in CBext (mg P/cc))×(CBText (mm))/1000 that is the amount of P per unit surface area of external cortical bone along the line of maximum CBT (PSACB, mg/mm2). Statistical analyses were conducted using GenStat Release 16.1 (VSN International Ltd., Hempel Hempstead, UK). For Experiments 1 and 2 a 2×2 factorial two strata ANOVA was carried out on the data with paddocks as replicates. P status comprised the upper strata and age of steers the second strata. For Experiment 3, one-way ANOVA was used with paddocks as replicates, P status as the single factor and animals as the sampling unit. Relationships between different variables were examined by linear regression within experiments and then across experiments.
Results
P status of animals at bone biopsy measurements
The changes in LW and PIP of the animals in these experiments have been reported in detail by Coates and Murray (Reference Coates and Murray1994) and Coates et al. (Reference Coates, Dixon, Mayer and Murray2016 and Reference Coates, Dixon, Murray, Mayer and Miller2018). In Experiment 1, the supplementary P increased (P<0.05) the liveweight (LW) gain over the 45 weeks from 59 to 150 kg/head; LW gain did not differ between the age groups (P>0.05) and PIP was lower in the Pdefic than the Padeq steers (averages 23 and 64 mg/l, respectively, P<0.001). In Experiment 2, P supplementation increased (P<0.01) the LW gain of the younger age steers from 98 to 182 kg, and of the older age steers from 77 to 187 kg, over 49 weeks. During the 9 months preceding the bone biopsies the PIP concentrations (31 and 55 mg/l in the younger cohort, and 25 and 55 in the older cohort, of the Pdefic and Padeq steers, respectively) were increased (P<0.05) by the P supplementation. Hence in both experiments the Pdefic and Padeq treatment steers were severely Pdefic or Padeq, respectively, during the 11 months preceding the rib bone measurements.
In Experiment 3, there were large losses of LW in all paddock groups during the late dry season which coincided with late pregnancy and calving (mean 78 kg LW loss), but no differences (P>0.05) due to treatment. However there were large differences between the Pdefic and Padeq paddock groups during the lactation and post-weaning intervals which coincided with the wet and early dry seasons; the Padeq cows gained more LW (105 kg) than the Pdefic cows (21 kg) (P<0.01), and their PIP concentrations were higher (P<0.01, averages 48 and 19 mg P/l, respectively). Through the entire 13 month experimental interval the Padeq cows gained 25 kg and the Pdefic cows lost 55 kg. Hence, the treatment groups represented reproducing breeder cows either severely deficient in P or adequate in P during an annual cycle with the rib biopsy samples obtained at the end of the cycle.
Concentrations of ash and P in rib bone fractions and cortical bone thickness
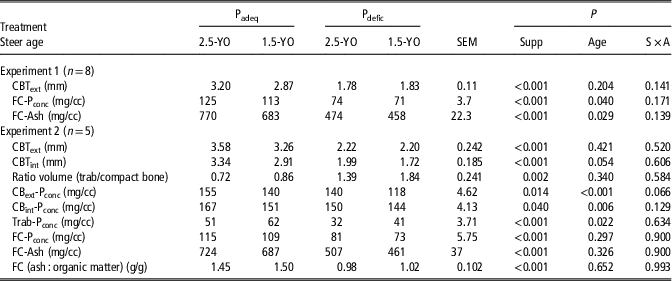
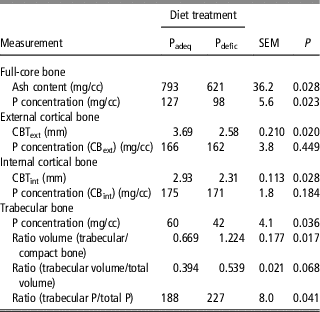
There were large differences between compact bone and trabecular bone fractions in the concentrations (mg/cc fresh bone) of ash and P (Tables 1 and 2). Full-core bone was intermediate reflecting the various proportions of compact and trabecular bone. The rib bone contained on average 159 (SD=3.0) mg P/g ash, and this proportion did not differ (P>0.05) among the CBext, CBint or Trab bone fractions or due to the physiological state of the cattle. Ash and P concentrations consistently ranked CBint>CBext>FC>Trab. For example, P concentrations in the these fractions averaged 167, 155, 115 and 51 mg/cc, respectively, in the Padeq 2.5 year old steers (Table 1; Experiment 2). In Padeq animals the P concentrations in the FC, CBext and CBint bone fractions varied with animal age, being 5% to 10% higher in the mature cows than the 2.5 year old steers, which were 5% to 10% higher than in 1.5 year old steers (Tables 1 and 2). However, there were no such consistent differences in the P concentration of Trab bone. The ash and P concentrations were lower (P<0.05 or <0.01) in the Pdefic steers (Table 1); P concentration in the CBint, CBext, FC and Trab bone in the 2.5-year-old Pdefic steers averaged 90%, 90%, 70% and 63% of the respective P concentrations in the Padeq steers. However, in the mature cows (Table 2) the Pdefic treatment decreased P concentrations (P<0.05) only in the FC and Trab bone (by 23 and 30%, respectively). In Padeq animals the CBText was similar in mature cows in Experiment 3 (3.69 mm) and the 2.5-year-old steers (3.58 mm) in Experiment 2, but in the latter experiment tended (P>0.05) to be lower in the 1.5 year old steers (3.26 mm) (Table 1).
Experiments 1 and 2

Padeq=phosphorus adequate; Pdefic=phosphorus deficient; YO=years of age of the steers at biopsy sampling.
Measurements of full-core (FC), and fractions of rib bone obtained by biopsy in two age cohorts of steers which had grazed grass-legume pasture growing on a low P soil for 11 months during two annual cycles and given no supplementary P (Pdefic) or given supplementary P (Padeq).
Experiment 3

Padeq=phosphorus adequate; Pdefic=phosphorus deficient.
Measurements of full-core (FC), and fractions of rib bone obtained by biopsy in mature cows given Padeq or Pdefic diet treatments for 10 months during pregnancy and lactation, and also for 6 weeks post-weaning. Values are means of four animals from each of three paddocks expected to provide diets adequate or deficient in P.
Relationships among the measurements in full-core samples
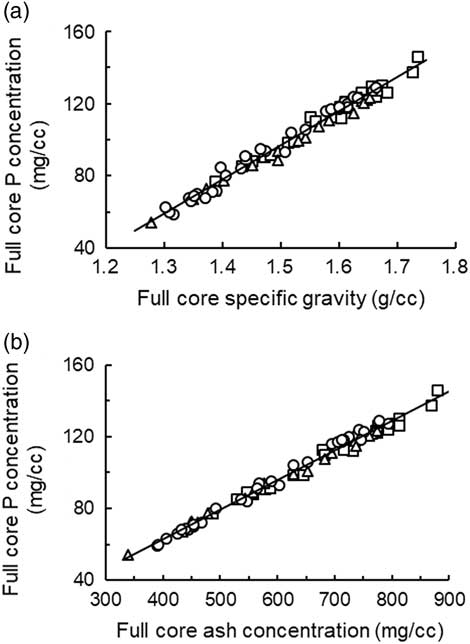
Full-core P concentration (FC-Pconc) (mg/cc) was closely related (r⩾0.96) to both SG and ash concentration (mg/cc) within each experiment, and also for the data pooled across experiments (Figure 1). Although the elevations and slopes of the regression relationships differed (P<0.05 or <0.01) among the experiments these differences were small and introduced very minor additional error when the regression derived from the pooled data was used to estimate the FC-Pconc. The latter was predicted from the ash and SG of the FC rib bone with RSD values of ⩽2.44 and ⩽3.10 mg P/cc, respectively, using the equations derived from the pooled data.
The relationships between the concentration of P (Pconc; mg/cc) and (a) the specific gravity (SG) (g/cc) and (b) the concentration of ash (mg/cc) in the rib bone full-core biopsy bone of cattle in experiments 1 (○), 2 (∆) and 3 (□). In Figure 1a, the regression relationships were as follows:
 $$ {\rm Experiment \,1\!:\, FC{\hbox -}P}_{{{\rm conc}}} {\rm \,{\equals}\, -\!9}{\rm .0{\plus}0}{\rm .1763{\times}Ash }\left\,( {r{\rm \,{\equals}\,1}{\rm .00\comma \,RSD \,{\equals}\, 1}{\rm .95}} \right)\,\quad\quad\quad\quad\quad (1)$$
 $${\rm Experiment \,2\!:\, FC{\hbox -}P}_{{{\rm conc}}} {\rm \,{\equals}\, 1}{\rm .0{\plus}0}{\rm .1579{\times}Ash }\,\left( {r{\rm \,{\equals}\,1}{\rm .00\comma \,RSD \,{\equals}\, 1}{\rm .34}} \right)\quad\quad\quad\quad\quad\quad\, (2)$$
 $${\rm Experiment \,3\!:\, FC{\hbox -}P}_{{{\rm conc}}} {\rm \,{\equals}\, -\!1}{\rm .8{\plus}0}{\rm .1615{\times}Ash }\,\left( {r{\rm \,{\equals}\,0}{\rm .99\comma \,RSD \,{\equals}\, 2}{\rm .51}} \right)\quad\quad\quad\quad\quad \,(3)$$
 $${\rm Experiments \,1 \,to\, 3\!:\, FC{\hbox -}P}_{{{\rm conc}}} {\rm \,{\equals}\, -\!3}{\rm .3{\plus}0}{\rm .1650{\times}Ash }\,\left( {r{\rm \,{\equals}\,1}{\rm .00\comma\, RSD \,{\equals}\, 2}{\rm .44}} \right)\quad\quad \quad\,\,(4)$$
(The regression shown in Figure 1a.) The slope of Experiment 1 equation was greater (P<0.01) than the slopes for Experiments 2 and 3 equations, but the slopes for Experiments 2 and 3 did not differ (P>0.05). In Figure 1b, the regression relationships were as follows:
 $${\rm Experiment \,1\!:\, FC{\hbox -}P}_{{{\rm conc}}} {\rm \,{\equals}\, -\!196}{\rm .6{\plus}196}{\rm .4{\times}SG }\,\left( {n{\rm \,{\equals}\,31\comma }\, r{\rm \,{\equals}\,0}{\rm .99\comma\, RSD \,{\equals}\, 2}{\rm .95}} \right)\quad\quad \,(5)$$
 $${\rm Experiment \,2\!: \,FC{\hbox -}P}_{{{\rm conc}}} {\rm \,{\equals}\, -\!182}{\rm .5{\plus}184}{\rm .6{\times}SG }\,\left( {n{\rm \,{\equals}\,18\comma }\, r{\rm \,{\equals}\,1}{\rm .00\comma \,RSD \,{\equals}\, 1}{\rm .80}} \right)\quad\quad \,(6)$$
 $${\rm Experiment \,3\!: \,FC{\hbox -}P}_{{{\rm conc}}} {\rm \,{\equals}\, -\!180}{\rm .2{\plus}185}{\rm .0{\times}SG }\,\left( {n{\rm \,{\equals}\,24\comma }\,r{\rm \,{\equals}\,0}{\rm .96\comma \,RSD \,{\equals}\, 3}{\rm .01}} \right)\quad\quad \,(7)$$
 $${\rm Experiments \,1 \,to \,3\!: \,FC{\hbox -}P}_{{{\rm conc}}} {\rm \,{\equals} \,-\!188}{\rm .8{\plus}190}{\rm .3{\times}SG \,(}n{\rm \,{\equals}\,73\comma }\, r{\rm \,{\equals}\,0}{\rm .99\comma \,RSD\,{\equals}\, 3}{\rm .10)}\,\,(8)$$
(The regression shown in Figure 1b.) The were no differences in the slopes among the three regressions (P>0.05) but the elevation of the regression for Experiment 2 was lower (P<0.05) than the elevation of the regressions for Experiments 1 and 3.

Relationships among the measurements in external cortical bone
There were also close relationships between the P concentration in CBext (CBext-Pconc) and the ash concentration or SG of CBext even though there were small differences in elevation and slope (P<0.05) between the regression relationships in Experiments 2 and 3. The pooled relationships were as follows:
 $$\eqalignno{ & {\rm CB}_{{{\rm ext}}} {\rm \,{\minus}\,P}_{{{\rm conc}}} \left( {{\rm mg/cc}} \right){\rm \,{\equals}\, & -}5.7{\plus}0.165{\times}{\rm Ash }\left( {{\rm mg/cc}} \right){\rm } \cr & \quad \quad \quad \quad \quad \quad \quad \quad \quad \,\,\left( {n{\rm \,{\equals}\,}44{\rm ;\,\, }r{\rm \,{\equals}\,}0.99{\rm ;\, RSD \,{\equals}\, 2}{\rm .9}} \right) \cr & {\rm CB}_{{{\rm ext}}} \,{\rm {\minus}\,P}_{{{\rm conc}}} \left( {{\rm mg/cc}} \right){\rm \,{\equals}\, -261}{\rm .0{\plus}228}{\rm .8{\times}SG }\left( {{\rm mg/cc}} \right){\rm } \cr & \quad \quad \quad \quad \quad \quad \quad \quad \quad \,\,\,\,\left( {n{\rm \,{\equals}\,44;\,\, }r{\rm \,{\equals}\,0}{\rm .98;\, RSD \,{\equals}\, 3}{\rm .6}} \right) $$
However, CBext-Pconc was poorly related to FC-Pconc in the steers in Experiment 2 (r=0.68; RSD=15.9), and there was no relationship (P>0.05) in the mature cows. There were also close relationships between SG, ash concentration and P concentration within the CBint, and Trab bone fractions (data not shown).
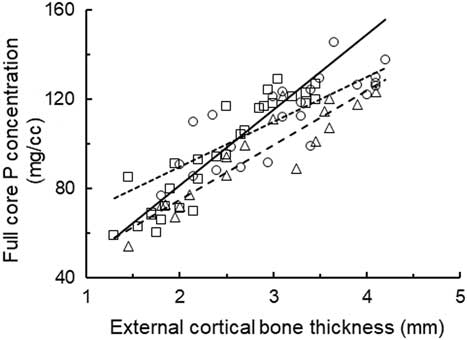
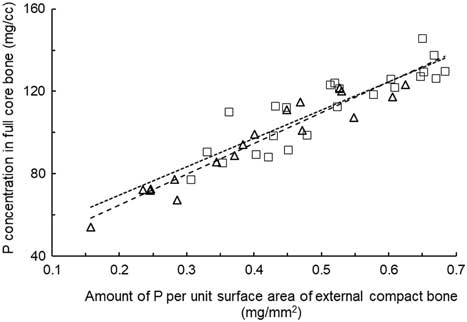
FC-Pconc was correlated with CBText and there was a closer relationship in growing steers (r=0.93 and 0.92) than in mature cows (r=0.80) (Figure 2), and there were differences in slope and elevation of the regression relationships among the three experiments. When the results were pooled the FC-Pconc was predicted from CBText with r=0.87 and RSD=11.2 mg P/cc (Figure 2; equation (12)). The PSACB provided an improved prediction of the FC-Pconc in both the steers (r=0.96; RSD=6.3) and in the mature cows (r=0.88, RSD 8.8) (Figure 3). These regression relationships did not differ (P>0.05) and when the data were pooled FC-Pconc was predicted with r=0.93 and RSD=7.7 mg P/cc FC bone (equation (13)). Thus the PSACB index provided a better predictor than CBText of the FC-Pconc. PSACB, and thus FC-Pconc, could be calculated from measurements of SG of CBext and CBText as follows:
 $${\rm PSACB \,{\equals}\, }\left( {\left( {{\rm 228}{\rm .8{\times}CB}_{{{\rm ext}}} {\rm {\minus}SG}} \right){\rm - 261}} \right){\times}{\rm CBT}_{{{\rm ext}}} {\rm )/1000}$$
The relationships between the concentration of P in the full-core rib bone (FC-Pconc) (mg P/cc) and the external cortical bone thickness (mm) in cattle in Experiments 1 (○), 2 (∆) and 3 (□). The regression relationships were as follows:
 $${\rm Experiment \,1\!:\, \,FC{\hbox -}P}_{{{\rm conc}}} {\rm \,{\equals}\, 13}{\rm .6{\plus}33}{\rm .9{\times} CBT}_{{{\rm ext}}} \,\left( {n{\rm \,{\equals}\,31\comma }\, r{\rm \,{\equals}\,0}{\rm .93\comma \,RSD \,{\equals}\, 8}{\rm .8}} \right)\,{\rm }\left( \!{{\rm {\minus}{\minus}{\minus}{\minus}{\minus}{\minus}}} \right\!)\quad \,\,\,(9)$$
 $${\rm Experiment \,2\!: \, \,FC{\hbox -}P}_{{{\rm conc}}} {\rm \,{\equals}\, 26}{\rm .2{\plus}24}{\rm .4{\times}CBT}_{{{\rm ext}}} \,\left( {n{\rm \,{\equals}\,18\comma }\, r{\rm \,{\equals}\,0}{\rm .92\comma \,RSD \,{\equals}\, 8}{\rm .7}} \right)\,{\rm }\left( \!{{\rm {\minus} {\minus} {\minus} {\minus}}} \right\!)\quad\quad \,\,\,(10)$$
 $${\rm Experiment \,3\!: \, \,FC{\hbox -}P}_{{{\rm conc}}} {\rm \,{\equals}\, 49}{\rm .4{\plus}20}{\rm .1{\times}CBT}_{{{\rm ext}}} \,\left( {n{\rm \,{\equals}\,24\comma }\, r{\rm \,{\equals}\,0}{\rm .80\comma \,RSD \,{\equals}\, 11}{\rm .1}} \right){\rm }\,\left(\! {^{{{\rm \,\ldots\!\!\ldots\!\!\ldots}}} } \right\!)\quad\quad \,\,\,\,(11)$$
The slope of Experiment 1 equation was greater (P<0.01) than the slopes for Experiment 2 and for Experiment 3 (P<0.05) equations, and the slopes for Experiment 2 and 3 were not different (P>0.05). A single regression relationship fitted to all of the data was as follows:
 $${\rm Experiment \,1 \,to \,3\!: \, \,FC{\hbox -}P}_{{{\rm conc}}} {\rm \,{\equals}\, 30}{\rm .5{\plus}25}{\rm .6{\times}CBT}_{{{\rm ext}}} \left \, ( {n{\rm \,{\equals}\,73\comma \,}\, r{\rm \,{\equals}\,0}{\rm .87\comma \,RSD \,{\equals}\, 11}{\rm .2}} \right)\quad\quad\quad\quad (12)$$

The relationship between the concentration of P in the full-core rib bone (FC-Pconc) (mg P/cc) and the amount of P per unit surface area of external cortical bone (mg P/mm2) (PSACB) in cattle in Experiment 2 (∆) (- - - -) (n=18) and Experiment 3 (□) (……..) (n=24). PSACB was calculated as the product of the external CB thickness and the P concentration in external cortical bone. The two relationships did not differ in slope or elevation (P>0.05). The relationship for the combined data was as follows:
 $${\rm FC{\hbox -}P}_{{{\rm conc}}} {\rm \,{\equals}\, 37}{\rm .0{\plus}146{\times}PSACB }\left( {n{\rm \,{\equals}\,42\,; \, }r{\rm \,{\equals}\,0}{\rm .94\,; \, RSD \,{\equals}\, 7}{\rm .7}} \right)\quad\quad \quad\,(13)$$

Neither SG nor the concentrations of ash and P in CBext or CBint were closely correlated with the same attributes in the FC bone fraction indicating that these measurements could not be used to estimate the FC-Pconc. The CBText and the CBTint were correlated (r=0.96, RSD=0.22 and r=0.88, RSD=0.35 in Experiments 2 and 3, respectively), and CBTint was on average 0.85 of CBText.
Discussion
Use of rib bone biopsy measurements to estimate skeletal minerals
An assumption in using rib bone biopsies to estimate changes in skeletal minerals is that the changes in rib bone are representative of the changes in the entire skeleton. Estimation of total skeletal P is complicated by the difficulty that the mobilization of bone minerals varies widely among individual bones. Slaughter studies have shown that net mobilization of bone mineral is substantially greater from the axial skeleton (particularly the skull and mandible) than from the appendicular skeleton (Benzie et al., Reference Benzie, Boyne, Dalgarno, Duckworth, Hill and Walker1959; Hill, Reference Hill1962; McRoberts et al., Reference Quigley, Poppi and Schatz1965). Presumably such differences among bones also occur during replenishment of skeletal minerals. However, the proportional loss of Ca and P from the rib bones appears to be similar to that from the entire skeleton (Benzie et al., Reference Benzie, Boyne, Dalgarno, Duckworth and Hill1955; Little, Reference Little1983). In the former study, during severe Ca deficiency through pregnancy and lactation in ewes, the loss of minerals from the entire skeleton (19%) was similar to the loss from the 11th and 12th rib bones (15%), while the losses from the skull and limb bones were 25% and 11%, respectively. For this reason, and also because rib biopsy requires simple and less invasive surgery, the changes in rib bone have been widely used to estimate changes in the skeletal P reserves of cattle and sheep.
The changes in bone due to severe diet P deficiency are likely to differ between mature and growing cattle. In mature cows undergoing osteoporosis the loss of bone mineral, including from rib bones, has been associated primarily with thinning of cortical bone which is replaced with trabecular bone and also resorption of trabecular bone, but little change in the P concentration of the remaining cortical bone (Shupe et al., Reference Shupe, Butcher, Call, Olson and Blake1988; Dixon et al., Reference Dixon, Coates, Mayer and Miller2016 and Reference Dixon, Kidd, Coates, Anderson, Benvenutti, Fletcher and McNeill2017; Coates et al., Reference Coates, Dixon, Murray, Mayer and Miller2018). Thinning of the cortical bone in limb bones has also been observed in other studies in cattle (Shupe et al., Reference Shupe, Butcher, Call, Olson and Blake1988; Williams et al., Reference Williams, Lawrence, McDowell, Wilkinson, Ferguson and Warnick1991) and sheep (Breves and Prokop, Reference Breves and Prokop1990). In contrast, the changes during osteomalacia in growing cattle usually involve reductions in both the thickness and the mineral concentrations of the cortical bone although the changes in thickness are usually greater than the changes in P concentration. In Experiment 2 of the present study P deficiency reduced CBText in 1.5 and 2.5-year-old steers by 33% and 38%, respectively, but reduced the CBext-P concentration by only 16% and 10%, respectively. These changes explain why the change in CBText may provide a measure of the overall change in P status of the animal (Little, Reference Little1984) and are in accord with the observations in the mature cows in Experiment 3 and by Dixon et al. (Reference Dixon, Coates, Mayer and Miller2016), where the principal change in rib bone due to the severe P deficiency was to decrease CBText rather than P concentration. These studies are in accord with the poor relationship (r=0.69) in steers, and the absence of a relationship (P>0.05) in mature cows, in the present study between CBext-Pconc and FC-Pconc and indicate that the CBext-Pconc alone is of little value to estimate the P status of cattle.
The results of the present study, showing that FC-Pconc can be predicted more accurately from the PSACB than from CBText, are most obviously because the PSACB encompasses changes in both the CBText and CBext-Pconc. With osteoporosis induced by P deficiency, where the principal change is in CBText rather than in CBext-Pconc, the errors associated with estimation of FC-Pconc from either CBText or from the PSACB are likely to be similar. The advantage of the PSACB to estimate FC-Pconc will be primarily to measure changes during osteomalacia when both CBText and CBP-conc are changing. Thus, PSACB has the advantage of being a more general indicator and the RSD values in Figures 2 and 3 indicated that the prediction error was ~30% lower when the PSACB rather than the CBText was used to estimate the FC-Pconc.
A number of considerations suggest that the PSACB index will have limitations to estimate the P concentration of the cross-section of the rib, the P concentration of the entire rib, and amount of P in the skeleton. First, if the disc of external cortical bone includes the midline of the rib then the thickest part of the sample should represent the midline of the rib. However, error will be introduced if the CBText or the CBext-Pconc changes inconsistently among animals between the midline of the rib and the edge of the rib. Also the external cortical bone P cannot be expected to comprise a constant proportion of the P in the rib bone as the proportion of trabecular bone in the rib bone will increase as the cortical bone thickness decreases during P deficiency. Trabecular bone comprises the majority of the bone volume in very P deficient animals but only a small proportion of the bone volume in P adequate cattle (Shupe et al., Reference Shupe, Butcher, Call, Olson and Blake1988). Second, differences among individual animals, and also differences associated with age, gender and breed of animals in the width and shape of the rib may introduce error in the estimation of the P in the rib cross-section and in the skeleton from PSACB.
Use of specific gravity and ash concentration to calculate the P concentration of rib bone biopsy samples
The close regression relationships between the P concentration and SG or ash concentration in the various bone fractions in the present study (Figure 1) indicated that measurements of ash concentration or SG could satisfactorily estimate the P concentration. However, when these equations were applied to the results from previous studies (Little and Minson, Reference Little and Minson1977; Read et al., Reference Read, Engels and Smith1986) there were sometimes substantial differences between the predicted P concentrations and the reported values obtained by chemical analysis. Therefore, either the regression relationships calculated in the present study are not appropriate for all circumstances or there were substantial between-laboratory differences in the measurement of P, SG and/or ash concentration. Consequently it is recommended that the regression relationships derived in the present study should not be used generally for new sample sets without appropriate validation.
Threshold values for full-core P concentration of cattle in adequate or deficient P status
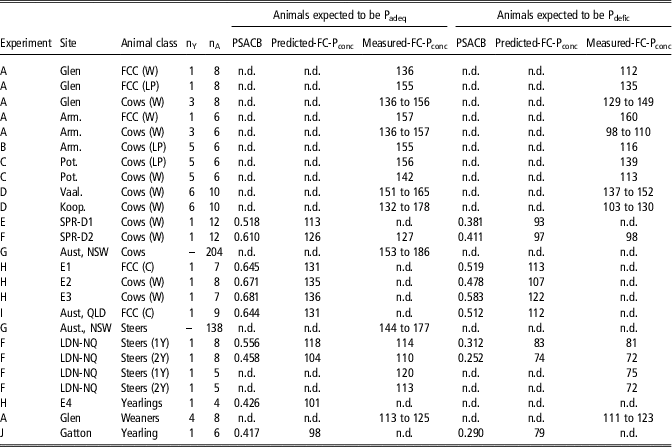
Studies with cattle were collated to examine the reported ranges in FC-Pconc (Table 3) in experiments where the cattle were expected to be in either adequate or deficient P status when the FC-Pconc samples were obtained. In mature breeder cows and first-calf cows expected to be in Padeq status the FC-Pconc was generally in the range of 130 to 170 mg/cc (PSACB 0.64 to 0.91) and 130 to 155 mg/cc (PSACB 0.64 to 0.81), respectively, with values usually lower at weaning than in late pregnancy. Studies (Read et al., Reference Read, Engels and Smith1986; Spangenberg, Reference Spangenberg1997; Dixon et al., Reference Dixon, Kidd, Coates, Anderson, Benvenutti, Fletcher and McNeill2017) have reported mobilization of skeletal P during early lactation even when diets are expected to be adequate in P. It is also consistent with reports of obligatory skeletal P mobilization in ruminants in early lactation (Anderson et al., 2017). In young cattle such as recently weaned calves or yearlings the FC-Pconc was usually in the range 100 to 120 mg/cc (PSACB 0.42 to 0.57) indicating that the FC-Pconc generally increases with maturity in Padeq cattle. It is likely that some of the variation in the ranges cited above and between experiments was due to the cattle not being in a fully replete P status or not in a severely Pdefic status when the measurements were obtained but the reported information was often inadequate to establish definitively the P status of the animals. Nevertheless cognizance of the effects of physiological state and age is clearly needed in the interpretation of FC-Pconc as an indicator of P status. A further consideration is that there is wide variability in CBText, and thus likely in FC-Pconc, among individual animals in similar P status (Dixon et al., Reference Dixon, Kidd, Coates, Anderson, Benvenutti, Fletcher and McNeill2017). This suggests that caution is needed in the use of threshold FC-Pconc ranges and evaluation is likely to be limited to a group rather than an individual animal basis.
Measured and predicted concentration of P in full-core rib bone biopsy samples (FC-Pconc) (mg P/cc) and measured P per unit surface area of external cortical bone (PSACB) in experiments with beef breed first-calf cows (FCC), mature cows, or steers, in a series of experiments

Padeq=phosphorus adequate; Pdefic=phosphorus deficient; n.d.=not determined; nY=number of years of experimental measurements; nA=number of animals in each treatment group in each year; FCC=first-calf cow; LP=late pregnancy; C=parturition; W=weaning.
Experiments: Experiments A to G were with grazing cattle, H to J with animals fed individually in pens. A – Read et al. (Reference Read, Engels and Smith1986) at the Glen and Armoedsvlakte sites in South Africa; B – de Waal and Koekemoer (Reference de Waal and Koekemoer1997) at Armoedsvlakte site in South Africa; C – de Brouwer et al. (Reference de Brouwer, Cilliers, Vermaak, van der Merwe and Groenewald2000) at Potchefstroom site in South Africa; D – Spangenberg (Reference Spangenberg1997) at the Vaalharts and Koopmansfontein and sites in South Africa; E – Dixon et al. (Reference Dixon, Coates, Mayer and Miller2016) at Springmount, Mareeba, northern Australia; F – Coates et al. (Reference Coates, Dixon, Murray, Mayer and Miller2018) at Springmount, Mareeba and at Lansdown, Townsville, northern Australia; G – Holst et al. (Reference Holst, Murison and Wadsworth2002) from a survey of mature cattle in semi-arid NSW, Australia (it was assumed from the results in the present study that rib bone ash contained 159 mg P/g); H –Dixon, unpublished results from four experiments in pen-fed animals at Gayndah, QLD, Australia; I – Castells et al. (Reference Castells, Dixon, Kidd, Goodwin, Mayer, Fletcher and McNeill2015) in pen-fed animals; J – Quigley et al. (Reference McRoberts, Hill and Dalgarno2015). Growing steers fed in pens at Gatton, QLD, Australia.
PSACB was predicted using equation (13) given in the Figure 3 caption.
The studies collated in Table 3 also provide estimates of the likely FC-Pconc of Pdefic cattle although again caution in evaluation of the data is needed. The magnitude of the P deficiency and extent to which animals were in low P status can in most case only be inferred from the experimental protocols and the other measured physiological responses of the animals. The decrease in the FC-Pconc due to extended P deficiency in breeder cows generally ranged from ~10% where there was likely only a minor deficit in diet P intake (Read et al. (Reference Read, Engels and Smith1986) at the Glen site; Spangenberg (Reference Spangenberg1997) at the Vaalharts site; de Waal and Koekemoer (Reference de Waal and Koekemoer1997) at the Potchefstroom site), but up to ~30% in pregnant or lactating cows (Read et al. (Reference Read, Engels and Smith1986) at the Armoedsvlakte site; Spangenberg (Reference Spangenberg1997) at the Koopmansfontein site; Dixon et al. (Reference Dixon, Coates, Mayer and Miller2016) at the Springmount site) where there was severe P deficiency. These compare with the decreases of 30% to 40% in the severely Pdefic growing steers in Experiments 1 and 2 of the present study. Read et al. (Reference Read, Engels and Smith1986) reported that the FC-Pconc in suckling calves was not affected by P deficiency in their dams. This is in accord with reports that there is only a small decrease in the concentration of P in milk of Pdefic cows even though milk output may be severely reduced (Valk et al., Reference Valk, Sebek and Beynen2002; Dixon et al., Reference Dixon, Kidd, Coates, Anderson, Benvenutti, Fletcher and McNeill2017).
Conclusions
The PSACB index is more reliable than measurements of either CBText or CB-Pconc alone to estimate the FC-Pconc of rib bone from biopsy samples of the external cortical bone and obviates the need for full-core biopsy samples. It also allows comparisons among experiments which have utilized the two differing biopsy procedures and thus enhances the evaluation of the P status of cattle between experiments. However, caution is needed in interpretation of these measurements given the paucity of rigorous studies to determine the PSACB or FC-Pconc in Padeq or Pdefic cattle in various physiological states, and also the high variability among individual animals. Nevertheless, the changes in PSACB or FC-Pconc in sequential samples should provide valuable estimates of the changes in bone P status of cattle.
Acknowledgments
The authors thank Michael Breen, Jennifer Stanford and Ray Le Feuvre for valuable technical assistance. The experiments which provided the data for this study received funding support from the Meat Research Corporation, Australia.
Declaration of interest
All authors declare no conflict of interest and nor competing interest.
Ethics statement
The animal experimentation was carried out according to the code of practice for the care and use of animals for scientific purposes and with the approval of the relevant Animal Ethics Committees operating at the time the experiments were conducted.
Software and data repository resources
The data are not deposited in an official repository.